
 Open Access Article
 This Open Access Article is licensed under a Creative Commons Attribution-Non Commercial 3.0 Unported Licence
Enhancing the temperature sensing property of a Ca0.79−xBixEr0.01Yb0.2MoO4 phosphor via local symmetry distortion and reduction in non-radiative channels
Sachin Singh,
Santosh Kachhap,
Manisha Sharma and
Sunil Kumar Singh*
Department of Physics, Indian Institute of Technology (Banaras Hindu University), Varanasi-221005, India. E-mail: sunilks.app@iitbhu.ac.in
First published on 16th May 2023
Abstract
We demonstrate an enhancement in the upconversion (UC) emission and temperature sensing property of a CaMoO4:Er/Yb phosphor via distortion of the local symmetry environments and reduction in no-radiative channels. Bi3+ ion co-doping creates a local distortion while the average tetragonal structure of CaMoO4 remains intact. This creates asymmetry around the Er3+ ions which improves the UC emission. Furthermore, our calculations on XRD data show a reduction in the dislocation density and the micro-strain in the crystal with the introduction of Bi3+, which also favours the enhancement of UC emission as it reduces the non-radiative channels. Furthermore, the effect of this enhancement on the temperature sensing property of Er3+ ion has also been revealed. Our results show that the UC emission is enhanced about 25 times for Bi3+ co-doped samples which improves the temperature sensitivity significantly. The samples, both with and without Bi3+ co-doping, exhibited relative sensitivities of 0.0068 K−1 at 300 K and 0.0057 K−1 at 298 K which is a significant improvement and indicates the potential of the material for temperature sensing applications. This proof-of-concept provides a deeper understanding of the effect of Bi3+ doping on UC emission and opens new avenues for the development of high-performance temperature sensing materials.
1. Introduction
Optical devices rely on various optical parameters such as Rayleigh and Raman scattering, spectral transmission, radiative losses, magneto-optic methods, reflectance, and polarization-based changes, etc. However, as far as the temperature sensing based optical devices are concerned, they have been established mainly either through the monitoring of changes in optical emission signals, such as fluorescence intensity ratio (FIR), or through a change in fluorescence lifetime (FL) with a variation in temperature.1 Both these techniques are unique in the sense that they are free from the source intensity. Herein, the FIR-based temperature sensing is preferred over the FL method due to its better performance. Recently, Rai et al. reported in detail that the FIR-based temperature sensing is better than the FL method.2The FIR technique is based on the changes in emission intensity coming from a pair of thermally-coupled energy levels (TCELs) of an activator, with the typical energy gap lying in the range 200 and 2000 cm−1.3–5 Whereas, the FL based technique is related to variations in the life-time of the transitions originating from the TCELs. Among different lanthanides useful for temperature sensing application (e.g. Er3+, Tm3+, Nd3+, Eu3+, and Ho3+), Er3+ has been widely used as an activator for FIR studies6–9 because of its suitable TCELs (2H11/2 and 4S3/2) of energy difference (∼350–700 cm−1).10 However, since the quantum yield of lanthanide based upconversion emission is low, therefore, a lot of effort is still being devoted to enhance the upconversion (UC) emission at the first step and eventually enhance the sensing ability of the lanthanides thereof.
In this context, researchers have focused attentions on enhancing the efficiency of UC materials by using external and internal modifications both such as core–shell synthesis of materials, co-doping of lanthanides/non-lanthanide ions, surface plasmon resonance (SPR) based enhancement, and by alteration of the crystal structure, etc.11–13 Even for a particular phase, its chemical composition, dimension of the particle (size and shape), surface morphology, site-symmetry around the activator ion, etc., also play an important role in the enhancement of the UC emission intensity.14–22 Particularly, the site symmetry of Ln3+ doped phosphors may critically affect the UC/DS luminescence as the electronic energy levels and excited-state dynamics of the doped Ln3+ ions may change significantly with a slight change in the local site symmetry.23–25
Ln3+-doped disordered crystals (such as molybdates, fluorides, tungstates, garnets, etc.) are most common examples for the breakdown of crystallographic site symmetry under doping of non-lanthanide ions.26,27 Their luminescence properties have been improved by co-doping with specific ions.28–32 For example, Wisser et al. introduced the local symmetry distortion in Er/Yb: NaYF4 nanocrystals (via substituting Gd3+ and Lu3+ at Y3+) which leads to an increase in radiative transition rates of Er3+ ions.33 Similarly, Zhu et al. observed the synergistic effect of the doping of trace alkali metal ions (Li+, K+, Na+) in K2LiAlF6:Mn4+.34 Wang et al. also studied the effect of site symmetry for the Eu3+ ions doped in NaLu(WO4)2. Wang et al. reported that the doping of Sc3+ in Er3+/Yb3+:Y2O3 manipulates the lattice site symmetry and enhances the radiative emission of Er3+.35
Similarly, there are numerous reports for creating local site symmetry distortion using Bi3+ ion as co-dopant also.36,37 Bi3+ ion was used as a co-dopant to create local site symmetry distortion in the Y2O3:Eu3+ phosphor, resulting in enhanced luminescence properties. The authors attributed this enhancement to the increased crystal field splitting and improved energy transfer efficiency between Eu3+ and Bi3+ ions.36 Xue et al. investigated the effect of Bi3+ ion co-doping on the photoluminescence and thermal stability of perovskite-type CsPbBr3 nanocrystals. The authors found that the Bi3+ ion co-doping enhanced the luminescence properties of the nanocrystals and improved their thermal stability by reducing the defect density and passivating the surface traps. The results suggest the potential use of Bi3+ ion co-doping as a strategy to improve the stability and performance of perovskite-type nanocrystals for optoelectronic applications.37
Considering above research findings and with the aim of enhancing the luminescence intensity and temperature sensing property of Er3+ ions, this paper explores the co-doping of Bi3+ in Er3+/Yb3+:CaMoO4 phosphor. We have analyzed the site symmetry and optical properties of two samples in detail, one without Bi3+ co-doping (Ca0.79Er0.01Yb0.2MoO4) and the other with optimized Bi3+ co-doping (Ca0.68Bi0.11Er0.01Yb0.2MoO4). Our results show that the UC emission intensity is enhanced about 25 times which improves the temperature sensitivity significantly. Conclusively, the study provides insight into the potential of Bi3+ co-doping for improving the performance of Er3+/Yb3+ co-doped CaMoO4 as a temperature sensor in FIR based applications.
2. Materials and methods
2.1 Materials
To introduce Ca2+ ions, calcium oxide (CaO) (Alfa Aesar, 97%) was utilized, while ammonium molybdate ((NH4)6Mo7O24·4H2O, 99.0%) (AR) served as sources of Mo6+ ions. Urea (NH2CONH2) (Fisher Scientific) was used as a fuel. The dopant ions Er3+, Bi3+, and Yb3+ were introduced through the use of erbium(III) oxide (Er2O3, 99.9%, REO, Alfa Aesar), bismuth(III) oxide (Bi2O3, 99.99%, REO, Alfa Aesar), and ytterbium(III) oxide (Yb2O3, 99.99%, REO, Alfa Aesar), respectively. To make the nitrate solution of the precursors, nitric acid (HNO3, 69%, Merck) is used. Cleaning was carried out using propane-2-ol ((CH3)2CHOH, 99.0%, Thermo Fisher Scientific), and acetone (CH3COCH3, 99.0%, Merck), while double-distilled water was utilized as an intermediate additive.2.2 Synthesis
The gel-combustion method was utilized to synthesize the series of stoichiometric Ca0.79−xBixEr0.01Yb0.2MoO4 (x = 0.00, 0.02, 0.05, 0.08, 0.11, and 0.14) phosphors.10 For the synthesis of Ca0.79Er0.01Yb0.2MoO4, 3.5 mmol of CaO precursor was placed in a beaker, and required amount of nitric acid was added to it drop-wise with continuous stirring of 200 rpm on a hot plate maintained at 100 °C until a transparent nitrate solution was obtained. The nitrate solution of Er2O3, and Yb2O3 are formed by the similar steps by taking the amount, respectively of 0.02 mmol and 0.44 mmol in HNO3. In a separate beaker, 0.63 mmol of (NH4)6Mo7O24·4H2O was dissolved in 30 ml DI water at 30 °C. 1.5 mg of urea that act as a fuel in combustion reaction was added into it, and the temperature was raised to 100 °C. Then, all the individually prepared solutions were mixed in a beaker and kept on a hot plate maintained at 210 °C with continuous stirring of 200 rpm until the solution became gel-like. Then, the temperature of the solution was raised to 450 °C, for the combustion reaction. Within 1 minute, auto-ignition took place, resulting a foam-like porous product. The series of Bi-doped Ca0.79−xBixEr0.01Yb0.2MoO4 (x = 0.02, 0.05, 0.08, 0.11, and 0.14) samples were obtained by taking additional required molar amount of Bi2O3 following the above-mentioned steps. The final foam-like product of all the series is then ground using agate mortar to obtain a powder for further characterizations. The samples are further calcined at 900 °C for improving the optical behaviour.2.3 Characterization techniques
The study utilized various techniques to analyse the powder samples, including X-ray diffraction (XRD) using a Rigaku-MiniFlex-II DESKTOP X-ray diffractometer with a Cu-Kα radiation source at 30 kV and 15 mA, infrared (IR) spectroscopy using a FT/IR 4600 spectrophotometer (JASCO) at room temperature, field-emission scanning electron microscopy (FE-SEM) (Nova Nano SEM 450, USA) to determine particle size and surface morphology, photoluminescence spectroscopy using a Fluorolog-3 spectrophotometer (HORIBA Jobin Yvon), and temperature-dependent UC emission measurements using a handmade heater with a k-type thermocouple and a continuous-wave (CW) 980 nm tunable power diode laser (model: ADR 1805, class IV) with a maximum power of 2 W. Samples CMEY (Ca0.79Er0.01Yb0.2MoO4) and CMBEY (Ca0.68Bi0.11Er0.01Yb0.2MoO4) were used for the comparative studies of various properties. The operating laser power and integration time of spectrometer during the scan from 500 to 575 nm were kept low at 24 mW and 10 ms, respectively to minimize laser-induced heating effects.3. Results and discussion
3.1 X-ray diffraction measurement
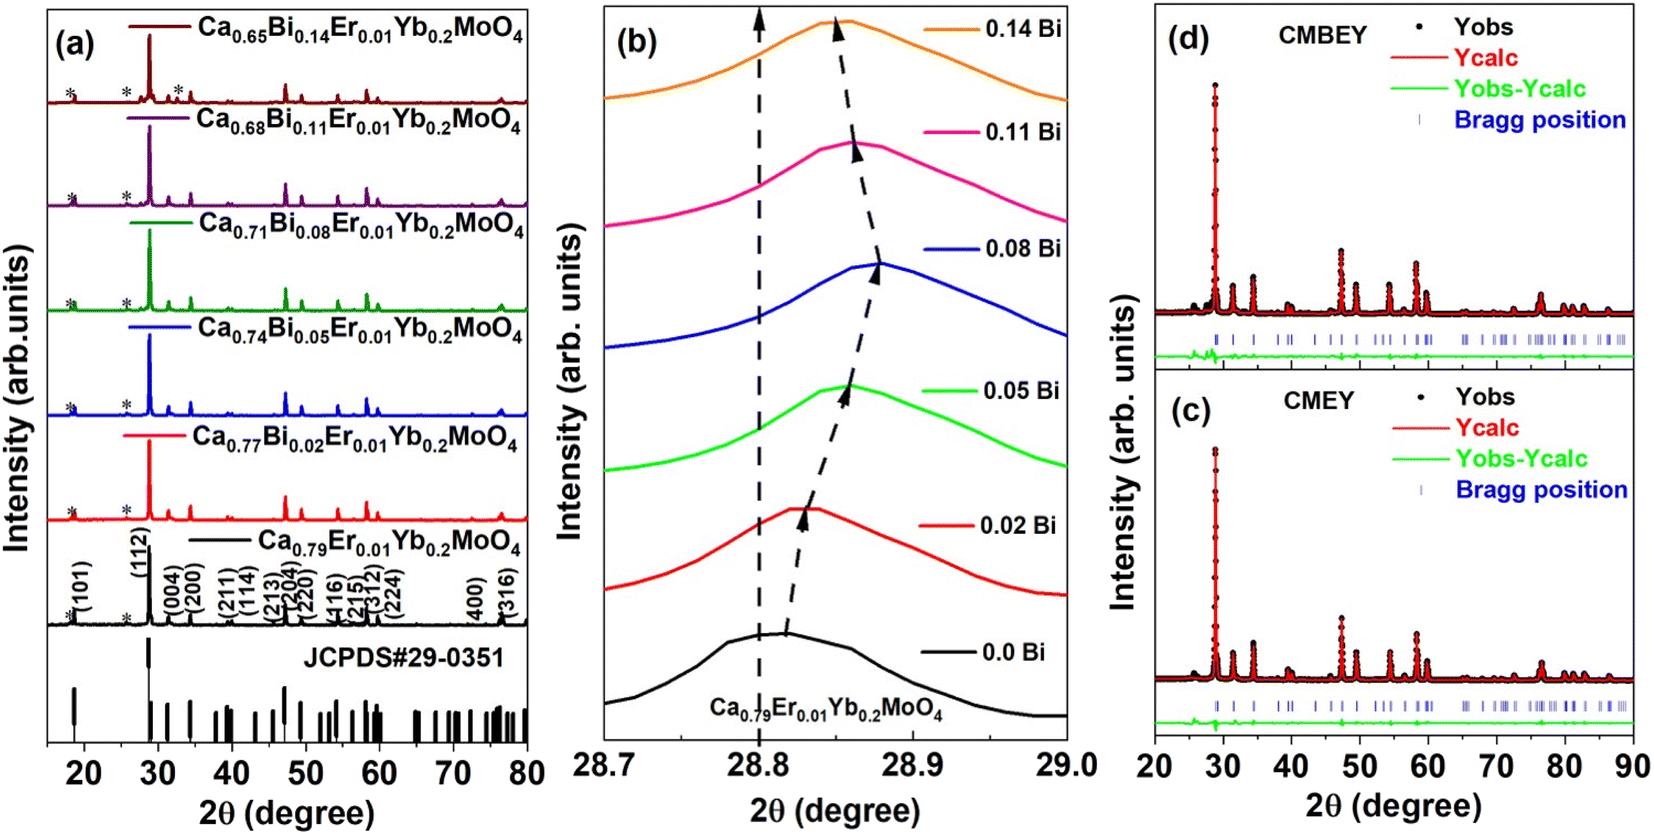 | ||
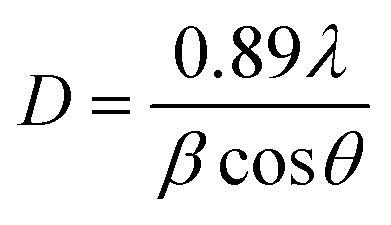
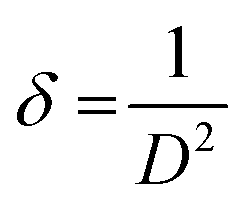
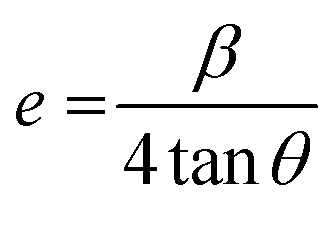
| Fig. 1 (a) XRD patterns of Ca0.79−xBixEr0.01Yb0.2MoO4 (x = 0.00, 0.02, 0.05, 0.08, 0.11, and 0.14) powder samples. (b) Expanded XRD patterns of Ca0.79−xBixEr0.01Yb0.2MoO4 (x = 0.0, 0.02, 0.05, 0.08, 0.11, and 0.14) powder samples between 2θ angle 28.7 to 29.0°. Rietveld refined XRD patterns of (c) Ca0.79Er0.01Yb0.2MoO4, and (d) Ca0.68Bi0.11Er0.01Yb0.2MoO4 powder samples. | ||
The Debye–Scherrer formula was used to find the average crystallite size of Ca0.79Er0.01Yb0.2MoO4 and Ca0.68Bi0.11Er0.01Yb0.2MoO4 samples, given in eqn (1).
 | (1) |
 | (2) |
Similarly, the effect of Bi doping on the distortion of lattice structure was also calculated by using the following relation;
 | (3) |
| Structure parameter | Ca0.79Er0.01Yb0.2MoO4 | Ca0.68Bi0.11Er0.01Yb0.2MoO4 |
|---|---|---|
| Structure | Tetragonal | Tetragonal |
| Space group | I41/a (88) | I41/a (88) |
| a = b (Å) | 5.20659 ± 0.00004 | 5.21165 ± 0.00004 |
| c (Å) | 11.36893 ± 0.00014 | 11.38972 ± 0.00019 |
| α = β = γ (°) | 90 | 90 |
| Volume (Å3) | 308.196 ± 0.005 | 309.359 ± 0.006 |
| Density (g cm−3) | 6.878 | 6.562 |
| Rp | 4.47 | 5.56 |
| Rwp | 7.27 | 9.15 |
| Rexp | 2.24 | 2.41 |
| χ2 | 10.5 | 14.4 |
The results of the Rietveld refinement show that the structure and phase of the undoped and Bi-doped Ca0.68Bi0.11Er0.01Yb0.2MoO4 are the same. The lattice parameters of the Ca0.79Er0.01Yb0.2MoO4 powder sample are a = b = 5.206(59) Å, c = 11.368(93) Å, α = β = γ = 90°. The volume of the structure is 308.19(6) Å3, and the density obtained is 6.878 g cm−3. In contrast, the lattice parameters are increased in the Bi-doped optimized Ca0.68Bi0.11Er0.01Yb0.2MoO4 powder sample, with a = b = 5.211(65) Å and c = 11.389(72) Å. This is in good agreement with the doping of a higher ionic radius Bi-ion in place of the Ca-site. The doping of Bi-ion increases the volume of the structure and lowers the density compared to the undoped one. The volume and density are 309.35(9) Å3, and 6.562 g cm−3, respectively. The coordination number of Ca-atom is 8, bonded with the neighbouring O-atoms, and form CaO8 polyhedra unit. Mo-atom shows coordination number 4 with nearby four O-atoms and results the formation of MoO4 tetrahedral structure. In CaO8 unit, four different bond lengths of the Mo-atom with O-atoms are present, and in MoO4 unit, only one type of bond length of Ca-atom with O-atoms is present (as indicated in Fig. 2(a) and (b)). There bonds of the Ca0.79Er0.01Yb0.2MoO4 and Bi-doped Ca0.68Bi0.11Er0.01Yb0.2MoO4 tetragonal structure with space group I41/a are listed in Table 2.10 Similarly, some of the bond angles formed among the Ca, Mo, and O-atoms are also summarized in Table 2.
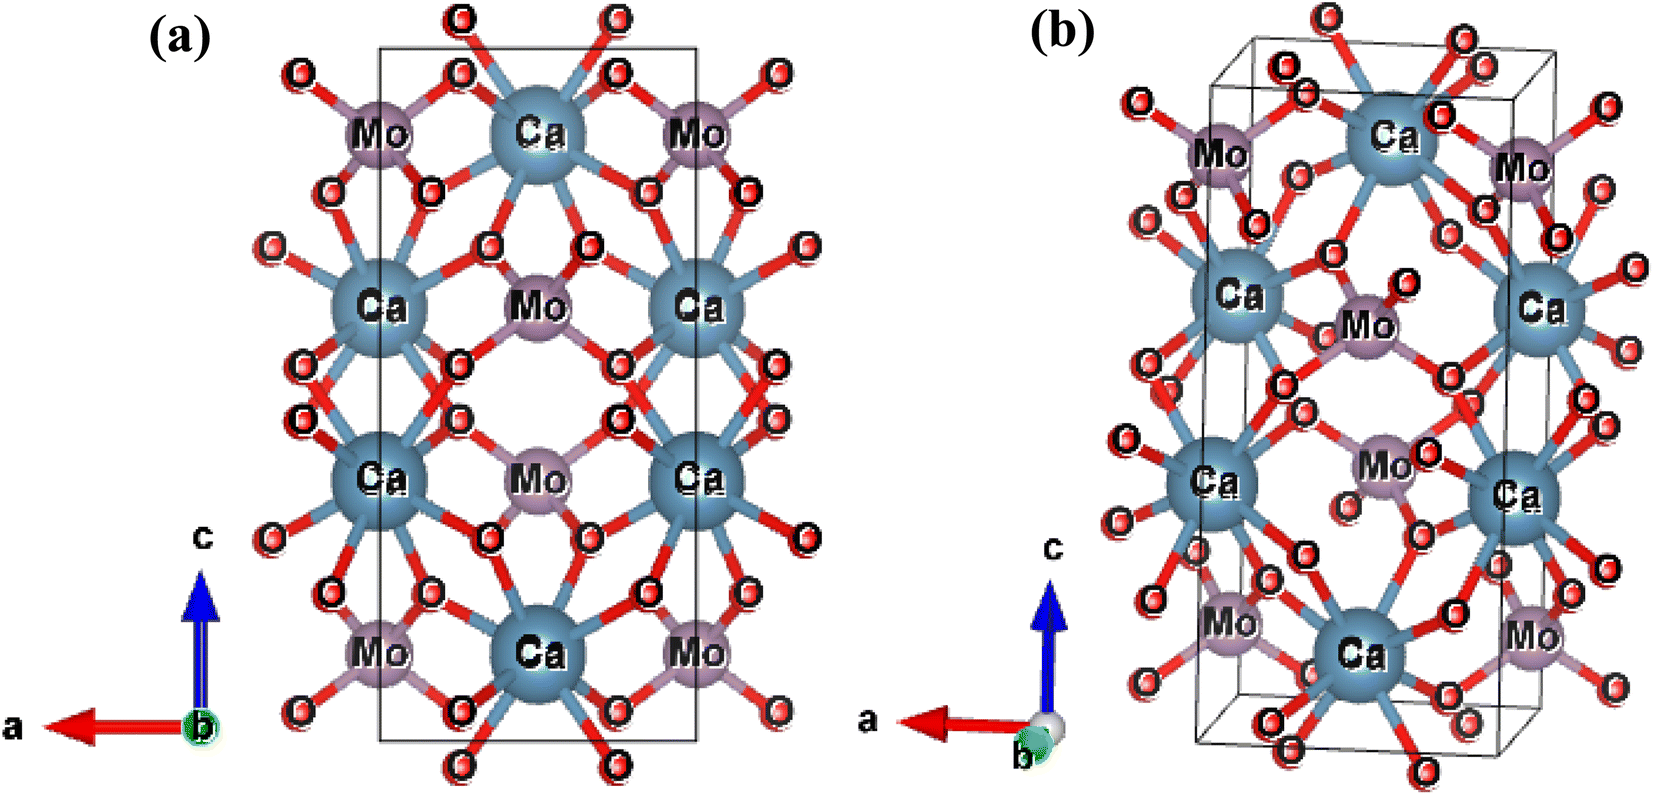 | ||
| Fig. 2 Tetragonal crystal structure of Ca0.79Er0.01Yb0.2MoO4 in two different orientation obtained after Rietveld refinement of the XRD patterns. | ||
| Bonding atoms | Ca0.79Er0.01Yb0.2MoO4 | Ca0.68Bi0.11Er0.01Yb0.2MoO4 |
|---|---|---|
| Bond length (Å) | Bond length (Å) | |
| Ca1–O1, O5 | 2.39086(0) | 2.39902(0) |
| Ca1–O2, O6 | 2.41854(0) | 2.42656(0) |
| Ca1–O3, O7 | 2.38182(3) | 2.38770(3) |
| Ca1–O4, O8 | 2.43470(3) | 2.44077(3) |
| Mo–O1, O9, O10, O11 | 1.83473(0) | 1.82896(0) |
![[thin space (1/6-em)]](https://www.rsc.org/images/entities/char_2009.gif) |
||
| Bonding atoms | Bond angle (°) | Bond angle (°) |
| Ca1–O1–Ca3 | 107.1402(5) | 105.7841(5) |
| Ca1–O8–Ca3 | 107.1402(5) | 106.5917(5) |
| Ca1–O6–Ca2 | 106.8159(5) | 105.7841(5) |
| Ca1–O7–Ca2 | 105.7055(5) | 106.9151(5) |
| Ca1–O1–Mo1 | 120.6542(8) | 120.7090(8) |
| Ca1–O7–Mo2 | 130.0464(4) | 130.3818(4) |
| Mo1–O1–Ca3 | 130.1155(4) | 130.3818(4) |
The increased lattice parameter in optimized Ca0.68Bi0.11Er0.01Yb0.2MoO4 is also observed by the bond length and bonding angle, with larger bond lengths (except M–O bonds) and Ca–O–Ca bonding angle shrinking compared to the undoped sample. In contrast, the Ca–O–Mo bonding angle increases, in agreement with the increased lattice parameters of the crystal structure in Bi-doped Ca0.68Bi0.11Er0.01Yb0.2MoO4. Thus, the Bi3+ ions incorporation at the Ca2+ ions site in the crystal lattice expands the unit cell. The expansion of the crystal structure is observed by the bond length and bond angle change in the Bi3+ doped sample also, obtained by the Rietveld refinement. These changes result a slight distortion of the local environment around the substituted sites where lanthanides are also doped. The CaO8 polyhedral unit distortion (D) in the crystal structure of Ca0.79Er0.01Yb0.2MoO4 and Ca0.68Bi0.11Er0.01Yb0.2MoO4 are calculated using the following equation.41
 | (4) |
3.2 SEM and EDS measurements: surface morphology and elemental analysis
The surface morphologies of Ca0.79Er0.01Yb0.2MoO4 (CMEY) and Ca0.68Bi0.11Er0.01Yb0.2MoO4 (CMBEY) samples annealed at 900 °C were analysed using field emission scanning electron microscopy (FESEM) as shown in Fig. 3(a) and (b). Images illustrate the presence of irregular and non-uniform aggregated particles, with the average particle size of about 1.982 μm and 3.230 μm, respectively for CMEY and CMBEY samples. The increase in particle size is attributed to Bi3+ doping.40 The spherical particles of the phosphor were found to agglomerate in different orientations which is the characteristic property with combustion synthesized oxide phosphors.8–10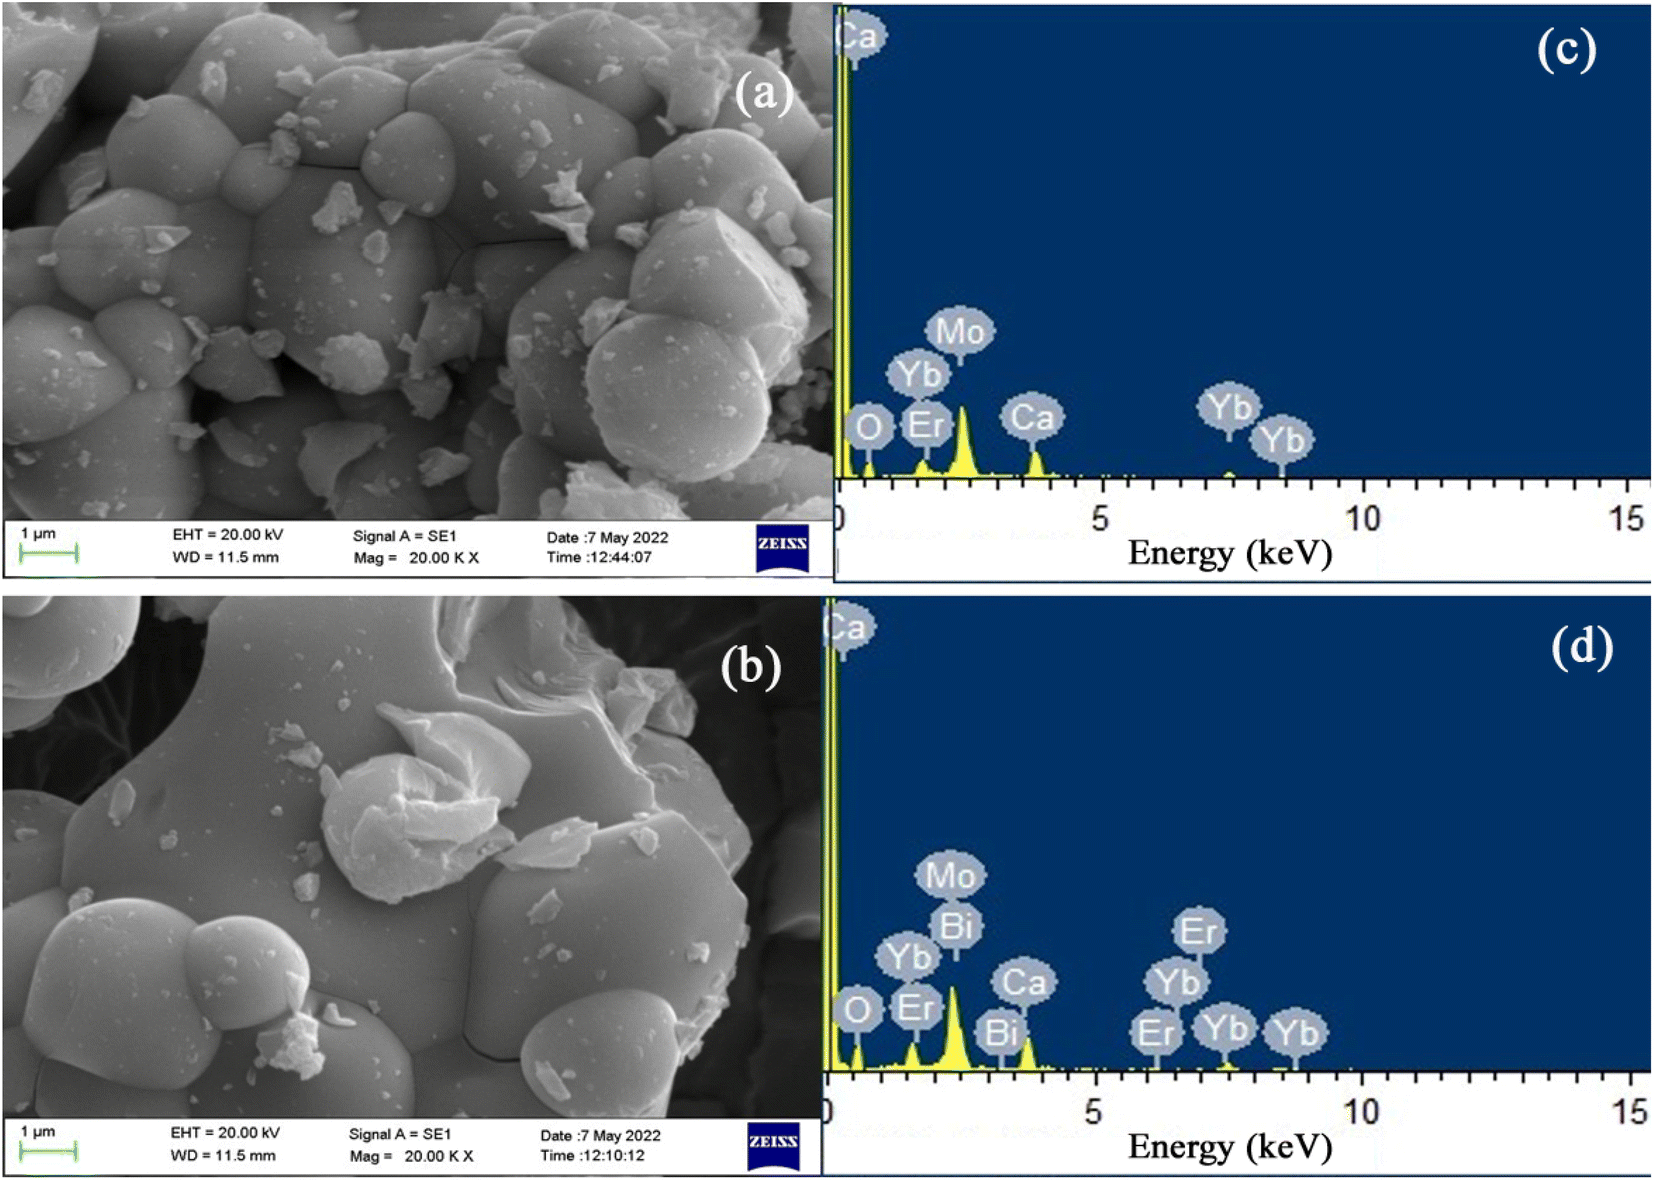 | ||
| Fig. 3 SEM image of (a) Ca0.79Er0.01Yb0.2MoO4 (CMEY) and (b) Ca0.68Bi0.11Er0.01Yb0.2MoO4 (CMBEY) phosphors. The EDS spectra of (c) CMEY (d) CMBEY phosphors. | ||
Energy dispersive X-ray spectroscopy (EDS) patterns of CMEY and CMBEY phosphor samples were also obtained. The EDS spectrum of CMBEY, shown in Fig. 3(d), confirms the presence of Ca, Mo, Er, Yb, O, and Bi elements, while CMEY phosphor contains Ca, Yb, Er, O, and Mo elements only, as shown in Fig. 3(c).10 The addition of Bi3+ ion in the co-doped phosphor was thus confirmed by the presence of an additional Bi element along with Ca, Er, Yb, O, and Mo elements in CMBEY phosphor, as shown in Fig. 3(d). The successful doping of Er3+, Yb3+, and Bi3+ in the CaMoO4 host was also verified by the elemental analysis of Er, Yb, Ca, Mo, O, and Bi.
3.3 Optical properties
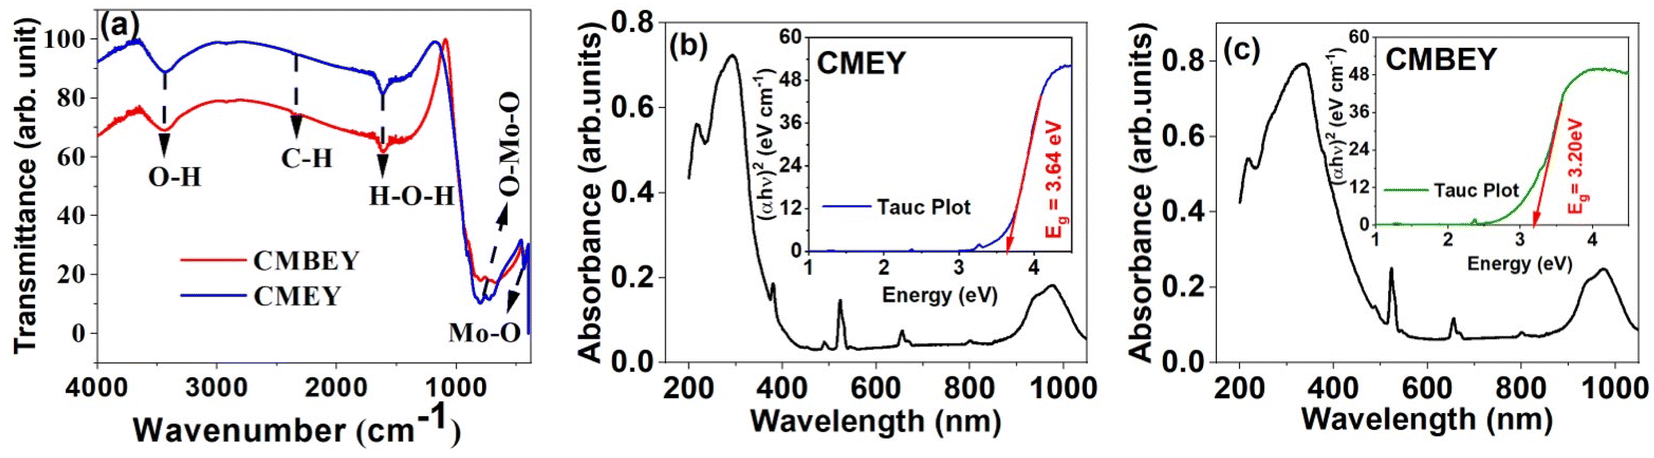 | ||
| Fig. 4 (a) Fourier transform infrared spectra of CMEY and CMBEY samples. UV-Vis-NIR absorption spectrum of (b) CMEY, and (c) CMBEY phosphors. Tauc plots of the respective UV-visible absorption spectra are provided as insets of the corresponding figures. | ||
Fig. 4(b) and (c) depicts the optical absorption of both the CMEY and CMBEY samples, providing valuable insights into the bandgap properties of the samples. The broad absorption band observed in both CMEY and CMBEY samples at a center point of 300 nm is attributed to charge transfer from O2-(2p) electrons to Mo6+ bands.47 The bandgap energy of the samples is determined from the Tauc plots given in insets of the corresponding absorption spectra. The bandgap energy of CMEY sample is 3.64 eV, while it reduces to 3.20 eV for CMBEY sample. The variations in the energy band gap values observed in the doped and undoped phosphors could be attributed to the diverse crystalline morphology and size of the material, stemming from the distinct lanthanide ions used. Further, the presence of the Bi3+, Er3+, and Yb3+ ions create defects in the CaMoO4 material, generating supplementary energy levels in the band gap. This leads to a decrease in the energy gap, which could explain the observed differences in energy band gap values.48 According to the interpretations from XRD and SEM analyses, the presence of Bi3+ ions in the CMEY phosphors increases both the crystallite size and particle size. It is obvious that the bandgap decreases as the particle size increases.49
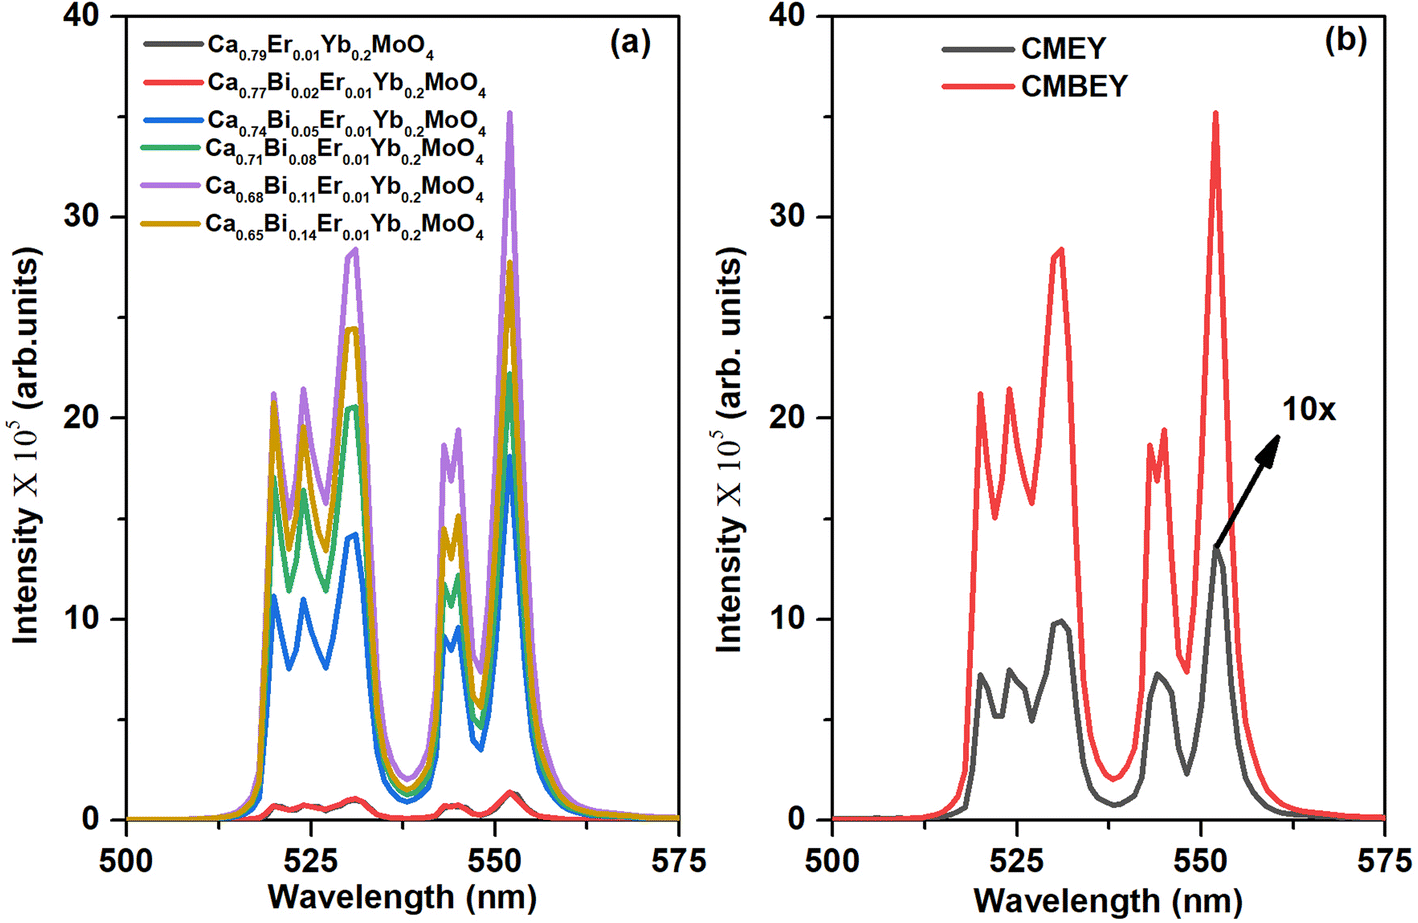 | ||
| Fig. 5 (a) UC emission of powder samples of Ca0.79−xBixEr0.01Yb0.2MoO4, with varying Bi concentrations (x = 0.00, 0.02, 0.05, 0.08, 0.11, and 0.14), (b) comparison of the UC emission spectra of CMEY and CMBEY samples both using 980 nm laser as excitation source. | ||
In conclusion, our study indicates that Ca0.68Bi0.11Er0.01Yb0.2MoO4 is the optimized sample among the series of Bi3+ co-doped Er3+/Yb3+: CaMoO4 samples. Nonetheless, the UC emission peak intensity is subject to different factors, such as the excitation flux and the phosphor mass. For comparative purposes, we used the same instrumental parameters, including the excitation wavelength, slit width, and integration time, for both the CMEY and CMBEY samples. As shown in Fig. 5(b), the UC emission intensity for the CMBEY sample was nearly twenty-five times higher than that of the CMEY sample. The incorporation of Bi3+ ions enhances the luminescence intensity of the phosphors through various mechanisms. One possible mechanism is that Bi3+ ions can act as a sensitizer as well as the surface modifier,40 facilitating the efficient energy transfer between Yb3+ and Er3+ ions. This improved energy transfer can lead to enhanced UC luminescence intensity. Additionally, the local site distortion caused by Bi3+ ions may modify the crystal field environment around the Er3+ ions, potentially leading to more efficient radiative transitions and hence, an increase in luminescence intensity.50
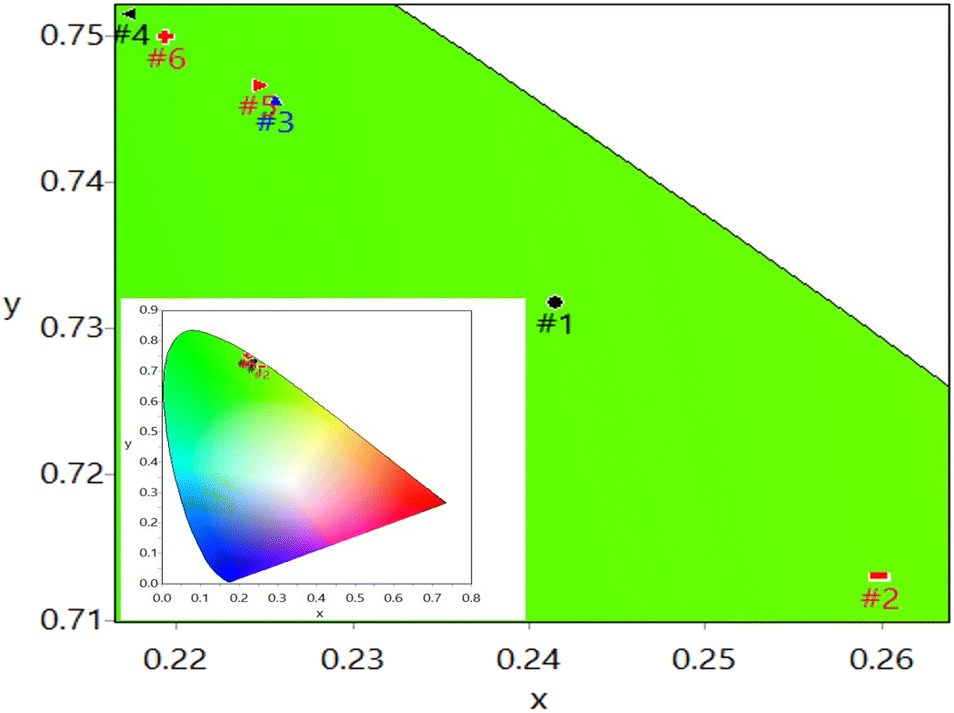 | ||
| Fig. 6 Zoomed-in version of the CIE chromaticity diagram for the UC emission of Ca0.79Er0.01Yb0.2MoO4 (#1), Ca0.77Bi0.02Er0.01Yb0.2MoO4 (#2), Ca0.74Bi0.05Er0.01Yb0.2MoO4 (#3), Ca0.71Bi0.08Er0.01Yb0.2MoO4 (#4), Ca0.68Bi0.11Er0.01Yb0.2MoO4 (#5), and Ca0.65Bi0.14Er0.01Yb0.2MoO4 (#6) phosphor samples under 980 nm laser excitation. The inset displays the CIE chromaticity diagram for all six samples without zooming. | ||
3.4 Temperature dependent UC measurement: optical temperature sensing application
A temperature depended UC emission was monitored for CMEY and CMBEY samples. Initially, both the samples were calcined at 900 °C for the comparison. A 980 nm continuous wave laser source with a low power was used for excitation to prevent excessive heating from the source itself. The external temperature of the sample was regulated using a program given to homemade heater, and the UC emission spectra were observed in the temperature range from 298 K to 523 K for CMEY and 300 K to 598 K for CMBEY samples. The temperature-dependent multi-phonon non-radiative decay can be described by the equation| WNR(T) = WNR(0)(1 − e−hv/kT)−n | (5) |
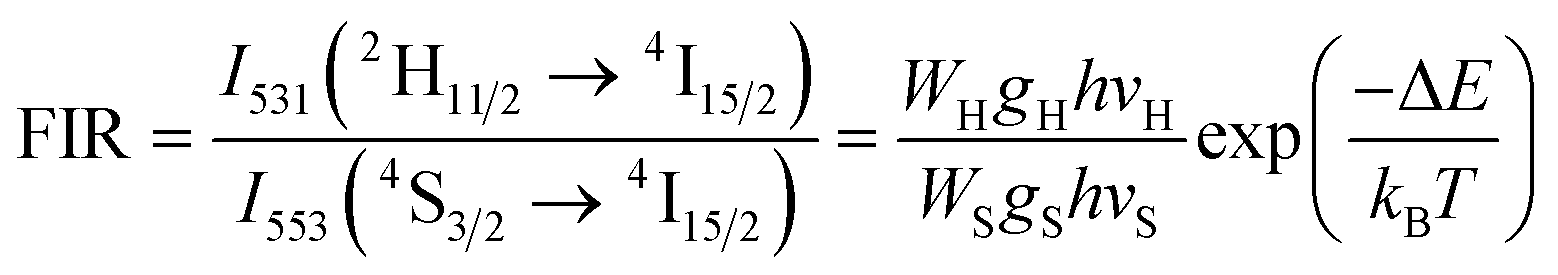
The equation used to describe the temperature-dependent multi-phonon non-radiative decay is characterized by WNR(T) and WNR(0), which represent the non-radiative decay rates at temperatures T and 0 K, respectively. The analysis of the temperature-dependent UC spectra was conducted because of the potential for population redistribution due to thermal excitation of the energy difference between the 2H11/2 and 4S3/2 states of the Er3+ ion. The fluorescence intensity ratio (FIR) was plotted against temperature and explained using Boltzmann's distribution, as described by eqn (6) and (7).
 | (6) |
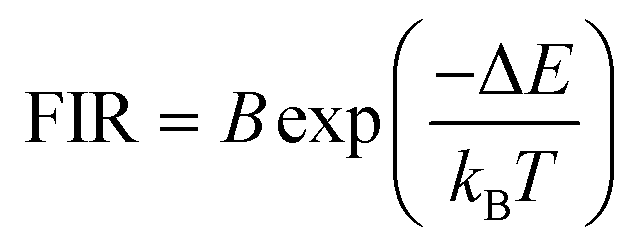 | (7) |
The energy bandgap between two thermally coupled levels, 2H11/2 and 4S3/2, can be calculated by taking the natural log of both sides of eqn (7). This yields the expression
 | (8) |
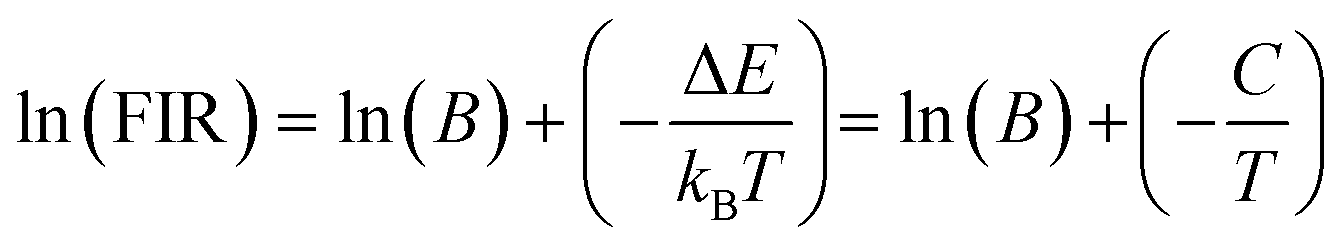
The determination of the unknown constants B and C is required, with the constant B being influenced by the properties of the prepared phosphor, such as degeneracy (gH and gS) and spontaneous emission probability (WH and WS), as well as the detection system's response. Fig. 7(a) and (d) displays the temperature-induced variations in the intensity of the UC emission peaks, located at 531 nm and 553 nm of the samples CMEY and CMBEY, respectively. The intensity of the 531 nm peak initially rises with increasing temperature until it reaches 398 K, then begins to decline beyond this temperature. This trend is also followed by 553 nm wavelength. Eqn (8) can be utilized to calculate the energy bandgap between two levels that are thermally coupled. This equation is based on the logarithm of the fluorescence intensity ratio (FIR), as well as the constants B and C, and the energy difference ΔE. The constants B and C are influenced by the properties of the prepared phosphor, including degeneracy and spontaneous emission probability, as well as the detection system's response.
 | ||
| Fig. 7 Upconversion spectra of (a) Ca0.68Er0.01Yb0.2MoO4 and (d) Ca0.68Bi0.11Er0.01Yb0.2MoO4 phosphor samples at different temperatures. The logarithm of the FIR as a function of the inverse temperature for (b) Ca0.68Er0.01Yb0.2MoO4, and (e) Ca0.68Bi0.11Er0.01Yb0.2MoO4. The relative and absolute sensitivity for (c) Ca0.68Er0.01Yb0.2MoO4 and (f) Ca0.68Bi0.11Er0.01Yb0.2MoO4 samples, respectively. | ||
Eqn (8) is plotted as a linear graph of ln(FIR) against 1/T as shown in Fig. 7(b) and (e), with the calculated slope and intercept being 506.56 ± 40.40, 1.91 ± 0.10 for CMEY and 688.834 ± 49.39, 2.365 ± 0.136 for CMBEY. This results in energy gaps of 352.19 cm−1 and 478.92 cm−1 for CMEY and CMBEY samples, respectively.10 To observe the thermal sensitivity of the prepared phosphors, the relative sensitivity (Sr) and absolute sensitivity (Sa) were also calculated. Sa is defined as the rate of change of FIR with temperature, while Sr is used to compare the sensitivity of different materials. The plots of Sa and Sr for both CMEY and CMBEY against increasing temperature are shown in Fig. 7(c) and (f), respectively. The absolute sensitivity for both samples initially increases, reaches a maximum value, and then decreases. The maximum relative sensitivity for CMEY is 0.0057 K−1 at 298 K and 0.0068 K−1 at 300 K for CMBEY. The maximum absolute sensitivities for CMEY and CMBEY are 0.00786 K−1 at 323 K and 0.0079 K−1 at 348 K, respectively, with CMBEY having higher sensitivity.
Local site distortions caused by Bi3+ doping improves the luminescence properties of the phosphors. The Bi3+ ions modify the local crystal field environment around the Er3+ and Yb3+ ions, which can enhance the luminescence intensity and improve the temperature sensing sensitivity of the phosphors. Hence Bi3+ ion doping into the Ca0.79Er0.01Yb0.2MoO4 phosphor enables the better temperature sensing capabilities. However, further investigation of the optical properties and temperature-dependent luminescence behaviour are necessary to fully understand the effect of Bi3+ co-doping on the Ca0.79Er0.01Yb0.2MoO4 phosphor.
4. Conclusion
In conclusion, this study has effectively demonstrated the significant impact of co-doping Bi3+ ions on luminescence enhancement of Er3+/Yb3+ co-doped CaMoO4 phosphor. Bi3+ co-doping creates a local distortion while the average tetragonal structure of CaMoO4 remains intact. This creates asymmetry around the Er3+ ions (substituted at Ca2+ site) which improves the UC emission. Further, our calculations on XRD data show a reduction in dislocation density (72.80 × 10¹² m−2 to 51.02 × 10¹² m−2) and micro-strain (16.8 × 10⁻⁴ to 15.8 × 10⁻⁴) with the introduction of Bi in Ca0.79Er0.01Yb0.2MoO4 crystal structure, which also favours the enhancement of upconversion emission as it reduces the non-radiative channels. The overall enhancement of the UC emission by the combined effects is nearly 25-folds which improves relative sensitivity significantly. At 300 K, the relative sensitivity of the Bi3+ co-doped sample was found to be 0.0068 K−1. Conversely, the sample without Bi co-doping had a relative sensitivity of 0.0057 K−1 at 298 K. These findings provide compelling evidence for the potential of Bi3+ co-doping to optimize the performance of Er3+/Yb3+ co-doped CaMoO4 as a temperature sensor in FIR based applications. Further, this study also constitutes a significant step forward in the development of efficient and effective temperature sensing materials based on Bi3+ co-doping in lanthanide phosphors.Conflicts of interest
There are no conflicts to declare.Acknowledgements
SKS is thankful to Department of Science and Technology (DST), New Delhi, India for core-research grant (CRG/2022/001393). Sachin Singh acknowledges to Department of Science and Technology (DST), Government of India for providing INSPIRE fellowship.References
- S. A. Wade, S. F. Collins and G. W. Baxter, J. Appl. Phys., 2003, 94, 4743–4756 CrossRef CAS.
- V. K. Rai and S. B. Rai, Appl. Phys. B, 2007, 87, 323–325 CrossRef CAS.
- S. K. Singh, K. Kumar and S. B. Rai, Sens. Actuators, A, 2009, 149, 16–20 CrossRef CAS.
- J. Cao, X. Li, Z. Wang, Y. Wei, L. Chen and H. Guo, Sens. Actuators, B, 2016, 224, 507–513 CrossRef CAS.
- J. Cao, W. Chen, D. Xu, F. Hu, L. Chen and H. Guo, J. Lumin., 2018, 194, 219–224 CrossRef CAS.
- P. Du, L. Luo, X. Huang and J. S. Yu, J. Colloid Interface Sci., 2018, 514, 172–181 CrossRef CAS PubMed.
- M. A. Hernández-Rodriguez, A. D. Lozano-Gorrín, V. Lavín, U. R. Rodríguez-Mendoza, I. R. Martín and F.-J. Manjón, J. Lumin., 2018, 202, 316–321 CrossRef.
- A. K. Choudhary, S. K. Singh, A. Dwivedi, A. Bahadur and S. B. Rai, Methods Appl. Fluoresc., 2018, 6, 35014 CrossRef CAS PubMed.
- M. Sharma, P. Singh, S. K. Singh and P. Singh, Opt. Mater., 2022, 133, 112925 CrossRef CAS.
- S. Singh, S. Kachhap, A. K. Singh, S. Pattnaik and S. K. Singh, Methods Appl. Fluoresc., 2022, 10, 44004 CrossRef PubMed.
- F. Wang, J. Wang and X. Liu, Angew. Chem., Int. Ed., 2010, 49, 7456–7460 CrossRef CAS PubMed.
- P. Huang, W. Zheng, S. Zhou, D. Tu, Z. Chen, H. Zhu, R. Li, E. Ma, M. Huang and X. Chen, Angew. Chem., 2014, 126, 1276–1281 CrossRef.
- Q. Zou, P. Huang, W. Zheng, W. You, R. Li, D. Tu, J. Xu and X. Chen, Nanoscale, 2017, 9, 6521–6528 RSC.
- F. Wang and X. Liu, Chem. Soc. Rev., 2009, 38, 976–989 RSC.
- F. Wang, Y. Han, C. S. Lim, Y. Lu, J. Wang, J. Xu, H. Chen, C. Zhang, M. Hong and X. Liu, Nature, 2010, 463, 1061–1065 CrossRef CAS PubMed.
- F. Wang, R. Deng, J. Wang, Q. Wang, Y. Han, H. Zhu, X. Chen and X. Liu, Nat. Mater., 2011, 10, 968–973 CrossRef CAS PubMed.
- F. Wang, X. Xue and X. Liu, Angew. Chem., 2008, 120, 920–923 CrossRef.
- C.-K. Duan, M. Yin, K. Yan and M. F. Reid, J. Alloys Compd., 2000, 303, 371–375 CrossRef.
- D. Hreniak, J. Hölsä, M. Lastusaari and W. Stręk, J. Lumin., 2007, 122, 91–94 CrossRef.
- L. Marciniak, M. Stefanski, R. Tomala, D. Hreniak and W. Strek, Opt. Mater., 2015, 41, 17–20 CrossRef CAS.
- Y. Chen, W. He, H. Wang, X. Hao, Y. Jiao, J. Lu and S. Yang, J. Lumin., 2012, 132, 2404–2408 CrossRef CAS.
- L. Marciniak, D. Hreniak, A. Dobrowolska and E. Zych, Appl. Phys. A, 2010, 99, 871–877 CrossRef CAS.
- Y. Liu, W. Luo, H. Zhu and X. Chen, J. Lumin., 2011, 131, 415–422 CrossRef CAS.
- W. Luo, Y. Liu and X. Chen, Sci. China Mater., 2015, 58, 819–850 CrossRef CAS.
- G. Xiang, X. Liu, Q. Xia, X. Liu, S. Xu, S. Jiang, X. Zhou, L. Li, D. Wu and L. Ma, Talanta, 2021, 224, 121832 CrossRef CAS PubMed.
- G. Chen, H. Liu, H. Liang, G. Somesfalean and Z. Zhang, J. Phys. Chem. C, 2008, 112, 12030–12036 CrossRef CAS.
- Q. Cheng, J. Sui and W. Cai, Nanoscale, 2012, 4, 779–784 RSC.
- W. You, D. Tu, W. Zheng, P. Huang and X. Chen, J. Lumin., 2018, 201, 255–264 CrossRef CAS.
- I. Mayer and S. Cohen, J. Solid State Chem., 1983, 48, 17–20 CrossRef CAS.
- S.-D. Liu, L.-L. Dong, Y. Xu, X. Zhang, T.-Q. Ren, X.-D. Xu, Y.-D. Peng, Y.-P. Zhang, H.-Y. Zhang and D.-H. Li, Appl. Opt., 2016, 55, 7659–7662 CrossRef CAS PubMed.
- H. Ji, Z. Huang, Z. Xia, M. S. Molokeev, X. Jiang, Z. Lin and V. V Atuchin, Dalton Trans., 2015, 44, 7679–7686 RSC.
- H. J. Seo, J. Alloys Compd., 2014, 604, 100–105 CrossRef CAS.
- M. D. Wisser, S. Fischer, P. C. Maurer, N. D. Bronstein, S. Chu, A. P. Alivisatos, A. Salleo and J. A. Dionne, ACS Photonics, 2016, 3, 1523–1530 CrossRef CAS.
- Y. Zhu, Y. Liu, M. G. Brik, L. Huang, T. Xuan and J. Wang, Opt. Mater., 2017, 74, 52–57 CrossRef CAS.
- Y. Wang, X. Wang, Y. Mao and J. A. Dorman, J. Phys. Chem. C, 2022, 126, 11715–11722 CrossRef CAS PubMed.
- L. Zhang and X. Sun, J. Mater. Sci.: Mater. Electron., 2020, 31, 9160–9166 CrossRef CAS.
- W. Wang, S. Song, B. Cao and J. Li, J. Lumin., 2022, 247, 118901 CrossRef CAS.
- H. Hu, C. Deng, J. Xu, K. Zhang and M. Sun, J. Exp. Nanosci., 2015, 10, 1336–1346 CrossRef CAS.
- R. S. Yadav, A. Rai and S. B. Rai, Sci. Rep., 2021, 11, 4148 CrossRef PubMed.
- R. S. Yadav, D. Kumar, A. K. Singh, E. Rai and S. B. Rai, RSC Adv., 2018, 8, 34699–34711 RSC.
- J. Kong, J. Liu, F. Marlton, M. R. V. Jørgensen and A. Pramanick, Phys. Rev. B, 2021, 103(18), 184104 CrossRef CAS.
- S. P. S. Porto and J. F. Scott, Phys. Rev., 1967, 157, 716 CrossRef CAS.
- J. C. Sczancoski, L. S. Cavalcante, M. R. Joya, J. A. Varela, P. S. Pizani and E. Longo, Chem. Eng. J., 2008, 140, 632–637 CrossRef CAS.
- A. K. Parchur and R. S. Ningthoujam, Dalton Trans., 2011, 40, 7590–7594 RSC.
- S. Dutta, S. Som and S. K. Sharma, RSC Adv., 2015, 5, 7380–7387 RSC.
- Z. Xianju, Y. Xiaodong, X. Tengjiao, Z. Kaining, C. Tianyu, Y. A. N. Hao and W. Zhongqing, J. Rare Earths, 2013, 31, 655–659 CrossRef.
- S. Vidya, S. Solomon and J. K. Thomas, Phys. Status Solidi, 2012, 209, 1067–1074 CrossRef CAS.
- K. Saidi, W. Chaabani and M. Dammak, RSC Adv., 2021, 11, 30926–30936 RSC.
- P. Nayak, S. S. Nanda and S. Dasha, in AIP Conference Proceedings, AIP Publishing LLC, 2020, vol. 2265, p. 30070 Search PubMed.
- M. Yang, Y. Sui, S. Wang, X. Wang, Y. Wang, S. Lü, Z. Zhang, Z. Liu, T. Lü and W. Liu, J. Alloys Compd., 2011, 509, 827–830 CrossRef CAS.
| This journal is © The Royal Society of Chemistry 2023 |