 Open Access Article
Aqueous synthesis of red fluorescent L-cysteine functionalized Cu2S quantum dots with potential application as an As(III) aptasensor
Brandon Cruza,
Isaías Balderasb and
Idalia Gómez *a
*a
aLaboratorio de Materiales I, Universidad Autónoma de Nuevo León, San Nicolás de los Garza, Mexico. E-mail: maria.gomezd@uanl.edu.mx
bLaboratorio de Ingeniería Genética y Genómica, Universidad Autónoma de Nuevo León, San Nicolás de los Garza, Mexico
First published on 22nd June 2023
Abstract
Water-stable Cu2S quantum dots were obtained by applying L-cysteine as a Cu(II) to Cu(I) reducer and stabilizer in water and using an inert atmosphere at ambient temperature. The obtained quantum dots were characterized by STEM, XRD, FT-IR, UV-Vis, Raman, and fluorescence spectroscopy. The synthesis was optimized to achieve Cu2S quantum dots with an average diameter of about 9 nm that show red fluorescence emission. L-cysteine stabilization mediates crystallite growth, avoids aggregation of the quantum dots, and allows water solubility through polar functional groups, improving the fluorescence. The fluorometric test in the presence of the aptamer showed a shift in fluorescence intensity when an aliquot of As(III) with a concentration of 100 pmol l−1 is incorporated because As(III) and the used aptamer make a complex, leaving free the quantum dots and recovering their fluorescence response. The developed Cu2S quantum dots open possibilities for fluorescent detection of different analytes by simply changing aptamers according to the analyte to be detected.
Introduction
Well water represents a common water source globally for agricultural or public use and has the principal advantage of not needing purification, despite, high mineral concentration and heavy metals being common concerns that should be treated before well water use. Arsenic (As) pollution in well water represents a potential threat to global public health because low concentrations in aquifer-obtained drinking water can be harmful to human health. Its existence in well water has been reported in different zones around the world: Argentina, Australia, Bangladesh, Cambodia, Canada, Chile, China, Germany, Ghana, Hungary, India, Japan, Laos, Mexico, and United States.1 The International Agency for Research in Cancer (IARC) classifies As and its compounds as carcinogens for humans, highlighting that its presence in drinking water lends to the same harmful effects, that mainly are skin damage, disturbances in the circulatory system, cancer that can occur in the skin, lungs, bladder, liver or kidneys and finally death.2 The As it's classified as clastogenic (addition, elimination, or reorganization of genetic material that can drive carcinogenesis) and aneugenic (does not act on DNA, but on the mitotic spindle, lending to irregular chromosomic division).3–6According to the World Health Organization (WHO), an As concentration of 10 μg l−1 (133 nM) is a safe limit for drinking water. As can be found as As(III) and As(V), nevertheless, the toxic effects of As are more marked for As(III). Therefore, detection and quantification are most relevant and necessary.1,2 Instrumental methods exist for As quantification like Inductively Coupled Plasma Mass Spectrometry (ICP-MS), Atomic Fluorescence Spectrometry (AFS), High-Resolution Liquid Chromatography Coupled to ICP-MS, electrochemical methods, and Atomic Absorption Spectroscopy with Hydride Generator (HG-AAS). However, these techniques require complex instrumentation, investment of time and money, and specialized personnel.1,2,7
More simple methods for sensing arsenic are reported, recent examples are the aptasensors based on QD's that show a change in their fluorescent response proportional to a particular analyte concentration.1,2,8 Recently, it is reported that As(III) can be sensed with aptasensors. To achieve this, QD's aggregation needs to be induced with an aptamer that has an opposite net charge, reducing their fluorescent response, then added As(III) will attach to the aptamer (that is designed for having particular affinity to this analyte) leaving free the QD's and recovering proportionally their fluorescent response.2 Application of different aptamers with QD's opens various possibilities for sensing different molecules or ions, simply changing the aptamer for having selectivity with the interest analyte. Preference for QD's use in aptasensors over other materials for optical sensing is given by their stability, wide absorption spectra, high quantum yield, and photochemical stability.8
Most of the aptasensor reports that can be found use cadmium or lead QD's, nevertheless, the issue of nanoecotoxicology of these QD's species remains.9 Therefore, considering the application of nobler quantum dots is more suitable in the current context of environmental pollution.10 Small copper nanoparticles (NP's) have found potential applications due to their low cost, low toxicity, and stable size-dependent photoluminescence, which finally is the basis for sensing applications.9 It has been shown recently that functionalized Cu2S QDs can be obtained easily in aqueous media, and their cytotoxicity and colloidal stability can be modified by biomolecules,11,12 having a potential application in ion sensing.12 To achieve an aqueous synthesis is necessary to choose a stabilizer to avoid QD's agglomeration. One common QD's stabilizer is L-cysteine (LCIS), which binds to the crystal through sulfur bonds, giving superficial polar groups that confer water solubility and colloidal stability.12 LCIS also behaves as a reducing agent and has low toxicity because is reported that it's one of the common thiols that mediate QD's synthesis in vivo.12,13 meaning that with an inert atmosphere, Cu(II) reduction to Cu(I) and in situ functionalization with LCIS can be possible.
From the revision of the available information, we did not find reports focusing on Cu2S QD's synthesis in an aqueous solution using LCIS as a reducer and stabilizer. Neither As(III) sensing nor aptasensing is not reported. QD's aptasensors based in Cu2S can be a potential route for sensing As(III) with precision and exactitude through a fluorescent response that can be followed with a fluorimeter as an easier and economical method with potential for sensing. In this work, water-soluble Cu2S QD's with red emission were synthesized in an aqueous solution at ambient temperature using LCIS as a stabilizer, having in mind synthesis suggestions from previous reports. Based on the properties of the obtained QD's, their potential application in As(III) sensing is analyzed and discussed.
Experimental procedure
Materials
Copper chloride(II) dihydrate (≥99%), L-cysteine (≥98%), sodium hydroxide (≥99%), sodium sulfide nonahydrate (≥99%), arsenic(III) oxide (≥99%) and ion chromatography grade water were purchased from Sigma-Aldrich. All the reagents were used without further purification.Synthesis of LCIS functionalized Cu2S QD's
Avoiding light exposure and bubbling nitrogen, 0.0485 g of LCIS were dissolved in 100 ml of water and placed into a three-necked round bottom flask. 3 ml of 0.1 mol l−1 CuCl2 solution was injected into the flask under stirring for 30 seconds and produced a white suspension that dispersed red light. 1 mol l−1 NaOH was added dropwise under strong stirring until the reaction mixture became clear (pH ∼ 7). Later, 1 ml of 0.1 mol l−1 Na2S was injected into the flask under constant stirring, and LCIS functionalized Cu2S QD's were obtained as a reddish-orange suspension. The QD's were sealed and stored in the dark at ambient temperature.2,11,12Test of potential for As(III) sensing
A stock solution of 0.1 mol ml−1 As(III) was prepared dissolving the specific amount of As2O3 in 2 ml of 1 mol l−1 NaOH, converting As2O3 to Na2AsO3 which is soluble and stable in most pH values.† To achieve a pH near 7, and assure neutral pH during buffer addition in As(III) detection tests, 5 ml of 0.5 mol l−1 HCl were added, and the solution was diluted to 100 ml with water in a volumetric flask. Subsequent dilutions were made using this stock standard solution. Specific aptamer sequence for As(III) (5′-GGTAATACGACTCACTATAGGGAGATACCAGCTTATTCAATTTTACAGAACAACCAACGTCGCTCCGGGTACTTCTTCATCGAGATAGTAAGTGCAATCT-3′)2 was synthesized by BAKTER México. pH was stabilized using buffer pH = 7 standard solution obtained by Fermont.The test was done modifying a previously reported method:2 A dilution of 1![[thin space (1/6-em)]](https://www.rsc.org/images/entities/char_2009.gif) :
:![[thin space (1/6-em)]](https://www.rsc.org/images/entities/char_2009.gif) 100 of Cu2S QD's was done and 20 μl of this solution was mixed with an equal volume of 10 mmol l−1 aptamer solution and diluted to 3 ml with the buffer solution, after incubating for 5 min fluorescence at λexc = 341 nm was read. To the later mixture, 20 μl of 100 pmol l−1 As(III) was added and incubated for 5 min and the fluorescence was read again to see the difference in fluorescence response.
100 of Cu2S QD's was done and 20 μl of this solution was mixed with an equal volume of 10 mmol l−1 aptamer solution and diluted to 3 ml with the buffer solution, after incubating for 5 min fluorescence at λexc = 341 nm was read. To the later mixture, 20 μl of 100 pmol l−1 As(III) was added and incubated for 5 min and the fluorescence was read again to see the difference in fluorescence response.
Instrumentation
λ Fluorescence measurements were acquired on a PerkinElmer LS55 spectrometer. Fourier transform infrared spectra (FTIR) of Cu2S QD's were obtained from a PerkinElmer spectrum two spectrometer with a ZnSe ATR universal sampling accessory. UV-vis spectrum was obtained from a Shimadzu UV-1800 spectrometer. X-ray diffraction (XRD) analysis of QD's was obtained from a Bruker D2 Phaser diffractometer with Cu-Kα radiation (λ = 1.5418 Å) with a step size of 0.5° and an interval of 2θ = (5–90)°, for this, one drop of as obtained QD's suspension was put over a background zero sample holder and let it dry at ambient temperature. The interplanar distance (d) was calculated with the eqn (1) (Bragg equation):
λ = 2d![[thin space (1/6-em)]](https://www.rsc.org/images/entities/char_2009.gif) sin sin![[thin space (1/6-em)]](https://www.rsc.org/images/entities/char_2009.gif) θ θ
| (1) |
 | (2) |
Raman spectrum was collected from a Raman spectrometer (Raman Thermo-Scientific DXR) with an excitation laser of λ = 780 nm and a power of 5 mW. Scanning transmission electron microscope (STEM) images were obtained with a Jeol JSM-6701F at an acceleration voltage of 20 kV.
An overview of the steps for Cu2S QD's synthesis is shown in Fig. 1.
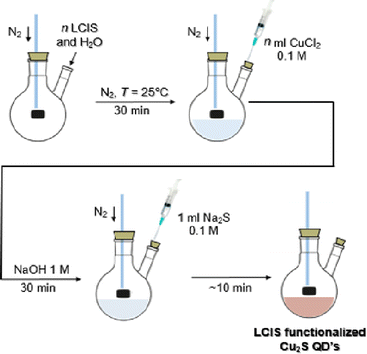 | ||
| Fig. 1 General scheme of LCIS functionalized Cu2S QD's.‡ | ||
Results and discussion
Cu2S QD's synthesis
After CuCl2 addition to purged LCIS solution, a turbid suspension is obtained, suggesting the Cu(II) reduction by LCIS and in situ synthesis of a Cu–LCIS complex, the pH of this step was about 3. The addition of around 2 ml of NaOH 0.1 M solution gives a pH = 7 and a translucent solution due to the dissociation of the Cu(I) complex. Free Cu(I) is capable of reacting with S2− when Na2S solution is added, the reaction mixture acquires an orange-reddish color that becomes brown after around 10 min, obtaining the Cu2S QD's suspension.12Characterization of Cu2S QD's
FTIR analysis was used for identifying the typical absorption bands at the QD's surface and confirming the functionalization (Fig. 2a).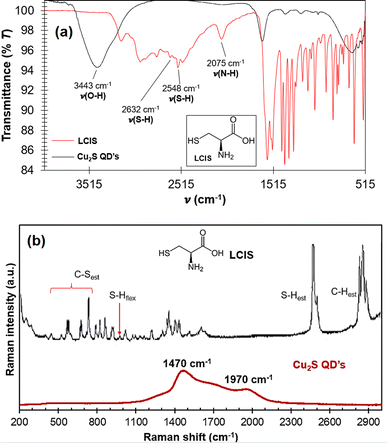 | ||
| Fig. 2 (a) FTIR spectra comparison of LCIS and Cu2S QD's, (b) Raman spectra of LCIS and Cu2S QD's, a visual reference of the structure of LCIS used isomer is shown as insets. | ||
The centered band at 3443 cm−1 (Fig. 2a) is assigned to the stretching vibration of the LCIS O–H bonds and adsorbed water.11,12 The signals at 1637 cm−1 and 1373 cm−1 are assigned to stretching vibrations of C![[double bond, length as m-dash]](https://www.rsc.org/images/entities/char_e001.gif) O and C–O bonds respectively, for LCIS. S–S stretching vibration is seen at 588 cm−1. Compared with pure LCIS spectra, its characteristic signals at 2632 and 2548 cm−1, which are the stretching vibrations of S–H bonds, disappear for the QD's spectrum, suggesting that the LCIS bonds to the QD's, as occur in Ag, PbS,14 ZnS,14,15 Fe3O4,16 CdTe,17 and ZnS
O and C–O bonds respectively, for LCIS. S–S stretching vibration is seen at 588 cm−1. Compared with pure LCIS spectra, its characteristic signals at 2632 and 2548 cm−1, which are the stretching vibrations of S–H bonds, disappear for the QD's spectrum, suggesting that the LCIS bonds to the QD's, as occur in Ag, PbS,14 ZnS,14,15 Fe3O4,16 CdTe,17 and ZnS![[thin space (1/6-em)]](https://www.rsc.org/images/entities/char_2009.gif) :
:![[thin space (1/6-em)]](https://www.rsc.org/images/entities/char_2009.gif) O18 nanoparticles through thiolate bonds, acting also as a stabilizer for suppress agglomeration14 giving a “core–shell” conformation.18 –OH and C
O18 nanoparticles through thiolate bonds, acting also as a stabilizer for suppress agglomeration14 giving a “core–shell” conformation.18 –OH and C![[double bond, length as m-dash]](https://www.rsc.org/images/entities/char_e001.gif) O bonds confer water affinity and stability.14 In addition, the peak at 2075 cm−1 corresponding to the N–H bond of the LCIS –NH3+ group disappears in the spectrum due to its alkalinization after NaOH addition. These observations suggest LCIS correct modification for bonding to the QD's surface.19
O bonds confer water affinity and stability.14 In addition, the peak at 2075 cm−1 corresponding to the N–H bond of the LCIS –NH3+ group disappears in the spectrum due to its alkalinization after NaOH addition. These observations suggest LCIS correct modification for bonding to the QD's surface.19
In the Raman spectra (Fig. 2b) it can be seen that peaks belonging to stretching and bending S–H bonds in LCIS (black line) disappear in the QD's spectra, confirming the LCIS bonding to the QD's surface, additionally, two new vibration modes appear centered around 1450 and 1970 cm−1, these peaks are wide and intense due to the high fluorescence of the QD's, response that dominates over other signals that should appear like the stretching modes of S–H and C–S bonds.11,20,21
The diffractogram of synthesized QD's (Fig. 3) shows good agreement with the cubic copper sulfide diffraction pattern PDF 03-065-2980, demonstrating that the LCIS mediates the synthesis of the desired crystalline phase.12
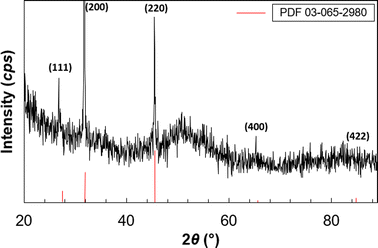 | ||
| Fig. 3 XRD pattern of the Cu2S QD's and comparison with diffraction planes of reported Cu2S cubic phase. | ||
From the UV-vis spectrum of the Cu2S QD's (Fig. 4) wide absorption is seen ranging from UV (∼400 nm) to near-infrared (∼780 nm), similar to Cu2S nanocrystals obtained in non-the aqueous phase.12 Localized superficial plasmon resonance in the near-infrared can be used for determining stoichiometry in copper sulfide nanoclusters, nevertheless, this effect is not observed, this fact indicates that the QD's (Cu2−xS) are Cu2S.11,12
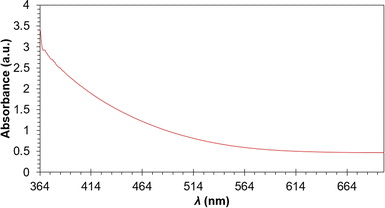 | ||
| Fig. 4 UV-vis spectra of Cu2S QD's, a wide absorption behavior is seen ranging from UV to near-infrared. | ||
The maximum fluorescent emission for the Cu2S QD's is seen as a sharp peak in the red region at 652 nm (Fig. 5) and was obtained at a λexc = 661 nm. Having only one signal suggests narrow size distribution of the QD's. Excitation spectra only show one peak, thus attributing continuous energy levels in the QD's.12,22 Also, the emission and excitation peaks are overlapped, which occurs only in transition S0–S1,23 this overlap can also suggest near but different crystal sizes that sum and give wide signals,12 this is confirmed and discussed with the next TEM and STEM analysis.
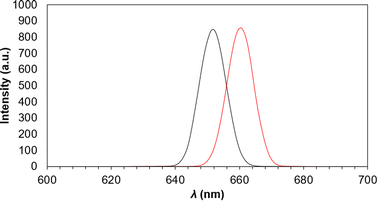 | ||
| Fig. 5 Emission (red line) and emission (black line) fluorescence spectra of LCIS functionalized Cu2S QD's. | ||
From the STEM images (Fig. 6a and b) it can be seen that the QD's have dispersed diameters that comprise values from 9 to 52 nm with spheric shape tendency. Agglomerates can be seen, nevertheless, the suspension stays stable without visible precipitate (Fig. 6c). These observations oppose the previous ones, agglomerates can occur for Cu nanoparticles due to instability at temperatures over or below 25 °C, reaching scattered values of diameter that even can be close to 150 nm at 40 °C (Fig. 6d),12 for which more care should be taken when handling STEM. The other results previously discussed were obtained in the same laboratory, where the temperature is controlled at 25 °C. LCIS-functionalized nanoparticles can show a facility for agglomeration, but if individual nanoparticles are remarkable between the agglomerations, a diameter estimation is acceptable.24
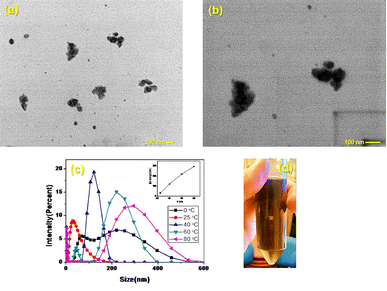 | ||
Fig. 6 STEM images of the Cu2S QD's at (a) 500![[thin space (1/6-em)]](https://www.rsc.org/images/entities/char_2009.gif) 00×, (b) 1 00×, (b) 1![[thin space (1/6-em)]](https://www.rsc.org/images/entities/char_2009.gif) 000 000![[thin space (1/6-em)]](https://www.rsc.org/images/entities/char_2009.gif) 00×, (c) photograph of Cu2S QD's suspension two weeks after it’s synthesis (d) example of the temperature effect in size distribution of Cu2S nanocrystals reported by Du et al.12 00×, (c) photograph of Cu2S QD's suspension two weeks after it’s synthesis (d) example of the temperature effect in size distribution of Cu2S nanocrystals reported by Du et al.12 | ||
TEM image of 1![[thin space (1/6-em)]](https://www.rsc.org/images/entities/char_2009.gif) :
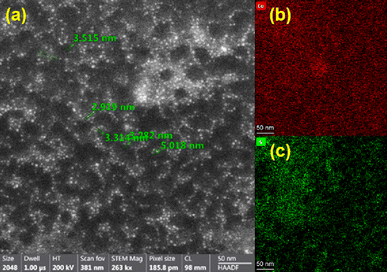
:![[thin space (1/6-em)]](https://www.rsc.org/images/entities/char_2009.gif) 100 dilution of Cu2S QD's are shown in Fig. 7. The particles were dispersed and had a spherical shape tendency with a size in the range from 2.9–5.0 nm, confirming the previous XRD observations.11,12 Homogeneous Cu and S distribution was seen from elemental mapping images (Fig. 7b and c) of Fig. 7a, confirming the synthesis of Cu2S QD's.12,25–30
100 dilution of Cu2S QD's are shown in Fig. 7. The particles were dispersed and had a spherical shape tendency with a size in the range from 2.9–5.0 nm, confirming the previous XRD observations.11,12 Homogeneous Cu and S distribution was seen from elemental mapping images (Fig. 7b and c) of Fig. 7a, confirming the synthesis of Cu2S QD's.12,25–30
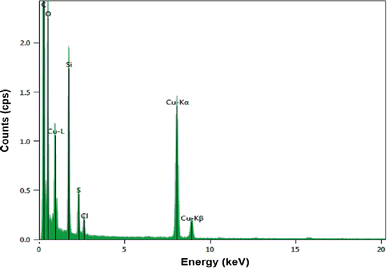
Using Energy-Dispersive spectroscopy, the presence of both K values for Cu can be appreciated (Fig. 8), as well as the S as it would be estimated. The atomic radius of Cu is approximately twice that of S, indicating that Cu2S was obtained.25,26 On the other hand, C and O will correspond to the molecules that functionalize the QD's. The Cl corresponds to NaCl that is formed during the addition of NaOH in obtaining the QD's due to the use of CuCl2 as starting reagent. Likewise, Si corresponds to impurities from LCIS reagent.11
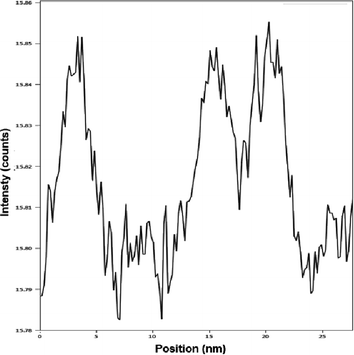
A study of the diameter profiles (Fig. 9) allowed to corroborate that diameters from 2.9 to 5 nm were the most frequent. Likewise, clusters previously observed by FESEM around 15 and 20 nm were also seen in this study.
Effects of different molar ratios on the crystallite size and fluorescence intensity
To determine the molar relation that allows the smaller crystallite diameter, different amounts of LCIS were applied, and crystallite size was followed with XRD (Fig. 10). A low LCIS molar ratio regarding Cu allows wider crystallite diameter since the QD's are not covered enough, allowing agglomeration due to low dispersibility. Moreover, an increase in molar ratio increases crystallite size, and a high concentration of LCIS in suspension increases molecular collisions, promoting clusters.12 An intermediate LCIS amount (molar ratio 3![[thin space (1/6-em)]](https://www.rsc.org/images/entities/char_2009.gif) :
:![[thin space (1/6-em)]](https://www.rsc.org/images/entities/char_2009.gif) 1) allows the lowest crystallite diameter, having this ratio in mind, the Cu
1) allows the lowest crystallite diameter, having this ratio in mind, the Cu![[thin space (1/6-em)]](https://www.rsc.org/images/entities/char_2009.gif) :
:![[thin space (1/6-em)]](https://www.rsc.org/images/entities/char_2009.gif) S molar ratio was varied. Like in the previous experiments, an intermediate molar ratio allowed the best result achieving a crystallite size of 9 nm, located in the QD's diameter range.30
S molar ratio was varied. Like in the previous experiments, an intermediate molar ratio allowed the best result achieving a crystallite size of 9 nm, located in the QD's diameter range.30
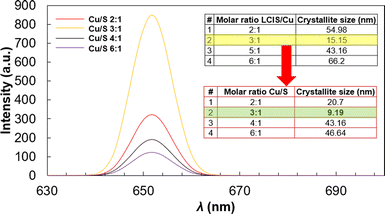 | ||
Fig. 10 Influence of Cu![[thin space (1/6-em)]](https://www.rsc.org/images/entities/char_2009.gif) : :![[thin space (1/6-em)]](https://www.rsc.org/images/entities/char_2009.gif) S molar ratio in fluorescence emission intensity, crystallite size XRD results for LCIS S molar ratio in fluorescence emission intensity, crystallite size XRD results for LCIS![[thin space (1/6-em)]](https://www.rsc.org/images/entities/char_2009.gif) : :![[thin space (1/6-em)]](https://www.rsc.org/images/entities/char_2009.gif) Cu and Cu Cu and Cu![[thin space (1/6-em)]](https://www.rsc.org/images/entities/char_2009.gif) : :![[thin space (1/6-em)]](https://www.rsc.org/images/entities/char_2009.gif) S molar ratio variations included as table insets. S molar ratio variations included as table insets. | ||
Fig. 10 shows the fluorescence spectra of functionalized Cu2S nanoparticles varying Cu![[thin space (1/6-em)]](https://www.rsc.org/images/entities/char_2009.gif) :
:![[thin space (1/6-em)]](https://www.rsc.org/images/entities/char_2009.gif) S molar ratios under λexc = 661 nm. Emission intensity increases with an increased Cu
S molar ratios under λexc = 661 nm. Emission intensity increases with an increased Cu![[thin space (1/6-em)]](https://www.rsc.org/images/entities/char_2009.gif) :
:![[thin space (1/6-em)]](https://www.rsc.org/images/entities/char_2009.gif) S ratio, reaching a maximum at 3
S ratio, reaching a maximum at 3![[thin space (1/6-em)]](https://www.rsc.org/images/entities/char_2009.gif) :
:![[thin space (1/6-em)]](https://www.rsc.org/images/entities/char_2009.gif) 1 ratio when the nanoparticle achieves the QD crystallite diameter (9 nm). On the other hand, the fluorescent intensity decreases markedly with Cu
1 ratio when the nanoparticle achieves the QD crystallite diameter (9 nm). On the other hand, the fluorescent intensity decreases markedly with Cu![[thin space (1/6-em)]](https://www.rsc.org/images/entities/char_2009.gif) :
:![[thin space (1/6-em)]](https://www.rsc.org/images/entities/char_2009.gif) S ratio increase due to the higher crystallite diameter.2,12
S ratio increase due to the higher crystallite diameter.2,12
Dilution effect over fluorescence of the QD's and test of the potential for As(III) sensing
The experiment was carried out at neutral pH = 7 considering assuring the stability of the used aptamer and the stability of the QD's which are obtained at this pH. Higher pH values can decrease repulsion between QD's resulting in aggregation.A dilution 1![[thin space (1/6-em)]](https://www.rsc.org/images/entities/char_2009.gif) :
:![[thin space (1/6-em)]](https://www.rsc.org/images/entities/char_2009.gif) 100 of the QD's suspension was used for fitting to the reagents concentrations of the applied modified method2 and with the purpose of avoiding QD's conglomerates during the As(III) test.31 Diluted Cu2S QD's shown a lower λexc upon dilution (seen as a wide and low intensity peak at λ = 379 nm in Fig. 11).
100 of the QD's suspension was used for fitting to the reagents concentrations of the applied modified method2 and with the purpose of avoiding QD's conglomerates during the As(III) test.31 Diluted Cu2S QD's shown a lower λexc upon dilution (seen as a wide and low intensity peak at λ = 379 nm in Fig. 11).
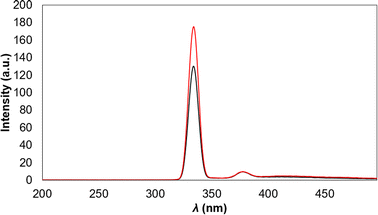 | ||
| Fig. 11 As(III) detection test following the change in fluorescent emission: before As(III) addition (black line) and after As(III) addition (red line). | ||
Similarly to the carbon QD's, Cu2S QD's nanoclusters can be formed due to van der Waals interactions, lending to a large number of polar functional groups getting together, leading to the higher polarity on the surfaces of nanoclusters. The higher polarity of these clusters causes the properties of excitation dependent. Meanwhile, the high degree of oxidation and higher polarity of the clusters lead to electron rapid relaxation from excited states to substates, which corresponds to a longer wavelength. Then, the substates contribute to photoemission, which gives rise to longer wavelength emission. The phenomenon of excitation-dependent has occurred at longer wavelength zone when higher concentrations are used. When the Cu2S QD's are diluted, the nanoclusters are separated into single QD's, leading to the weakening of the polarity and disappearance of emission spectra at longer wavelengths.26 Compared to the emission from the functional polar groups on the surface of the QD's, the luminescence from Cu2S nanocrystals plays a dominant role during the decrease of QD's concentration.31,32 At low concentrations, the fluorescent spectra of single QD's with intrinsic luminescence are moved to higher energy regions, showing excitation-independent fluorescence.31
After As(III) addition is seen that fluorescent intensity increases (Fig. 11), demonstrating that the principle of sensing where the QD's are released from aptamer attraction after this one bond selectively to As(III), is accomplished. The application of aptamer in sensing also gives the potential advantage of selectivity, thus, other ions will not interfere with the sensing mechanism,2 nevertheless ion interference will be evaluated in further work. For now, detecting a change in fluorescent response with 100 pM aliquot seems promising because the only similar Cu2S sensor12 reported achieves a LOD = 162![[thin space (1/6-em)]](https://www.rsc.org/images/entities/char_2009.gif) 000 pM but for sensing Au nanoparticles and another reports that use fluorescent sensing methods with QD's achieve LOD of 1.32 and 69 pM33, the first uses Cd QD's and As(III) specific aptamer and the second uses alloyed QD's. Considering that the best TEM image and As(III) detection was obtained using a 1
000 pM but for sensing Au nanoparticles and another reports that use fluorescent sensing methods with QD's achieve LOD of 1.32 and 69 pM33, the first uses Cd QD's and As(III) specific aptamer and the second uses alloyed QD's. Considering that the best TEM image and As(III) detection was obtained using a 1![[thin space (1/6-em)]](https://www.rsc.org/images/entities/char_2009.gif) :
:![[thin space (1/6-em)]](https://www.rsc.org/images/entities/char_2009.gif) 100 dilution, this can be applied in further work to avoid QD's cluster formation and keep the fluorescence results.
100 dilution, this can be applied in further work to avoid QD's cluster formation and keep the fluorescence results.
Therefore, a sensing method of As(III) in water with Cu2S QD's and specific aptamer will be developed in further work with the purpose of define the reproducibility and also opens possibilities for detecting different analytes by changing aptamers according to the analyte which will be detected.
Conclusions
Water soluble Cu2S QD's were obtained using LCIS as Cu reducer and stabilizer. Controlling LCIS and Cu stoichiometry, Cu2S nanocrystal growth can be handled for achieve a QD-range crystallite diameter.It was observed from the FTIR spectra that LCIS binds to Cu2S nanocrystals through sulfur bonds, achieving functionalization and leaving at the exterior of the QD's water-soluble functional groups that confers stability to the material.
The synthesized Cu2S QD's had a wide absorption range and showed red-fluorescent emission with overlapped emission and excitation peaks, suggesting a narrow size distribution and only one electronic transition.
Finally, a new potential aptasensor is reported as a fluorometric sensor for As(III). The use of aptamer for As(III) lends selectivity to the method as an advantage and allows ease of use, opening possibilities for easy and fast fluorescence sensing of As(III) in water samples through a sensing method that will be developed in further work. It can even be used as a new fluorescent material, is possible to change aptamers for specific sensing of diverse analytes like other metal ions, antigens, and other molecules.
Conflicts of interest
There are no conflicts to declare.Acknowledgements
We acknowledge the Consejo Nacional de Ciencia y Tecnología (CONACyT) for financial support to carry out the studies. The authors further acknowledge Universidad Autónoma de Nuevo León (award number 236-CE-2022) for support.Notes and references
- M. Kang, Z. Hua, W. Zhenglu, C. Haorui, Z. Kuankuan, L. Xiqing and Y. Zhugen, Biosens. Bioelectron., 2020, 148, 111785 CrossRef PubMed.
- E. Ali, K. Nafiseh and R. Behzad, Biosens. Bioelectron., 2016, 77, 499 CrossRef PubMed.
- L. Olga, C. Rogelio, P. Nadia, A. Yolanda, B. Melissa and O. Diana, Rev. Int. Contam. Ambient., 2017, 33, 281 CrossRef.
- F. Michael, K. Siegfried, B. Claudia, H. Nina, B. Stefano and K. Micheline, Mutat. Res., Rev. Mutat. Res., 2020, 786, 108342 CrossRef PubMed.
- D. Madhusnata and C. Tulika, Drug Chem. Toxicol., 2009, 32, 169 CrossRef PubMed.
- M. Guérard, M. Baum, A. Bitsch, G. Elsenbrand, A. Elhajouji, B. Epe, M. Habermeyer, B. Kaina, H. J. Martus, S. Pfuhler, C. Schmitz, A. Sutter, A. D. Thomas and C. Ziemann, Mutat. Res., Rev. Mutat. Res., 2015, 763, 181 CrossRef PubMed.
- ALICIA, https://alicia.concytec.gob.pe/vufind/Record/UUNI_8f393e64114bd0f0b14d64789f962598, accessed August 2022.
- S. Zeki, T. Milad, K. Hasan, O. Cleva, H. Niko and Y. Meral, Microchim. Acta, 2019, 186, 563 CrossRef PubMed.
- Q. Taiping, Z. Kaiwu, Q. Zhihe, W. Zuan, L. Caicheng, Z. Peng, H. Haizhi and F. Bo, Microchim. Acta, 2019, 186, 670 CrossRef PubMed.
- D. Junling, J. Xiaochen, N. Shouqing, Y. Min and Z. Jinhua, Talanta, 2011, 85, 1738 CrossRef PubMed.
- W. Yue, L. Liwei, W. Qian, H. Siyi, Z. Peng, S. Jing and Z. Jing, Nanotechnology, 2015, 27(1), 015705 Search PubMed.
- D. Weilin, L. Lei, Y. Li, Q. Aimiao and L. Aihui, Sci. Rep., 2017, 7, 11451 CrossRef PubMed.
- R. Jeffrey, C. Michael, K. Mattew, R. Pamela and F. Katherine, Metallomics, 2011, 3, 61 CrossRef PubMed.
- W. Shipping, G. Ce, W. Lijuan, X. Jianfeng and D. Hailiang, Sci. Rep., 2021, 11, 1216 CrossRef PubMed.
- Z. Zichuang, Z. Chen, X. Lina, C. Zhong, L. Xiaoxia, Z. Guangzhi, L. Na and D. Shuwang, J. Phys. Conf. Ser., 2021, 1775, 012008 CrossRef.
- A. Amirhossein and M. Hamid, Appl. Nanosci., 2021, 11, 849 CrossRef PubMed.
- F. Foroozan, S. Mojtaba, B. Ali, G. Mohammad and M. Farimah, Microchem. J., 2020, 158, 105168 CrossRef.
- W. Xiaoxuan, D. Wen, L. Xiaoxia, C. Zhenyu, Z. Zichuan, C. Zhong, Z. Guangzhi and X. Lina D. Shuwang, J. Alloys Compd., 2020, 825, 154052 CrossRef.
- L. Li, L. Lafeng, D. Yaping and Z. Hongyan, RSC Adv., 2017, 7, 10361 RSC.
- B. Paul, D. Ranjith and F. Giovanni, RSC Adv., 2017, 7, 2964 RSC.
- A. Oluwasesan and F. Patricia, Talanta, 2016, 146, 780 CrossRef PubMed.
- M. Mila, M. Aleksandra, J. Dragana, P. Ana, C. Gabriele, R. Sabrina, B. Aurelio, M. Marija, P. Jelena, S. Milena and J. Svetlana, Nanomaterials, 2021, 11, 1879 CrossRef PubMed.
- N. Thien, Organic electronics 1 Materials and Physical Processes, ISTE Wiley, London, 2021 Search PubMed.
- K. Sunil, T. Shalini, B. Shelza, S. Manju, K. Vijay, S. Sanjay, L. Shern-Long and K. Ravi, J. Electron. Mater., 2021, 50, 3986 CrossRef.
- A. Erdi, A. Yemliha, G. Mahir, Y. Mucahit, M. Evren and S. Savas, Renew. Energy., 2020, 145, 2192–2200 CrossRef.
- S. Gurpreet, C. Ralph, M. Mahyar, N. Fabiola, B. Daniele, Z. Haiguang, W. Zhiming and R. Federico, J. Power Sources, 2019, 436, 226849 CrossRef.
- Z. Yanting, R. Lei, L. Zhuwei, Z. Panlong, Z. Bo, F. Zhaozhong, W. Chen, Z. Xiaomeng, H. Jungang and S. Licheng, Trans. Tianjin Univ., 2021, 27, 348–357 CrossRef.
- C. Yifan, W. Dejun, L. Yanhong, Z. Xiaoxin and X. Tengfeng, J. Power Sources, 2019, 442, 227222 CrossRef.
- H. Samim, B. Susnata, G. Dicya, R. Samit and S. Sameer, Appl. Mater. Interfaces, 2019, 11(4), 4074–4083 CrossRef PubMed.
- V. Sandeep, K. Jyoti, P. Priyanka, C. Kumudini, N. Rekha, G. Kallol and S. Manmohan, J. Fluoresc., 2017, 27, 781 CrossRef PubMed.
- L. Ruifang, W. Dong, L. Yumin, Y. Li, Y. Zhongyuan and Y. Han, Nanoscale Res. Lett., 2017, 12, 1 CrossRef PubMed.
- S. Ward, G. Solrun, E. Wiel and H. Arjan, J. Am. Chem. Soc., 2017, 139, 13208 CrossRef PubMed.
Footnotes |
| † Na3AsO3 is soluble in water, and As oxidation state 3+ is maintained in various pH values. |
| ‡ n represents variable amounts of LCIS and CuCl2 applied to determine the best molar ratio that gives the smaller crystallite diameter. |
| This journal is © The Royal Society of Chemistry 2023 |

