 Open Access Article
Controllable structural and optical properties of NaYF4:Tm, Yb microparticles by Yb3+ doping for anti-counterfeiting
Vuong Thanh Tuyen†
ab,
Bui Q. V. Huy†ab,
Nguyen Ba Tong ab,
Tran Thi Ngoc Lamcde,
Maurizio Ferraric,
Cao Thi My Dungab,
Ung Thi Dieu Thuyf and
Tran T. T. Van
 *ab
*ab
aFaculty of Materials Science and Technology, University of Science, Vietnam National University Ho Chi Minh City, Vietnam. E-mail: tttvan@hcmus.edu.vn
bVietnam National University Ho Chi Minh City, Vietnam
cIFN-CNR CSMFO Lab. and FBK Photonics Unit, Via alla Cascata 56/C Povo, 38123, Trento, Italy
dDepartment of Physics, Politecnico di Milano, Piazza Leonardo da Vinci 32, 20133, Milano, Italy
eDepartment of Materials Technology, Faculty of Applied Science, Ho Chi Minh City University of Technology and Education, Vo Van Ngan Street 1, Thu Duc District, 720214, Ho Chi Minh City, Vietnam
fInstitute of Materials Science, Vietnam Academy of Science, and Technology, 18 Hoang Quoc Viet, Cau Giay, Hanoi, Vietnam
First published on 26th June 2023
Abstract
Hexagonal NaYF4:Tm, Yb upconversion (UC) phosphors with excellent UC luminescence quantum efficiency and chemical stability meet demands for applications in bioimaging and anti-counterfeiting printing. In this work, a series of NaYF4:Tm, Yb upconversion microparticles (UCMPs) with different concentrations of Yb were synthesized by a hydrothermal method. Then, the UCMPs become hydrophilic through surface oxidation of the oleic acid (C-18) ligand to azelaic acid (C-9) using the Lemieux–von Rodloff reagent. The structure and morphology of UCMPs were investigated by X-ray diffraction and scanning electron microscopy. The optical properties were studied using diffusion reflectance spectroscopy and photoluminescent spectroscopy under 980 nm laser irradiation. The emission peaks of the Tm3+ ions are 450, 474, 650, 690, and 800 nm, attributed to the transitions from the excited state to ground state 3H6. These emissions are the results of two or three photon absorption through multi-step resonance energy transfer from excited Yb3+, confirmed via a power-dependent luminescence study. The results show that the crystal phases and luminescence properties of the NaYF4:Tm, Yb UCMPs are controlled by changing the Yb doping concentration. The printed patterns are readable under the excitation of a 980 nm LED. Moreover, the zeta potential analysis shows that the UCMPs after surface oxidation are water dispersible. In particular, the naked eye can observe the enormous upconversion emissions in UCMPs. These findings indicated that this fluorescent material is an ideal candidate for anti-counterfeiting and biological applications.
Introduction
Studies on rare earth (RE)-doped upconversion (UC) phosphors have attracted the attention of researchers and developed rapidly owing to their abundant applications in solid-state lasers, three-dimensional flat-panel displays, low-intensity infrared (IR) imaging, optical fiber-based telecommunications, and especially anti-counterfeiting, bio-probes and bioimaging.1–4 Compared with the traditionally used security ink and biological labels such as various organic dyes, metal complexes, and semiconductor quantum dots (QDs), RE-doped phosphor materials possess excellent luminescent characteristics consisting of abundant emissions ranging from visible to near IR, significant Stokes shift, sharp emission peaks, and long fluorescence lifetime, low toxicity, high thermal stability, long durability, and negligible photobleaching, etc.4,5 Moreover, some UC phosphors have excitation and emission lights located within the NIR spectral range of 750–1000 nm (NIR-NIR UC emission), considered the “window of optical transparency” for biological tissues with a relatively high tissue penetration depth.For these reasons, (RE)-doped UC phosphors were synthesized by many methods to replace QDs, such as co-precipitation, hydrothermal, thermal decomposition, etc.6–9 To obtain high up-conversion efficiency, choosing a host with low phonon energy is necessary to produce high luminous efficiency for dispersing RE ions. Due to their desirable features, such as low phonon energy, low-temperature synthetic route, and high refractive index, the fluorides-based host has been widely researched as an effective luminous matrix among the many classes of host materials. NaYF4:Tm, Yb upconversion microparticles (UCMPs) are constituted by NaYF4 host and a pair of Tm and Yb ions, typically Yb3+ ions acting as a sensitizer, and Tm3+ ions playing the role of emitters. This material exhibits outstanding applications such as photodetectors in NIR region,10 photocatalyst,11–13 biosensors,14–16 and anti-counterfeit printing.3,17 In addition, surface modification with various ligands has been used to improve the dispersibility and colloidal stability of NaYF4 UCMPs and the conjugation of UCMPs with biomolecules, polymers, etc.9,18–23 Thus, these modified UCMPs have more potential uses in fluorescent cell imaging, drug delivery, and optical temperature monitoring.
Until now, several articles have concentrated on investigating the influence of factors such as chelator, reaction time, and Yb3+/Tm3+-doped concentrations on the crystal structure and morphology of NaYF4:Tm, Yb materials.7,24 However, there is still a lack of studies about the impact of doping contents on the luminescent properties of these materials, wherein the emission efficiency is one crucial factor that decides their potential applications.
In this work, the effects of Yb concentrations on structural and optical properties were investigated in detail. In particular, the oxidation of oleic acid makes UC particles hydrophilic with plenty of carboxyl groups. This surface functionalization process improves water dispersion and the conjugation ability with biomolecules of UCMPs. The emission mechanism of the NaYF4:Tm, Yb system was also proposed and clearly explained. In addition, polyvinyl alcohol (PVA) based printing inks were also developed for screen printing in security applications.
Experimental and characterization
Sample preparation
| RE(NO3)3 + NaOH → RE(OH)3 + 3NaNO3 | (1.1) |
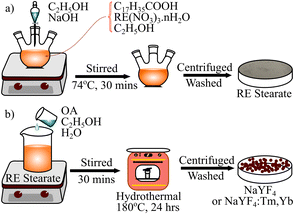
| RE(OH)3 + 3C17H35COOH → (C17H35COO)3 RE + 3H2O (with RE: Y, Tm, or Yb) | (1.2) |
Next, the hydrothermal method synthesized the NaYF4:Tm, Yb UCMPs at 180 °C for 24 hours using oleic acid (OA) as a surfactant substance. Then, the products were washed with ethanol, deionized, and dried at 100 °C for 24 hours to obtain the white powders. These powders illuminate the intense blue and NIR emission under a LED of 980 nm.
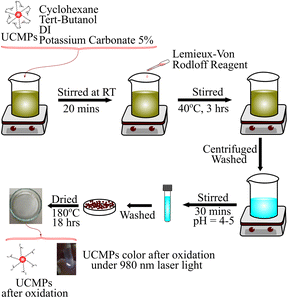
As described in Fig. 2, firstly, 0.02 g of UCMPs, 20 mL cyclohexane, 14 mL tert-butanol, 2 mL DI, and 0.95 mL K2CO3 5% were added into a becher and magnetic stirred at room temperature for 20 minutes to obtain mixture A. Then, a mix of 4 mL Lemieux–von Rodloff reagent solution consisting of KMnO4:NaIO4 was slowly added into mixture A to form a purple iridescent color. This solution was continued stirring at 40 °C for 3 hours. Then, they were washed with DI, acetone, and ethanol and collected by centrifugation at 4900 rpm for 10 minutes.
The sample was dispersed in 10 mL of HCl solution (pH = 4–5) combined with magnetic stirring for 30 minutes to eliminate produced MnO2 and residual KMnO4, then collected by centrifugation of 4900 rpm for 15 min. Finally, the product was washed twice with DI and dried at 80 °C for 16 hours. The UCMPs after oxidation are named OUCMPs.
![[thin space (1/6-em)]](https://www.rsc.org/images/entities/char_2009.gif) :
:![[thin space (1/6-em)]](https://www.rsc.org/images/entities/char_2009.gif) EG = 5
EG = 5![[thin space (1/6-em)]](https://www.rsc.org/images/entities/char_2009.gif) :
:![[thin space (1/6-em)]](https://www.rsc.org/images/entities/char_2009.gif) 1. To disperse the pigment well in the PVA, OUCMPs were added into the PVA solution with a ratio of 6 mg mL−1 and ultrasonicated at 50 °C for 1 hour. Fluorescent ink solutions exhibit suitable viscosity for screen printing.
1. To disperse the pigment well in the PVA, OUCMPs were added into the PVA solution with a ratio of 6 mg mL−1 and ultrasonicated at 50 °C for 1 hour. Fluorescent ink solutions exhibit suitable viscosity for screen printing.The screen-printing frame was used to print the patterns with a width and height of 1.5 × 1.5 cm on paper. No visible images were seen under normal light, but the blue patterns were observed under exposure to a 980 nm excitation.
Characterization
The structural properties and vibrations of groups were investigated using Raman and Fourier transform infrared spectroscopy (FT-IR). These spectra were recorded on an Xplora PLUS Raman spectrometer (Horiba-France) and a Bruker Vertex70 spectrometer.In addition, studies of the structural properties were also carried out through X-ray Diffraction (XRD) patterns under Cu Kα radiation (λ = 1.5406 Å), voltage 40 kV, current 40 mA of a Bruker D8-Advance diffractometer. The crystallite size D was determined using the Scherrer equation,
 | (1.3) |
 , in which d is a distance between crystal planes (hkl).
The morphology of UCMPs is studied under Scanning Electron Microscopy (SEM) of JEM-400 (JEOL, Japan) with a voltage of 100 kV. Zeta potential was detected by Malvern Instruments Ltd Zetasizer Nano ZS 90.
The NIR absorption spectra of samples were determined using a UV-VIS-NIR spectrophotometer JASCO V-780 using an integrating sphere. The upconversion emission measurements were performed under excitation at 980 nm using a diode laser. The upconversion emission signal was collected and analysed by Jobin Yvon, Spec mod. 1401, double grating monochromator with resolution in the visible region of 5 cm−1, photon counting measurements regime. All measurements were performed under the same conditions at room temperature.
Results and discussion
Structure and morphology
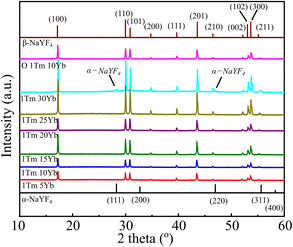
XRD, Raman spectroscopy, and SEM images were utilized to study the structure and morphology of NaYF4:Tm, Yb UCMPs systems. XRD patterns of NaYF4:1TmxYb UCMPs are presented in Fig. 3. The pattern of 1Tm5Yb sample appears peaks at 2θ = 29.95°; 30.79°; 34.69°; 39.61°; 43.42°; 46.84°; 53.56° and 53.59° corresponding to (110), (101), (200), (111), (201), (210), (102) and (300) planes of hexagonal structure of β-NaYF4 (according to JCPDS 16-0334 standard). No peaks of α phase cubic structure and no appearance of intermediate or doped phases are observed in this pattern. The patterns with different Yb3+ concentrations from 5 mol% to 30 mol% reveal the peaks of the hexagonal structure. In addition, the appearance of two weak peaks in the 1Tm30Yb pattern at 2θ = 28.3° and 47° corresponding to planes (111), (220) of the cubic structure implies that a high doping content of 30 mol% Yb controls the crystal phase transformation of NaYF4 from cubic to hexagonal. All findings exhibit that the doping range of 5 mol% and 30 mol% Yb almost does not affect on the hexagonal structure of NaYF4.The crystal sizes were deduced from Scherrer's formula and displayed in Fig. 4. The calculated results show that the presence of Tm, Yb ions leads to a negligible increase of NaYF4 crystallite size from 50 nm to 61 nm and lattice parameters (a, c) decreased slightly as a function of Tm3+/Yb3+ doping concentrations. This finding suggests that Tm3+–Y3+, Yb3+–Y3+ substitutions occurred. The Tm3+, Yb3+ dopants with a radius of rEr3+ = 0.881 Å, rYb3+ = 0.87 Å are a little bit smaller than those of Y3+ ions (rY3+ = 0.9 Å) in the host matrix, so the substitution of Tm3+, Yb3+ for Y3+ ions cause a compressive strain. As a result, the lattice constants of NaYF4 crystals in co-doped samples slightly decreased, and the NaYF4 crystal size increased. However, the crystallite size and the lattice parameters a and c of NaYF4 are almost unchanged for surface oxidation of UCMPs because the modification process only occurs on the surface of UCMPs.
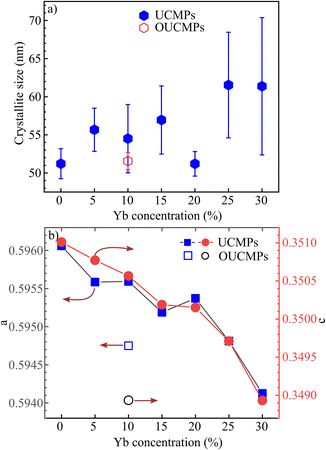 | ||
| Fig. 4 (a) Crystallite size and (b) lattice constants a, c of NaYF4 as a function of Yb concentrations. | ||
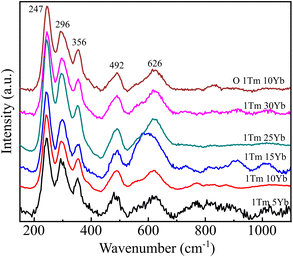
Raman spectroscopy was used to investigate the phonon bands of the NaYF4 crystals and the vibrations of organic groups in samples. Fig. 5 shows the Raman spectra of samples NaYF4:1TmxYb as a function of Yb3+ concentrations. The Raman spectrum of the 1Tm5Yb sample displays five prominent peaks from 200–650 cm−1. Three dominant peaks around 250 and 360 cm−1 are the characteristic hexagonal crystal structure of NaYF4. Peaks at 492 and 626 cm−1 were assigned to the Na–F bonding vibrational frequencies.27–29 Nevertheless, two dominant broad bands around 275 cm−1 and 745 cm−1 attributed to the cubic phase of NaYF4 are not observed in all spectra.30 An increase in Yb concentrations does not affect the crystal structure of NaYF4. The NaYF4 host remains in the hexagonal phase. The typical bands of α-NaYF4 not detected in the 1Tm30Yb sample can be due to the small crystal volume of the cubic phase. This behavior reveals that the hexagonal phase is more dominant than the cubic structure. This finding in Raman spectra is well correlated with the XRD data.
The Raman spectrum of surface-modified sample ONaYF4:1Tm10Yb was also recorded and inserted in Fig. 5. Besides the characteristic crystal peaks of the β-NaYF4 host, no prominent peaks of organic groups as well as of α-NaYF4 were observed.
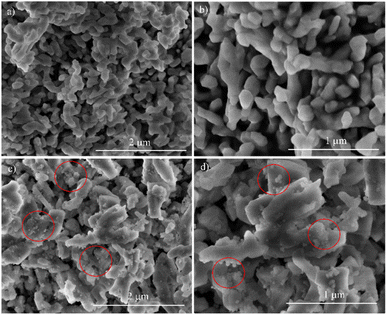
SEM images of representative samples with 20 mol% and 30 mol% Yb were recorded and presented in Fig. 6.
The SEM images of 1Tm20Yb show the morphology of micro blocks with the size from one to several hundred nanometers. However, SEM images of the 1Tm30Yb exhibit two kinds of morphologies: micro blocks and small particles of 30, 50 nm. Moreover, the XRD data also reveals that the 1Tm30Yb sample has a hexagonal crystal structure and a part of cubic crystals, wherein 1Tm20Yb has only the hexagonal crystals. Thus, the micro blocks are contributed by β-NaYF4, and small particles are α-NaYF4. This finding is according to that obtained by other authors.31,32
Surface functionalization study
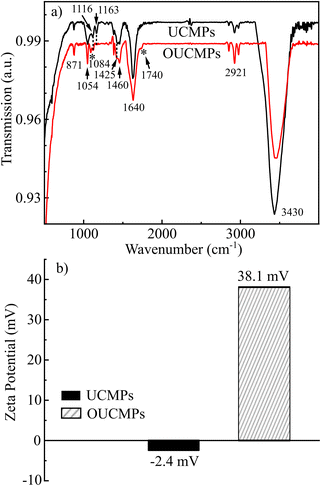
FT-IR spectra were monitored to investigate the existence of organic bonds on the surface of UCMPs and OUCMPs presented in Fig. 7a.For the spectrum of UCMPs, the broad bands located at 3430 cm−1 and 1640 cm−1 correspond to the O–H stretching and bending vibrations of residual molecular water in the samples. The appearance of bands at 2930 and 2680 cm−1 relates to C–H stretching. The peaks at 1058 cm-1, 1163 cm−1, and 1436–1460 cm−1 attributed to the stretching vibration of the C–O, asymmetric, and symmetric carboxylate groups (COO) stretching modes, respectively. After the surface modification by oxidation, the profile of its FT-IR spectrum changed, where the characteristic peaks corresponding to COO− groups at 1163 and 1425 cm−1 decrease in intensity. A new peak appeared at 1740 cm−1, ascribed to the symmetrical stretching νs(C![[double bond, length as m-dash]](https://www.rsc.org/images/entities/char_e001.gif) O) vibration of COOH. This is an indication of a successful oxidation process. Modifying carboxyl groups onto the surface of UCPMs guarantees the mono-dispersibility of the UCMPs in polar solvents and provides plenty of functional groups for further biomolecule conjugation. This step spreads the potential use of UCMPs in anti-counterfeiting printing, bioimaging, fluorescence sensors, etc.
O) vibration of COOH. This is an indication of a successful oxidation process. Modifying carboxyl groups onto the surface of UCPMs guarantees the mono-dispersibility of the UCMPs in polar solvents and provides plenty of functional groups for further biomolecule conjugation. This step spreads the potential use of UCMPs in anti-counterfeiting printing, bioimaging, fluorescence sensors, etc.
The dispersion stability was also studied by zeta potential measurement. Zeta potential shows a value of −2.4 mV for NaYF4:Tm, Yb dispersed in DI (Fig. 7b). This finding reveals that the NaYF4:Tm, Yb colloid systems are unstable and tend to coagulate. However, after the oxidation surface, OUCMPs have a zeta potential of 38.1 mV. The value is sufficiently high to stabilize a dispersion. This finding implies that the modified UCMPs are a suitable pigment for preparing water-based printing inks.
Optical properties
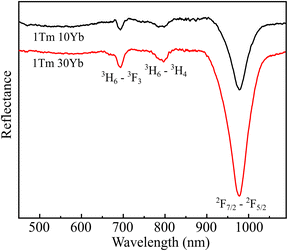
UV-Vis Diffuse Reflectance (DRS) spectroscopy was used to determine the absorption bands of samples. Fig. 8 presents the DRS spectra of 1Tm10Yb and 1Tm30Yb powders. For the 1Tm10Yb powder, the DRS spectrum exhibited absorption peaks at 692 nm and 790 nm, corresponding to the transitions from 3H6 ground state to 3F3 and 3H4 levels of Tm3+ ions. Besides the characteristic absorption peaks of Tm3+, the band at 980 nm was super strong, attributed to the transition 2F7/2–2F5/2 of Yb3+, which indicates the large absorption cross-section at NIR regions of Yb3+. This peak intensity increases as a function of Yb3+ concentrations. Moreover, this energy of Yb3+ ions coincides with the 3H6–3H5 transition of Tm3+ so that they will be the most suitable sensitizers for Tm3+ ions in the Tm, Yb co-doped NaYF4 systems.Photoluminescence (PL) spectra of samples as a function of Yb concentrations in visible and NIR regions under excitation at 980 nm was monitored and presented in Fig. 9a and b. The PL spectrum of 1Tm5Yb shows the emission band at 450 nm, 474 nm, 650, and 694 nm, which were assigned to the transitions of 1D2 → 3F4, 1G4 → 3H6, 1G4 → 3F4 and 3F3 → 3H6 of Tm3+, respectively. In addition, the PL spectrum also presents a strong emission at 800 nm, attributed to the transition of 3H4 → 3H6 of Tm3+ ions. The intensity of the NIR band is more vigorous than that of blue emission, a factor of 25 times.
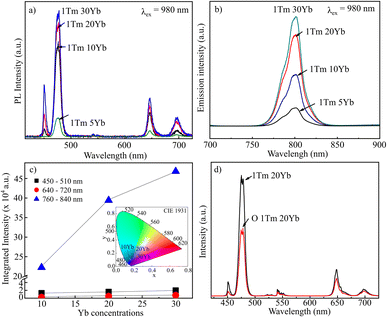 | ||
| Fig. 9 PL spectra of NaYF4:1Tm, xYb with x = 5, 10, 20 and 30 mol% (a and b); integrated intensity and CIE of samples (c); PL spectra of 1Tm20Yb and O1Tm20Yb (d). | ||
An increase in Yb doping concentrations results in a rise of the luminescence intensity in both visible and NIR emissions, as presented in Fig. 9c. With an increase in the Yb3+ doping content, the more excited Yb ions transfer their energy to Tm ions for emitting. However, high doping will lead to concentration quenching. Moreover, at a high Yb3+ content, for example, 30 mol% as in the case of 1Tm30Yb sample, there is a competition of crystal phases between α-NaYF4 and β-NaYF4. Meanwhile, the β-phase crystals showed higher luminescence intensity than α-phase and α/β-phase crystals since the β-phase is less symmetric than the α- and α/β-phases.33 As a result, the increased magnitude of upconversion emission depends nonlinearly on the Yb3+ content. The higher the Yb3+ concentration, the lower the enhancement of Tm3+ emissions. The oxidation process leads to a reduction of the emission intensity by a factor of 2 times (Fig. 9d). However, surface modification is necessary to improve the dispersion stability and make UCMPs biocompatibility and easy to conjugate with different molecules for broadening the UCMPs' applications in anti-counterfeit, bioimaging, etc.
When Yb concentrations rise, the increased magnitude of NIR emission is more significant than that of visible, which implies that the energy transfer for NIR emission is more efficient than others. Nevertheless, the CIE chromaticity coordinates (x = 0.158, y = 0.114) taken from PL data of the UC emission spectra of samples using Origin software show the color of all contents to be blue in the visible range, as shown in Fig. 9d.
To investigate the mechanism of UC emission in NaYF4:Tm, Yb systems, the PL spectra were monitored as a function of excitation power and displayed in Fig. 10a and b. The relation between the emission intensity and power obeys I ∝ Pn, in which I, P, and n are the UC emission intensity, excitation power, and number of required pumping photons, respectively. The fitting curves and n values are shown in Fig. 10 (c–f). The n values are around 1.5 for emissions at 800 nm and 2.0 for emissions at 477 nm and 647 nm. This finding implies that Tm3+ ions absorb more photons to emit visible emissions than NIR light.
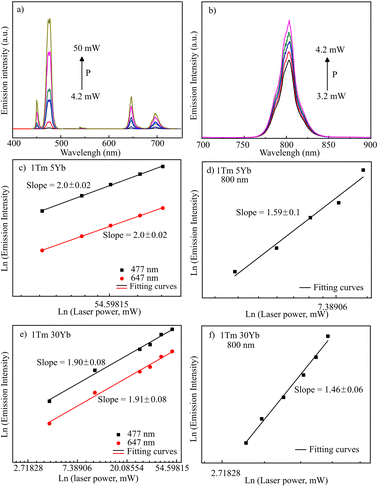 | ||
| Fig. 10 PL spectra as a function of laser power (a and b); the fitting curves of emission intensity and laser power of 1Tm5Yb (c and d) & 1Tm30Yb (e and f) samples. | ||
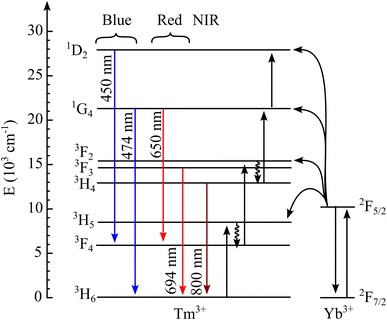
Based on the DRS spectra and PL data study, the UC process can occur through multiple absorptions or energy transfer (ET). Fig. 11 shows the energy level diagram of Tm3+ and Yb3+ ions and the UC process. The UC mechanism could be described as follows: first, under the 980 nm laser excitation, Yb3+ ions absorbed energy and excited from the ground state 2F7/2 to the excited state 2F5/2. Because the 3H5 level of Tm3+ ions matches state 2F5/2 of Yb3+, the Yb3+ ions transfer their energy efficiently to excite the Tm3+ ions from the ground state 3H6 to the higher excited state 3H5. The non-radiative decay occurred from 3H5 to the energy level of 3F4. Then, a second photon is absorbed, causing the transition from level 3F4 to level 3F2 and then a nonradiative decay to the level 3H4 due to the multi-phonon relaxation. The recombination of electrons between the 3H4 and 3H6 states emits an intense light at 798 nm. Meanwhile, the 474 and 650 nm emission requires much more energy to pump Tm ions from the excited 3H4 state to the higher excited states 1G4 and 1D2. That is why the n value corresponding to visible emission is always bigger than that of NIR emission for all Yb concentrations. Subsequently, the electrons at the 1G4 level depopulating to the ground state 3H6 and the 3F4 metastable state emit weak blue and red emissions at 474 and 650 nm, respectively. Moreover, the level 3F3 of Tm3+ decays to the 3H6 level, yielding red UC luminescence at 694 nm.34
Application of UCMPs in screen printing
After the preparation of the ink consisting of OUCMNs as a pigment, PVA, and solvents, the screen printing was performed on a paper substrate. The patterns with the size of 1.5 × 1.5 cm are invisible under daylight and illuminate the blue light under excitation at 980 nm of LED (Fig. 12a). In addition, these materials can be used as a blue pigment in RGB color systems (RGB: red, green, and blue). Fig. 12c displays the printed patterns from the fluorescent ink consisting of NaYF4:1Tm,30Yb and NaYF4:1Er, 20Yb with a ratio of 90![[thin space (1/6-em)]](https://www.rsc.org/images/entities/char_2009.gif) :
:![[thin space (1/6-em)]](https://www.rsc.org/images/entities/char_2009.gif) 10 (% w/w). The designs are white under ambient light. However, they emit cyan color under the excitation of a 980 nm LED. These experiments suggest that the NaYF4:Tm, Yb UCMPs can be utilized as one main component of the RGB color model in fluorescence labelling anti-counterfeiting.
10 (% w/w). The designs are white under ambient light. However, they emit cyan color under the excitation of a 980 nm LED. These experiments suggest that the NaYF4:Tm, Yb UCMPs can be utilized as one main component of the RGB color model in fluorescence labelling anti-counterfeiting.
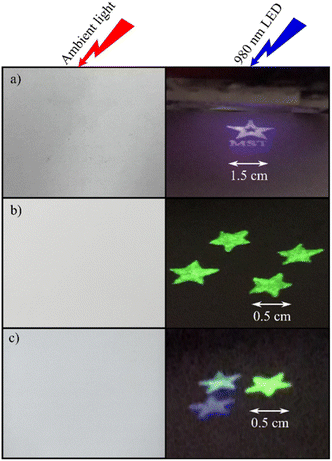 | ||
Fig. 12 Screen printing patterns of NaYF4:1Tm,30Yb (a); NaYF4:1Er,20Yb (b); the combination of NaYF4:1Tm,30Yb and NaYF4:1Er,20Yb with a ratio of 90![[thin space (1/6-em)]](https://www.rsc.org/images/entities/char_2009.gif) : :![[thin space (1/6-em)]](https://www.rsc.org/images/entities/char_2009.gif) 10 (% w/w) (c). 10 (% w/w) (c). | ||
Conclusions
The hydrophilic NaYF4:Tm, Yb UCMNs were prepared by a combination of the hydrothermal method and the oxidation of oleic acid using the Lemieux–von Rodloff reagent. The crystallite size and lattice parameters a, c are negligibly influenced by Yb concentrations even at 30 mol% Yb3+. However, at Yb contents as high as 30 mol% NaYF4:Tm, Yb systems form cubic and hexagonal structures instead of only the hexagonal phase as at the lower concentrations of Yb3+. Moreover, the blue, red, and NIR emissions of Tm3+ ions are enhanced as a function of Yb3+ contents. The luminescence mechanism of Tm3+ ions obeys the absorption of two or three photons depending on emissions in the NIR or visible region. The emission intensity of the 800 nm band is stronger than blue emission a factor of 25 times. The hydrophilic OUCMPs show a high dispersity due to the formation of free carboxylic acid. The printed patterns from NaYF4:Tm, Yb pigment, and PVA additive illuminate blue under excitation at 980 nm. Moreover, the emission of NaYF4:Tm, Yb OUCMNs belongs to one of three primary colors (red, green, blue). Thus, NaYF4:Tm, Yb has excellent potential in anti-counterfeiting ink and biomedical applications, such as bioimaging, biosensing, and targeted therapy.Author contributions
Vuong Thanh Tuyen: synthesize, formal analysis, investigation; Bui Q. V. Huy: synthesize, analysis, writing – original draft; Cao Thi My Dung: formal analysis, investigation, writing – review & editing; Nguyen Ba Tong: synthesize, measure; Tran Thi Ngoc Lam: review & editing; Maurizio Ferrari: review & editing; Ung Thi Dieu Thuy: measure, analysis; Tran T. T. Van: conceptualization, investigation, writing – review & editing, supervision.Conflicts of interest
There are no conflicts to declare.Acknowledgements
This research is funded by the Vietnam National University Ho Chi Minh City (VNU-HCM) under grant number VL2022-18-05.References
- T. M. Dung Cao, T. T. Giang Le, S. Turrell, M. Ferrari, Q. V. Lam and T. T. Van Tran, Molecules, 2021, 26, 1041 CrossRef PubMed.
- G. Gao, A. Turshatov, I. A. Howard, D. Busko, R. Joseph, D. Hudry and B. S. Richards, Adv. Sustainable Syst., 2017, 1, 1600033 CrossRef.
- J. Zhang, C. Cao, J. Wang, S. Li and Y. Xie, ACS Appl. Nano Mater., 2022, 5, 16642–16654 CrossRef CAS.
- R. Joshi, R. S. Perala, S. B. Shelar, A. Ballal, B. P. Singh and R. S. Ningthoujam, ACS Appl. Mater. Interfaces, 2021, 13, 3481–3490 CrossRef CAS PubMed.
- Z. Gerelkhuu, Y. I. Lee and T. H. Yoon, Nanomaterials, 2022, 12, 3470 CrossRef CAS PubMed.
- J. Reyes Miranda, F. de, A. García Murillo, J. Oliva and C. R. García, Mater. Res. Bull., 2019, 119, 110531 CrossRef CAS.
- Z. Chen, M. Fu, B. Zheng, D. Zhu and Z. Chen, J. Mater. Sci.: Mater. Electron., 2021, 32, 6269–6282 CrossRef CAS.
- H. Li, X. Shi, X. Li and L. Zong, Opt. Mater., 2020, 108, 110144 CrossRef CAS.
- L. E. Mackenzie, D. Alvarez-Ruiz and R. Pal, R. Soc. Open Sci., 2022, 9, 211508 CrossRef CAS PubMed.
- M. K. Thakur, A. Gupta, M. Y. Fakhri, R. S. Chen, C. T. Wu, K. H. Lin and S. Chattopadhyay, Nanoscale, 2019, 11, 9716–9725 RSC.
- Y. Liu, S. Cheng, S. Zhan and X. Wu, Inorg. Chem., 2021, 60, 5704–5710 CrossRef CAS PubMed.
- A. A. Ansari and M. Sillanpää, Renewable Sustainable Energy Rev., 2021, 151, 111631 CrossRef CAS.
- M. S. Ghorashi, H. R. Madaah Hosseini, E. Mohajerani, M. Pedroni and R. Taheri Ghahrizjani, J. Phys. Chem. C, 2021, 125, 13788–13801 CrossRef CAS.
- X. Xu, M. Fu, M. Yang, B. Hu, J. Yang, W. Gui and J. Guo, New J. Chem., 2022, 46, 7385–7394 RSC.
- J. Zuo, W. Wang, D. Zhang, X. Wang, Y. Ma, P. Li, Y. Li, W. Sun, Y. Zhang, L. Tu, Y. Chang, Q. Li and H. Zhang, Appl. Surf. Sci., 2022, 575, 151701 CrossRef CAS.
- H. Chen, W. Tang, Y. Liu and L. Wang, Food Chem., 2022, 367, 130660 CrossRef CAS PubMed.
- D. Li, J. Mo, C. Wang, Z. Wu, A. Hao and J. She, Appl. Phys. A: Mater. Sci. Process., 2021, 127, 522 CrossRef CAS.
- S. Saha, R. G. S. Pala and S. Sivakumar, Cryst. Growth Des., 2018, 18, 5080–5088 CrossRef CAS.
- H. Li, X. Liu and X. Li, RSC Adv., 2019, 9, 42163–42171 RSC.
- Z. Chen, H. Chen, H. Hu, M. Yu, F. Li, Q. Zhang, Z. Zhou, T. Yi and C. Huang, J. Am. Chem. Soc., 2008, 130, 3023–3029 CrossRef CAS PubMed.
- G. Gao, D. Busko, R. Joseph, I. A. Howard, A. Turshatov and B. S. Richards, ACS Appl. Mater. Interfaces, 2018, 10, 39851–39859 CrossRef CAS PubMed.
- A. Sivaiah, S. Prusty and A. Parandhama, J. Indian Chem. Soc., 2023, 100, 100990 CrossRef CAS.
- M. Meng, T. Zhang, J. Wang, Z. Cheng, Z. Li, X. Qiao, J. Wen, U. R. Genger, W. Long and J. Ou, Opt. Mater., 2023, 136, 113389 CrossRef CAS.
- Y. Chen, S. Wen Xie, C. Tong, H. Hu Tan, L. Jian Xu, N. Li and J. Xiong Xu, Trans. Nonferrous Met. Soc. China, 2020, 30, 3333–3346 CrossRef CAS.
- T. M. D. Cao, T. T. G. Le, T. P. N. Nguyen, T. A. N. Dau, V. T. Nguyen and T. T. V. Tran, J. Mol. Struct., 2020, 1210, 128014 CrossRef CAS.
- S. Saha, R. G. S. Pala and S. Sivakumar, Cryst. Growth Des., 2018, 18, 5080–5088 CrossRef CAS.
- A. Lakshmanan, R. A. Akasov, N. V. Sholina, P. A. Demina, A. N. Generalova, A. Gangadharan, D. K. Sardar, K. B. Lankamsetty, D. A. Khochenkov, E. V. Khaydukov, S. V. Gudkov, M. Jayaraman and S. Jayaraman, Nanomaterials, 2021, 11(9), 2234 CrossRef CAS PubMed.
- S. Namagal, N. V. Jaya, M. Muralidharan and S. Sumithra, J. Mater. Sci.: Mater. Electron., 2020, 31, 11398–11410 CrossRef CAS.
- S. Wilhelm, T. Hirsch, W. M. Patterson, E. Scheucher, T. Mayr and O. S. Wolfbeis, Theranostics, 2013, 3, 239–248 CrossRef CAS PubMed.
- D. T. Klier and M. U. Kumke, J. Mater. Chem. C, 2015, 3, 11228–11238 RSC.
- D. Yang, D. Chen, H. He, Q. Pan, Q. Xiao, J. Qiu and G. Dong, Sci. Rep., 2016, 6, 29871 CrossRef CAS PubMed.
- N. A. Bogachev, A. A. Betina, T. S. Bulatova, V. G. Nosov, S. S. Kolesnik, I. I. Tumkin, M. N. Ryazantsev, M. Y. Skripkin and A. S. Mereshchenko, Nanomaterials, 2022, 12(17), 2972 CrossRef CAS PubMed.
- H. Chen, P. Zhang, H. Cui, W. Qin and D. Zhao, Nanoscale Res. Lett., 2017, 12, 548 CrossRef PubMed.
- X. Yu, H. Zhang and J. Yu, Aggregate, 2021, 2, 20–34 CrossRef CAS.
Footnote |
| † Both authors contributed equally to this work. |
| This journal is © The Royal Society of Chemistry 2023 |

