 Open Access Article
Novel decorated aluminium(III) phthalocyanine complex with the application of MWCNTs on electrodes: electrochemical non-enzymatic oxidation and reduction of glucose and hydrogen peroxide†
Mounesh *a,
P. Manikantaa,
K. R. Venugopala Reddy
 b,
Manickam Selvaraj
 cd,
C. C. Vidyasagar
 e and
Bhari Mallanna Nagaraja
 *a
*a
aCentre for Nano and Material Science (CNMS), Jain (Deemed-to-be University), Jain Global Campus, Kanakapura, Bangalore, Karnataka 562112, India. E-mail: mounesh.m.nayak@gmail.com; bm.nagaraja@jainuniversity.ac.in
bDepartment of Studies and Research in Chemistry Vijayanagara Sri Krishnadevaraya University, Ballari – 583105, Karnataka, India
cDepartment of Chemistry, Faculty of Science, King Khalid University, PO Box 9004, Abha 61413, Saudi Arabia
dResearch Centre for Advanced Materials Science (RCAMS), King Khalid University, PO Box 9004, Abha 61413, Saudi Arabia
eDepartment of Studies and Research in Chemistry, Rani Channamma University, Belagavi – 591156, Karnataka, India
First published on 11th July 2023
Abstract
In this study, we performed the physicochemical and electrochemical characterization of a decorated macrocyclic aluminium(III) phthalocyanine complex (AlTMQNCAPc). Subsequently, the AlTMQNCAPc@MWCNT/GC electrode was used for the electrochemical detection of glucose and hydrogen peroxide (H2O2) by cyclic voltammetry (CV), differential pulse voltammetry (DPV), and chronoamperometry (CA). Moreover, the limit of detection, linear range, and sensitivity for glucose and H2O2 were investigated (CV: 2.5 nM L−1 and 25 nM L−1, 50–500 μM, 0.052 and 0.072 μA μmol cm−2; DPV: 3.1 nM L−1 and 18 nM L−1, 50–500 μM, 0.062 and 0.066 μA μmol cm−2 and CA: 10 nM L−1 and 20 nM L−1, 50–500 μM, 0.098 and 0.07 μA μmol cm−2, respectively). In addition, the AlTMQNCAPc@MWCNT/GC electrode showed good selectivity for the detection of glucose and H2O2 in the presence of common interfering substances, such as AA, DA, UA, glycine, L-cysteine, nitrite, Pb(II), Cd(II), Cu(II), Co(II), Hg(II), Zn(II), and glucose. For the detection of glucose and H2O2, the kinetic parameters, including the electron transfer coefficient and catalytic reaction rate constant, were also established. Finally, for usage in practical applications, the modified electrode was employed to achieve the quantitative detection of glucose and H2O2 in human urine and commercial samples of 3% H2O2, respectively.
1 Introduction
The metabolic oxidation of glucose should be properly maintained in all living beings; glucose is produced by green plants from the reduction of carbon dioxide.1 Insulin facilitates the movement of glucose from the bloodstream to the cells. The human body keeps the blood glucose levels between 4–8 mM (70–120 mg dL−1).2 Recently, numerous fluorescent nanoparticles have been used in biological applications as effective and promising substitutes for conventional fluorescent dyes.3,4 Diabetes is a main cause of various human health concerns, including problems with the kidneys, circulatory system, retina, and other organs. Diabetes is caused by abnormal blood sugar levels.5 Thus, the detection of analytes, such as hydrogen peroxide and glucose, have been extensively explored using enzyme-free electrochemical sensors owing to their major usefulness in numerous sectors. Patients must frequently check their blood sugar levels to manage their blood sugar. Alternatively, hydrogen peroxide (H2O2), a simple but crucial natural molecule, is widely employed as an oxidizing agent in the food and chemical sectors.6,7 Thus, glucose sensors are also being studied extensively together with H2O2 sensors. The blood sugar level is determined by the amount of glucose present in the human body. In addition, H2O2 serves as a precursor for the development of highly reactive and potentially dangerous hydroxyl radicals and is one of the most significant indicators of oxidative stress.8,9 Therefore, it is crucial for practical purposes to accurately measure glucose and H2O2. Numerous analytical methods, including titrimetry, spectrometry, fluorometry, chemiluminescence, and electrochemical approaches, have been used to measure glucose and H2O2.10–14 Among them, the electrochemical technique is promising owing to its greater sensitivity and selectivity, lower detection limit, quicker response time, improved long-term stability, and chip-based design.15Although phthalocyanine and its metal complexes have been well-known for several decades, which were first created as industrial dyes and pigments, they continue to attract interest due to their numerous noteworthy characteristics and wide range of potential applications. Presently, in-depth research is being conducted on phthalocyanines as multifunctional chemicals, which are important in both modern technology and medicine.16–21 The highly delocalized planar 18-electrons in phthalocyanines (Pcs) increase its electronic structure. Furthermore, these compounds are actively researched as materials of outstanding technical value because of their benefits, including exceptional stability, flexibility, and recyclability (use in semiconductor devices, solar cells, photosensitisers, nonlinear optics, etc.).22–24
In the current study, a unique multiwalled carbon nanotube (MWCNT) composite with aluminum(III) tetra methoxyquinoline–carboxamide phthalocyanine (Al(III)TMQNCAPc) on a modified glassy carbon electrode was synthesized and characterized (GCE). As observed by SEM, Al(III)TMQNCAPCs were visible on the surface of Al(III)TMQNCAPCs@MWCNTs. Furthermore, the synthesized materials were thoroughly characterized. Al(III)TMQNCAPCs@MWCNTs performed satisfactorily in electrochemical tests for the oxidation of glucose and reduction of H2O2. Based on these results, we fabricated a sensitive glucose sensor with good selectivity and long-term stability. The study of the H2O2 sensor revealed that it had a broad linear range, good sensitivity, and selectivity.
2 Experimental
2.1 Reagents
See ESI.†2.2 Characterization method
See ESI.†2.3 Synthesis
2.4 Preparation of modified electrodes
The GCE surface was polished to a mirror finish using 0.5 mm alumina slurries before its modification. Subsequently, it was completely cleaned with double-distilled water, sonicated for 5 min in acetone and 5 min in water, and dried in the air. Next, 1 mg of Al(III)TMQNCAPc@MWCNTs was dissolved in dry DMF solvent using ultrasonication for 10 min. The GCE was coated with 5 μL of the Al(III)TMQNCAPc@MWCNT suspension and allowed to air-dry at room temperature. This electrode was utilized for the simultaneous and independent voltammetric measurement of glucose and H2O2.3 Results and discussion
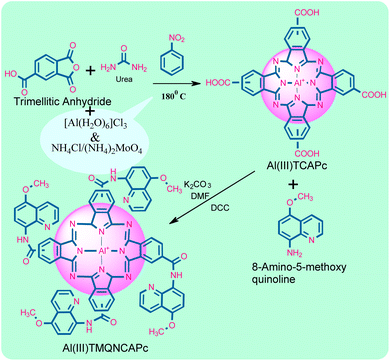
The Al(III)TMQNCAPc complex was produced by reacting the amine group of the ligand (2-amino-5-methoxyquinoline) with the carboxylic acid group of Al(III)TCAPc. Al(III)TMQNCAPc is a greenish compound, which is easily soluble in concentrated H2SO4 and DMSO. FT-IR, UV-vis, XRD, SEM, and thermogravimetric analyses were performed to describe and validate the synthesis of the Al(III)TMQNCAPc complex. The simultaneous and independent electrochemical detection of glucose and hydrogen peroxide was performed utilizing the methods of CV, DPV, and CA.All the synthetic aluminum phthalocyanine complexes had FT-IR spectra with peaks in the range of 500 to 4000 cm−1. The FTIR spectra of compounds (a), (b) and (c) are shown in Fig. S1,† where all the compounds show vibrational bands at 1540–1620 cm−1, which corresponds to the C![[double bond, length as m-dash]](https://www.rsc.org/images/entities/char_e001.gif) C stretch and 2870–3020 cm−1, corresponding to the C–H stretch. In the region of 3600–3400 cm−1 (–OH and –NH2), as shown in Fig. S1(a),† the carboxylic acid group of Al(III)TCAPc appeared at 3800–3200 cm−1 but Fig. S1(b)† shows the disappearance of the –COOH group and appearance of a peak for substituted amide group (Al(III)TMQNCAPc) at 3330 cm−1 (–CONH). Fig. S1(c)† shows the spectrum of Al(III)TMQNCAPc@MWCNTs, where a peak appeared in the region of 2941–2660 cm−1 (Ar–CH), the vibrations caused by the stretching of the (C
C stretch and 2870–3020 cm−1, corresponding to the C–H stretch. In the region of 3600–3400 cm−1 (–OH and –NH2), as shown in Fig. S1(a),† the carboxylic acid group of Al(III)TCAPc appeared at 3800–3200 cm−1 but Fig. S1(b)† shows the disappearance of the –COOH group and appearance of a peak for substituted amide group (Al(III)TMQNCAPc) at 3330 cm−1 (–CONH). Fig. S1(c)† shows the spectrum of Al(III)TMQNCAPc@MWCNTs, where a peak appeared in the region of 2941–2660 cm−1 (Ar–CH), the vibrations caused by the stretching of the (C![[double bond, length as m-dash]](https://www.rsc.org/images/entities/char_e001.gif) N) and (C
N) and (C![[double bond, length as m-dash]](https://www.rsc.org/images/entities/char_e001.gif) C) groups appeared at around 1635–1610 cm−1, a sharp peak in the region of 1566–1498 cm−1, corresponding to (C
C) groups appeared at around 1635–1610 cm−1, a sharp peak in the region of 1566–1498 cm−1, corresponding to (C![[double bond, length as m-dash]](https://www.rsc.org/images/entities/char_e001.gif) O), and a sharp peak for (C–Br) at 744 cm−1. Additionally, the bands at 1499, 1457, 1433, 1392, 1309, 1245, 1228, 1113, 1032, 884, 847, 844, 647, and 605 cm−1 correspond to the vibrational bands support the presence of functional groups in the Al(III)TMQNCAPc ring.
O), and a sharp peak for (C–Br) at 744 cm−1. Additionally, the bands at 1499, 1457, 1433, 1392, 1309, 1245, 1228, 1113, 1032, 884, 847, 844, 647, and 605 cm−1 correspond to the vibrational bands support the presence of functional groups in the Al(III)TMQNCAPc ring.
The UV-vis spectra of the Al(III)TCAPc and Al(III)TMQNCAPc systems show distinctive B and Q bands. In the case of Al(III)TCAPc, the Q-band appears in the range of 500–700 nm, while the B-band appears at 200–350 nm (Fig. S2,† inset a curve). The UV-vis studies of phthalocyanine exhibited two strong absorption peaks. Between them, the Q band in the range of 620–730 nm is attributed to the π–π* transition from the highest occupied molecular orbital (HOMO) to the lowest occupied molecular orbital (LUMO) in the Pc ring. The deeper π-level/LUMO transition, which occurs in the range of 300–350 nm, correspond to the B band (Fig. S2,† inset b curve).29–31 Fig. S2† depicts the UV-vis spectrum of the compound shown in Scheme 1 in dimethyl sulfoxide (DMSO) at 28 °C. The red and green colors of the complex exhibited a peak in the Q-band area and a shoulder peak between 570 and 625 nm, showing the effective aggregation of PC.
The powder X-ray diffraction study of Al(III)TCAPc, Al(III)TMQNCAPc, MWCNTs and Al(III)TMQNCAPc@MWCNTs was performed in the 2θ range of 5–60°, as shown in Fig. S3,† inset curves ((a) Al(III)TCAPc, (b) Al(III)TMQNCAPc, (c) MWCNTs and (d) Al(III)TMQNCAPc@MWCNTs). The crystal structure and size of the QDs were clarified by PXRD investigation. The replacement complex and parent PCs displayed the same patterns. However, compared to similar aluminum PCs, the patterns have a higher peak intensity throughout the complex. The crystallinity was described using powdered X-ray diffraction (PXRD) patterns.32,33 The diffraction pattern of Al(III)TMQNCAPc show sharps peaks at 7°, 8°, 15°, 24°, 30°, 46°, and 55° with slightly lower intensity, which was caused by the conjugation of the π-electrons, manipulating its stacking arrangement. The shapes of the X-ray diffraction patterns indicate that Al(III)TCAPc, Al(III)TMQNCAPc, MWCNTs and Al(III)TMQNCAPc@MWCNTs were crystalline in nature.34,35
The thermal stability and decomposition characteristics of the synthetic phthalocyanine compound and MWCNT composites were revealed by TGA tests. Fig. S4† depicts the thermogram for the thermal degradation of the phthalocyanines. The monomeric Al(III)TCAPc was shown to be stable up to 500 °C in the thermograms, but it subsequently began to breakdown in an air atmosphere at around 500 °C to 560 °C, which caused rapid weight loss, in accordance with the degradation of the core structure of the Al(III)TCAPc molecule (inset curve a). In comparison, the substituted Al(III)TMQNCAPc was found to be stable up to 650 °C (curve b), after which the Al(III)TMQNCAPc@MWCNT molecule began to breakdown in the air atmosphere between 600 °C to 650 °C (curve c). Due to the extended conjugation and delocalization of the π-electrons, Al(III)TMQNCAPc@MWCNTs exhibited superior thermal stability compared to Al(III)TMQNCAPc and MWCNTs. The stable TGA curve after 650 °C corresponds to the respective metal oxide formed after complete degradation of PCs.36–38
Subsequently, the morphology of the Al(III)TMQNCAPc and Al(III)TMQNCAPc@MWCNT composites was examined using field-emission scanning electron microscopy (FE-SEM). The FESEM images of Al(III)TMQNCAPc@MWCNTs, as shown in Fig. S5 and S6† at different magnifications, show that every particle in Al(III)TMQNCAPc is firmly linked to MWCNTs. As shown in Fig. S5(A–D),† the Al(III)TMQNCAPc molecules resemble pellet shapes. The successful incorporation of MWCNTs in Al(III)TMQNCAPc was proven by the observation of densely absorbed MWCNTs on its surface, as shown in Fig. S6(A–D).† The cross-section of Al(III)TMQNCAPc also contained MWCNTs, which were incorporated in the material. MWCNTs were evenly distributed over these structures, which resemble pellets. These results confirmed that MWCNTs were present on the surface of Al(III)TMQNCAPc. As presented in Fig. S5(A–D),† crystals in agglomerated form are visible in the SEM images of Al(III)TMQNCAPc and Al(III)TMQNCAPc@MWCNTs, which were detected at distinct stages at the μM and nM levels. This was further demonstrated by the powdered X-ray diffraction technique (ESI, Fig. S3†).
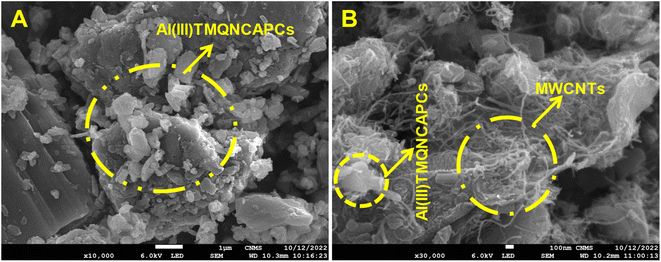
The substitution of aluminium(III) phthalocyanine resulted in an increase in the surface area accessible for electrons to store charge on the surface of the molecule. This is due to the agglomeration of MWCNTs on the surface of the molecule. Electron microscopy techniques were used to study the morphological characteristics of the two catalysts (Fig. 1A). The SEM image (Fig. 1A) of the Al(III)TMQNCAPc catalyst shows the presence of micrometer- and nanometer-sized agglomerated particles of black pearls (carbon spheres). Compared to the Al(III)TMQNCAPc catalyst, the composite multi-walled carbon nanotube-based catalyst (MWCNTs) exhibited a clearly distinct shape. The SEM image (Fig. 1B) of the Al(III)TMQNCAPc catalyst revealed the presence of individual, large micrometer-sized crystallites. However, more in-depth imaging further demonstrated the abundance of carbon nanotubes in the nanostructure of the crystallites.39
4 Electrochemistry
4.1 Charge transfer behavior of modified electrodes
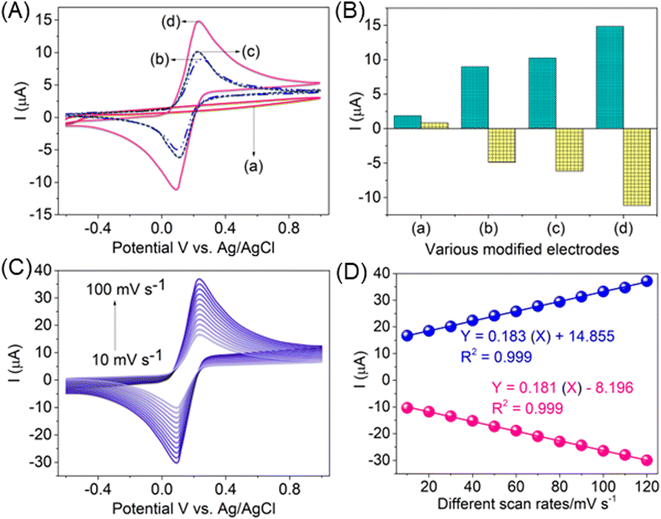
The overall electrochemical properties of the AlTMQNCAPc@MWCNT-GC electrode was investigated in 0.1 M KCl electrolyte containing 25 μM of K4/K3[Fe(CN)6]. As specified in Fig. 2A, inset curves a–d, the bare GCE showed no peak current without ferricyanide (a curve), whereas with ferricyanide, a redox peak current response was detected (b curve), with comparable high redox peak current responses for the AlTMQNCAPc-loaded GCE (c curve), and the maximum current peaks (anodic and cathodic peak currents) of the redox couple were recorded for the AlTMQNCAPc@MWCNT-GC electrode (d curve). The CVs were detected at a scan rate of 50 mV s−1 in the potential range of −0.60 to +1.0 V. The bigger redox currents for the AlTMQNCAPc@MWCNT/GC electrode can be attributed to the rapid transportation of electrons between the electrode surface and electrolyte solution. Fig. 2B displays the dependence of the redox currents on the different modified electrodes. Fig. 2C presents the CV results of the AlTMQNCAPc@MWCNT-GC electrode in the potential range of −0.60 to +1.0 V with an increase in the scan rate from 10 to 100 mV s−1. On increasing the scan rate with increasing high peak current responses, a linear plot of current vs. square root of the scan rate was obtained, as shown in Fig. 2D, with R2 = 0.999, which further clarifies the smooth and controlled transportation of electrons and can be attributed to the good linkage between MWCNTs and AlTMQNCAPc as well as with the surface of the GCE. Using this plot, the diffusion coefficient of electrolyte and slope was calculated for the determination of the electrochemical active surface area (ECSA).4.2 Detection of glucose in the presence of H2O2
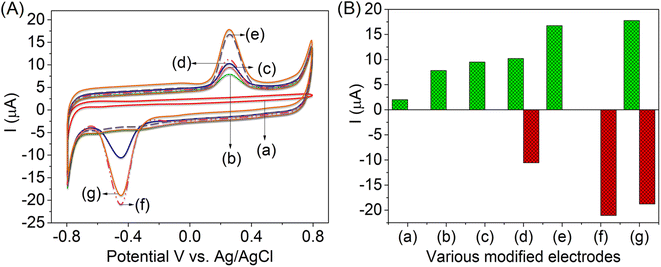
The recorded cyclic voltammograms were overlay with the plot of the bare GCE (Fig. 3A, inset curve a) and AlTMQNCAPc@GC electrode (curve b), and 100 nM of glucose was detected by the oxidation potential and low current by the AlTMQNCAPc@GC electrode in PBS (pH 7) solution (curve c), 100 nM glucose in the presence of 100 nM of H2O2 by AlTMQNCAPc@GC electrode (curve d), 200 nM of glucose was detected by the high oxidation current on AlTMQNCAPc@MWCNT/GC electrode (curve e), and 200 nM of H2O2 was detected by the high reduction peak current on the AlTMQNCAPc@MWCNT/GC electrode (curve f). Then, the detection of 200 nM of glucose in the presence of H2O2 (curve g) was compared to that without the MWCNT composite film, and with the continuous addition of glucose to the same electrochemical cell in the presence of H2O2, showing high reduction peak current responses (curve d). Furthermore, the irreversible reduction reaction of H2O2 on the AlTMQNCAPc@MWCNT/GC electrode was controlled by diffusion, varying the plots of the modified electrodes vs. peak current, as shown in Fig. 3B. The mechanism for the reduction of H2O2 on the AlTMQNCAPc@MWCNT/GC electrode is proposed as follows:40,41| H2O2 + 2H+ + 2e− → 2H2O. | (1) |
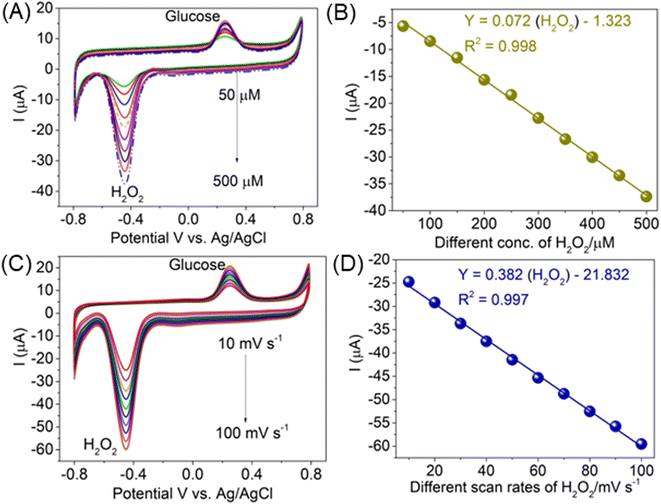
The CV response of the AlTMQNCAPc@MWCNT/GC electrode towards glucose and H2O2 was examined by increasing the analyte concentrations (50 to 500 μM) under the optimal experimental conditions in PBS (pH 7) electrolyte solution at a scan rate of 50 mV s−1. The modified electrode detected the two cathodic and anodic peak potentials (+280 mV: glucose and −417 mV: H2O2) with an increase in the high anodic and cathodic peak current with an increase in the concentration of glucose in the presence of H2O2, as shown in Fig. 4A. The calibration curve of glucose in the presence of H2O2 at the AlTMQNCAPc@MWCNT/GC electrode was linear in the range of 50 to 500 nM L−1 with y = 0.072 (H2O2) − 1.323 and coefficient of determination of 0.999, as shown in the inset of Fig. 4B. The detection limits for glucose and H2O2 were calculated to be 5 and 10 nM L−1, respectively, and the analytical performance of the proposed sensor (AlTMQNCAPc@MWCNT/GC electrode) was compared with other reported sensors based on electrodes and the results are summarized in Table S1.† According to the comparison, the proposed electrochemical sensor exhibited a low detection limit and broad linear range, which can be attributed to its high surface area, geometry, and electrode treatment characteristics of MWCNTs and AlTMQNCAPc, which collectively influenced the deposition of metal ions in an efficient way. The determination of glucose at different scan rates (10–100 mV s−1) in the presence of H2O2 by the AlTMQNCAPc@MWCNT/GC electrode detected a high peak current with an increase in the scan rate (Fig. 5C), and the linear plot of scan rate vs. current of H2O2, with Y = 0.382x − 21.872 and correlation coefficient of R2 = 0.999 is shown in Fig. 5D.42
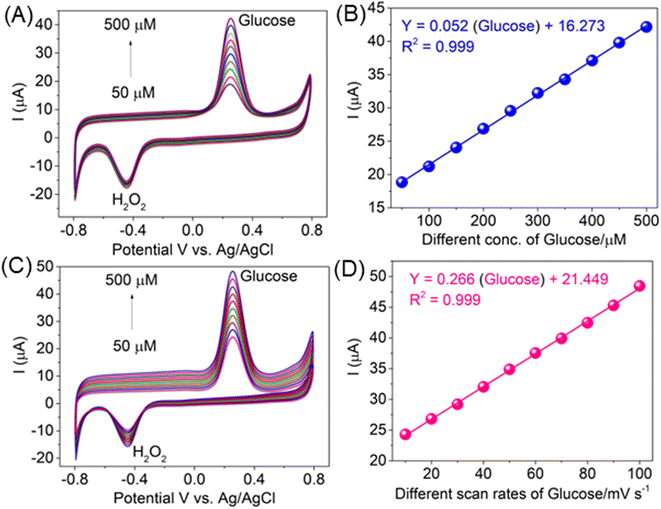
The modified electrode detected the two cathodic and anodic peak potentials with an increase in the peak current with an increasing concentration of H2O2 in the presence of glucose (50 to 500 μM), as shown in Fig. 5A. The calibration curve of H2O2 in the presence of glucose on the AlTMQNCAPc@MWCNT/GC electrode was linear in the range of 50 to 500 nM L−1 with y = 0.052 (glucose) + 16.723 and coefficient of determination of 0.999, as shown in Fig. 5B. The analytical performance of the proposed sensor (AlTMQNCAPc@MWCNT/GC electrode) with a detection of limit of 8 nM L−1 was compared with other reported sensors based on electrodes and the results are summarized in Table S1.† The determination of H2O2 in the presence of glucose by the AlTMQNCAPc@MWCNT/GC electrode at different scan rates (10–100 mV s−1) showed a high peak current with an increase in the scan rate (Fig. 5C) and the linear plot of different scan rates vs. various currents of glucose, with Y = 0.266x + 21.449 and correlation coefficient of R2 = 0.999 is shown in Fig. 5D.42
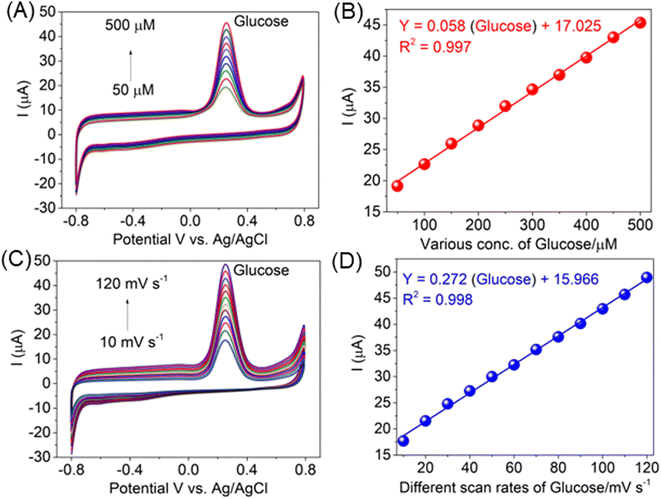
The effect of glucose concentration on the positive current for its electrocatalytic oxidation at the modified electrode was investigated by cyclic voltammetry. Fig. 6A illustrates the series of CVs of the AlTMQNCAPc@MWCNT/GC electrode in the presence of different concentrations of glucose in the range of 50 to 500 μM in PBS (pH 7) and the correlation between the oxidation peak intensity and glucose concentration is shown in Fig. 6A. Obviously, the plot was linear up to a concentration of 500 μM. The linear regression equation was expressed as: I (μA) = 0.058 (glucose) + 17.025 with a correlation coefficient of R2 = 0.997 (Fig. 6B), and different scan rates of glucose (10 to 100 mV s−1) displayed a potential of 270 mV, which is the same potential for the detection of the high positive peak current, as shown in Fig. 6C and a linear response to increasing scan rates of glucose vs. peak current: Y = 0.272x + 15.966 with a correlation coefficient of R2 = 0.998 (inset Fig. 6D). The current deviated from linearity at higher glucose concentrations and the detection limit was 18 nmol L−1 (three-times the signal to noise ratio), which is most possibly due to the passivation of the electrode and/or the formation of glucose isomers, given that this is known to occur in alkaline media.43 Fig. 6A shows that the peak current tended to level off at higher glucose concentrations because of the saturation of the active sites at the surface of the electrode.
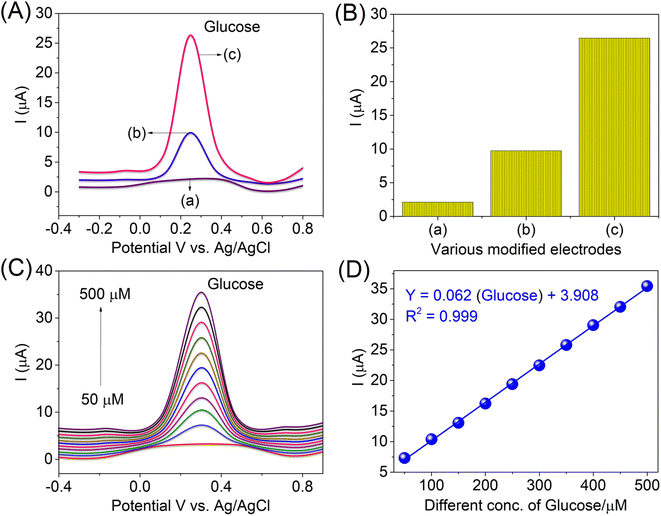
The electrochemical DPV responses of the bare electrode and modified electrodes, e.g., bare GCE, AlTMQNCAPc@GC electrode and AlTMQNCAPc@MWCNT/GC electrode, were investigated in the potential range of −0.4 V to 0.9 V under the optimized conditions, as shown in Fig. 7A. The bare GCE showed no response (a curve), 200 μM of glucose was detected with a low peak current response by the AlTMQNCAPc@GC electrode (b curve), while 200 μM of glucose was detected by the AlTMQNCAPc@MWCNT/GC electrode with a high oxidation peak current and positive peak potential (c curve), showing a better result than the composite without MWCNTs (b curve) at the potential of +315 mV in PBS (pH 7) electrolyte solution. Therefore, the sensitivity of the GCE should be further improved for real sample analysis by chemical modification. Furthermore, in addition to electronic conductivity, other factors affect the sensing performance, where some affect it more than electronic conductivity, such as the ability to absorb and accumulate glucose. The dependence of the oxidation current on the different modified electrodes is shown in Fig. 7B. The influence of different concentrations (50–500 μM) of glucose at the AlTMQNCAPc@MWCNT/GC electrode was also investigated by DPV. The peak current slightly increased as the potential shifted linearly from +315 mV (glucose), as shown in Fig. 7C, with the linear plot of different concentrations of glucose vs. peak current and correlation coefficient of 0.999 shown in Fig. 7D. The detection limit of glucose using the proposed method was found to be 12 nmol L−1 at a signal-to-noise ratio of 3 in the linear range of 50–500 μmol L−1. A comparison of the limit of detection obtained using the AlTMQNCAPc@MWCNT/GC electrode with recently reported methods is presented in Table S1,† which obviously specifies an enhancement compared to the reported values.
As shown in Fig. S7(A),† the oxidation current peak of glucose increased with an increase in the catalyst loading in the range of 50–250 μM. The dependence of glucose oxidation current on the catalyst loading is shown in Fig. S7(B).† The highest oxidation current was observed for 250 μM catalyst, which was set for further experiments. This can be attributed to the thickness of the loaded catalyst on the surface of the electrode. The influence of pH was checked by DPV analysis in the presence of glucose. As shown in Fig. S7(C),† the oxidation current of glucose increased from pH 3.0 to 11.0. The highest oxidation peak of glucose was observed at pH 7.0, which suggests that the most electrooxidation occurred at the surface of the AlTMQNCAPc@MWCNT/GC electrode. The dependence of the oxidation current and oxidation potential on the pH is shown in Fig. S7(D).† As observed, the oxidation potential of glucose was found to shift towards a negative value linearly with an increase in the pH (7.0 to 11.0) of the electrolyte.
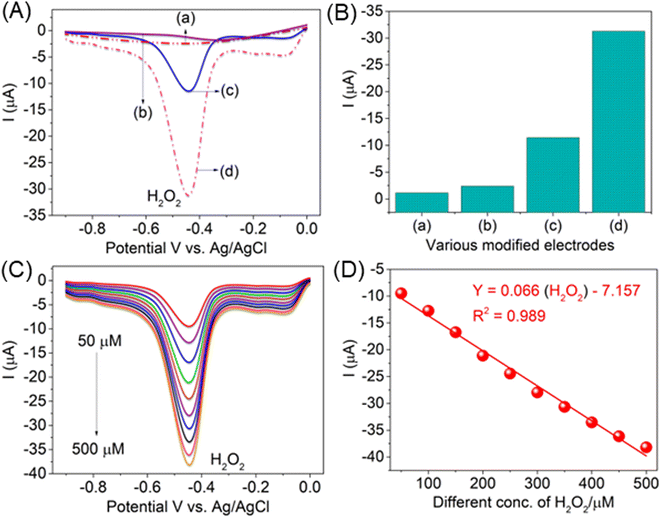
Fig. 8A demonstrates the evaluation of the AlTMQNCAPc@MWCNT/GC electrode for the detection of H2O2 in neutral phosphate buffer solution containing 100 μM H2O2 at a scan rate of 50 mV s−1 at various AlTMQNCAPc@GC electrodes (curve a, without analyte), where the AlTMQNCAPc@GC electrode detected low peak current responses in the presence of H2O2 (b curve) compared to the AlTMQNCAPc@MWCNT/GC electrode (c curve). The dependence of the H2O2 reduction current on the catalyst loading is shown in Fig. 8B. Also, the influence of various concentrations (50 to 500 μM) of H2O2 is shown in Fig. 8C, with an increasing negative peak current in the reduction peak potential. The linear plot of various concentrations of H2O2 vs. peak current, with Y = 0.066 (H2O2) − 7.157 and correlation coefficient of R2 = 0.989 is shown in Fig. 8D.
As shown in Fig. S8(A),† the reduction peak current of H2O2 increased with the catalyst loading in the range of 50–250 μM. The dependence of the H2O2 reduction peak current on the catalyst loading is shown in Fig. S8(B).† The highest oxidation current was observed for 250 μM catalyst, which was set for further experiments. This can be attributed to the thickness of the catalyst loading on the surface of the electrode. The influence of pH was investigated by DPV analysis in the presence of H2O2. As shown in Fig. S8(C),† the reduction peak current of H2O2 increased from pH 3.0 to 11.0. The highest reduction peak of H2O2 was observed at pH 7.0, which suggests that the most electroreduction occurred on the surface of the AlTMQNCAPc@MWCNT/GC electrode. The dependence of the reduction peak current and reduction potential on the pH is shown in Fig. S8(D).† As observed, the oxidation potential of H2O2 was found to shift towards a negative value linearly with an increase in the pH (7.0 to 11.0) of the electrolyte.44
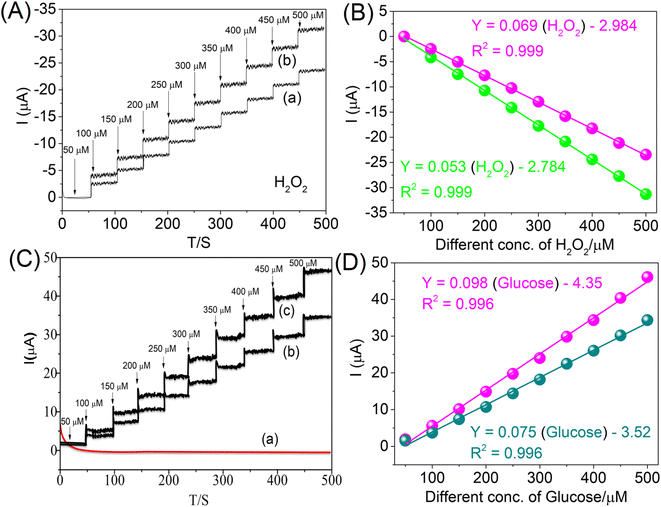
Fig. 9A shows that with the addition of various concentrations (50–500 μM) of H2O2, a negative peak current was recorded at an applied potential of −0.400 V, with a high negative peak current response by the AlTMQNCAPc@MWCNT/GC and AlTMQNCAPc@GC electrodes (Fig. 9A, curves a and b) and linear responses of H2O2; Y = 0.069 (H2O2) − 2.984 and Y = 0.053 (H2O2) − 2.784 with a correlation coefficient of R2 = 0.999 and 0.999 (inset, Fig. 9B), respectively. Generally, the electrocatalysts were evaluated by measuring the current at different applied potentials (+0.3 V and −0.45 V) and time after the addition of the analytes of glucose and H2O2. Therefore, amperometry measurements were performed at a detection potential of +300 mV in neutral PBS solution containing the AlTMQNCAPc@GC and AlTMQNCAPc@CNT/GC electrodes (Fig. 9C, curves b and c), respectively, where upon the addition of glucose, a high peak current was detected (c curve) compared to without MWCNTs (b curve) and the bare GCE (curve a). The electrochemical responses were recorded while the solution was constantly stirred. Fig. 9C shows the current density for the electro-oxidation of glucose, where the points marked by arrows are the concentrations of glucose with a linear dependence of Y = 0.098 (glucose) − 4.35 and Y = 0.075 (glucose) − 3.52 with a correlation coefficient of R2 = 0.996 and 0.996 (inset Fig. 9D), respectively. The detection limit and sensitivity are presented in Table S1,† where the AlTMQNCAPc@MWCNT/GC electrode exhibited excellent electrochemical stability for the detection of the two biomolecules of glucose and H2O2.
5 Conclusion
Herein, we reported the effective fabrication of a novel glucose biosensor and hydrogen peroxide sensor based on tetramethoxyquinoline carboxamide aluminum(III) phthalocyanine with a composite of multiwalled carbon nanotubes (AlTMQNCAPc@MWCNTs). A linear response to glucose and hydrogen peroxide concentration in the range of 50 to 500 M was observed with a correlation coefficient of 0.999 in the constructed AlTMQNCAPc@MWCNT/GC electrode. The AlTMQNCAPc@MWCNT/GC electrode sensor was used for the determination of glucose and hydrogen peroxide. The LOD of the biosensor was excellent (0.91 μM and 18 nM). The sensitivity of our sensor (0.069 μA μM−1 cm−2 and 0.098 μA μM−1 cm−2) was compared with other previously reported studies. Also, the repeatability, reproducibility, selectivity, and storage stability of the electrochemical sensor were satisfactory. The AlTMQNCAPc@MWCNT/GC electrode exhibited a high electrocatalytic response to glucose and hydrogen peroxide, respectively, which proves that the procedure for the preparation of AlTMQNCAPc effectively enhanced the electrocatalytic activity of the sensor and biosensor.Ethical statement
The human urine samples used in this study were obtained from Dr Chandramma Dayananda Sagar Institute of Medical Education and Research Center. Harohalli, Kanakapura Rd, Kanakapura, Karnataka-562112 All experiments were performed in accordance with the Guidelines of “Dr Chandramma Dayananda Sagar Institute of Medical Education and Research Center”, and approved by the ethics committee at “The CDSIMER Institutional Ethics Committee CDSIMER Devarakaggahalli Harohalli, Kanakapura Taluk Ramanagara Karnataka Ethics Committee” Informed consents were obtained from human participants of this study.Conflicts of interest
The authors declare no conflicts of interest.Acknowledgements
The authors would like to acknowledge CNMS, JAIN (Deemed-to-be University) and Nano Mission, DST, Government of India, for financial support SR/NM/NS-20/2014, minor research project (No. JU/MRP/CNMS/11/2022) and postdoctoral fellowship grant JU/APP/PDF/2022/611. Prof. M. Selvaraj acknowledge to deanship of scientific research at King Khalid University (KKU) for funding this work through large group research project under grant number RGP2/489/44 and the Research Center for Advance Materials (RCAMS) for their valuable technical support.References
- T. Audesirk and G. Audesirk, Biology, Life on Earth, Prentice-Hall, 5th edn, 1999 Search PubMed.
- J. G. Webster, Medical Instrumentation Application and Design, ed. N. J. Hoboken, Wiley, 4th edn, 2009 Search PubMed.
- W. Jialin, N. Li, D. Li, M. Zhang, Y. Lin, Z. Liu, X. Lin and L. Shui, Cesium-doped graphene quantum dots as ratiometric fluorescence sensors for blood glucose detection, ACS Appl. Nano Mater., 2021, 4(8), 8437–8446 CrossRef.
- W. Muhammad, L. Wu, H. Tang, C. Liu, Y. Fan, Z. Jiang, X. Wang, J. Zhong and W. Chen, Cu2O microspheres supported on sulfur-doped carbon nanotubes for glucose sensing, ACS Appl. Nano Mater., 2020, 3(5), 4788–4798 CrossRef.
- B. J. Privett, J. H. Shin and M. H. Schoenfiosch, Electrochemical sensors, Anal. Chem., 2008, 80, 4499 CrossRef CAS PubMed.
- M. Zhou, Y. Zhai and S. Dong, Electrochemical Sensing and Biosensing Platform Based on Chemically Reduced Graphene Oxide, Anal. Chem., 2009, 81, 5603–5613 CrossRef CAS PubMed.
- S. Arpita, A. B. Ghosh, N. Saha, G. R. Bhadu and B. Adhikary, Newly designed amperometric biosensor for hydrogen peroxide and glucose based on vanadium sulfide nanoparticles, ACS Appl. Nano Mater., 2018, 1(3), 1339–1347 CrossRef.
- M. Giorgio, M. Trinei, E. Migliafccio and P. G. Pelicci, Hydrogen peroxide: a metabolic by-product or a common mediator of ageing signals, Nat. Rev. Mol. Cell Biol., 2007, 8, 722–728 CrossRef CAS PubMed.
- C. Laloi, K. Apel and A. Danon, Reactive oxygen signalling: the latest news, Curr. Opin. Plant Biol., 2004, 7, 323–328 CrossRef CAS PubMed.
- N. V. Klassen, D. Marchington and H. C. E. McGowan, H2O2 Determination by the I3- Method and by KMnO4 Titration, Anal. Chem., 1994, 66, 2921–2925 CrossRef CAS.
- Z. H. Li, D. H. Li, K. Oshita and S. Motomizu, Flow-injection determination of hydrogen peroxide based on fluorescence quenching of chromotropic acid catalyzed with Fe(II), Talanta, 2010, 82, 1225–1229 CrossRef CAS.
- T. Jiao, B. D. Leca-Bouvier, P. Boullanger, L. J. Blum and A. P. Girard-Egrot, Electrochemiluminescent detection of hydrogen peroxide using amphiphilic luminol derivatives in solution, Colloids Surf., A, 2008, 321, 143–146 CrossRef CAS.
- S. Yijin, Z. Li, Y. Yang, J. Tan, Z. Liu, Y. Shi, C. Ye and Q. Gao, Isolated cobalt atoms on N-doped carbon as nanozymes for hydrogen peroxide and dopamine detection, ACS Appl. Nano Mater., 2021, 8, 7954–7962 Search PubMed.
- M. Elisabetta, T. D. Giulio, V. Mastronardi, P. P. Pompa, M. Moglianetti and C. Malitesta, Bare platinum nanoparticles deposited on glassy carbon electrodes for electrocatalytic detection of hydrogen peroxide, ACS Appl. Nano Mater., 2021, 8(4), 7650–7662 Search PubMed.
- Y. Shen, M. Trauble and G. Wittstock, Detection of Hydrogen Peroxide Produced during Electrochemical Oxygen Reduction Using Scanning Electrochemical Microscopy, Anal. Chem., 2008, 80, 750–759 CrossRef CAS PubMed.
- (a) C. C. Leznoff and A. B. P. Lever, Phthalocyanines: properties and applications, VCH Publishers, New York, 1996, vol. 4 Search PubMed; (b) P. Gregory, Industrial applications of phthalocyanines, J. Porphyrins Phthalocyanines, 2000, 4(4), 432–437 CrossRef CAS; (c) N. B. McKeown, Phthalocyanine Materials, Structure and Function, Cambridge University Press, Cambridge, 1998 Search PubMed.
- (a) G. Guillaud, J. Simon and J. P. Germain, Metallophthalocyanines: Gas sensors, resistors and field effect transistors, Coord. Chem. Rev., 1998, 178–180 Search PubMed; (b) Mounesh, K. R. Venugopal Reddy and O. Nagaraja, Novel n-octadecylcarboxamide CoPc: amperometric detections for bioanalytes using modified GCE, Chem. Pap., 2021, 75, 2945–2956 CrossRef CAS.
- (a) R. Bonnett, Photosesitizers of the porphyrin and phthalocyanine series for photodynamic therapy, Chem. Soc. Rev., 1995, 19–33 RSC; (b) R. Bonnet, Chemical aspects photodynamic therapy, Gordon and Breach Science, Amsterdam, 2000 CrossRef; (c) E. A. Lukyantes, Phthalocyanines as photosensitizers in the photodynamic therapy of cancer, J. Porphyrins Phthalocyanines, 1999, 3, 424–432 CrossRef.
- (a) A. Ogunsipe, J. Y. Chen and T. Nyokong, Photophysical and photochemical studies of zinc(II) phthalocyanine derivatives-effects of substituents and solvents, New J. Chem., 2004, 28, 822–827 RSC; (b) Mounesh and K. R. Venugopala Reddy, Detection of Nanomolar Concentrations H2O2 Using Cobalt (II) Phthalocyanine Modified GCE with MWCNTs, Anal. Chem. Lett., 2020, 10(1), 33–48 CrossRef CAS; (c) S. Kudrevich, N. Basseur, C. Le Madeline, S. Gilbert and J. E. Van Lier, Syntheses and photodynamic activities of novel trisulfonated zinc phthalocyanine derivatives, J. Med. Chem., 1997, 40, 3897–3904 CrossRef CAS PubMed.
- (a) P. Jiabao, Y. Yang, W. Fang, W. Liu, K. Le, D. Xu and X. Li, Fluorescent phthalocyanine–graphene conjugate with enhanced NIR absorbance for imaging and multi-modality therapy, ACS Appl. Nano Mater., 2018, 6, 2785–2795 Search PubMed; (b) Mounesh and K. R. Venugopala Reddy, Decorated CoPc with appliance of MWCNTs on GCE: sensitive and reliable electrochemical investigation of heavy metals, Microchem. J., 2021, 160, 105610 CrossRef CAS.
- S. Wei, J. Zhou, D. Huang, X. Wang, B. Zhang and J. Shen, Synthesis and Type I/Type II photosensitizing properties of a novel amphiphilic zinc phthalocyanine, Dyes Pigm., 2006, 71, 61–67 CrossRef CAS.
- Mounesh, T. M. Sharanakumar, N. Y. Praveenkumar, K. R. Venugopal Reddy, K. Chandrakala, L. Arunkumar and C. C. Vidyasagar, Novel Schiff Base Cobalt(II) Phthalocyanine with Appliance of MWCNTs: Enhanced Electrocatalytic Activity Behaviour of α-Amino Acids, RSC Adv., 2021, 11, 16736–16746 RSC.
- (a) G. De la Torre, P. Vazquez, F. Agullo-Lopez and T. Torres, Phthalocyanines and related compounds:organic targets for nonlinear optical applications, J. Mater. Chem., 1998, 8, 1671–1683 RSC; (b) K. Dinesh Verma, J. Kuntail, B. Kumar, A. K. Singh, N. Shukla, Kavita, I. Sinha and R. B. Rastogi, Amino borate-functionalized reduced graphene oxide further functionalized with copper phthalocyanine nanotubes for reducing friction and wear, ACS Appl. Nano Mater., 2020, 6, 5530–5541 CrossRef.
- G. De la Torre, T. Torres and F. Agullo-Lopez, The phthalocyanine approach to second harmonic generation, Adv. Mater., 1997, 9, 265–269 CrossRef CAS.
- Mounesh, P. Malathesh, N. Y. Praveen Kumara, B. S. Jilani, C. D. Mruthyunjayachari and K. R. Venugopala Reddy, Synthesis and characterization of tetra-ganciclovir cobalt(II) phthalocyanine for electroanalytical applications of AA/DA/UA, Heliyon, 2019, 5, e01946 CrossRef CAS PubMed.
- Mounesh, B. S. Jilani, M. Pari, K. R. Venugopala Reddy and K. S. Lokesh, Simultaneous and sensitive detection of ascorbic acid in presence of dopamine using MWCNTs-decorated cobalt(II) phthalocyanine modified GCE, Microchem. J., 2019, 147, 755–763 CrossRef CAS.
- Mounesh and K. R. Venugopala Reddy, Sensitive and reliable electrochemical detection of Nitrite and H2O2 embellish-CoPc coupled with appliance of composite MWCNTs, Anal. Chim. Acta, 2020, 1108, 98–107 CrossRef CAS.
- Mounesh and K. R. Venugopala Reddy, Novel Tetracinnamide Cobalt(II) Phthalocyanine Immobilized on MWCNTs for Amperometic Sensing of Glucose, Anal. Chem. Lett., 2020, 10(2), 137–151 CrossRef CAS.
- T. Nyokong, Effects of substituents on the photochemical and photophysical properties of main group metal phthalocyanines, Coord. Chem. Rev., 2007, 251, 1707–1722 CrossRef CAS.
- Mounesh, K. R. Venugopala Reddy, D. Yuvaraja, J. M. Manriquez, K. S. Lokesh and M. K. Amshumali, Novel Schiff base Iron (II) phthalocyanine with composite MWCNTs on modified GCE: electrochemical sensors development of paracetamol, React. Chem. Eng., 2022, 7, 2550–2561 RSC.
- K. Serbest, I. Degirmencioglu, Y. Unver, M. Er, C. Kantar and K. Sancak, Microwave-assisted synthesis and characterization and theoretical calculations of the first example of free and metallophthalocyanines from salen type Schiff base derivative bearing thiophen and triazole heterocyclic rings, J. Organomet. Chem., 2007, 692, 5646–5654 CrossRef CAS.
- K. Sawada, W. Duani, K. Sekitani and K. Satoh, Polymerization and complex formation of phthalocyanine substituted by trioxyethylene in solution, J. Mol. Liq., 2005, 119, 171–176 CrossRef CAS.
- T. M. Sharanakumar, K. R. Venugopala Reddy, Mounesh, N. Y. Praveen Kumar, Suresh and N. H. M. Nandinibaby, Investigated aerobic oxidation of aminochlorophenol catalyzed by phthalocyanine complexes, J. Indian Chem. Soc., 2021, 98, 100139 CrossRef CAS.
- B. S. Jilani, Mounesh, P. Malathesh, C. D. Mruthyunjayachari and K. R. Venugopala Reddy, Cobalt(II) tetra methyl-quinoline oxy bridged phthalocyanine carbon nano particles modified glassy carbon electrode for sensing nitrite: a voltammetric study, Mater. Chem. Phys., 2020, 239, 121920 CrossRef CAS.
- N. Y. Praveen kumar, Mounesh, T. M. Sharanakumar and K. R. Venugopalreddy, Tetra chlorobenzoxazolamine nickel(II) phthalocyanine supercapacitor with aqueous electrolyte and MWCNTs, Chem. Pap., 2021, 75, 2683–2694 CrossRef CAS.
- Mounesh, T. M. Sharan Kumar, N. Y. Praveen Kumar and K. R. Venugopal Reddy, Poly (L-lactide)-Carboxamide-CoPc with Composite MWCNTs on Glassy Carbon Electrode Sensitive Detection of Hydrazine and L-Cysteine, Anal. Chem. Lett., 2020, 10(5), 620–635 CrossRef CAS.
- B. S. Jilani, C. D. Mruthyunjayachari, P. Malathesh, Mounesh, T. M. Sharankumar and K. R. Venugopala Reddy, Electrochemical sensing based MWCNT-Cobalt tetra substituted sorbaamide phthalocyanine onto the glassy carbon electrode towards the determination of 2-amino phenol: a voltammetric study, Sens. Actuators, B, 2019, 301, 127078 CrossRef.
- Mounesh, N. Y. Praveen Kumar, T. M. Sharanakumar and K. R. Venugopal Reddy, Novel cobalt(II) Phthalocyanine with Appliance of CNTs on GCE: Flexible Super-Capacitance by Electrochemical Methods, Electrochem. Sci. Adv., 2021, 2(1), e2100006 Search PubMed.
- Mounesh, J. M. Manriquez, K. R. Venugopala Reddy, K. G. Shilpa and B. M. Nagaraja, Electrochemical, Ultrasensitive, and Selective Detection of Nitrite and H2O2: Novel Macrostructured Phthalocyanine with Composite MWCNTs on a Modified GCE, Langmuir, 2023, 39(4), 1665–1676 CrossRef CAS.
- J. Zhang, Z. Chen, H. Wu, F. Wu, C. He, B. Wang, Y. Wuab and Z. Ren, An electrochemical bifunctional sensor for the detection of nitrite and hydrogen peroxide based on layer-by-layer multilayer films of cationic phthalocyanine cobalt(II) and carbon nanotubes, J. Mater. Chem. B, 2016, 4, 1310–1317 RSC.
- Z. Wen, S. Ci and J. Li, Pt Nanoparticles Inserting in Carbon Nanotube Arrays: Nanocomposites for Glucose Biosensors, J. Phys. Chem. C, 2009, 113, 13482–13487 CrossRef CAS.
- Mounesh and K. R. Venugopala Reddy, Electrochemical Investigation of Modified GCE on Carboxamide-PEG2-Biotin-CoPc using Composite MWCNTs: Sensitive Detection for Glucose and Hydrogen Peroxide, New J. Chem., 2020, 44(8), 3330–3340 RSC.
- V. Mani, R. Devasenathipathy, S.-M. Chen, S.-F. Wang, P. Devi and Y. Tai, Electrodeposition of copper nanoparticles using pectin scaffold at graphene nanosheets for electrochemical sensing of glucose and hydrogen peroxide, Electrochim. Acta, 2015, 176, 804–810 CrossRef CAS.
- B. Ling, Y. Li, X. Chen, L. Ji, X. Zhang and F. Yang, Ag Nanostructures on Poly(3-hexylthiophene) and Semiconducting Single-Walled Carbon Nanotube Substrates for SERS Detection of Rhodamine B and Electrochemical Detection of Hydrogen Peroxide, ACS Appl. Nano Mater., 2019, 12, 7728–7736 Search PubMed.
- J. Wang, Z. Wang, D. Zhao and C. Xu, Facile fabrication of nanoporous PdFe alloy for nonenzymatic electrochemical sensing of hydrogen peroxide and glucose, Anal. Chim. Acta, 2014, 832, 34–43 CrossRef CAS PubMed.
- J. Ren, W. Shi, K. Li and Z. Ma, Ultrasensitive platinum nanocubes enhanced amperometric glucose biosensor based on chitosan and nafion film, Sens. Actuators, B, 2012, 115, 120 Search PubMed.
- H. Al-Sagur, S. Komathi, M. A. Khan, A. G. Gurek and A. Hassan, A novel glucose sensor using lutetium phthalocyanine as redox mediator in reduced graphene oxide conducting polymer multifunctional hydrogel, J. Biosens. Bioelectron., 2016, 92, 638–645 CrossRef PubMed.
Footnote |
| † Electronic supplementary information (ESI) available: Experimental: reagents, characterization methods; figures: Fig. S1–S10; and tables: Tables S1–S3. See DOI: https://doi.org/10.1039/d3ra02617e |
| This journal is © The Royal Society of Chemistry 2023 |

