 Open Access Article
Creative Commons Attribution 3.0 Unported Licence
Designing a TiO2-MoO3-BMIMBr nanocomposite by a solvohydrothermal method using an ionic liquid aqueous mixture: an ultra high sensitive acetaminophen sensor†
Anita K. Tawade‡
a,
Ajay P. Khairnar‡b,
Jayashri V. Kamblec,
Akash R. Kadamc,
Kiran Kumar K. Sharmaa,
Anil A. Poward,
Vijay S. Patil*b,
Manohar R. Patile,
Sawanta S. Mali f,
Chang Kook Hongf and
Shivaji N. Tayade
 *c
*c
aSchool of Nanoscience and Biotechnology, Shivaji University, Kolhapur, 416004, Maharashtra, India
bR. F. N. S. Senior Science College, Akkalkuwa, 425415, Maharashtra, India. E-mail: patilvs55@gmail.com
cDepartment of Chemistry, Shivaji University, Kolhapur, 416004, Maharashtra, India. E-mail: snt_chem@unishivaji.ac.in
dDepartment of Chemistry, Walchand College of Engineering, Sangli, 416415, Maharashtra, India
eNanochemistry Research Laboratory, G. T. Patil Collage, Nandurbar, 425412, Maharashtra, India
fDepartment of Advanced Chemical Engineering, Chonnam National University, Gwangju, 61186, South Korea
First published on 14th July 2023
Abstract
This study shows a simplistic, efficient procedure to synthesize TiO2-MoO3-BMIMBr nanocomposites. Powder X-ray diffraction, scanning electron microscopy, energy-dispersive X-ray spectroscopy, and X-ray photoelectron spectroscopy have all been used to completely analyse the materials. The detection of acetaminophen (AC) has been examined at a modified glassy carbon electrode with TiO2-MoO3-BMIMBr nanocomposites. Moreover, the electrochemical behavior of the nanocomposite modified electrode has been studied by cyclic voltammetry (CV), differential pulse voltammetry (DPV), chronoamperometry and electrochemical impedance spectroscopy (EIS). The linear response of AC was observed in the range 8.26–124.03 nM. The sensitivity and detection limits (S/N = 3) were found to be 1.16 μA L mol−1 cm−2 and 11.54 nM by CV and 24 μA L mol−1 cm−2 and 8.16 nM by DPV respectively.
1. Introduction
The pharmaceutical industry grows to keep up with the increase in the world's population; the pharmaceutical industry's global market hit $1.25 trillion in 2019; by 2023, it is expected to reach $1.5 trillion. Pharmacy sales revenue increased by 207.9% from 2005 to 2019.1 Consequently, two significant problems have appeared. Ambient water sources that contain pharmaceutical pollutants must be tracked and monitored for the preservation of ecological and human health because (i) many pharmaceuticals are distorted, necessitating the need for portable, affordable, and accurate sensors for a variety of applications, including the tracking of drug overdoses or for biomedical monitoring applications, (ii) pharmaceutical pollutant in ambient water sources.From February 2018 through February 2019, the National Center for Health Statistics recorded 69![[thin space (1/6-em)]](https://www.rsc.org/images/entities/char_2009.gif) 029 deaths attributed to non-steroidal anti-inflammatory drug overdoses.2 This is an increase of 5.5% from 2017 to 2018. These indicate an increase in antidepressant overdose deaths in the US in 2017, with over 5000 deaths compared to 3889 in 2010.3 Between 2005 and 2018, the death rate from antidepressant overdose climbed by an average of 6% a year. The cumulative content of the 37 rivers tested nationwide for antibiotics by the Japanese health authorities was as high as 626 ng L−1.2 The WHO recommends an adult daily intake of 1 g every 4–6 hours and not more than 4 g acetaminophen (AC) in a 24 hour period. For instance, the hydrolytic breakdown of paracetamol results in the production of 4-aminophenol, and it has teratogenic and nephrotoxic consequences. The ambient aquatic systems of 71 countries contained a total of 203 medicines with substantial quantities, the majority of which were antibiotics, analgesics, pain relievers, anti-fungal and anti-inflammatory drugs according to a report by Germany's Ministry for the environment.
029 deaths attributed to non-steroidal anti-inflammatory drug overdoses.2 This is an increase of 5.5% from 2017 to 2018. These indicate an increase in antidepressant overdose deaths in the US in 2017, with over 5000 deaths compared to 3889 in 2010.3 Between 2005 and 2018, the death rate from antidepressant overdose climbed by an average of 6% a year. The cumulative content of the 37 rivers tested nationwide for antibiotics by the Japanese health authorities was as high as 626 ng L−1.2 The WHO recommends an adult daily intake of 1 g every 4–6 hours and not more than 4 g acetaminophen (AC) in a 24 hour period. For instance, the hydrolytic breakdown of paracetamol results in the production of 4-aminophenol, and it has teratogenic and nephrotoxic consequences. The ambient aquatic systems of 71 countries contained a total of 203 medicines with substantial quantities, the majority of which were antibiotics, analgesics, pain relievers, anti-fungal and anti-inflammatory drugs according to a report by Germany's Ministry for the environment.
The analgesic and antipyretic medication paracetamol (4-acetaminophen or N-acetyl-para-aminophenol) (POM) is used to treat pain, neuralgia, arthritis, and menstrual cramps in both adults and children.4 Limited use of AC does not exhibit any harmful side effects, however, excessive use or overdose and chronic use of AC will cause kidney, liver damage and even coma or death in some cases.5 Thus, the monitoring of POM in human serum, sweat, and water bodies are important for both human health and controlling environmental poisoning.5 Numerous techniques such as high performance liquid chromatography,6 UV spectrophotometry,7 chemiluminescence8 and titrimetry,9 electrophorosis,10 LC-MS11 GC-MS12 and flow injection13 are available for the detection and determination of POM. Unfortunately, these techniques have several drawbacks and restrictions, such as being expensive and time-consuming. Electrochemical methods have been extensively researched for the determination of POM due to its advantages of being straightforward, affordable, sensitive, and selective analytical techniques with quick analysis and precise results.14
Due to its biocompatibility and advantages in terms of cost, TiO2 is particularly preferred for the creation of biosensors and electrochemical sensors.15 Due to their partially filled orbitals, transition metal oxides (TMO) have unique qualities that make them stand out, like being environmentally friendly, simpler to manufacture, having a large specific surface area, and broad energy band gap, being biocompatible, and more.16 MoO3 are widely used in catalysts, photoelectrochemical devices, gas sensors, electrochemical capacitors, and other fields with their excellent physical and chemical properties.17 However, the performance of TMO materials alone is not always ideal. However, due to their inherent disadvantages, such as poor electron conductivity, low stability in acidic media, and weak adsorbate adsorption and activation capacities, there are some key challenges in the practical applications of TMOs. In order to improve their physical and chemical properties, several innovative strategies have been developed. Xu18 used chemical deposition to grow uniform porous NiCo2O4 nanosheets on the surface of α-MoO3 nanorods, and achieved a detection limit as low as 50 ppb. The heterostructure nanomaterials formed have excellent gas-sensitive sensing performance for ethanol. The Ag–P NPs synthesized by simply refluxing are deposited on the screen-printed carbon electrode (SPCE) to detects POM in the linear concentration of 0.1–1900 μM with the lowest detection limit of 0.39 nM (S/N = 3) with the superior sensitivity of 2244.4 μA μM−1 cm−2.19
The numerous methods are developed for AC sensing viz titrimetric, spectrophotometric, and chemiluminescence. These methods require an extraction step before detection, whilst liquid chromatography is a laborious procedure, making these methods unsuitable for regular inspection. Fundamentally non-specific are conductometric approaches. However, there are a few pragmatic aspects that make conductometric approaches distinct, such as their cost-effectiveness, simplicity (because no reference anodes are needed), and insensitivity to light. Chromatographic methods including HPLC, GC-MS, and LC-MS/MS as well as colorimetric techniques are being used extensively in hospitals and laboratories for the analysis of pharmaceutical substances.20 However, these methods frequently have limitations when it comes to mobility. Our main objective is to synthesize morphologically controlled electrode as a low-cost, highly sensitive, and highly stable modifier utilizing a simple synthesis process in order to satisfy the parameters for the ideal chemically modified electrode. Van der Waals force, extended hydrogen bonds, and electrostatic interaction, for instance, all exist in ionic liquid. These properties of ILs that provide a specific interaction with metal nanoparticles allow for the creation of inorganic materials with a range of morphologies.21,22 The AgNPs are progressively increase in the soil and water reservoir. Inhalation of AgNPs in human tissue cells causes increase cytotoxicity and the concentration of reactive oxygen species (ROS). It is difficult to maintain the active state AgO in oxygen atmosphere therefore AgNPs possibly loose response for sensing of AP compared to the transition metal oxides. To the best of the authors' knowledge, ionic liquid-based TiO2-MoO3 has not yet been used for POM electrochemical sensing.
Among various preparation methods for TiO2-MoO3-1-butyl-3-methylimidazolium bromide (BMIMBr), the simple one-pot hydrothermal preparation approach can avoid introduction of impurities and toxic reducing agents, but the rate of nucleation, growth and aggregation of metal nanoparticles are out of control. Opportunely, ionic liquid (IL) has low interface tension and can enhance nucleation rate.23 Ultrafine metal NPs can be generated, which only undergo weak Ostwald ripening.24 ILs plays crucial role for the establishment of the protective layer at the particle surface and the subsequent electrosteric, solvation, and viscous stabilization of developing particles, their polarity and affinity towards particles and precursors, transport, and surface qualities appear to be particularly important.25 Furthermore, ILs is favorable to the formation of a soft sensing-interface, benefiting the recognition/rebinding of template molecule.
In this work, we have developed a simple electrochemical sensing platform based on solvohydrothermally prepared TiO2-MoO3-BMIMBr nanocomposite in the mixture of ILs and water for the sensitive detection of POM in pharmaceutical formulations and biological samples. The synthesized nanomaterials were characterized in detail using several advanced characterization techniques. The electrochemical performance of TiO2-MoO3-BMIMBr modified glassy carbon electrode (GCE) was evaluated by CV, DPV and chronoamperometry techniques. The modified GCE exhibits appreciable electrocatalytic activity towards POM oxidation and the modified electrode displayed a wide linearity, good sensitivity, selectivity, and high stability for the detection of POM. The TiO2-MoO3-BMIMBr/GCE based sensor has also been successfully used to measure POM in human urine samples and pills. Hence, the current study offers a new door for the electrochemical method of POM estimate employing a basic electrochemical sensing platform.
2. Experimental
2.1 Chemical reagent
Methyl imidazole (Sigma Aldrich, 99%), 1-bromo butane (C4H9Br), (Sigma Aldrich 99%), toluene (C6H5CH3) pub chem, titanium isopropoxide (Ti[OCH(CH3)2]4) Sigma Aldrich, ammonium heptamolybdate ((NH4)2MoO4) 99.98% trace metals basis, nitric acid (60–79%), Thomos baker. Dolo (paracetamol) 650 mg. Acetic Acid (99%) and sodium acetate (99%) (Thomos baker). All additional chemicals were of analytical quality, and double-distilled water was used to make all solutions.2.2 Instrumentation
With a rotating anode X-ray generator operating at Cu–K monochromatic radiation (=1.5418), a Bruker D8 Advance X-ray diffractometer (XRD) was used to evaluate the phase structures and crystalline size of the samples as-prepared. Thermo Scientific's XPS (VG Multilab 2000-Thermo Scientific, USA, K-Alpha), which can withstand high photonic energies of 0.1 to 3 keV, was used to gather the X-ray photoelectron spectra (XPS). The FT-IR-6600 spectrometer, manufactured by the Bruker business, was used to record FT-IR spectra. The spectrum was obtained using KBr, and the data was stored on an IFS 66V/S. Particle size and charge on material studied by using Litesizer 500 particle analyzer made by Anton Parr. All the electrochemical experiments were performed with (Autolab Metrohm PGSTAT 302N). All electrochemical experiments are performed with three eletrode systems glassy carbon electrodes (GCE), C110 of 3 mm diameter GCE used as working electrode or modified electrode, a counter electrode (Pt) and a reference electrode Ag/AgCl (in saturated KCl solution). All potentials in this paper were measured and reported versus Ag/AgCl. It is worth mentioning that in this study, and all experiments were carried out at laboratory temperature.2.3 Preparation of modified electrode
The modification, GCE (model C110, 3 mm diameter) was polished before each experiment with 0.05 μm alumina power, rinsed thoroughly with double distilled water between each polishing step, and then sonicated successively in 1![[thin space (1/6-em)]](https://www.rsc.org/images/entities/char_2009.gif) :
:![[thin space (1/6-em)]](https://www.rsc.org/images/entities/char_2009.gif) 1 nitric acid, absolute alcohol, double distilled water. The cleaned electrode was air dried. To prepare the modified electrodes, 2 mg of the active materials were dispersed into 2 ml ethanol to give homogeneous suspension upon bath sonication. 10 μL of the suspension was dropped (n = 3) onto GCE and the electrode was then dried at room temperature (RT). The modified electrode use further for electrochemical performance with paracetamol.
1 nitric acid, absolute alcohol, double distilled water. The cleaned electrode was air dried. To prepare the modified electrodes, 2 mg of the active materials were dispersed into 2 ml ethanol to give homogeneous suspension upon bath sonication. 10 μL of the suspension was dropped (n = 3) onto GCE and the electrode was then dried at room temperature (RT). The modified electrode use further for electrochemical performance with paracetamol.
2.4 Synthesis of ionic liquids [BMIM]+[Br]−
1-Butyl-3-methylimidazole bromide was prepared by a dropwise addition of 1-bromobutane (2.4 mol) to n-methylimidazole (1.85 mol) and toluene (0.13 mol) in round bottom flask at temperature 8 °C. The reaction was allowed to proceed at RT for 72 h. Afterwards, ionic liquid was extracted by using diethyl ether (25 mL × 2). Extracted ionic liquid was dried at temperature 60 °C for 24 h. Then ionic liquid was preserved in sealed container for further use.2.5 Synthesis of TiO2-BMIMBr
6.375 g TTIP, 6 ml BMIMBr ILs mixed in 25 ml of distilled water (DW). The mixture was stirred well to get a white precipitate. The obtained precipitate was dissolved using concentrated HNO3. The obtained clear solution was loaded into autoclave heated at 160 °C for 24 h. After cooling to RT, the product was isolated and purified by centrifugation and sequential washing with water and ethanol 4–5 times. The product was dried at 80 °C for 3 h and then annealed at 600 °C.2.6 Synthesis of MoO3-BMIMBr
1.8 g ammoniumheptamolybdtae, 6 ml BMIMBr ILs mixed in 25 ml of DW. The mixture was stirred well to get a white precipitate. The obtained precipitate was dissolved using concentrated HNO3. The obtained clear solution was loaded into autoclave heated at 160 °C for 24 h. After cooling to RT, the product was isolated and purified by centrifugation and sequential washing with water and ethanol 4–5 times. The product was dried at 80 °C for 3 h and then annealed at 600 °C.2.7 Synthesis of TiO2-MoO3-BMIMBr nanocomposite
Ionic liquid [BMIM]+[Br]− and DW each 12.5 ml were mixed into 100 ml round bottom flask and stirred at 150 rpm. Titanium isopropoxide (TTIP) (3.9085 ml) and ammonium heptamolybdate (3.489 g) were added into the mixture. The reaction leads to a white precipitate of the desired composition. The required amount of nitric acid was added to dissolve the white precipitate. The obtained broth poured into a Teflon-coated stainless steel autoclave hydrothermal cell. The autoclave was kept in furnace for 24 h at 150 °C. The mixture was collected and centrifuged using isopropanol. The semi-solid product was transferred to a Petri dish and dried for three hours in a hot air oven at 80 °C and annealed at 600 °C.3. Results and discussion
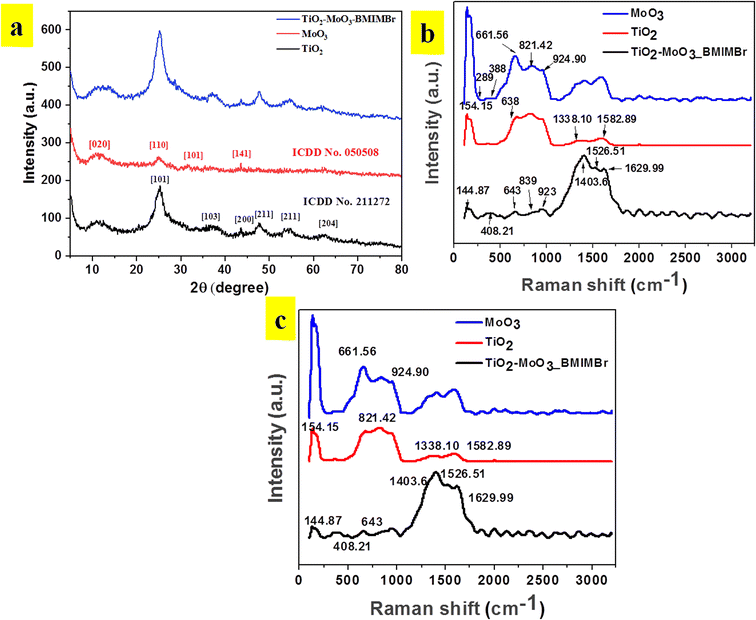
The X-ray diffraction patterns of TiO2, MoO3, and TiO2-MoO3-BMIMBr nanocomposite as shown in Fig. 1, The relevance of the nanocomposite with the standard ICDD data cards of TiO2 and MoO3 is attributed to the crystalline nature of the synthesized nanocomposite. The synthesized MoO3 crystallizes in a hexagonal structure (ICDD card No. 050508). Crystalline planes such as (020), (110), (101), (141), were observed for the MoO3 sample. For the reference TiO2 sample, the recorded diffraction peaks assigned to the rutile TiO2 crystalline structure and the respective crystalline planes are (101), (103), (200), (211) (204). From the diffraction patterns, the TiO2-MoO3-BMIMBr nanocomposite, strong and high intensity peaks corresponding to (020), (101), (103), (200) (211) (204) characteristic for both rutile TiO2 and α-MoO3 planes crystal structure and phases. The XRD analysis confirms the rutile TiO2 and alpha morphology of MoO3 in the nanocomposite. Using the Scherrer formula and the full width half maximum (FWHM) of the high intensity diffraction peak, the grain size was determined eqn (1)
 | (1) |
Raman spectra of pristine TiO2, MoO3 and TiO2-MoO3-BMIMBr nanocomposite are shown in Fig. 1b. The Peaks at 145, 379, 521, 671 cm−1 are the characteristic peaks of TiO2. Also the characteristic peaks of MoO3 Eg(1), B1g(1), A1g or B1g(2), and Eg(3) modes are found in TiO2-MoO3-BMIMBr nanocomposite respectively. This confirms the characteristic signatures of TiO2 and MoO3 in the nanocomposite. The relative intensities of the peaks in Fig. 1b at 643–652 cm−1 differ depending on the halogen anion. These peaks are assigned to the vibrational modes of the imidazolium ring; the 643 cm−1 band corresponds to the trans conformation of the C7–C8 bond of the n-butyl group and the 652 cm−1 peak corresponds to the gauche conformation.26 The detailed molecular vibration and rotation information of α-MoO3 and h-MoO3 are evidenced by Raman spectrum (Fig. 1b). For α-MoO3, the characteristic peak at 388.94 cm−1 is attributed to –O–Mo–O– scissoring, and 289 cm−1 to –O![[double bond, length as m-dash]](https://www.rsc.org/images/entities/char_e001.gif) Mo
Mo![[double bond, length as m-dash]](https://www.rsc.org/images/entities/char_e001.gif) O– wagging. Moreover, the peaks at 661.56 cm−1 (B2g, B3g asymmetric stretching of –MO–O–MO– are due to stretching; the 821.42 cm−1 and 994.90 cm−1 peaks are due to the stretching of terminal –Mo
O– wagging. Moreover, the peaks at 661.56 cm−1 (B2g, B3g asymmetric stretching of –MO–O–MO– are due to stretching; the 821.42 cm−1 and 994.90 cm−1 peaks are due to the stretching of terminal –Mo![[double bond, length as m-dash]](https://www.rsc.org/images/entities/char_e001.gif) O– bonds27 respectively. The intense rutile TiO2 Raman vibrations at 154.14 cm−1 (Eg), 201 cm−1 (Eg), 408.21 cm−1 (B1g) and 643 cm−1 (Eg) corresponding to the Eg and A1g vibration modes.28 The peaks situated at 276.18 cm−1 (B2g, B3g), 361.11 cm−1, 849.96 cm−1 symmetric stretching of terminal molybdenum to oxygen double bond and 952.73 cm−1 –MO–O–MO– linkage are the Raman characteristics of α-MoO3 (Table 1).29
O– bonds27 respectively. The intense rutile TiO2 Raman vibrations at 154.14 cm−1 (Eg), 201 cm−1 (Eg), 408.21 cm−1 (B1g) and 643 cm−1 (Eg) corresponding to the Eg and A1g vibration modes.28 The peaks situated at 276.18 cm−1 (B2g, B3g), 361.11 cm−1, 849.96 cm−1 symmetric stretching of terminal molybdenum to oxygen double bond and 952.73 cm−1 –MO–O–MO– linkage are the Raman characteristics of α-MoO3 (Table 1).29
| Wavenumber (cm−1) | Functional group |
|---|---|
| 144.87 | Eg(1) mode |
| 379 | B1g(1) mode |
| 521 | A1g or B1g(2) modes |
| 671 | Eg(3) mode |
| 643 | Trans conformation of the C7–C8 |
| 652 | Gauche conformation |
| 388.94 | –O–Mo–O– scissoring |
| 289 | –O![[double bond, length as m-dash]](https://www.rsc.org/images/entities/char_e001.gif) Mo Mo![[double bond, length as m-dash]](https://www.rsc.org/images/entities/char_e001.gif) O– wagging O– wagging |
| 661.56 | B2g, B3g asymmetric stretching of (–MO–O–MO–) |
| 821.42 and 994.90 | –Mo![[double bond, length as m-dash]](https://www.rsc.org/images/entities/char_e001.gif) O– O– |
| 154.14 | Eg mode |
| 201 | Eg mode |
| 408.21 | (B1g) |
| 643 | Eg and A1g vibration modes |
FTIR spectrum was performed to investigate chemical bonding states between molybdenum, titanium and oxygen atoms as shown in Fig. 1c. The intense peak at 557 cm−1 is assigned to the –Ti–O– stretching band which is the characteristic peak of TiO2.30 The spectrum in Fig. 1c shows a number of bands that are associated with surface-bound water, including the –O–H mode at 3147 cm−1 and deformation mode at 1615 cm−1. The –Mo–OH vibrational mode appears at 1406 cm−1, and was associated to the interaction of the Mo with some water in the surface. Bands arising from the Mo vibrations appear at 918 cm−1, being assigned to the vibrations of –Mo![[double bond, length as m-dash]](https://www.rsc.org/images/entities/char_e001.gif) O–.
O–.
The basic information in FTIR of the TiO2-MoO3-BMIMBr nanocomposites shows that at lower wavenumber of MoO3, the characteristic –Mo![[double bond, length as m-dash]](https://www.rsc.org/images/entities/char_e001.gif) O– asymmetric stretching band at 918 cm−1.31 Moreover, these bands affirm the formation of monolayer over TiO2 surface at lower MoO3 loadings, which is in correlation with the FTIR results.32 Before to the completion of monolayer coverage, the more aggregated polymolybdate structures cause a minor blue-shift in the 918 cm−1 band at MoO3 loadings.33 Therefore, FTIR and Raman analyses emphasize the formation of surface interaction of molybdate species within the monolayer at lower loadings of MoO3 in TiO2 with BMIMBr ionic liquid (Table 2).
O– asymmetric stretching band at 918 cm−1.31 Moreover, these bands affirm the formation of monolayer over TiO2 surface at lower MoO3 loadings, which is in correlation with the FTIR results.32 Before to the completion of monolayer coverage, the more aggregated polymolybdate structures cause a minor blue-shift in the 918 cm−1 band at MoO3 loadings.33 Therefore, FTIR and Raman analyses emphasize the formation of surface interaction of molybdate species within the monolayer at lower loadings of MoO3 in TiO2 with BMIMBr ionic liquid (Table 2).
| Functional group | Absorption location (cm−1) | Absorption intensity |
|---|---|---|
| –Ti–O– | 557 | Medium |
–Mo![[double bond, length as m-dash]](https://www.rsc.org/images/entities/char_e001.gif) O– (asymmetric stretching) O– (asymmetric stretching) |
918 | Weak |
| –Mo–OH | 1406 | Medium |
| –O–H (deformation mode) | 1615 | Strong |
| –O–H mode | 3147 | Medium, broad |
3.1 Dynamic light scattering (DLS) and zeta potential analysis
To analyze the particle size distribution of synthesized TiO2-MoO3-BMIMBr nanocomposite were subjected to dynamic light scattering (DLS) analysis. Here material was dispersed completely in ethanol using ultra-sonicator for DLS analysis. Results obtained as shown in Fig. 2a, reveals the monodisperse nature of particles with an average particle size was around 308 nm for TiO2, 198 nm for MoO3 and TiO2-MoO3-BMIMBr shows 646 nm. The enhanced particle size in composite observed due to ILs. As shown in Fig. 2b, zeta potential was employed to evaluate the stability of nanoparticles. The TiO2, MoO3 and TiO2-MoO3-BMIMBr zeta potential value was discovered to be 1.9 mV, 26.6 mV and 11.2 mV. The significance of zeta potential (ZP) is that its value can be related to the stability of the TiO2-MoO3-BMIMBr nanocomposite and pristine nanomaterial. From the ZP measurements, the MoO3 is found highly stable compared to TiO2 and nanocomposite. The decrease in the stability in case of nanocomposite possibly due to improper orientation of bulky cation of ionic liquid in the stern layer.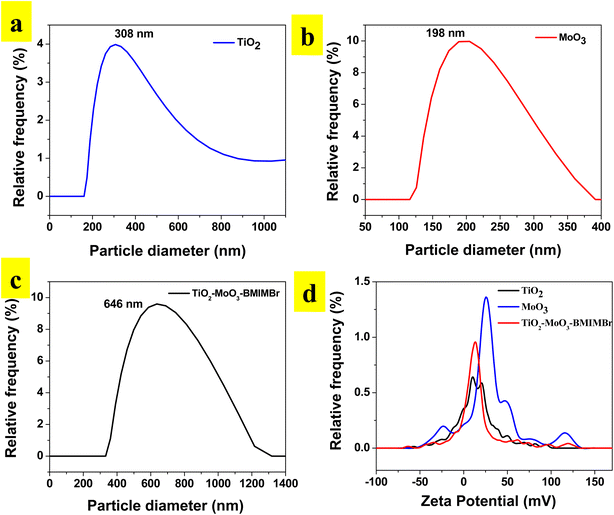 | ||
| Fig. 2 Particle distribution of (a) TiO2, (b) MoO3, (c)TiO2-MoO3-BMIMBr nanocomposites and (d) zeta potential plot overlay. | ||
3.2 Scanning electron microscopy
The morphology of synthesized nanomaterial determined by using SEM analysis. Obtained results as show in Fig. 3a and b reveals that the synthesized TiO2 nanoparticles and aggregated into an irregular structure at 1 μm resolutions. SEM images show the compactly arranged and uniformly deposited TiO2 nanoparticles over the substrate. The MoO3 shows sheet like morphology at 1 μm and 5 μm resolution. The SEM images of TiO2-MoO3-BMIMBr nanocomposites are demonstrated in Fig. 3e and f. These structures exhibited similar morphological characteristics with TiO2/MoO3. These structures exhibited similar morphological characteristics with TiO2/MoO3. The TiO2 nanoparticles and rod like morphlogy of ILs having thickness is at nanoscale adsorbed on the surface of sheet of MoO3 exhibit higher surface area.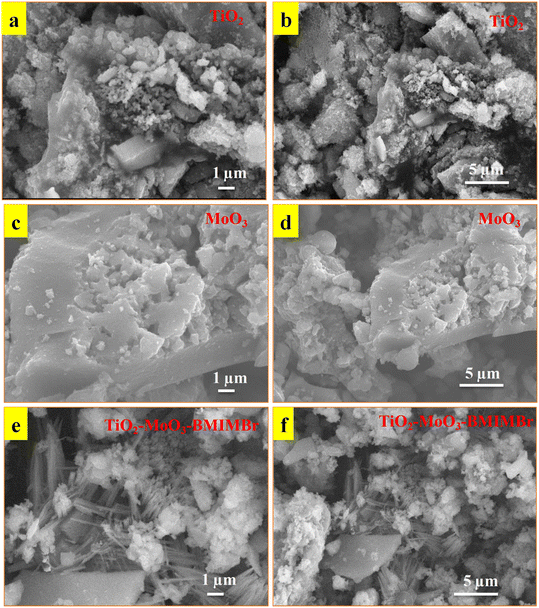 | ||
| Fig. 3 SEM images of synthesized TiO2 (a and b), MoO3 (c and d) and TiO2-MoO3-BMIMBr nanocomposite (e and f). | ||
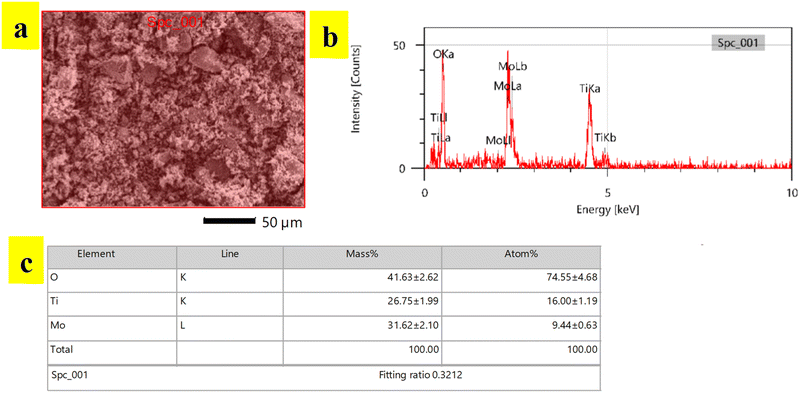
Compositional analysis of synthesized TiO2-MoO3-BMIMBr nanocomposite was done by EDS analysis. EDS spectra recorded during the SEM imaging technique and are shown in Fig. 4. The peaks around 2 to 3 keV are from the MO LI, MO Lb and MO La lines, and peaks observed with less counts are observed at 0.452 keV and 0.458 keV are due to Ti La and Ti LI line. The peaks around 0.5 keV are from the O Ka lines. Peaks observed at 4.5 keV and 4.9 keV are due to Ti Ka and Ti Kb line. The reason why electrons from the L and M shells fall back to form discrete X-ray quanta from L to K yields Ti Ka1 at 4.5 keV and from L to K gives Ka2 is because the incident electron will remove an electron from the Ti K shell. The inset picture shows the EDS of TiO2-MoO3-BMIMBr nanocomposite. As a result of the incident electron removing one electron from the Ti K shell, discrete X-ray quanta are produced when electrons from the L and M shells fall back to the Ti K shell (Ti Ka1 at 4.5 keV) and the Ti K shell (Ka2). It is observed that the nanoparticles contain molybdenum, titanium and oxygen elements predominantly. This confirms the presence of TiO2, MoO3 particles.
Fig. 5a shows the XPS survey spectrum of the representative TiO2-MoO3-BMIMBr nanocomposite, showing the existence of the elemental compositions of Mo 3d, Ti 2p, O 1s and Br in the TiO2-MoO3-BMIMBr while the absence of other peaks in the nanocomposite indicates that no impurities are present in the TiO2-MoO3-BMIMBr nanocomposite. The high resolution core level XPS spectrum for Ti 2p is illustrated in the Fig. 5b. It shows the appearances of the two distinct characteristics peaks at 459.57 eV and 465.48 eV corresponding to the Ti 2p3/2 Ti 2p1/2, respectively. However, it shows the slight shifting of the characteristics peaks to the higher binding energy (233.41 eV and 236.60 eV) values to that of bare Mo 3d5/2 and Mo 3d3/2 nanoparticles as shown Fig. 5c. Fig. 5d shows the high resolution core level O 1s XPS spectrum of the representative TiO2-MoO3-BMIMBr three distinct peaks it shows the strong peak at 531.25 eV assigned due to the characteristic binding energies for lattice oxygen of TiO2 and again it deconvoluted into two peaks at 533.26 eV and 534.17 eV corresponding to –Mo–O– binding and chemisorbed water. The Br 3d5/2 XPS spectrum comprises of Br 3d5/2.
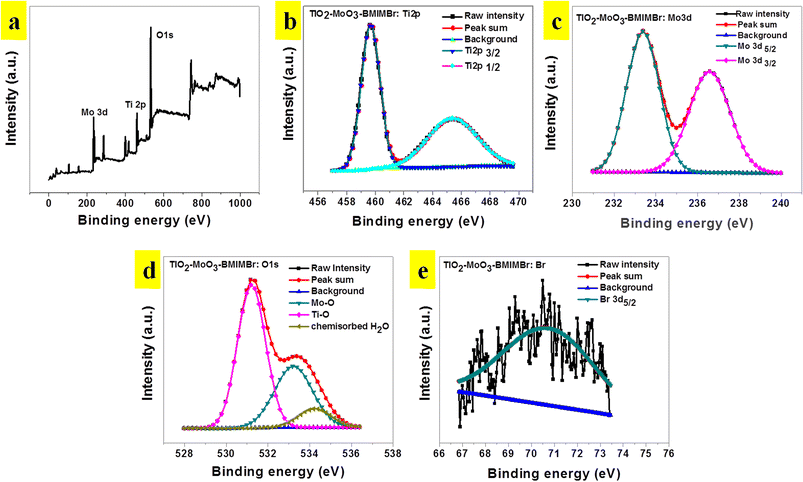 | ||
| Fig. 5 (a) XPS survey spectra, (b) Ti 2p (c) Mo 3d and (d) O 1s signals and (e) Br 3d of TiO2-MoO3-BMIMBr nanocomposite. | ||
3.3 Electrochemical properties measurements
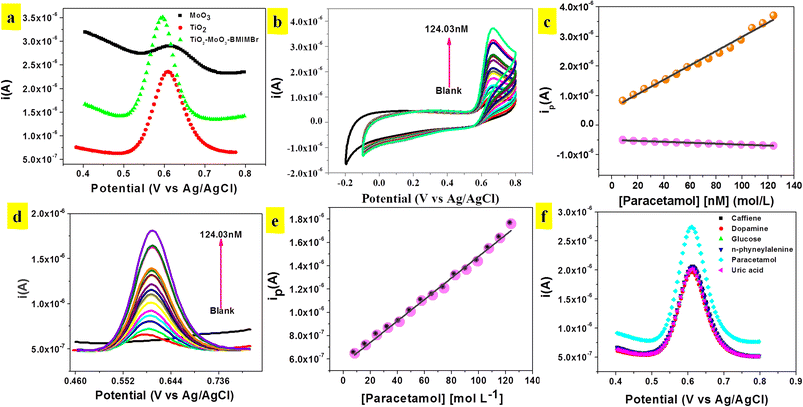
The phenolic hydroxyl group in paracetamol (POM) makes it electrochemically active and susceptible to oxidation. Hence, the electro catalytic behaviour of the modified TiO2-MoO3-BMIMBr electrode was examined. Using the Differential Pulse Voltammetry (DPV) technique with a scan rate of 50 mV s−1, the electrochemical behaviours of various modified glassy carbon electrodes (MoO3, TiO2, TiO2-MoO3-BMIMBr/GCE) in the presence of 0.1 M ABS pH 2 were investigated. Compared with the other modified electrode TiO2-MoO3-BMIMBr/GCE, the peak current signals at nanocomposite are much larger, indicating the strong electro catalytic activity for POM (82.6 nM) as shown in Fig. 6a. Fig. 6b shows the cyclic voltammograms of nanocomposite in 0.1 M of ABS with different concentration of POM from 8.26 nM–124.03 nM. The modified nanocomposite electrode successfully participates in the reversible electrochemical redox process of POM, thereby indicating a very fast and direct electron transfer of POM at the modified electrode (Epa = 0.66 V, Epc = 0.13 V). The oxidation peak current progressively rises with rising POM concentration, as can be seen. Fig. 6 displays the related calibration curve (peak current vs. POM concentration) (c). From 8.26 nM to 124.03 nM, the calibration curve shows linearity throughout the whole dose range. With a correlation coefficient R2 of 0.99, the sensitivity and limit of detection were 1.1598 A L mol−1 cm−2 and 11.54 nM, respectively.Fig. 6d illustrates DPV of TiO2-MoO3-BMIMBr nanocomposite for various concentration of POM from 8.26 nM–124.03 nM. From DPV POM oxidation peak observed at 0.60 V. As the concentration of POM increases, the anodic peak current also increases linearly this confirms the oxidation of POM is diffusion controlled. A plot of current density against concentration of POM is shown in Fig. 6e. The sensitivity and linear range were 24 μA L mol−1 cm−2. The limit of detection (LOD) was calculated to be 8.16 nM by using the formula 3σ/S (σ is the standard deviation of blank and S is the slope of calibration curve). Similarly, the corresponding limit of quantification (LOQ = 10σ/S) was found to be 27.21 nM.
In Fig. 6f biological samples there may be some interfering species which can be oxidized simultaneously along with POM at the electrode surface and may affect the detection tendency. Therefore, it is necessary to study the selectivity of TiO2-MoO3-BMIMBr nanocomposite modified GCE towards the detection of POM. Prepared sample solutions containing 100 nM POM with possible biological interfering compound shows the comparison of DPV with caffeine, dopamine, glucose, uric acid, n-phyneylalenine were measured to record the peak currents. These interferences have no great response in the detection of POM, suggesting the excellent selectivity of nanocomposite for the determination of POM. The main advantage of the TiO2-MoO3-BMIMBr nanocomposite modified GCE found herewith is its usefulness for the detection of POM in the real samples (urine sample) without the influence of any interferences.
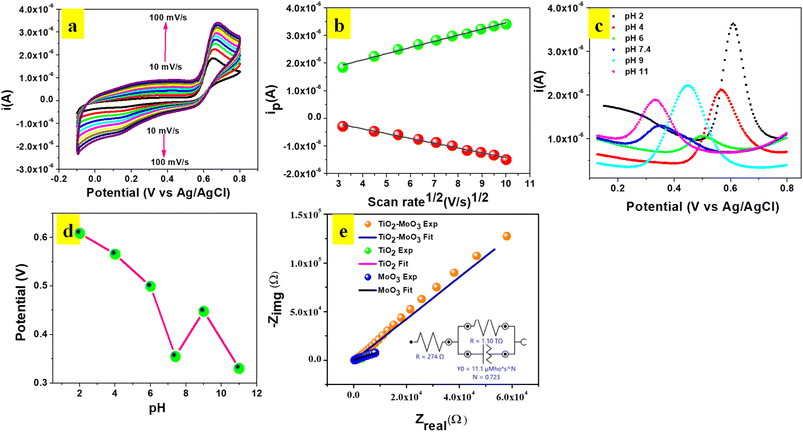
CV experiments were carried out to investigate the influence of scan rate at TiO2-MoO3-BMIMBr/GCE in 0.1 M ABS (pH 2) containing 124 nM POM (Fig. 7a). An evident linear relationship between the square root of the scan rate (υ1/2) and the oxidation peak current (Ip) in the range of 10–100 mV s−1 was obtained. The linear equation was described as: Ipa = 2.23 × 10⁻⁷X + 1.23 × 10⁻⁶υ1/2 (R2 = 0.99), and Ipc = −1.74 × 10⁻⁷X + 3.20 × 10⁻⁷υ1/2 (R2 = 0.99), validating the oxidation of POM as a diffusion-controlled process. Meanwhile, there was a positive shift of potential with the increase of scan rate, and the logarithm of scan rate (log![[thin space (1/6-em)]](https://www.rsc.org/images/entities/char_2009.gif) υ) vs. the anodic peak potential (Ep) appeared to have a proportional relationship. This could be due to changes in the electro catalytic activity and kinetic effect of GCE surface on the oxidation of POM especially at scan rates higher than 100 mV s−1 the time window for the POM oxidation becomes very narrow, avoiding the facile electron transfer between substrate and catalytic sites.
υ) vs. the anodic peak potential (Ep) appeared to have a proportional relationship. This could be due to changes in the electro catalytic activity and kinetic effect of GCE surface on the oxidation of POM especially at scan rates higher than 100 mV s−1 the time window for the POM oxidation becomes very narrow, avoiding the facile electron transfer between substrate and catalytic sites.
The equation for log![[thin space (1/6-em)]](https://www.rsc.org/images/entities/char_2009.gif) υ and Ep was: Ep = 0.0235
υ and Ep was: Ep = 0.0235![[thin space (1/6-em)]](https://www.rsc.org/images/entities/char_2009.gif) log
log![[thin space (1/6-em)]](https://www.rsc.org/images/entities/char_2009.gif) υ + 0.627 (R2 = 0.98). An equation for the irreversible process is described as following:
υ + 0.627 (R2 = 0.98). An equation for the irreversible process is described as following:
Ep = 2.303RT/2(1 − α)nF![[thin space (1/6-em)]](https://www.rsc.org/images/entities/char_2009.gif) log log![[thin space (1/6-em)]](https://www.rsc.org/images/entities/char_2009.gif) n + K n + K
| (2) |
The electron transfer kinetics of TiO2-MoO3-BMIMBr are further explored. Thus, the impedance spectra of TiO2, MoO3, and nanocomposite modified electrode in 0.1 M AB solution are shown in Fig. 7f. All the impedance spectra are fitted with a detailed fitting data (Table 3). The charge transfers resistances taking place at the solution interface (Rct) of different modified electrode are 400, 411, 274 Ω, respectively. The Rct of nanocomposite is smaller than TiO2, MoO3, which means that the nanocomposite promotes electron transfer. It is confirmed that TiO2-MoO3-BMIMBr has the better electron transfer ability for the lowest Rct.
| Materials | Rs (Ω) | Rct (TΩ) |
|---|---|---|
| TiO2 | 400 | 3.27 × 10⁻⁸ |
| MoO3 | 411 | 4.91 × 10⁻⁸ |
| TiO2-MoO3-BMIMBr | 274 | 1.10 |
3.4 Mechanism of interaction between the acetaminophen and modified nanocomposite
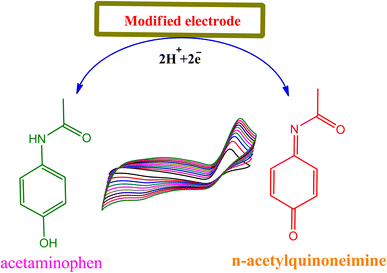
The mechanism of paracetamol oxidation is well known in the literature.35 On the surface of modified electrode (TiO2-MoO3-BMIMBr nanocomposite), acetaminophen undergoes electrochemical oxidation in a process that involves the loss of two electrons and two protons producing the product N-acetyl-p-quinoneimine (Scheme 1) and it dependent on pH value ≥6.0, N-acetyl-p-quinoneimine stable in deprotonated form and in acidic pH it is rapidly protonated.3.5 Reproducibility, reusability and stability
The assay stability of TiO2-MoO3-BMIMBr was studied through repeating the determination of 124.03 nM POM by CV. After each determination, the modified electrode used underwent 100 successive CV sweeps between −0.2 and 0.8 V at the rate of 50 mV s−1 in the ABS (pH 2) only 20% current drop. After 100 cycles, no more change was observed in the voltammetric profiles of the modified electrode as shown in Fig. S2a.† The fabrication reproducibility of TiO2-MoO3-BMIMBr was also investigated by chronoamperometry for detecting 124.03 nM paracetamol up to 5000 s were prepared independently by the same procedure, result shows more reproducibility as shown in Fig. S2b.† After that, this modified electrode was used to detect 124.03 nM paracetamol exhibited good reusability with convenience of reuse. Furthermore, when the modified electrode was stored in a RT at it exhibited no obvious decrease in the current response in the more than one month and maintained about 95% of its initial value after one month as shown in (Fig. S2c†). This investigation discloses that the sensor possesses good stability and can be employed for the practical application (Table 4).| Modified electrode | Linear range (mM) | Limit of detection (μM) | Sensitivity | Reference |
|---|---|---|---|---|
| TiO2-GR | 1.0–100 | 0.00021 | 4.04 mA mM | 36 |
| MoS2TiO2/rGO/SPE | 0.001–0.125 | 0.046 | 0.4425 (μA μM) | 37 |
| PEDOT/Au@graphene | 0.00015–5.88 | 0.041 | — | 38 |
| rGO–PEDOT nanotube | 0.001–0.035 | 0.4 | 16.85 μA μM−1 cm−2 | 39 |
| MoS2/TiO2 NC modified GCE electrode | 0.5–750 | 0.01 | 40 | |
| Cu2O/graphene | 0.00002–0.0013 | 0.0067 | — | 41 |
| Zn/ZnO/rGO/GCE | 0.05–2.0 | 13 | 166.5 ± 6 μA mM cm−2 | 42 |
| TiO2-MoO3-BMIMBr | 8.26 nM–124.03 nM | 0.0115 (CV), 0.0081 (DPV) | 1.1598 μA L mol−1 cm−2, 24 μA L mol−1 cm−2 | Present work |
3.6 Real sample analysis
The research is motivated to prepare an electrochemical active material for the practical application. Recovery tests were carried out for assay in human urine samples (voluntary 1 and 2). The samples were obtained from human after 12 h of administration of a tablet containing 500 mg of POM. Prior to analysis, the urine samples were diluted 100 times with ABS. Then the urine sample was added with a known concentration of POM. Using the prepared sensor to detect the concentration of POM in different urine samples before and after spiking, the results obtained were concluded in Table 5. Which indicated that the prepared sensor can be used as an effective and reliable sensing platform for detecting POM in real samples.| Voluntary 1 | Voluntary 2 | |||||
|---|---|---|---|---|---|---|
| Added (nM) | Found (nM) | Recovery (%) | Added (nM) | Found (nM) | Recovery (%) | |
| Unspiked | 49.3 | 50.2 | 102.0 | 50.2 | 49.7 | 99.1 |
| 99.6 | 99.0 | 100.0 | 82.7 | 83.9 | 101.0 | |
| 140.0 | 138.0 | 98.5 | 117.0 | 116.0 | 99.2 | |
| Spiked | 41.7 | 41.0 | 98.3 | 41.9 | 41.0 | 98.0 |
| 89.2 | 88.7 | 99.4 | 82.7 | 82.3 | 99.5 | |
| 125 | 124.0 | 99.2 | 125.0 | 124.0 | 99.7 | |
4. Conclusion
A nanocomposite material TiO2-MoO3-BMIMBr, spherical in shape was developed and applied for the electrochemical detection of acetaminophen from Dolo 650 mg under neutral conditions. On the other hand, the ILs enhances the nucleation rate and provides the conductive bridges to improve the electron transfer between the rutile TiO2 and α-MoO3. From the CV measurements, the electrocatalytic ability of the GCE modified with TiO2-MoO3-BMIMBr nanocomposite shows good linear relationship with the concentration of acetaminophen up to nM range. The quantitative determination of acetaminophen by the TiO2-MoO3-BMIMBr modified electrode was studied by CV and DPV with a linear range of 8.26–124.03 nm. The sensitivity and detection limits found to be 1.16 μA L mol−1 cm−2 and 11.54 nM by CV and 24 μA L mol−1 cm−1 and 8.16 nM by DPV and a detection limit of 0.4 mM were achieved in 0.1 M ABS (pH 2) at an applied potential of 0.60 V. The TiO2-MoO3-BMIMBr modified electrode also exhibits excellent selectivity for acetaminophen and reproducibility investigated by chronoamperometry for up to 5000 s. The proposed TiO2-MoO3-BMIMBr based acetaminophen sensor shows high potential for applications for more practical purposes.Author contributions
Anita K. Tawade and Ajay P. Khairnar – methodology, experimentation and writing rough draft. Jayashri V. Kamble, Akash R. Kadam, Anil A. Powar: experimentation and analysis. Kiran Kumar K. Sharma, Sawanta S. Mali and Chang Kook Hong: resources. Vijay S. Patil, Manohar R. Patil, Shivaji N. Tayade: supervision, validation, conceptualization and editing original draft.Conflicts of interest
All authors declares that there is no financial or any other authorship related conflict of interest amongst the authors.Acknowledgements
Anita Tawade is thankful to Chhatrapati Shahu Maharaj Research, Training and Human Development Institute (SARTHI), Pune for providing JRF.References
- National Center for Health Statistics, Center For Disease Control, & Prevention, 2017, Health, United States, 2016, with chart book on long-term trends in health Search PubMed.
- A. J. Hall, et al., Pharmaceutical Overdose Fatalities, Jama, 2008, 300, 2613–2620 CrossRef CAS PubMed.
- CDC, Health, United States, 2016, With Chartbook on Long-term Trends in Health, Department of Health and Human Services at 2017.
- E. Bayram and E. Akyilmaz, Development of a new microbial biosensor based on conductive polymer/multiwalled carbon nanotube and its application to paracetamol determination, Sens. Actuators, B, 2016, 233, 409–418 CrossRef CAS.
- J. C. McCrae, E. E. Morrison, I. M. MacIntyre, J. W. Dear and D. J. Webb, Long-term adverse effects of paracetamol – a review, Br. J. Clin. Pharmacol., 2018, 84, 2218–2230 CrossRef CAS PubMed.
- A. Shraim, et al., Analysis of some pharmaceuticals in municipal wastewater of Almadinah Almunawarah, Arabian J. Chem., 2017, 10, S719–S729 CrossRef CAS.
- G. Abirami and T. Vetrichelvan, Simultaneous determination of Tolperisone and Paracetamol in pure and fixed dose combination by UV - Spectrophotometry, Int. J. Pharm. Pharm. Sci., 2013, 5, 488–492 CAS.
- D. Easwaramoorthy, Y. C. Yu and H. J. Huang, Chemiluminescence detection of paracetamol by a luminol-permanganate based reaction, Anal. Chim. Acta, 2001, 439, 95–100 CrossRef CAS.
- S. Kotresh, Y. T. Ravikiran, H. G. R. Prakash and S. C. V. Kumari, Polyaniline-Titanium dioxide composite as humidity sensor at room temperature, Nanosyst.: Phys., Chem., Math., 2016, 7, 732–739 CAS.
- R. R. Cunha, M. M. A. C. Ribeiro, R. A. A. Muñoz and E. M. Richter, Fast determination of codeine, orphenadrine, promethazine, scopolamine, tramadol, and paracetamol in pharmaceutical formulations by capillary electrophoresis, J. Sep. Sci., 2017, 40, 1815–1823 CrossRef CAS PubMed.
- X. Zhang, R. Li, W. Hu, J. Zeng, X. Jiang and L. A. Wang, Reliable LC-MS/MS Method for the Quantification of N-acetyl-p-benzoquinoneimine, Acetaminophen Glutathione and Acetaminophen Glucuronide in Mouse Plasma, Liver and Kidney: Method Validation and Application to a Pharmacokinetic Study, Biomed. Chromatogr., 2018, 32, e4331 CrossRef PubMed.
- M. Kyriakides, L. Maitre, B. D. Stamper, I. Mohar, T. J. Kavanagh, J. Foster, I. D. Wilson, E. Holmes, S. D. Nelson and M. Coen, Comparative Metabonomic Analysis of Hepatotoxicity Induced by Acetaminophen and Its Less Toxic Meta-Isomer, Arch. Toxicol., 2016, 90, 3073–3085 CrossRef CAS PubMed.
- S. C. Chaves, P. N. C. Aguiar, L. M. F. C. Torres, E. S. Gil, R. C. S. Luz, F. S. Damos, R. A. A. Munoz, E. M. Richter and W. T. P. Santos, Simultaneous Determination of Caffeine, Ibuprofen, and Paracetamol by Flow-Injection Analysis with Multiple-Pulse Amperometric Detection on Boron-Doped Diamond Electrode, Electroanal, 2015, 27, 2785–2791 CrossRef CAS.
- T. Y. Huang, et al., A high performance electrochemical sensor for acetaminophen based on a rGO-PEDOT nanotube composite modified electrode, J. Mater. Chem. A, 2014, 2, 7229–7237 RSC.
- W. Zhang, X. Xiao, L. Zheng and C. Wan, Fabrication of TiO2/MoS2 Composite Photocatalyst and Its Photocatalytic Mechanism for Degradation of Methyl Orange under Visible Light, Can. J. Chem. Eng., 2015, 93, 1594–1602 CrossRef CAS.
- M. Layegh, F. E. Ghodsi and H. Hadipour, Improving the electrochemical response of nanostructured MoO3 electrodes by Co doping: Synthesis and characterization, J. Phys. Chem. Solids, 2018, 121, 375–385 CrossRef CAS.
- T. Ghrib, et al., Structural, optical and electrical properties of the Zn doped MoO3 deposited on porous silicon, Sens. Actuators, A, 2019, 297, 111537 CrossRef CAS.
- K. Xu, et al., Design of NiCo 2 O 4 porous nanosheets/α-MoO 3 nanorods heterostructures for ppb-level ethanol detection, Powder Technol., 2019, 345, 633–642 CrossRef CAS.
- N. S. K. Gowthaman, H.-N. Lim and S. Shankar, Electrochemical Scaffold Based on Silver Phosphate Nanoparticles for the Quantification of Acetaminophen in Body Fluids and Pharmaceutical Formulations, ACS Appl. Nano Mater., 2019, 3, 1213–1222 CrossRef.
- M. P. Bhat, S. Vinayak, J. Yu, H. Y. Jung and M. Kurkuri, Colorimetric receptors for the detection of biologically important anions and their application in designing molecular logic gate, ChemistrySelect, 2020, 5, 13135–13143 CrossRef CAS.
- Z. L. Xie and D. S. Su, Ionic liquid based approaches to carbon materials synthesis, Eur. Inorg. Chem., 2015, 1137–1147 CrossRef CAS.
- H. Park, S. H. Yang, Y. S. Jun, W. H. Hong and J. K. Kang, Facile route to synthesize largemesoporous γ-alumina by room temperature ionic liquids, Chem. Mater., 2007, 19, 535–542 CrossRef CAS.
- M. Antonietti, D. Kuang, B. Smarsly and Y. Zhou, Ionic liquids for the convenient synthesis of functional nanoparticles and other inorganic nanostructures, Angew. Chem., Int. Ed., 2004, 43, 4988–4992 CrossRef CAS PubMed.
- Z. Wang, Q. Zhang, D. Kuehner, A. Ivaska and L. Niu, Green synthesis of 1–2 nm gold nanoparticles stabilized by amine-terminated ionic liquid and their electrocatalytic activity in oxygen reduction, Green Chem., 2008, 10, 907–990 RSC.
- A. Gołąbiewska, M. Paszkiewicz-Gawron, A. Sadzińska, W. Lisowski, E. Grabowska, A. Zaleska-Medynska and J. Łuczak, Fabrication and photoactivity of ionic liquid–TiO2 structures for efficient visible-light-induced photocatalytic decomposition of organic pollutants in aqueous phase, Beilstein J. Nanotechnol., 2018, 9, 580–590 CrossRef PubMed.
- T. Yamada and M. Mizuno, Characteristic Spectroscopic Features because of Cation-Anion Interactions Observed in the 700-950 cm-1 Range of Infrared Spectroscopy for Various Imidazolium-Based Ionic Liquids, ACS Omega, 2018, 3, 8027–8035 CrossRef CAS PubMed.
- Crystal Research and Technology – 2011 – Yang – Hydrothermal synthesis of MoO3 nanobelt graphene composites.pdf.
- L. Fang, J. Chen, M. Zhang, X. Jiang and Z. Sun, Introduction of Ti3+ ions into heterostructured TiO2 nanotree arrays for enhanced photoelectrochemical performance, Appl. Surf. Sci., 2019, 490, 1–6 CrossRef CAS.
- K. V. Alex, et al., Substrate temperature induced effect on microstructure, optical and photocatalytic activity of ultrasonic spray pyrolysis deposited MoO3 thin films, Mater. Res. Express, 2019, 6, 0–15 CAS.
- M. M. Ba-abbad, A. A. H. Kadhum, A. B. Mohamad and M. S. Takriff, 7064871.Pdf, Int. J. Electrochem. Sci., 2012, 7, 4871–4888 CrossRef CAS.
- X. Li, X. Li, J. Li and J. Hao, Identification of the arsenic resistance on MoO3 doped CeO2/TiO2 catalyst for selective catalytic reduction of NOx with ammonia, J. Hazard. Mater., 2016, 318, 615–622 CrossRef CAS PubMed.
- H. Zhu, et al., Dispersion behaviors of molybdena on titania (rutile and/or anatase), J. Phys. Chem. B, 2005, 109, 11720–11726 CrossRef CAS PubMed.
- G. Mestl and T. K. K. Srinivasan, Raman spectroscopy of monolayer-type catalysts: Supported molybdenum oxides, Catal. Rev. - Sci. Eng., 1998, 4, 451–570 CrossRef.
- R. M. A. Tehrani and H. Ghadimi, Sensitive Voltammetric Determination of Acetaminophen at Poly(4-vinyl pyridine)/Graphene Composite Modified Electrode, Anal. Bioanal. Chem. Res., 2016, 3, 11–121 Search PubMed.
- J. J. Van Benschoten, J. Y. Lewis, W. R. Heineman, D. A. Roston and P. T. Kissinger, J. Chem. Educ., 1983, 60, 772 CrossRef CAS.
- Y. Fan, J. H. Liu, H. T. Lu and Q. Zhang, Electrochemical behavior and voltammetric determination of paracetamol on Nafion/TiO2-graphene modified glassy carbon electrode, Colloids Surf., B, 2011, 85, 289–292 CrossRef CAS PubMed.
- N. Demir, K. Atacan, M. Ozmen and S. Z. Bas, Design of a new electrochemical sensing system based on MoS2-TiO2/reduced graphene oxide nanocomposite for the detection of paracetamol, New J. Chem., 2020, 44, 11759–11767 RSC.
- M. Li, W. Wang, Z. Chen, Z. Song and X. Luo, College of Biology and Collaborative Innovation Center for Molecular Engineering and Molecular Sciences and Biomedicine Laboratory , State Key Laboratory for SC, Sens. Actuators, B, 2018, 260, 778–785 CrossRef CAS.
- T. Y. Huang, C. W. Kung, H. Y. Wei, K. M. Boopathi, C. W. Chu and K. C. Ho, A high performance electrochemical sensor for acetaminophen based on a rGO–PEDOT nanotube composite modified electrode, J. Mater. Chem. A, 2014, 2(20), 7229–7237 RSC.
- N. Kumar, A. S. Bhadwal, B. Mizaikoff, S. Singh and C. Kranz, Electrochemical detection and photocatalytic performance of MoS2/TiO2 nanocomposite against pharmaceutical contaminant: Paracetamol, Sens. Bio-Sensing Res., 2019, 24, 2–10 Search PubMed.
- H. Yang, B. Liu, Y. Ding, L. Li and X. Ouyang, Fabrication of cuprous oxide nanoparticles-graphene nanocomposite for determination of acetaminophen, J. Electroanal. Chem., 2015, 757, 88–93 CrossRef CAS.
- M. Ozcan, A. Basak and A. Uzunoglu, Construction of High-Performance Amperometric Acetaminophen Sensors Using Zn/ZnO-Decorated Reduced Graphene Oxide Surfaces, ECS J. Solid State Sci. Technol., 2020, 9, 093003 CrossRef CAS.
Footnotes |
| † Electronic supplementary information (ESI) available. See DOI: https://doi.org/10.1039/d3ra02611f |
| ‡ Equal first authors. |
| This journal is © The Royal Society of Chemistry 2023 |

