 Open Access Article
Highly efficient and selective CO2 capture of Li2CO3- and (Li–K)2CO3-based porous carbon composites†
Honghao Li and
Tuerxun Nasiman *
*
College of Chemistry and Chemical Engineering, Xinjiang Normal University, Urumqi, 830054, China. E-mail: 384546761@qq.com
First published on 4th July 2023
Abstract
In this study, Li2CO3- and (Li–K)2CO3-based porous carbon composites were synthesized from terephthalic acid, lithium hydroxide and sodium hydroxide through calcination at different temperatures. These materials were fully characterized through X-ray diffraction, Raman spectroscopy, and nitrogen adsorption and desorption. Results showed that the excellent CO2 capture capacities of LiC-700 °C and LiKC-600 °C were 140 and 82 mg CO2 g−1 at 0 °C and 25 °C, respectively. Additionally, it is calculated that the selectivity of LiC-600 °C and LiKC-700 °C with a CO2/N2 (15![[thin space (1/6-em)]](https://www.rsc.org/images/entities/char_2009.gif) :
:![[thin space (1/6-em)]](https://www.rsc.org/images/entities/char_2009.gif) 85) mixture was about 27.41 and 15.04, respectively. Therefore, Li2CO3- and (Li–K)2CO3-based porous carbon materials could be used to effectively capture CO2 with high capacity and high selectivity.
85) mixture was about 27.41 and 15.04, respectively. Therefore, Li2CO3- and (Li–K)2CO3-based porous carbon materials could be used to effectively capture CO2 with high capacity and high selectivity.
1 Introduction
Over the past few decades, excessive human-caused carbon dioxide (CO2) emissions, such as the combustion of fossil fuels and their derivatives, have been identified as the main cause of the greenhouse effect, ocean acidification and related climate change.1,2 According to the latest data from the Mauna Loa Observatory in August 2021,3 the current level of CO2 in the atmosphere has reached up to 416 ppm, which is nearly 200 ppm higher than that of the pre-industrial period, and far exceeds the consumption capacity of plants in the natural carbon cycle. Therefore, it is very important, even urgent that we reduce carbon emissions for human health.4,5 Although there have been many studies on converting fossil fuels that produce CO2 into renewable clean energy, the capture and storage of carbon dioxide is still believed to be the fastest and most effective solution to reduce the current emission levels in the use of fossil fuel-based power plants (usually coal-based ones). To date, there are many important and cost-effective post-combustion CO2 capture methods, such as modified amine solution absorption, solid adsorption and membrane separation. In order to have excellent adsorption reversibility, adsorbent recyclability and adsorption efficiency, adsorbents must have large specific surface area, high selectivity and high cycle stability.6Recently, solid alkali metal carbonate adsorbents have attracted more and more attention in the CO2 capture due to their higher capture capacity and low cost than those of others. For example, Na2CO3 was reported as a good CO2 adsorbent under (0.1 MPa at >313 K).7,8 Results showed that humidity played a critical role in CO2 capture capacity and the overall reaction rate. With the increase of H2O concentration, both the rate and amount of captured CO2 were increased significantly, because carbonate could capture CO2 under humid conditions to generate bicarbonate (eqn (1)). After the CO2 capture, the adsorbent could be regenerated and recycled after the decomposition of bicarbonate at 100–200 °C (reverse reaction of eqn (1)).9
| CO32− + H2O + CO2 ⇌ 2HCO3− | (1) |
Theoretically, the CO2 adsorption capacities of commercial Na2CO3 and K2CO3 were 41.5 wt% and 31.8 wt%, respectively.10 According to the thermogravimetric analysis from Luo et al.,11 with high CO2 and H2O concentrations, pure Na2CO3 reacted with CO2 and H2O to form NaHCO3 directly. However, with low CO2 and H2O concentrations, Na2CO3 preferentially reacted with H2O to generate Na2CO3·H2O, and this hydrate slowly reacted with CO2 to produce Na5H3(CO3)4, which finally slowly reacted with CO2 and H2O to form NaHCO3. Additionally, Cai et al.,12 basing on density functional theory and molecular dynamics simulation, studied the adsorption process and adsorption types of CO2 and H2O on Na2CO3 crystal surfaces from the atomic scale. Their results showed that the carbonation reaction rate of Na2CO3 was not controlled by the kinetics of the surface reaction, was controlled by the phase diffusion of the adsorbent.
Typically, pure carbonate adsorbents have low cost, low energy consumption, high stability, etc., and are widely used in the petrochemical industry. However, the reaction between carbonate and CO2 is slow, and special operation equipment is required, which increase the cost significantly. In practical applications, other materials (such as activated carbon, MgO, zeolite molecular sieve, etc.) have been added to combine with of the adsorbent,11 which can not only increase the adsorption rate and reduce the regeneration temperature, but also increase the CO2 adsorption capacity. For example, the regeneration temperature of Na2CO3–carbon nanocomposite (NaC-NC) was lower than that of Na2CO3, the CO2 capture capability of NaC-NC was also higher with a higher reaction rate that was 1.5 to 2 times that of untreated Na2CO3. When K2CO3–carbon composite (KC–CC) was used instead of NaC-NC, a slightly smaller CO2 amount was captured with a lower regeneration temperature13.
In this study, in order to have high adsorption capacity and adsorption rate, Li2CO3-based porous carbon materials were prepared from terephthalic acid and lithium hydroxide. With the added KOH to these same raw materials, (Li–K)2CO3-based porous carbon materials were further synthesized. With Li2CO3- and (Li–K)2CO3-based porous carbon materials, the CO2 capture performance and cycle stability of these materials were significantly improved, and their regeneration temperature was also reduced.
2 Experimental
2.1 Sample preparation
2.2 Characterization of materials
The XRD pattern was collected on a Rigaku Smartlab SE X-ray diffractometer from Japan, with a Cu target, a Kα radiation source, λ = 1.5418 nm, a tube voltage of 40 kV, and a tube current of 40 mA. The weight loss process of the material was recorded on a German Netzsch STA 449 F3 thermogravimetric analyzer under a N2 atmosphere (20 mL min−1) and a heating rate of 10 °C min−1. The sorbent was analyzed using a high-resolution field emission scanning electron microscope (SEM), Zeiss sigma300 surface topography and structure, the acceleration voltage was 3 kV. The Raman analysis was done on a HORIBA Scientific LabRAM HR Evolution spectrometer. At room temperature, the laser wavelength of 514 nm was used with the wavenumber range of 800–2000 cm−1. The adsorption and desorption isotherms of CO2 and N2 were measured using an adsorption instrument (ASAP 2460, Micromeritics Instrument Co., Ltd., USA). T the specific surface area was calculated according to the Brunauer–Emmett–Teller (B–E–T) method. The pore volume (Vpore) and pore size (Dpore) distribution were calculated according to the Barrett–Joyner–Halenda (B–J–H) formula. The number and strength of basic sites on the surface of the adsorbent were CO2 determined through temperature-programmed desorption (CO2-TPD) on a chemisorption instrument (AutoChem II 2920, Micromeritics Instruments, Inc., USA).2.3 Adsorption test
 | (2) |
Qst = −RT2 (∂![[thin space (1/6-em)]](https://www.rsc.org/images/entities/char_2009.gif) ln ln![[thin space (1/6-em)]](https://www.rsc.org/images/entities/char_2009.gif) P/∂T)q P/∂T)q
| (3) |
3 Results and discussion
3.1 Characterization
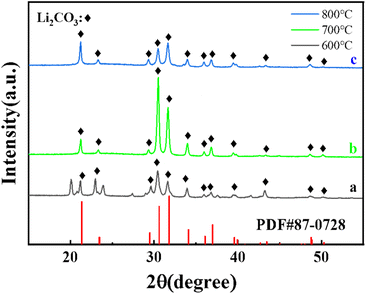
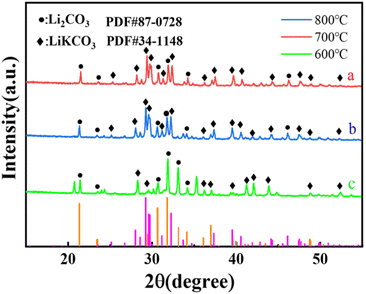
The XRD patterns of Li2CO3-based porous carbon materials prepared at three different calcination temperatures of 600, 700 and 800 °C were shown in Fig. 1. Their diffraction peaks were basically consistent with the lithium carbonate standard card PDF#87-0728. When the calcination temperature was 700 °C, the peak intensity of Li2CO3 was the highest, indicating the highest crystal phase content at 700 °C. The lithium carbonate was from the carbonation of lithium terephthalate, because terephthalate reacted with lithium hydroxide in solution to generate lithium terephthalate whose chemical bonds in the benzene ring and carboxyl group could be broken at high temperature to form CO2, H2O, amorphous carbon and Li2CO3. Fig. 2 shows XRD patterns of (Li–K)2CO3-based porous carbon materials prepared at three different calcination temperatures of 600, 700 and 800 °C. The diffraction peaks in the patterns were mainly from LiKCO3 (PDF#88-0341) and Li2CO3 (PDF#87-0729). When the calcination temperature was 600 °C, the crystal phase was more stable with higher crystal phase content than those from other temperatures. Further increasing the calcination temperature would lead to more unstable impurity phases with lower peak intensity. Due to the better purity of these samples, we further considered LiC-700 °C and LikC-600 °C.Fig. 3 shows the thermogravimetric curve of LiC-700 °C under a nitrogen atmosphere. This Li2CO3-based porous carbon material had a small weight loss between room temperature and 624.31 °C, mainly due to the adsorbed water vapor and CO2 from the air. There was a significant weight loss of about 45% from 624.31 °C to 820.55 °C because of the loss of the volatile substances through oxidization. As shown in Fig. 3b, the LiKCO3-based porous carbon material only had a small amount of weight loss from 108.33 °C to 184.62 °C, mainly due to the adsorbed impurities such as water vapor and CO2 from the air. The significant weight loss of about 60% from 596.37 °C to 973.13 °C came from the carbonization of material. Fig. 3(c) and (d) showed the weight loss processes of LiC and LiKC material at three calcination temperatures. It was found that the material synthesized at 800 °C was the fastest to lose the weight at the beginning. When the temperature was increased to 900 °C, LiC-600 °C and LiKC-800 °C materials had the lowest ash content.
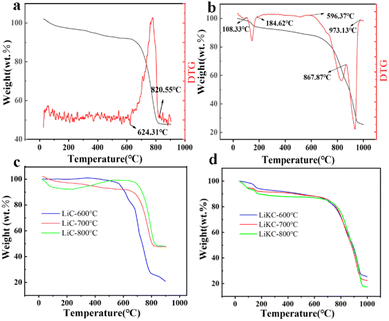 | ||
| Fig. 3 Thermogravimetric curves of LiC-700 °C (a) and LiKC-600 °C (b), and thermogravimetric curves of materials with calcination temperatures (c and d). | ||
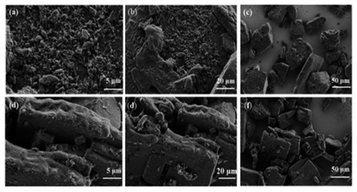
Fig. 4 shows SEM images of materials LiC-700 °C and LiKC-600 °C. The irregular porous particle structure on their surface could be clearly observed, which might increase their specific surface area.
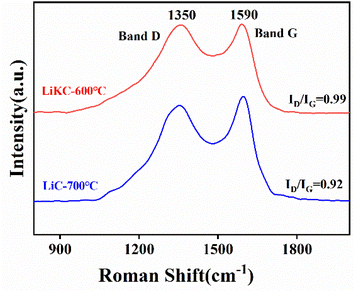
As shown in Fig. 5, the two Raman characteristic peaks at 1350 and 1590 cm−1 corresponded to the G band and D band, respectively. The D band indicated the degree of disorder of the amorphous carbon and the defects of the graphite phase, and the G band was due to the bending vibration of sp2 hybridized graphite phase carbon atoms. Relative intensity (ID/IG) of the two peaks indicates the density of defects or the degree of graphitization and a high ratio means high defectivity. With the addition of KOH, the value of ID/IG was increased from 0.92 to 0.99, indicating that the addition of KOH increased the number of defects in the carbon skeleton of LiKC-600 °C.
Fig. 6 shows the N2 adsorption–desorption isotherms and pore size distribution diagrams of these materials, and Table 1 lists their structural properties. They were all type IV isotherms, indicating they were all mesoporous. Typically, the adsorption properties of mesoporous materials are determined by the adsorbent-adsorbed species interactions, as well as the interactions between molecules in the condensed state. In these mesopores, the initial monolayer–multilayer adsorption on the mesoporous walls follows the corresponding partial path of the type II isotherm. However, subsequent condensation can occur within the pore. During the desorption process, a hysteresis loop can be formed due to capillary condensation. Based on the pore size distribution diagrams these two materials (LiC-700 °C and LiKC-600 °C) were dominated by mesopores, and their pore structure data could be calculated according to the adsorption isotherm as listed in Table 1. The specific surface area of LiKC-600 °C was 320.0 m2 g−1, and that of LiKC-600 °C was 126.8 m2 g−1. Their pore volumes were 0.27 cm3 g−1 and 0.145 cm3 g−1 with the average pore diameters of 20.6 nm and 15.4 nm, respectively. Fig. S1(a)–(d) and S2(a), (b)† show the N2 adsorption and desorption isotherm data and pore size distribution of other materials. Data showed that the pore volume and specific surface area of other materials were lower.
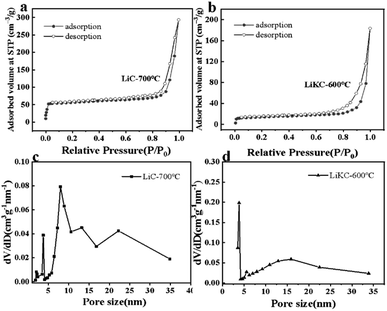 | ||
| Fig. 6 N2 adsorption–desorption isotherms of LiC-700 °C (a) and LiKC-600 °C (b), and pore size distributions of LiC-700 °C (c) and LiKC-600 °C (d). | ||
| Adsorbent | SBET (m2 g−1) | Vtotal (cm3 g−1) | Pore size (nm) |
|---|---|---|---|
| LiC-600 °C | 136.1 | 0.18 | 14.1 |
| LiC-700 °C | 320.0 | 0.27 | 20.6 |
| LiC-800 °C | 124.4 | 0.28 | 17.4 |
| LiKC-600 °C | 126.8 | 0.15 | 15.4 |
| LiKC-700 °C | 23.1 | 0.06 | 15.8 |
| LiKC-800 °C | 7.5 | 0.05 | 15.4 |
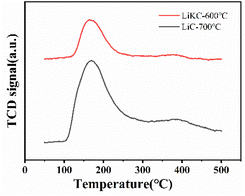
The CO2-TPD experiment was done to study the effect of adsorbent surface alkalinity on its CO2 adsorption performance. As shown in Fig. 7, both of these two samples had two CO2 desorption peaks in the temperature range of 50–500 °C. The α peak at 100–250 °C was a strong desorption peak, and these strong basic sites could improve their CO2 adsorption performance. The β peak at 300–450 °C was a weak desorption peak due to the adsorption of CO2 by weak alkaline sites on the surface of the adsorbent. Both the strength and number of basic sites of LiC-700 °C were larger than those of LiKC-600 °C, and the significant α peak indicated that the increase in the number and strength of basic sites was beneficial to the adsorption of acid gas CO2. Based on the specific surface area and XRD characterization results of these materials, they should be excellent candidates as adsorbents in the CO2 adsorption process.
3.2 CO2 adsorption properties of composites
The ASAP-2460 adsorption analyzer was used to evaluate the CO2 adsorption performance of the as-prepared sorbents. CO2 isothermal adsorption curves at 0 and 25 °C were shown in Fig. 8. Fig. 8(a) and (b) shows that the largest CO2 adsorption capacity of LiC-700 °C reached up to 140 and 82 mg CO2 g−1 at 0 and 25 °C under 1 bar, respectively. However, the CO2 adsorption capacity of LiKC-600 °C was relatively low under 1 bar as 60 and 31 mg CO2 g−1 at 0 and 25 °C, respectively. Results showed that all isothermal adsorption curves at different temperatures had the same trend, and the CO2 adsorption isotherms at 0 °C were generally higher than those at 25 °C.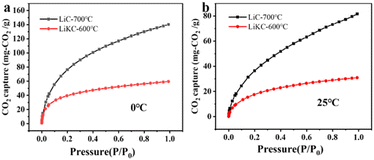 | ||
| Fig. 8 CO2 adsorption isotherms at 0 °C (a) and 25 °C (b) of LiC-700 °C and LiKC-600 °C under a pressure from 0.01 to 1 bar. | ||
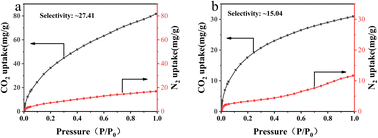
According to adsorption isotherms of these two materials at different temperatures in Fig. 8(a) and (b), the addition of potassium hydroxide in the preparation process decreased their CO2 adsorption capability, while more suitable calcination temperature led to better CO2 adsorption performance. These results indicated that treatment at 700 °C led to both larger pore size and larger specific surface area (as evident from Table 1), which further resulted in greater CO2 adsorption. In order to investigate the CO2 adsorption selectivity, the CO2 and N2 adsorption isotherms were measured (under the 1 bar at 25 °C) for LiC-600 °C and LiKC-700 °C samples as shown in Fig. 9(a) and (b), respectively. It was found that the CO2 adsorption capacity of LiC-600 °C and LiKC-700 °C was significantly higher than that of N2, indicating that these materials could carry out significant selective adsorption in the binary gas mixture of CO2 and N2. Based on these two adsorption isotherms, the ideal adsorption solution theory (IAST) was used to explore the selectivity of CO2/N2. According to formula (3), it is calculated that the selectivity of LiC-600 °C and LiKC-700 °C with a CO2/N2 (15![[thin space (1/6-em)]](https://www.rsc.org/images/entities/char_2009.gif) :
:![[thin space (1/6-em)]](https://www.rsc.org/images/entities/char_2009.gif) 85) mixture was about 27.41 and 15.04, respectively. These results showed that LiC-600 °C and LiKC-700 °C had excellent selective adsorption of CO2 in gas mixtures with a great potential in gas separation.
85) mixture was about 27.41 and 15.04, respectively. These results showed that LiC-600 °C and LiKC-700 °C had excellent selective adsorption of CO2 in gas mixtures with a great potential in gas separation.
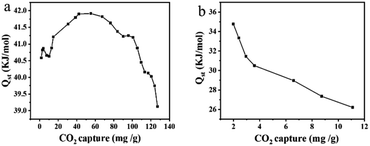
Generally, the equivalent adsorption heat (Qst), which can be calculated according to the Clausius–Clapeyron equation, reflects the ability of CO2 molecules to bind to the adsorbent, and a higher value indicates a stronger interaction and a more stable adsorption. As shown in Fig. 10, the initial Qst values of LiC-700 °C and LiKC-600 °C were 40.5 and 34.8 kJ mol−1, respectively, and the Qst values were decreased significantly with the increase of CO2 adsorption, probably due to the gradual decrease of the interaction between the reaction site and CO2. In addition, the Qst value of LiKC-600 °C was 34.8 kJ mol−1, which was lower than the binding energy of a typical covalent bond, indicating that the CO2 adsorption might be a typical physical adsorption, which made the adsorbent regeneration process simple and energy efficient. All results showed that these materials were great candidates to capture CO2 with a low regeneration energy consumption and low regeneration cost.
Table 2 shows the CO2 adsorption capacity and CO2/N2 adsorption selectivity of the LiC-600 °C, LiKC-700 °C, and some other reported adsorbents. These results showed that the MOF material had a higher CO2 adsorption capacity and selectivity than other adsorbents, and Cu-BTC had a significantly higher adsorption capacity. However, due to the high cost and poor durability and mechanical strength of MOF materials, their application in industry was still very rare up to present. Compared with the other molecular sieve and AC adsorbents in Table 2, the LiC-700 °C adsorbents in this study showed both a higher CO2 adsorption capacity and a higher CO2/N2 adsorption selectivity, except of the 13× molecular sieve and modified activated carbon AC2TMAOH. However, carbon material adsorbents had important advantages over zeolite 13× such as hydrophobicity, which could significantly reduce the cost with a lower energy required for regeneration.23 This work mainly focuses on providing a simple method for the preparation of LiC adsorbents and to evaluate the effect of introducing alkali metal ions into LiC support on CO2 adsorption performance. In our future work, in order to improve the CO2 adsorption capacity of LiC adsorbent, further exploration will be done to optimize the matrix and pore structure of the adsorbent.
| Adsorbents | Adsorption capacity (mmol g−1) 100 kPa | CO2/N2 selectivity | Ref. |
|---|---|---|---|
| Cu-BTC | 4.79 (298 K) | ∼50 | 14 |
| MIL-101 (Cr) | 2.33 (298 K) | ∼20 | 15 |
| MIL-100 (Fe) | 2.25 (298 K) | 6 | 16 |
| Zeolite Y | 0.73 (303 K) | 11 | 17 |
| 20MgO/MCN | 1.15 (298 K) | — | 18 |
| ZSM-5 | 1.33 (298 K) | ∼8 | 19 |
| AC2TMAOH | 2.49 (303 K) | 31.53 | 20 |
| Commercial AC | 1.5 (298 K) | — | 21 |
| Zeolite 13× | 4.20 (298 K) | 130 | 22 |
| LiC-700 | 3.18 (273 K) | — | This study |
| 1.86 (298 K) | ∼27.45 | ||
| LiKC-600 | 1.36 (273 K) | — | This study |
| 0.70 (298 K) | ∼15.04 |
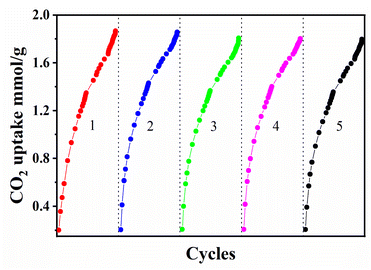
In addition to high CO2 adsorption capacity and selectivity, regeneration is also a key factor for the practical application of CO2 adsorbent materials. The adsorbent was degassing for 6 hours at under the ambient pressure at 200 °C, the CO2 adsorption and desorption cyclic experiment was carried out several times to examine the recycling ability of the material. The LiC-700 °C cyclically tested five times at 25 °C. As shown in Fig. 11, after five times regeneration tests, the capacity of the adsorbent did not change substantially. Therefore, it can be speculated that the porous material has a great application prospect in the field of CO2 adsorption.
4 Conclusions
In this study, with terephthalic acid as a carbon source, Li2CO3- and (Li–K)2CO3-based porous carbon materials were successfully prepared with different alkalis added and different calcination temperatures. Results showed that the optimum calcination temperature of LiC-based carbon materials was around 700 °C, while the optimum calcination temperature of LiKC-based porous carbon materials was around 600 °C. The CO2 capture capacity of LiC-700 °C was 140 mg CO2 g−1 and that of the LiKC-600 °C also reached up to 64 mg CO2 g−1 at 0 °C (273 K) under 1 bar, respectively. With carbonate doping and high-temperature calcination, the CO2 capture capacity of these materials could be further improved to a certain high level. The selectivity of LiC-600 °C and LiKC-700 °C with a CO2/N2 (15![[thin space (1/6-em)]](https://www.rsc.org/images/entities/char_2009.gif) :
:![[thin space (1/6-em)]](https://www.rsc.org/images/entities/char_2009.gif) 85) mixture was about 27.41 and 15.04, respectively. These results showed that adsorbent had excellent selective adsorption of CO2 in gas mixtures. According to the CO2-TPD analysis, this high selectivity to CO2 was due to the interaction between the large number of basic sites inside these materials and the acidic CO2. Overall, the LiC-700 °C had excellent CO2 adsorption, selectivity and regeneration. The Li2CO3-based porous carbon exhibit a favorable application prospect in post-combustion CO2 carbon adsorption and separation.
85) mixture was about 27.41 and 15.04, respectively. These results showed that adsorbent had excellent selective adsorption of CO2 in gas mixtures. According to the CO2-TPD analysis, this high selectivity to CO2 was due to the interaction between the large number of basic sites inside these materials and the acidic CO2. Overall, the LiC-700 °C had excellent CO2 adsorption, selectivity and regeneration. The Li2CO3-based porous carbon exhibit a favorable application prospect in post-combustion CO2 carbon adsorption and separation.
Author contributions
The manuscript was written through contributions of all authors. All authors have given approval to the final version of the manuscript.Conflicts of interest
The authors declare no competing financial interest.Acknowledgements
The study was supported by the Open Project of Xinjiang Key Laboratory of Energy Storage and Photoelectroctalytic Materials and Introduction plan for 100 young doctors in Xinjiang Uygur Autonomous Region.Notes and references
- N. Nityashree, G. V. Manohara, M. M. Maroto-Valer and S. Garcia, ACS Appl. Mater. Interfaces, 2020, 12, 33765–33774 CrossRef CAS PubMed.
- S. Dutta, A. Bhaumik and K. C. W. Wu, Energy Environ. Sci., 2014, 7, 3574–3592 RSC.
- R. S. Liu, X. U. Shuang, G. P. Hao and L. U. An-Hui, Chem. Res. Chin. Univ., 2022, 38, 18–30 CrossRef CAS.
- R. Soldi, S. Cavallini, J. Friedl, M. Volpe and C. Zuccaro, A New Skills Agenda for Europe, Brussels, 2014 Search PubMed.
- Climate Change 2007: The Physical Science Basis. Contribution of Working Group I to the Fourth Assessment Report of the Intergovernmental Panel on Climate Change, ed. S. Solomon, D. Qin, M. Manning, Z. Chen, M. Marquis, K. Avery, M. Tignor and H. Miller, Cambridge University Press, 2007, vol. 1 Search PubMed.
- Q. Liu, Y. Shi, W. Zhong and A. Yu, Chin. J. Chem. Eng., 2019, 27, 2261–2272 CrossRef CAS.
- Y. Liang, D. P. Harrison, R. P. Gupta, D. A. Green and W. J. McMichael, Energy Fuels, 2004, 18, 569–575 CrossRef CAS.
- R. R. Kondakindi, G. McCumber, S. Aleksic, W. Whittenberger and M. A. Abraham, Int. J. Greenhouse Gas Control, 2013, 15, 65–69 CrossRef CAS.
- Y. Liang, Carbon dioxide capture from flue gas using regenerable sodium-based sorbents[M], Louisiana State University and Agricultural & Mechanical College, 2003 Search PubMed.
- T. Nasiman and H. Kanoh, Ind. Eng. Chem. Res., 2020, 59, 3405–3412 CrossRef CAS.
- H. Luo and H. Kanoh, J. Energy Chem., 2017, 26, 972–983 CrossRef.
- T. Cai, J. K. Johnson, Y. Wu and X. Chen, ACS Appl. Mater. Interfaces, 2019, 11, 9033–9041 CrossRef CAS PubMed.
- C. Zhao, X. Chen, E. J. Anthony, X. Jiang, L. Duan, Y. Wu, W. Dong and C. Zhao, Prog. Energy Combust. Sci., 2013, 39, 515–534 CrossRef.
- Y. Wu, Z. Lv, X. Zhou, J. Peng, Y. Tang and Z. Li, Chem. Eng. J., 2019, 355, 815–821 CrossRef CAS.
- Z. Zhou, L. Mei, C. Ma, F. Xu, J. Xiao, Q. Xia and Z. Li, Chem. Eng. Sci., 2016, 147, 109–117 CrossRef CAS.
- L. Mei, T. Jiang, X. Zhou, Y. Li, H. Wang and Z. Li, Chem. Eng. J., 2017, 321, 600–607 CrossRef CAS.
- F. Gao, S. Wang, G. Chen, J. Duan, J. Dong and W. Wang, Adsorption, 2020, 26, 701–709 CrossRef CAS.
- Z. Refaat, M. E. Saied, A. Naga, S. A. Shaban, H. B. Hassan, M. R. Shehata and F. Y. E. Kady, Environ. Sci. Pollut. Res. Int., 2023, 30, 53817–53832 CrossRef CAS PubMed.
- M. Hefti, D. Marx, L. Joss and M. Mazzotti, Microporous Mesoporous Mater., 2015, 215, 215–228 CrossRef CAS.
- M. M. Almoneef, H. Jedli and M. Mbarek, Mater. Res. Express, 2021, 8, 065602 CrossRef CAS.
- A. Heidari, H. Younesi, A. Rashidi and A. Ghoreyshi, J. Taiwan Inst. Chem. Eng., 2014, 45, 579–588 CrossRef CAS.
- J. McEwen, J.-D. Hayman and A. Ozgur Yazaydin, Chem. Phys., 2013, 412, 72–76 CrossRef CAS.
- G. Chen, F. Wang, S. Wang, C. Ji, W. Wang, J. Dong and F. Gao, Korean J. Chem. Eng., 2021, 38, 46–54 CrossRef CAS.
Footnote |
| † Electronic supplementary information (ESI) available. See DOI: https://doi.org/10.1039/d3ra02607h |
| This journal is © The Royal Society of Chemistry 2023 |

