
 Open Access Article
 This Open Access Article is licensed under a
 Creative Commons Attribution 3.0 Unported Licence
A facile synthesis of K3PMo12O40/WO3 crystals for effective sonocatalytic performance
Linjing Lia,
Feng Li ab,
Taohai Li*ab and
Wei Cao*b
ab,
Taohai Li*ab and
Wei Cao*b
aCollege of Chemistry, Key Lab of Environment Friendly Chemistry and Application in Ministry of Education, Xiangtan University, Xiangtan, 411105, China
bNano and Molecular Materials Research Unit, Faculty of Science, University of Oulu, P.O. Box 3000, FIN-90014, Oulu, Finland. E-mail: hnlth@xtu.edu.cn; Wei.Cao@oulu.fi
First published on 26th May 2023
Abstract
Proper treatment of hazardous contaminants in the air, land, and water is crucial to environmental remediation. Sonocatalysis, by using ultrasound and suitable catalysts, has shown its potential in organic pollutant removal. In this work, K3PMo12O40/WO3 sonocatalysts were fabricated via a facile solution method at room temperature. Techniques such as powder X-ray diffraction, scanning electron microscopy (SEM), transmission electron microscopy, and X-ray photoelectron spectroscopy were used to characterize the structure and morphology of the products. By using the K3PMo12O40/WO3 sonocatalyst, an ultrasound-assisted advanced oxidation process has been developed for the catalytic degradation of methyl orange and acid red 88. Almost all dyes were degraded within 120 min of ultrasound baths, proving that the K3PMo12O40/WO3 sonocatalyst has the advantage of speeding up the decomposition of contaminants. The impacts of key parameters, including catalyst dosage, dye concentration, dye pH, and ultrasonic power were evaluated to understand and reach optimized conditions in sonocatalysis. The remarkable performance of K3PMo12O40/WO3 in the sonocatalytic degradation of pollutants provides a new strategy for the application of K3PMo12O40 in sonocatalysis.
1. Introduction
Rapid industrialization is unfortunately accompanied with environmental pollution. Among the various pollutants, organic ones pose relatively serious problems.1,2 Therefore, searching for solutions to detoxify organic pollutants has became an urgent issue in many research fields. In this regard, advanced oxidation processes (AOPs), which include ultrasonic decomposition, ozone oxidation, the Fenton reaction, photocatalysis, and other advanced oxidation technologies, have gained increasing interest.3–5 For example, the Ce4O7-modified Bi4MoO9 (C-BMO) photo-Fenton heterojunction was successfully constructed by Yang et al. The degradation of tetracycline (TC) process was improved during the photo-Fenton process, reaching an improved efficiency of 7.69 and 12.28 times higher than those of pure Ce4O7 and Bi4MoO9, respectively.6 Bi2MoO6 with exposed {0 1 0} facet has a rich layered structure, and its interaction with Fe-POM with unique electron-trap characteristics can effectively improve charge transfer at the interface. Therefore, Yang et al. prepared an efficient and stable heterogeneous photo-Fenton catalyst Fe-POM/Bi2MoO6.7 Under the synergistic action of Fenton reaction and photocatalytic process, CeO2−x/Bi2MoO6 heterojunction exhibits outstanding photo-Fenton activity in the degradation of ofloxacin, norfloxacin, and ciprofloxacin antibiotics.3 The sonocatalysis process is based on the acoustic cavitation effect, in which ultrasonic vibrations cause bubbles to form, grow, and collapse in solution.8,9 The high pressure (≥1000 atm) and high temperature (≥5000 K) are generated at the moment of bubble collapse, and the higher energy generated will cause the dissociation of water to produce hydroxyl radicals (·OH) which react with pollutants to achieve the purpose of destruction.10,11 However, degradation using ultrasound alone requires more time and consumes more energy. Therefore, it is urgent to explore and develop efficient sonocatalysts.12As an excellent semiconductor catalyst, tungsten trioxide (WO3) has become a material of significant interest in several fields. WO3 is a popular material for pollutant removal because of its excellent chemical and physical properties, narrow band gap (2.4–2.8 eV),13 good ambient stability, cost-effectiveness, and high recovery rate. WO3 was also endowed with considerable attentions in the sonocatalytic removal of pollutants.14 According to Li et al., rhodamine B (RhB) degradation with the addition of WO3 reached up to 57.9% under ideal sonocatalytic conditions, which is approximately three times higher than that without the addition of catalysts. WO3 can remove 68% of methamphetamine under ultrasonic irradiation through the coaction with Er3+:Y3Al5O12/KNbO3.15 However, the formation of superoxide radicals with high recombination rates of electron and hole pairs has been a problem for WO3, yet requiring additional treatment of WO3.16
In recent years, polyoxometalates (POMs) have undergone further research and are now widely applied in several applications.17 This is mainly attributed to the reversible redox properties of POMs, which allow the structure of the substance to remain unchanged after participating in the reaction, and the excellent photocatalytic activity that allows POMs to construct effective photocatalytic systems.18,19 However, most of the acidic forms of POMs are homogeneous and high soluble in water. This property not only increases the difficulty of separation and recovery but also leads to secondary contamination.20 On the other hand, the rapid recombination of electron–hole pairs in POMs caused a low photocatalytic efficiency.21 These drawbacks limit the practical application of POMs. It has been found that POMs have low aqueous solubility when constituted of Cs+, K+, (NH4)+, or Rb+ ions, which greatly improves the recyclability and reduces the cost of POMs.20 A variety of studies have shown that combining two catalysts by doping, loading, or constructing heterojunction systems can effectively improve a variety of properties.22,23 Therefore, combining WO3 and K3PMo12O40 semiconductor materials might reduce the electron–hole pair recombination rate by forming an internal electric field. It can be predicted that the combination of both WO3 and K3PMo12O40 can form an efficient catalyst and further promote the degradation of pollutants.
Until now, there is still a paucity of studies related to the sonocatalytic properties of POMs. Herein, we prepared K3PMo12O40/WO3 (KW) sonocatalysts via a facile solution method at room temperature. Various characterization techniques were used to investigate the structural, morphological, and sonocatalytic properties of KW, to comparatively study the sonocatalytic degradation of the organic dyes methyl orange (MO) and acid red 88 (AR88) by WO3, K3PMo12O40 (KPM) and KW, and to further propose possible sonocatalytic degradation mechanisms.
2. Experimental
2.1. Material and characterization
Sodium tungstate dihydrate (Na2WO4·H2O), potassium chloride (KCl), and phosphomolybdic acid hydrate (H3P(Mo3O10)4·xH2O) were purchased from Sinopharm Chemical Reagent Co., Ltd. Oxalic acid dihydrate (H2C2O4·2H2O) was obtained from Foshan Silong Chemical company. Methyl orange (MO, C14H14N3NaO3S) and acid red 88 (AR88, C20H13N2NaO4S) were purchased from Xiangzhong Chemical Reagent Co. All the chemicals used were of analytical grade and without any further purification.The crystalline properties of the samples were explored by X-ray diffraction (XRD) patterns (D8 ADVANCE, USA). Morphological characteristics were obtained by scanning electron microscopy (SEM) (JSM-6610LV JEOL, Japan) and transmission electron microscopy (TEM) (JEM, USA). X-ray photoelectron spectroscopy (XPS) was conducted for determining the elementary composition and the surface states on an X-ray photoelectron spectroscopy instrument (ESCALAB 250Xi, USA). The UV-visible diffuse reflectance spectrum (DRS) data of the samples were obtained by UV-visible spectrophotometer (UV-2550, Japan) analysis. Monitoring of ·OH generated during ultrasound using photoluminescence (F-4600, Hitachi, Japan).
2.2. Preparation of sonocatalysts
The WO3 nanoparticles were synthesized under hydrothermal conditions. Experimental details were as follows: weight 12.5 mmol Na2WO4·2H2O and dissolved into 25 mL of deionized water under magnetic stirring until solid particles completely dissolved. And 3 M HCl was then added dropwise till the pH of the solution became 2. Then, 35 mmol H2C2O4 was added to the mixed solution with continuous stirring until the solid particles were thoroughly precipitated. Deionized water was added to reach a solution volume of 125 mL and obtain WO3 sol. Next, 6.25 g of KCl was added to the above solution and stirred to dissolve it. The suspension was then transferred into a Teflon-lined stainless autoclave and the hydrothermal reaction was carried out at 180 °C for 6 h. WO3 was collected, and washed with deionized water and ethanol several times. Finally, the solid sample dried in air at 70 °C for 24 h.K3PMo12O40 was specifically prepared using the following steps. Dispersed 3 g of H3PMo12O40 (dry in a drying oven at 150 °C for 12 h before use to remove moisture molecules) in 20 mL of deionized water. The above solution was stirred for 10 min at room temperature until dissolved thoroughly. With continuous stirring, a solution containing a sufficient amount of KCl (0.184 g dissolved in 10 mL of water) was added dropwise to the above solution at room temperature. The result mixture was stirred for 15 min and left for 24 h. The precipitate was collected, washed several times with deionized water and ethanol, and then dried in air at 70 °C for 24 h.
The following process was used to prepare the sonocatalyst KW. The KPM sample (1 g) was dissolved in 40 mL deionized water and 0.2 g WO3 was dissolved in 10 mL H2O respectively. Then the WO3 solution was added to the KPM solution dropwise gradually. The mixture was stirred at room temperature for 2 h. After mixing finished, the precipitate was collected, washed several times with deionized water and ethanol, and dried in air at 70 °C for 24 h. Because the KPM dispersed in water is in a relatively viscous state, it can be successfully adsorbed on the solid surface of KPM by simply stirring after adding WO3.
2.3. Exploration of sonocatalysis process
Degrading MO and AR88 as pollutants in an aqueous solution were used to investigate the sonocatalytic activity of the KW. The KW sample was dispersed into 50 mL of dye solution to determine the sonocatalytic activity and the adsorption capacity of the product in the dark. Before using ultrasonic energy, the suspension was magnetically stirred in the dark for 30 min to reach the adsorption–desorption equilibrium of the dye solution on the sonocatalyst. Then, under ultrasonic irradiation, 3 mL of the reaction solution was taken from each mixture at 30 min intervals and centrifuged at 8500 rpm for 10 min to remove the catalyst powder. The ultrasound irradiation lasted 120 min. Different process factors were examined, including sample dosage, initial dye solution concentration, pH, and incident ultrasound power. The final concentration of dyes was analyzed by using a UV-vis spectrophotometer (CARY 600, Agilent, USA) at a wavelength coverage of 200–800 nm. The conversion was calculated by (C0–C)/C0, where C is the concentration of the reactant after irradiation, and C0 is the initial concentration of the organic pollution.2.4. Hydroxyl radical analysis
The production of ·OH radical is usually demonstrated by a PL method. The hydroxylated compounds are created by oxidizing or disproportionating the hydroxy cyclohexadienyl radicals that are produced when hydroxyl radicals are added to coumarin. As a result, by observing the PL intensity of the reacting solution, we can gather information on the ·OH radicals. 1 mmol of coumarin was dissolved in 1 L of deionized water to create a coumarin solution. The catalyst (50 mg) was added to 50 mL of the coumarin solution. After magnetic stirring in the dark for 30 min, the mixed solutions were ultrasonically irradiated under the same ultrasonic experimental conditions. The reacted solution (3 mL) was removed at the specified reaction time interval, and the catalyst was then removed by centrifuging the mixture for 10 minutes. After centrifugation, the upper clear solution was taken for PL measurement by fluorescence spectrophotometer with an excitation wavelength of 332 nm.3. Results and discussion
3.1. X-ray diffraction study
The XRD patterns of WO3, KPM, and KW were presented in Fig. 1. The peaks at 2θ = 10.7°, 15.2°, 21.6°, 26.6°, 30.8°, 36.2°, 39.5°, 44.1°, 56.0°, and 63.0° were indexed to K3PMo12O40 (JCPDS no. 09-0408), corresponding to the (110), (200), (220), (222), (400), (332), (510), (440), (550), and (651) crystal planes of K3PMo12O40, respectively. The diffraction peaks of WO3 (JCPDS no. 87-1203) observed at 2θ = 14.1°, 18.0°, 22.9°, 28.1°, 36.6°, 50.1°, and 55.8°, denoting diffractions from the (020), (111), (002), (220), (222), (260), and (044) crystalline surfaces, respectively. From the XRD analysis of sample KW, the peak intensities of KPM were slightly weakened due to the addition of WO3. However, the correlation peaks of the two substances can still be seen in the test results, indicating that the combination of the materials would not affect the crystallinity of KPM.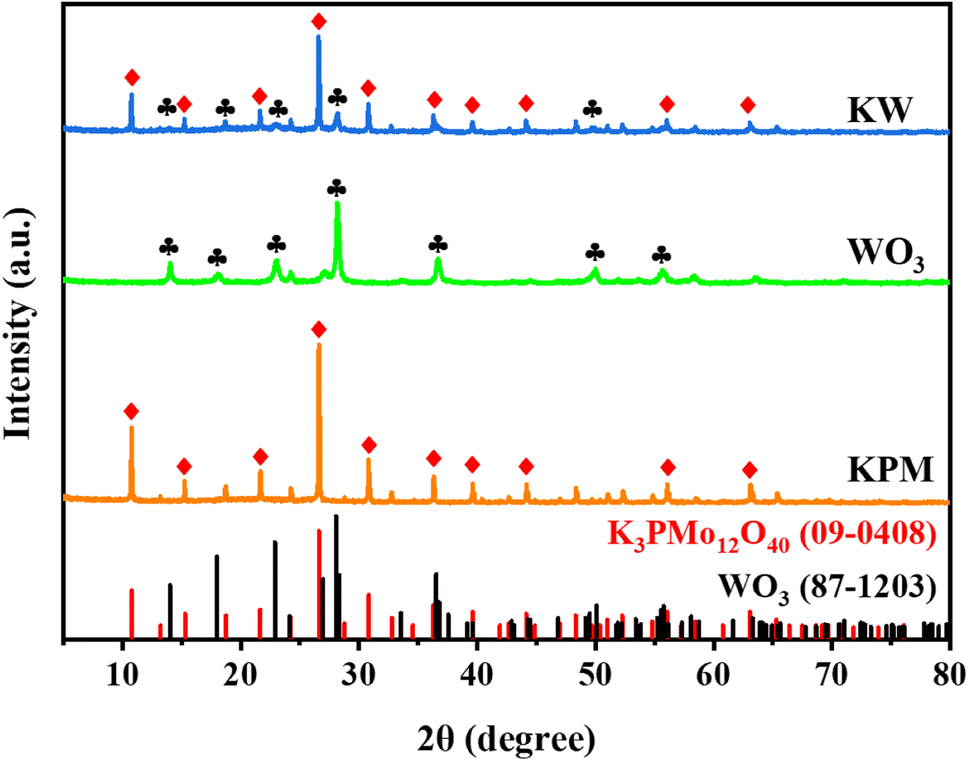 | ||
| Fig. 1 XRD pattern of WO3, KPM, and KW samples. | ||
3.2. SEM and TEM analysis
Fig. 2(a)–(c) display the SEM images of the KPM, WO3, and KW samples, respectively. The SEM image of the KPM particles in Fig. 2(a) demonstrates that nanomaterials are a type of microspheres with smooth surfaces, showing a hollow center and varying particle diameters. As illustrated by the SEM image in Fig. 2(b), the WO3 nanoparticles are blocks with irregular shapes. According to the SEM images in Fig. 2(c), WO3 particles anchored on KPM and formed KW heterostructures. It is obvious that the surface of the KPM becomes uneven or somewhat defective after attached with the WO3. TEM was used to further investigate the microstructure of KPM powder, WO3 powder, and WO3-doped KPM nanocomposite. According to Fig. 2(d), the KPM samples were depicted as microspheres and particle sizes about 0.82–0.83 μm, which was in good agreement with the SEM results of Fig. 2(a). The TEM image of KW was shown in Fig. 2(e). The image reveals two different types of nanoparticles with various sizes and shapes. The more erratic-shaped particles (referred to as WO3 nanoparticles) are attached to the hollow-shaped KPM nanoparticles. The TEM observation demonstrates the formation of KW heterogeneous structures, consistent with the conclusion obtained through SEM. Two distinct forms of well-defined lattice stripes turn out in an HRTEM picture in Fig. 2(f). The spacing of one set of the fringes was ca. 0.310 nm, corresponding to the (220) plane of WO3, and another one was ca. 0.360 nm, corresponding to the (310) lattice spacing of KPM. Therefore, the as-obtained KW heterostructure was composed of KPM and WO3.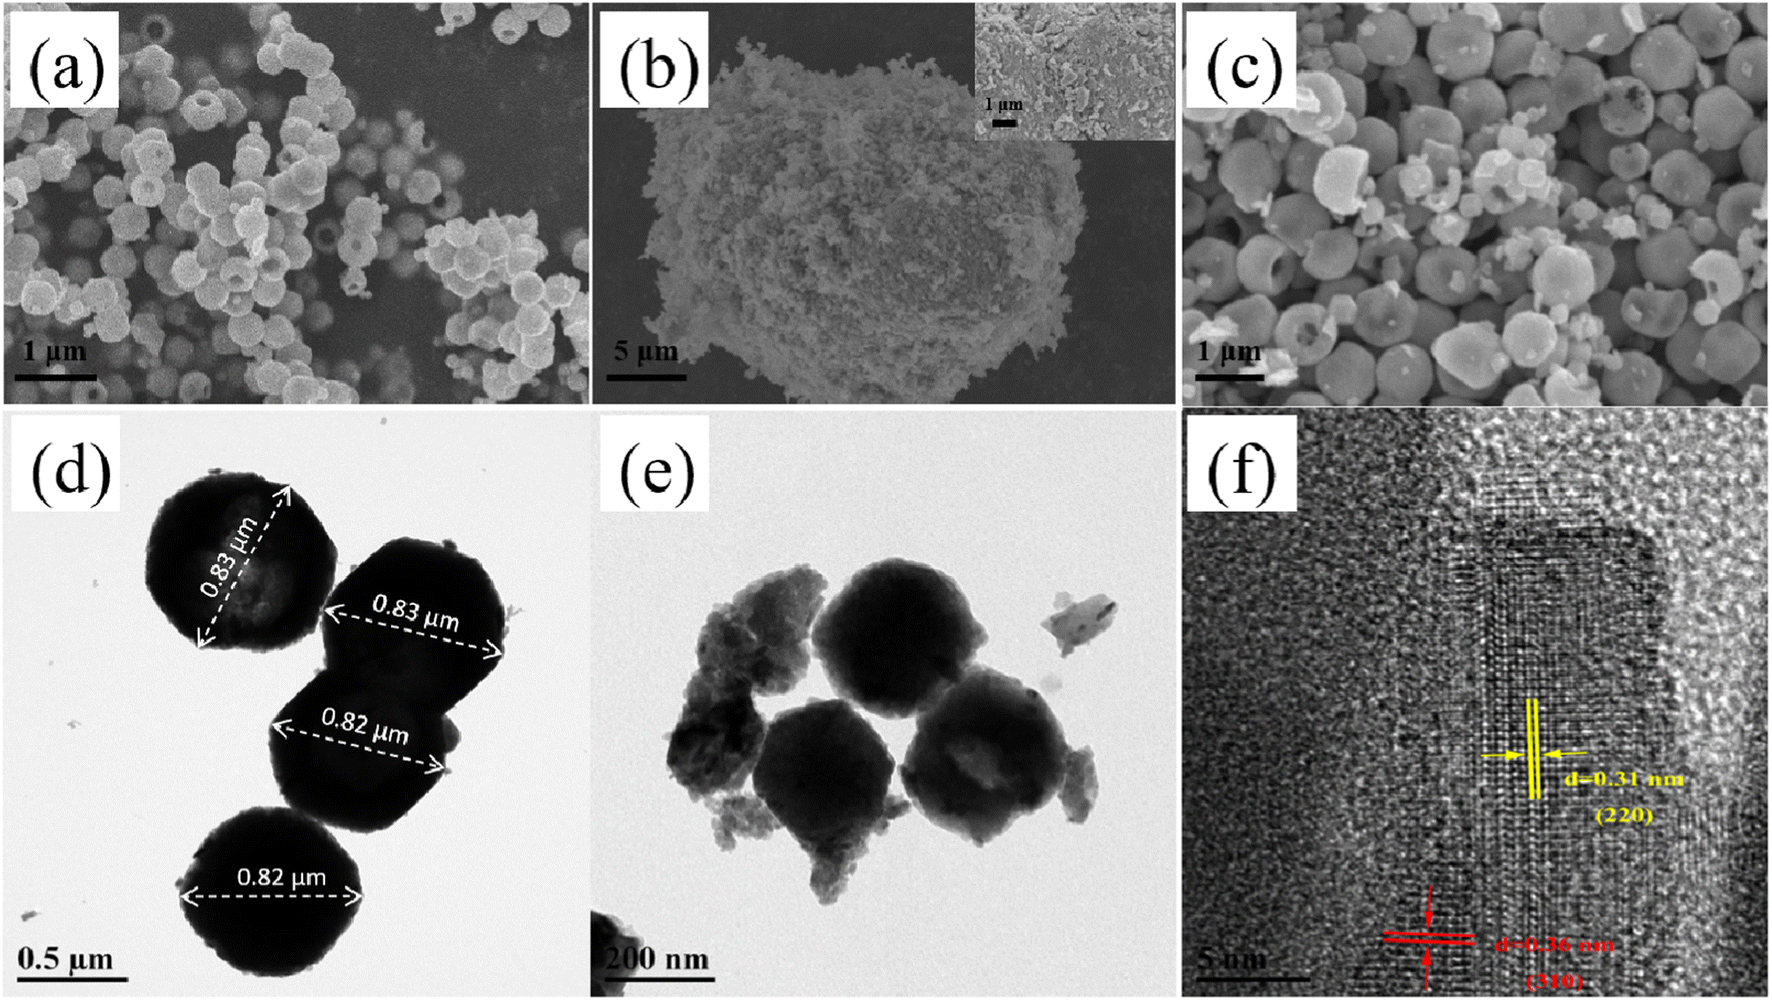 | ||
| Fig. 2 SEM images of (a) KPM, (b) WO3, and (c) KW; TEM images of the (d) KPM, and (e) KW samples; HRTEM image of the (f) KW. | ||
3.3. XPS analysis
Fig. 3 shows the XPS analysis, which reflects the surface composition and chemical state of KPM modified by WO3. The coexistence of K, P, Mo, O, and W elements in the composites was detected by XPS survey spectra (Fig. 3(a)), which confirmed the elemental composition of KW. The binding energy (BE) in the XPS study was calibrated by using the adventurous C 1s peak at 284.6 eV as the reference.24 The two prominent peaks in the K 2p XPS spectrum of KPM in Fig. 3(b) at 296.2 eV and 293.4 eV, attributed to K 2p1/2 and K 2p3/2, respectively, indicate that the K element is in the K+ chemical state. The BE of K 2p slightly shifted to lower energies after compounding WO3 with KPM, suggesting that the addition of WO3 may have changed the chemical environment of K. This effect can also be observed in the XPS spectra of P 2p, Mo 3d, and O 1s. Fig. 3(c) depicts the typical XPS peak of P 2p corresponding to a binding energy peak of 134.2 eV, revealing that the valence state of P in this composite is +5 and the BE of KW was reduced by 0.3 eV compared to that of KPM. In the Mo 3d XPS spectra of both samples, the XPS peaks of Mo 3d3/2 and Mo 3d5/2 for the KPM sample (Fig. 3(d)) correspond to unique peaks with binding energies of 236.0 eV and 232.9 eV, respectively, which are attributed to Mo(VI) in the Keggin-type heteropolyacid anion [PMo12O40]3−.25 The change in BE of Mo 3d after WO3 modification of KPM further illustrated the change in the chemical environment of KPM. The W 4f spectrum of WO3 has two peaks, W 4f7/2 (35.5 eV) and W 4f5/2 (37.6 eV), and these binding energies show the +6 chemical state of W (Fig. 3(e)).26 The W 4f of the KW sample was in a variety of chemical environments, with a slight shift of the BE of the major W6+ toward the higher direction. In the different O 1s chemical environments of KPM and KW in Fig. 3(f), the peak of 530.7 eV in KPM corresponded to the O 1s binding energy attributed to the (Mo–O–Mo) bond in [PMo12O40]3−.25 The other peak at 531.8 eV belongs to the surface OH. The addition of WO3 reduces both BEs by 0.1 eV at the same time. The slight shift of the lattice oxygen confirms the decrease in the electron density of KPM due to the addition of WO3.27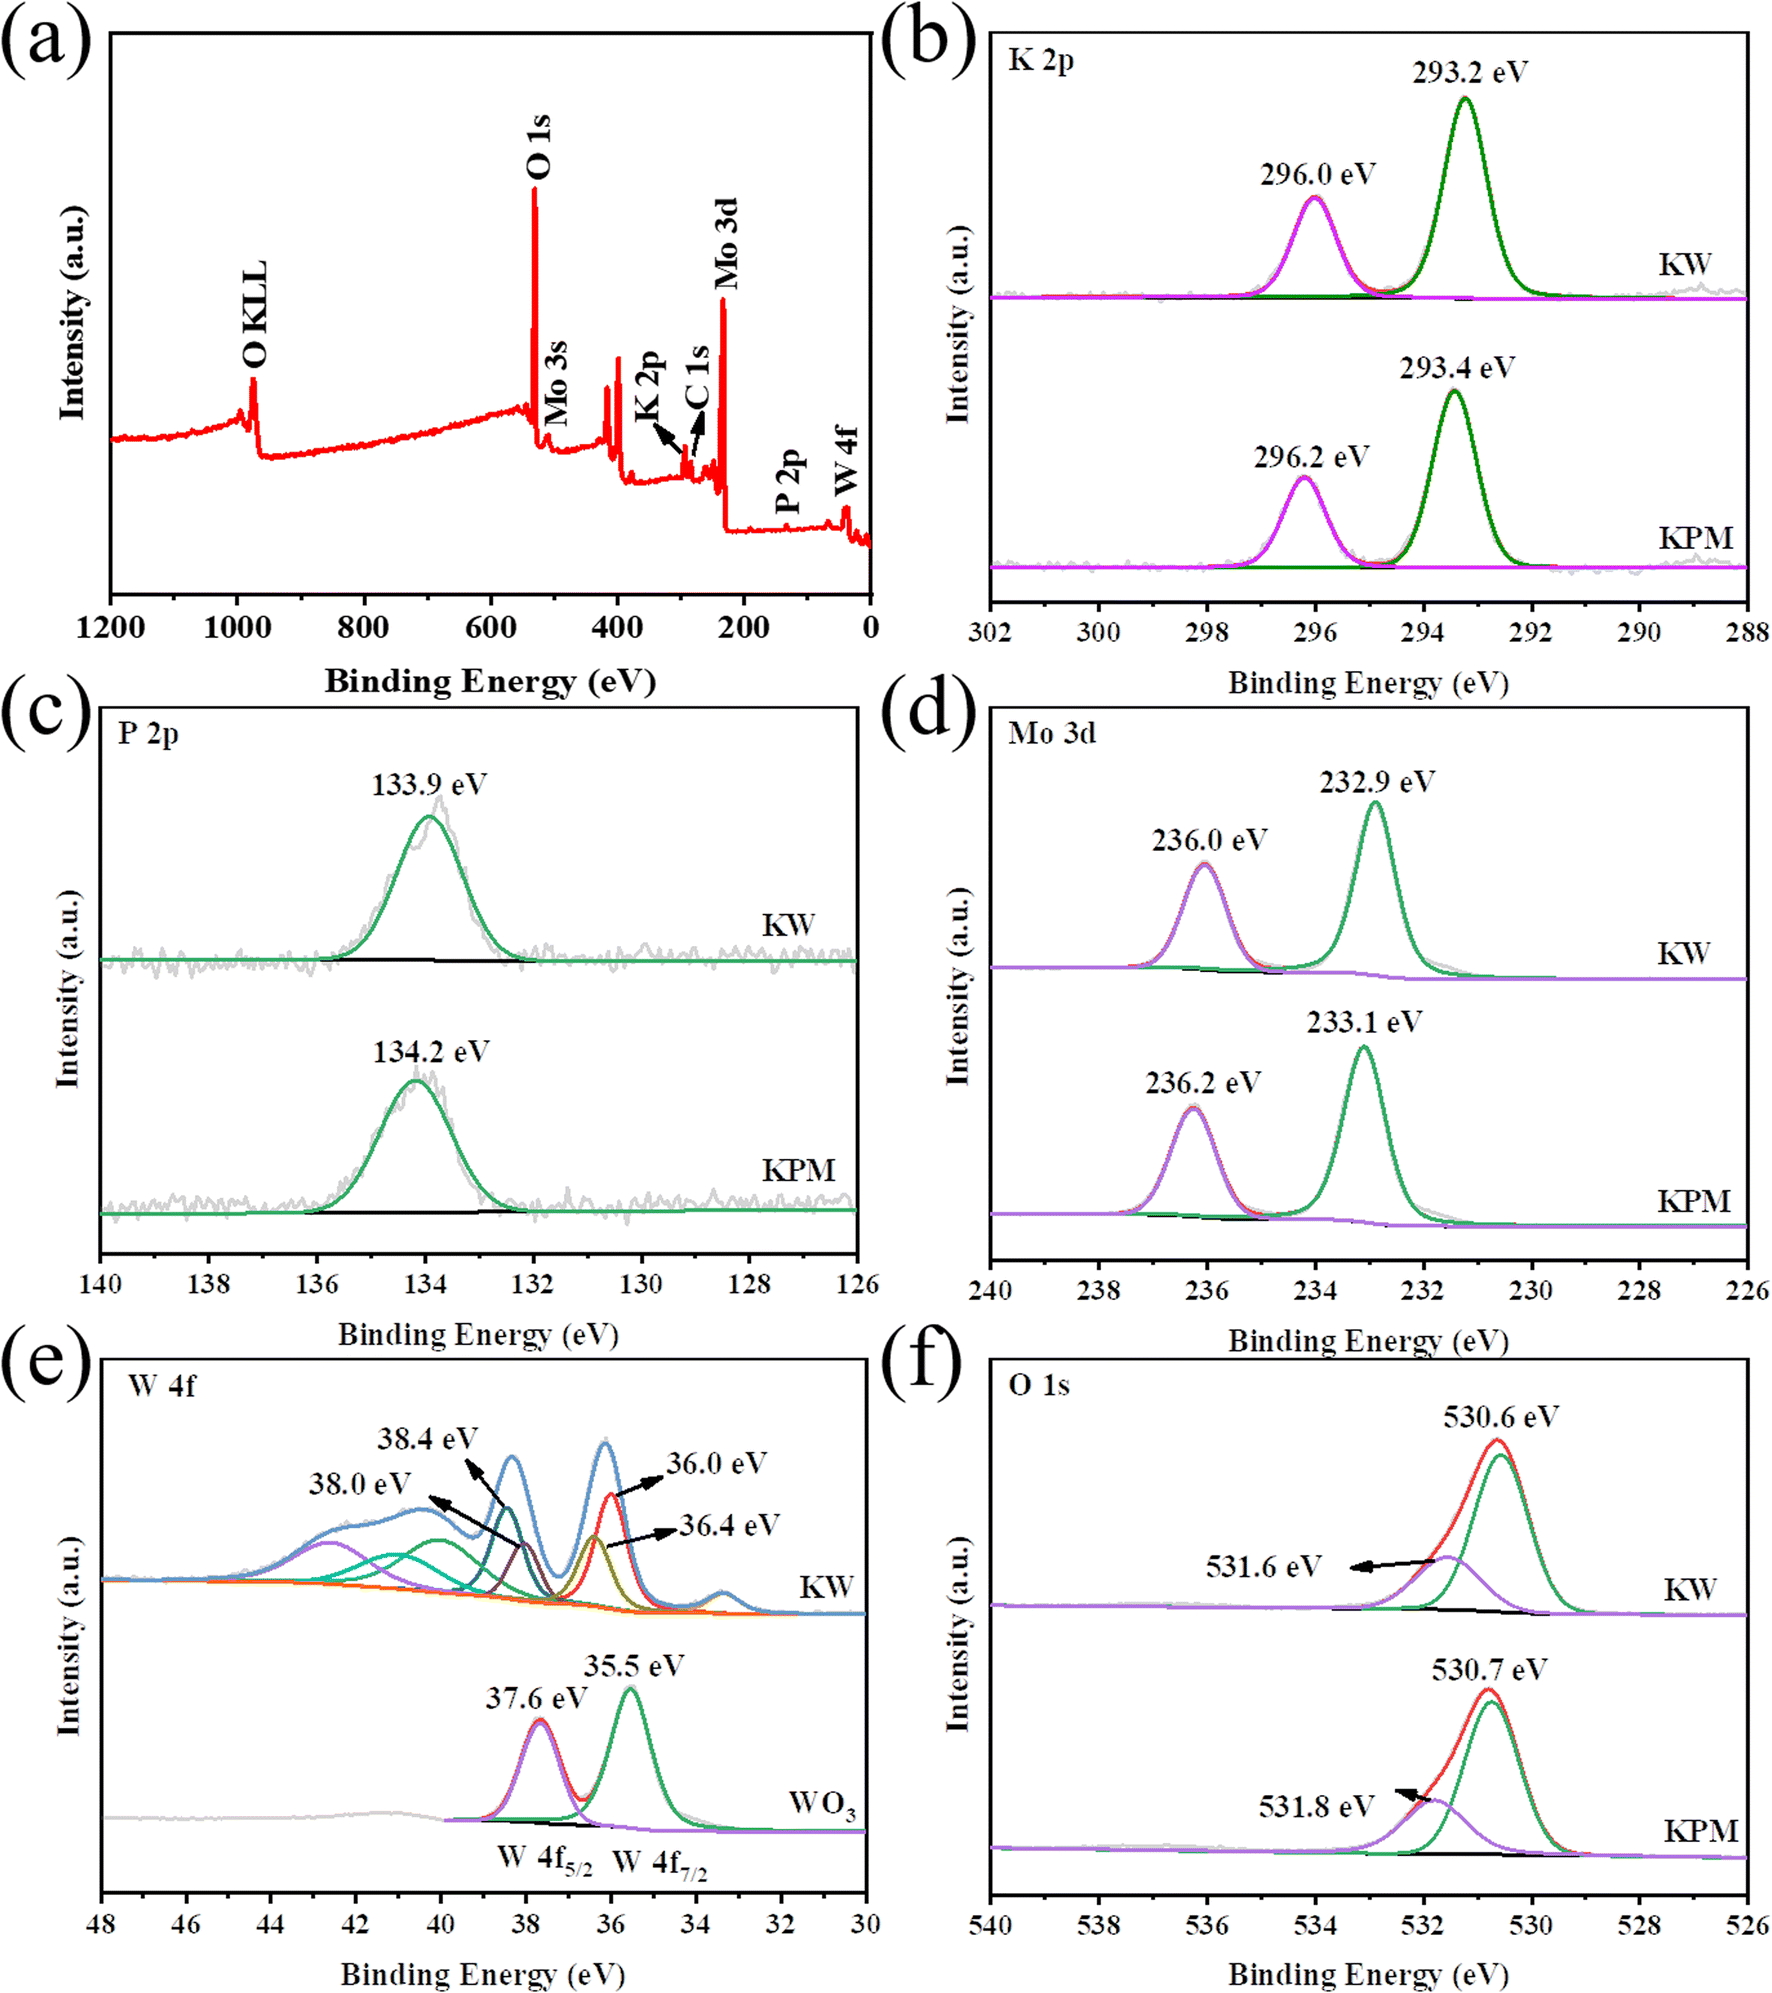 | ||
| Fig. 3 XPS spectra of the KW sample: (a) survey, (b) K 2p, (c) P 2p, (d) Mo 3d, (e) W 4f, and (f) O 1s. | ||
3.4. DRS analysis of KW sample
The DRS (in the range of 250–800 nm), band gaps of the WO3, KPM, and KW sonocatalysts are shown in Fig. 4(a) and (b). In Fig. 4(a), the absorption peak of pure WO3 appears at 450–500 nm. Meanwhile, the absorption value of pure KPM is between 500 and 550 nm. Compared to pure KPM, the KW composite obtained after loading with WO3 owns a more pronounced absorption feature at the range of 500–550 nm. Combining the optical absorption edge cases of pure WO3 with KPM discussed before, and according to the Kubelka–Munk formula, the corresponding band gap energy (Eg) can be calculated through28| αℏν = A(ℏν − Eg)n | (1) |
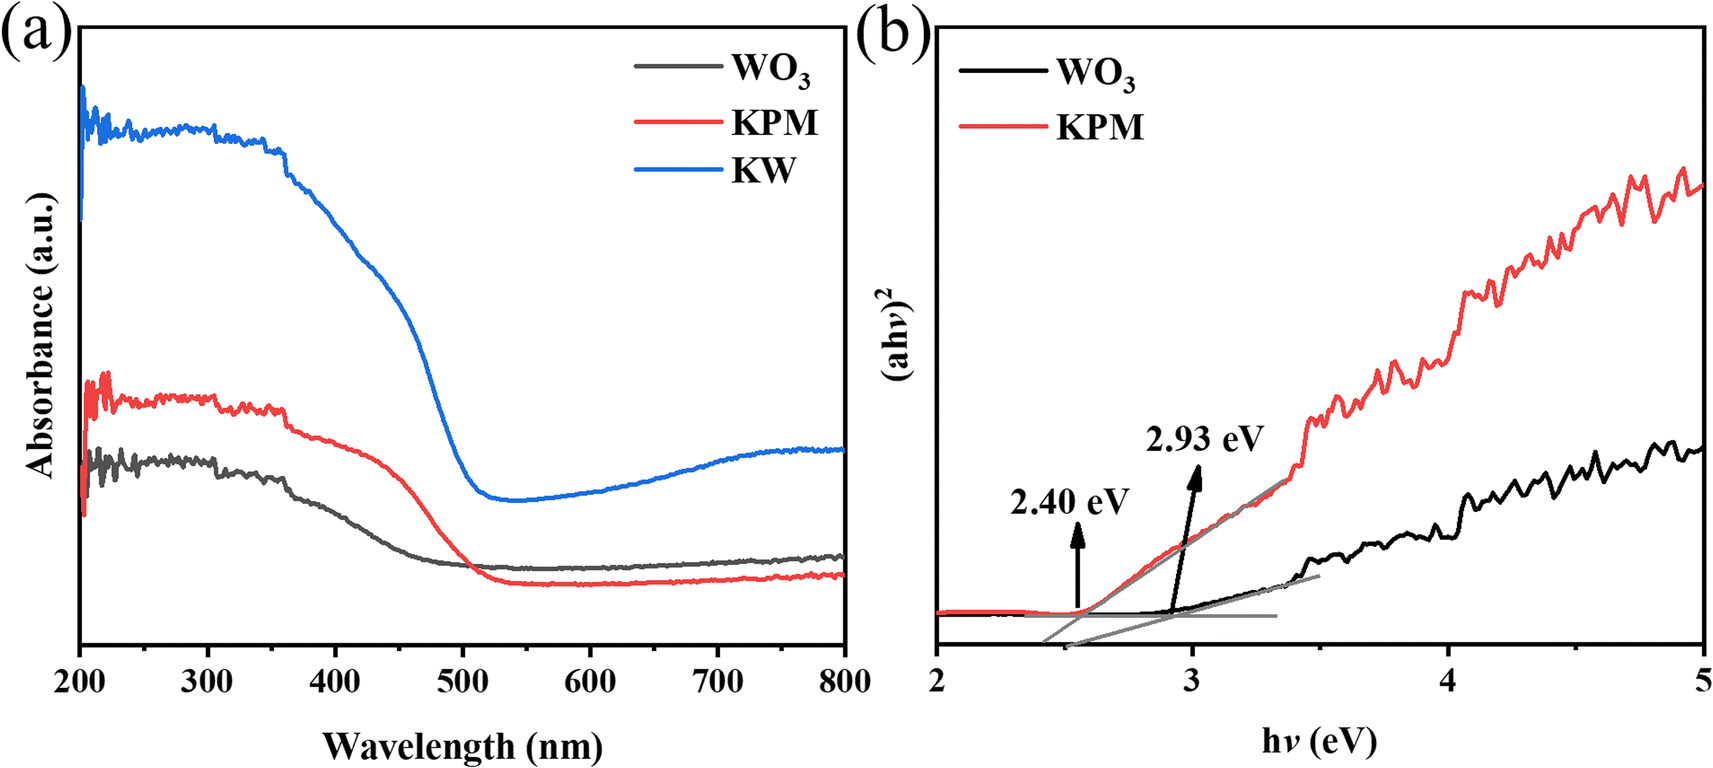 | ||
| Fig. 4 (a) DRS spectrum of KW; (b) plot of (αℏν)2–ℏν for WO3 and KPM samples. | ||
3.5. Sonocatalytic test results
MO and AR88 were selected as the model of organic pollutants to evaluate the sonocatalytic performance of KW nanocomposite. The sonocatalytic activity of KW nanocomposites was examined by various experiments under various sonication conditions. The sample dosages were tuned to 12.5 mg, 25 mg, 50 mg, and 70 mg, dye concentrations to 5 mg L−1, 10 mg L−1, 15 mg L−1, and 20 mg L−1, pH values set to 3, 7, 11, and sonication powers to 120 W, 168 W, and 240 W. By doing so, the ideal circumstances for the cyclic experimental investigation were chosen from them after assessing the degradation rates of each variable on the dyes.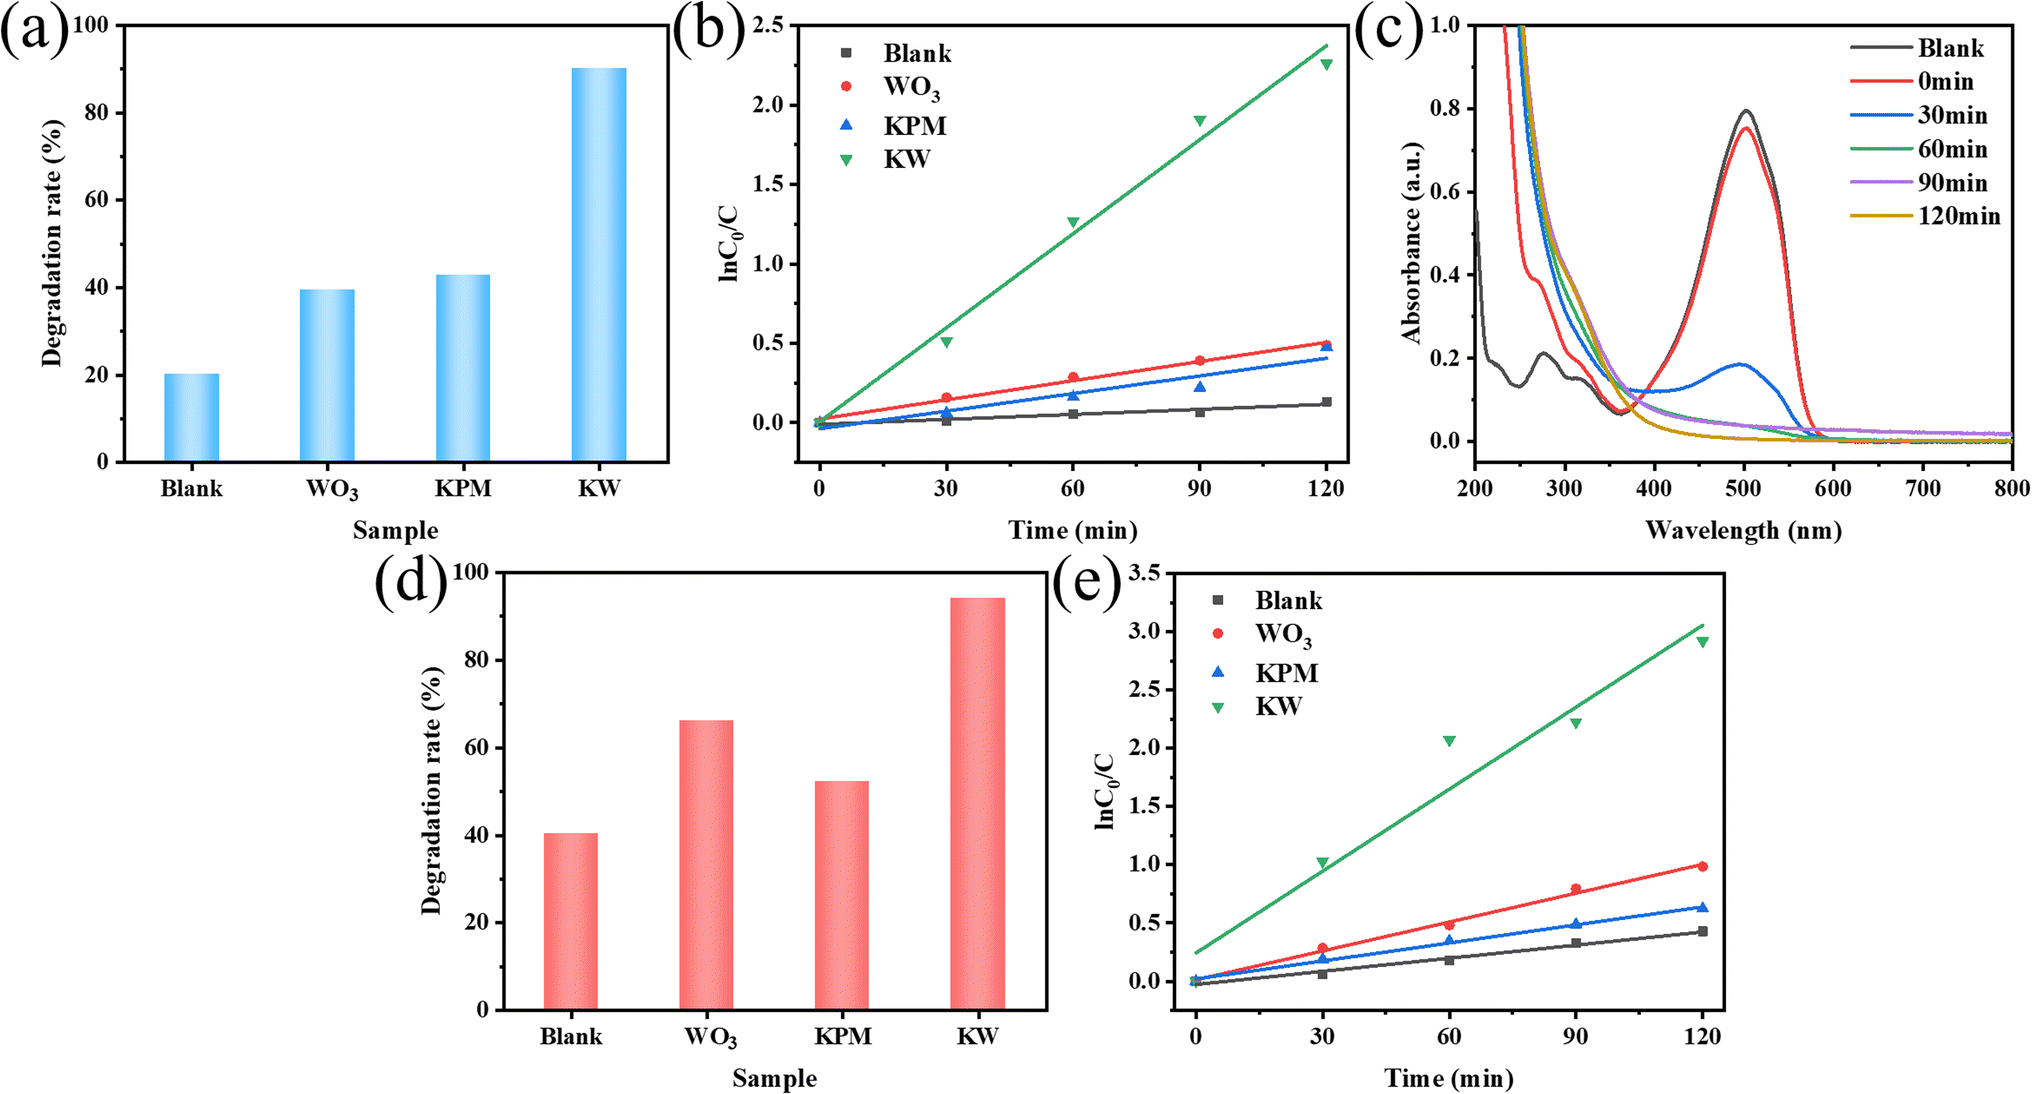 | ||
| Fig. 5 Sonocatalytic degradation comparison of (a) MO and (d) AR88 in the presence of different components; (c) the UV-vis absorption spectrum of the sample KW for MO degradation; kinetics of sonocatalytic degradation of (b) MO and (e) AR88 with different components (experimental conditions: sonocatalyst dosage = 50 mg, initial concentration = 10 mg L−1, solution volume = 50 mL, ultrasonic power = 240 W, pH = 7). | ||
The results of the degradation of AR88 in the presence of different catalysts are presented in Fig. 5(d). The degradation efficiency of the dye AR88 in the absence of the catalyst is 40.26%, while the degradation efficiency of WO3, KPM, and KW catalysts are 66.13%, 52.23%, and 94.71%, respectively. It is obvious that the composite catalyst KW has the best catalytic activity. We use first-order kinetic equations to fit the data to better quantify and explain the ultrasonic catalytic degradation of materials. The kinetic fitting results in Fig. 5(b) and (e) demonstrate that the KW composite has a higher reaction rate constant than the other materials'. A possible explanation for this result is proposed. The formation of heterojunction reduces the fast electron–hole recombination rates in both catalysts. On the other hand, the composite catalyst KW combines the advantages of both individual catalysts and further improves the degradation efficiency.
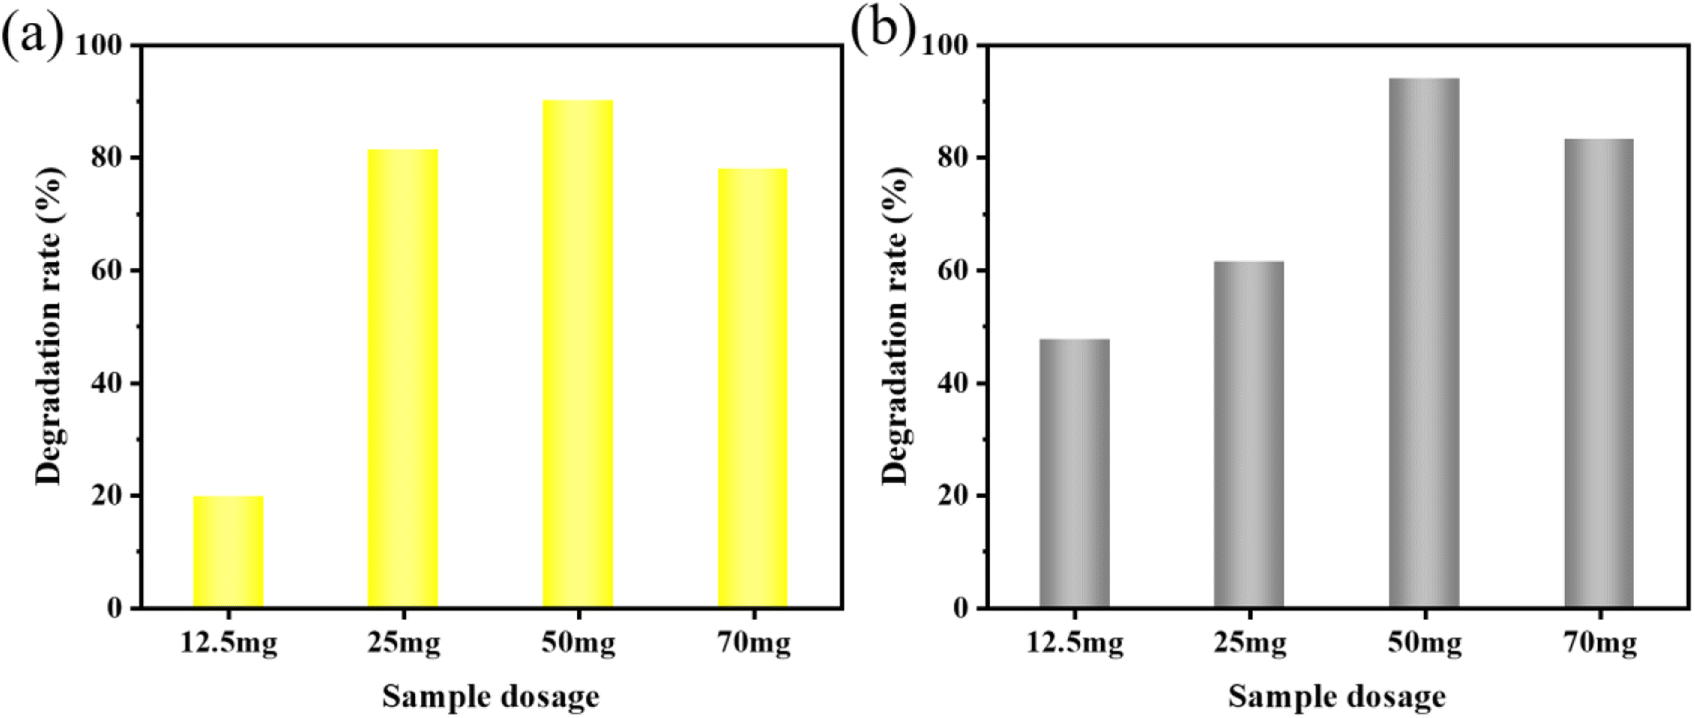 | ||
| Fig. 6 Effect of different KW sonocatalyst dosages on the sonocatalytic degradation of (a) MO and (b) AR88 (experimental conditions: initial concentration = 10 mg L−1, solution volume = 50 mL, ultrasonic power = 240 W, pH = 7). | ||
To further investigate the applicability of the catalyst, the AR88 dye solution was degraded under the same conditions. According to Fig. 6(b), the rates of degradation for 12.5 mg, 25 mg, 50 mg, and 70 mg after 120 minutes were 47.6%, 61.4%, 94.0%, and 65.3%, respectively. For further studies, a dosage of 50 mg was chosen as the sample amount for subsequent studies on the degradation of AR88.
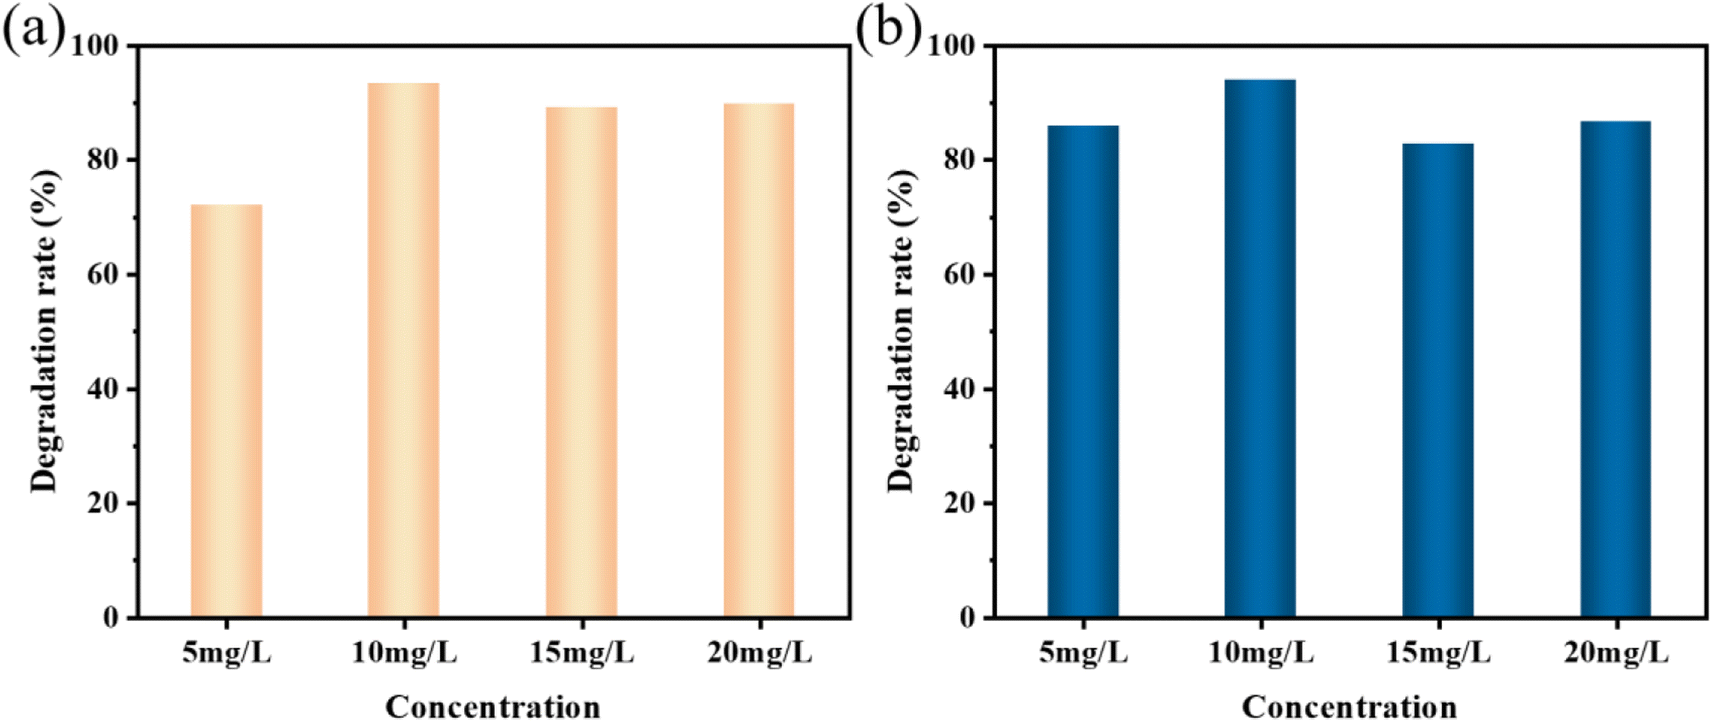 | ||
| Fig. 7 Sonocatalytic degradation efficiency different initial concentrations of (a) MO and (b) AR88 (experimental conditions: sonocatalyst dosage = 50 mg, solution volume = 50 mL, ultrasonic power = 240 W, pH = 7). | ||
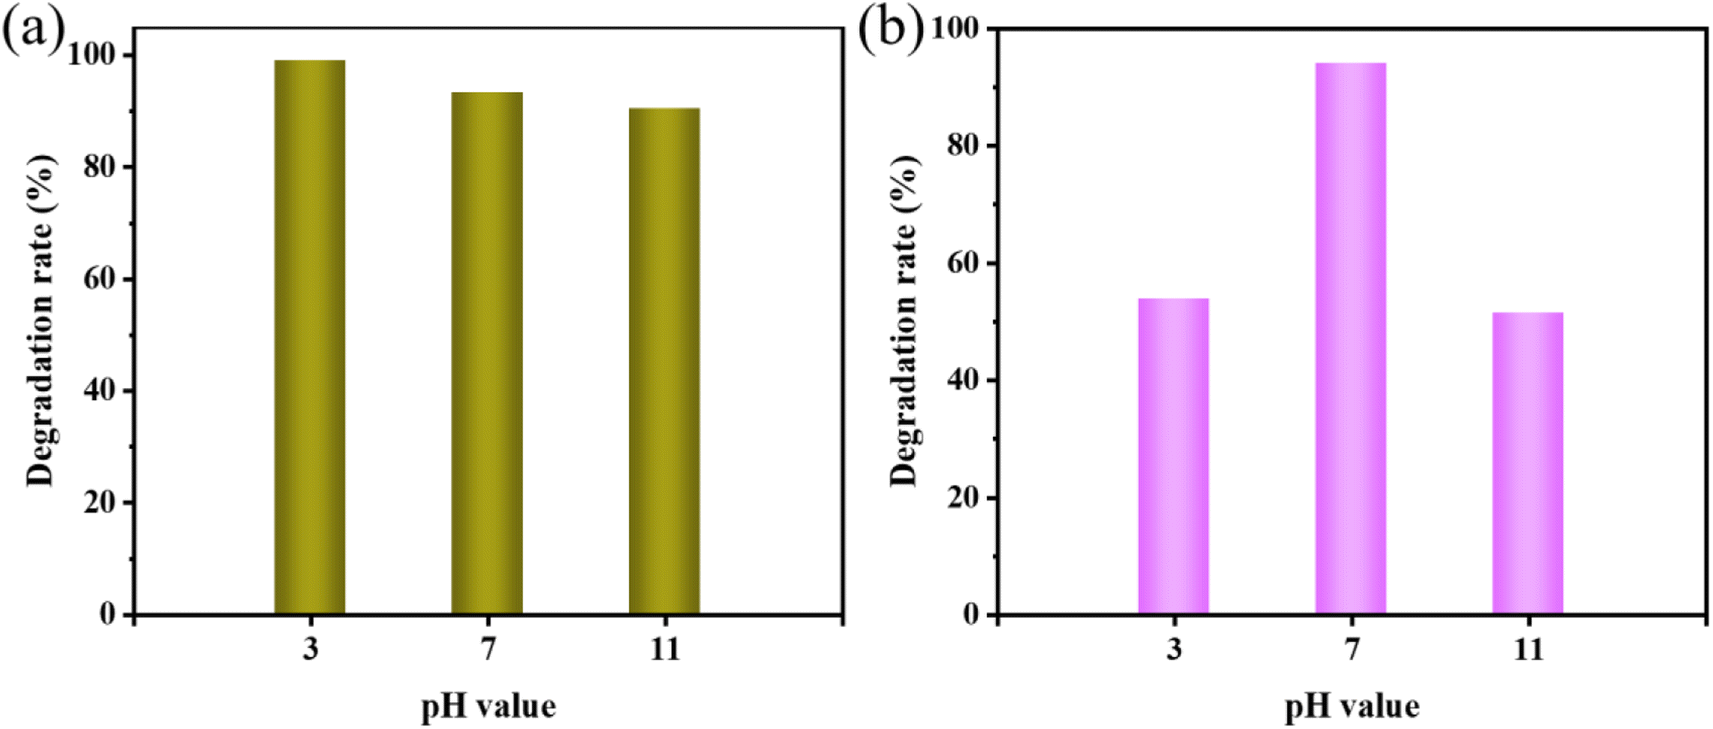 | ||
| Fig. 8 Effect of different pH values on sonocatalytic degradation of (a) MO and (b) AR88 (experimental conditions: sonocatalyst dosage = 50 mg, solution volume = 50 mL, initial concentration = 10 mg L−1, ultrasonic power = 240 W). | ||
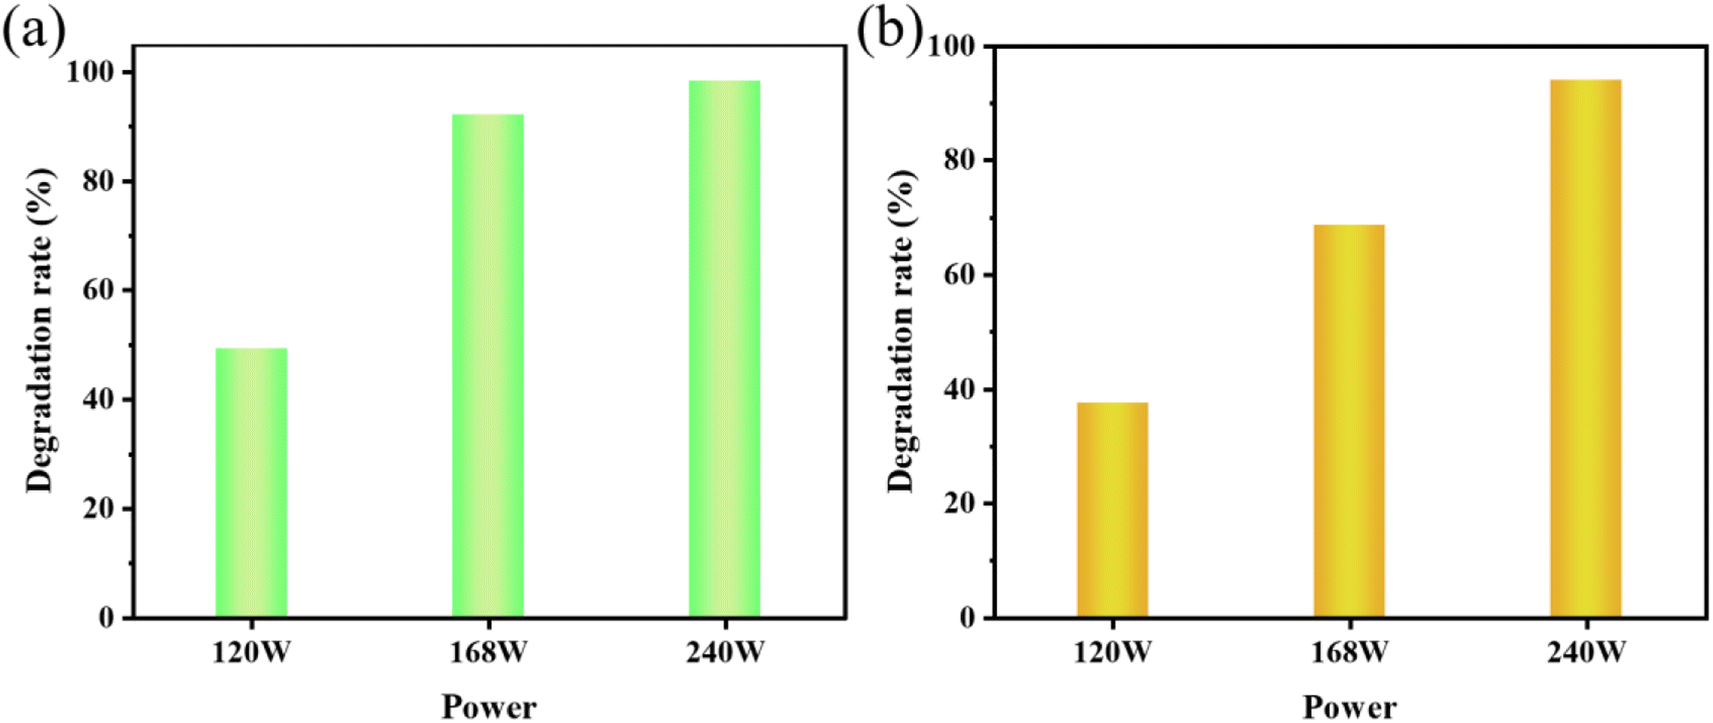 | ||
| Fig. 9 (a) The effect of ultrasonic power on the sonocatalytic degradation of MO (experimental conditions: sonocatalyst dosage = 50 mg, initial concentration = 10 mg L−1, pH = 3); (b) the effect of ultrasonic power on the sonocatalytic degradation of AR88 (experimental conditions: sonocatalyst dosage = 50 mg, initial concentration = 10 mg L−1, pH = 7). | ||
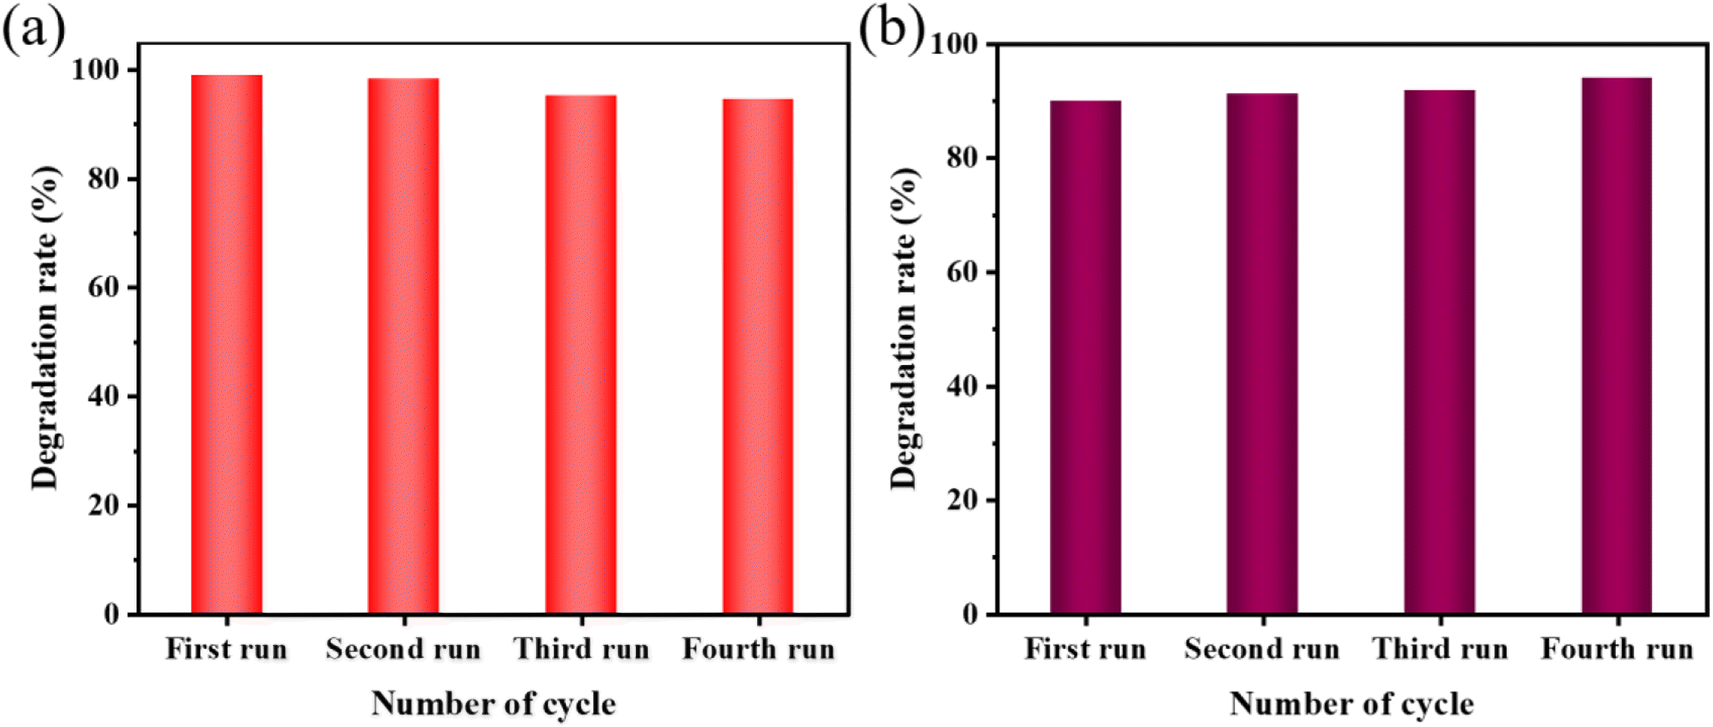 | ||
| Fig. 10 (a) Results of reusability test for the sonocatalytic degradation of MO (experimental conditions: sonocatalyst dosage = 50 mg, initial MO concentration = 50 mg L−1, ultrasonic power = 240 W, pH = 3); (b) results of reusability test for the sonocatalytic degradation of AR88 (experimental conditions: sonocatalyst dosage = 50 mg, initial MO concentration = 50 mg L−1, ultrasonic power = 240 W, pH = 7). | ||
3.6. Possible sonocatalytic degradation mechanism
Previous studies showed that the band structure of the catalyst used for the sonication process is a key factor affecting the catalytic activity. Based on the findings of the DRS spectroscopic band gap measurement, the Eg of KPM is determined to 2.40 eV. Fig. 11(a) displays the Mott–Schottky measurements of KPM. It can be concluded that the flat-band (EFB) potential of the KPM is 0.04 eV (0 V vs. SCE). Thus, the conduction band (ECB) edge of KPM is −0.06 eV (compared to NHE). Combined with the above analysis, the valence band (EVB) of KPM can be calculated as 2.34 eV based on EVB = ECB + Eg. The band structure of WO3 was obtained by referring to the relevant ref. 13.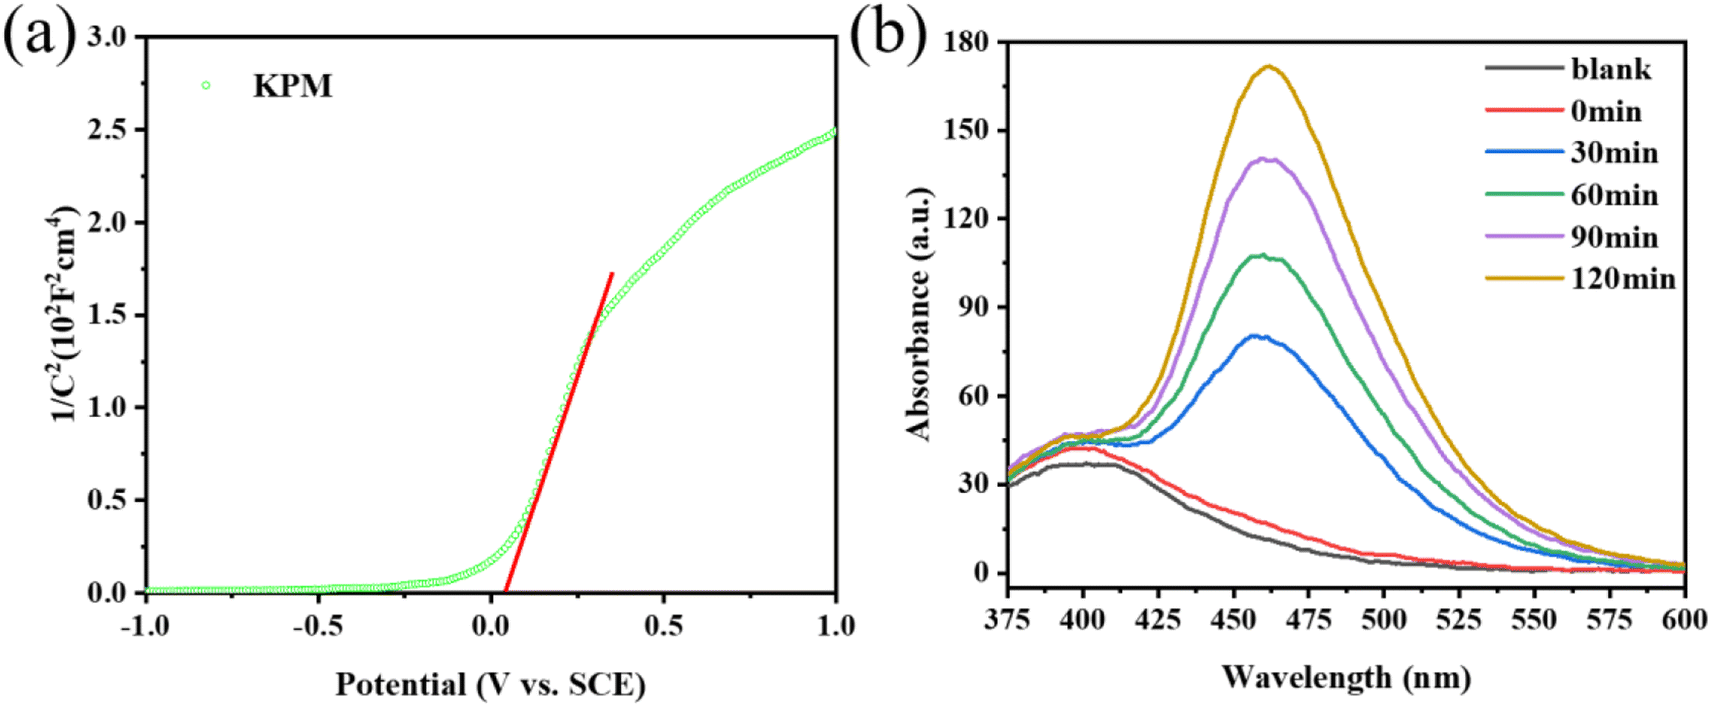 | ||
| Fig. 11 (a) Mott–Schottky plot of KPM; (b) PL spectra of KW. | ||
The production of ·OH radicals may affect activity of acoustic degradation. The reaction of coumarin with hydroxyl radicals produces a variety of hydroxylation products, so coumarin can be used as a fluorescent probe for hydroxyl radicals.41 With the addition of KW sonocatalyst and increasing sonication duration, as seen in Fig. 11(b), the PL intensity of coumarin solution progressive increases, which indicates the production of ·OH radicals. As a result, the interaction of a sizable quantity of ·OH in solution with organic dye molecules is responsible for the acoustic degrading activity on dyes of KW. During ultrasonic action, the solution creates a cavitation effect, and the cavitation bubbles produced by this effect can be coupled with adiabatic heating of the bubble vapor phase by speedy decomposition to yield significant local transition temperatures and pressures.42 As a result, organic substances (such as MO or AR88) close to the bubble/water contact may experience a thermal breakdown or secondary processes involving MO (or AR88) that result in their mineralization or deterioration.43 According to Li et al., the azo bond (–N![[double bond, length as m-dash]](https://www.rsc.org/images/entities/char_e001.gif) N–) of MO is easily broken.44 The ·OH radicals generated during the sonocatalysis process are connected to the chromophore, which promotes the breaking of the –NN– bond after contact with MO, and finally obtains inorganic small molecule such as CO2 and H2O. In a word, MO undergoes mineralization and resulting in the disappearance of orange.45–48
N–) of MO is easily broken.44 The ·OH radicals generated during the sonocatalysis process are connected to the chromophore, which promotes the breaking of the –NN– bond after contact with MO, and finally obtains inorganic small molecule such as CO2 and H2O. In a word, MO undergoes mineralization and resulting in the disappearance of orange.45–48
Sonocatalysis has been utilized for decades to degrade and remove organic contaminants from water, which offers excellent technological support for the advancement of environmental friendliness. However, based on a review of the literature, there has not yet been a fairly good explanation of the process in this respect, which is somewhat unfavorable for the advancement of ultrasonics.15 Therefore, it is necessary to understand the reaction process of decomposition of MO and AR88 by the action of KW ultrasound. In this study, we provide a potential mechanism to help explain potential fluctuations in KW during the catalytic process.
Here, we refer to the energy band theory to describe the mechanism of sonocatalyzed degradation. It is well known that powerful ultrasonic radiation induces a low-pressure and high-pressure cycling environment in aqueous solutions. Active bubbles are formed in the low-pressure cycle and expand until they collapse when exposed to the high-pressure cycle. A very high pressure is developed during this process, which induces a polarization charge on the surface of the K3PMo12O40/WO3 sonocatalyst, generating a hole (h+) and an electron (e−) at the valence band position (VB) and the conduction band (CB) position of the catalyst, respectively, and an internal electric field. Since the conduction band potential of K3PMo12O40 is more negative than that of WO3, the ultrasound-induced e− tends to transfer more to the conduction band of WO3. The free-moving e− and h+ can be separated rapidly by the electric field. The generated h+ can form ·OH by interacting with H2O, which in turn interacts with organic pollutants (MO/AR88) when in contact with them, leading to catalytic degradation. On the other hand, ultrasound causes e− to gain enough energy to transfer to the CB of the catalyst and then to the surface of the catalyst as free-moving electrons, enabling them to react with heteroatoms or molecules. The specific process is as follows (Fig. 12).
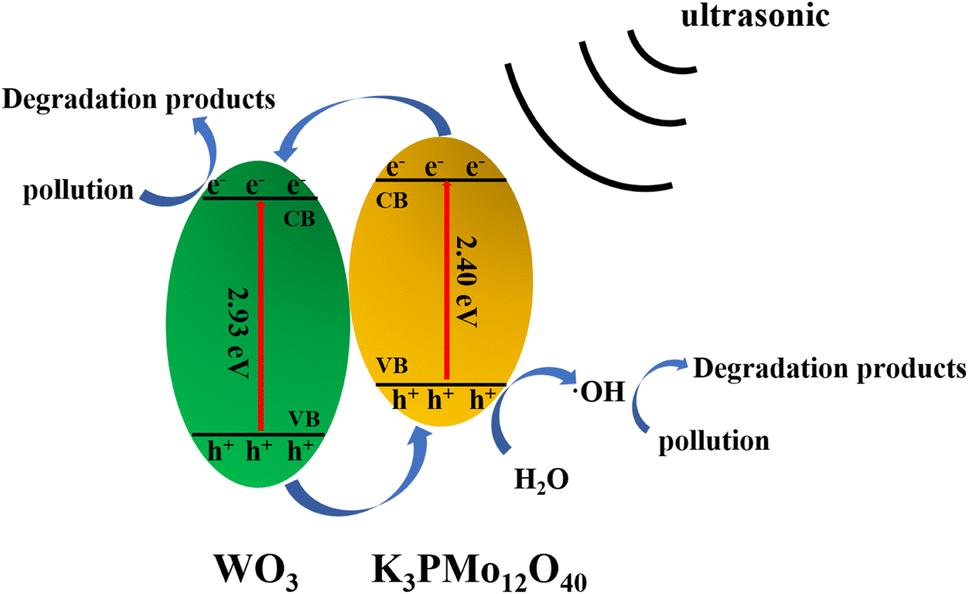 | ||
| Fig. 12 Possible sonocatalytic mechanism. | ||
A few researchers have investigated the degradation of organic dyes using ultrasound techniques (Table 1). To show the benefits of K3PMo12O40/WO3 composites in the sonocatalytic degradation of organic dyes, the sonocatalytic activity of K3PMo12O40/WO3 was compared with other types of sonocatalysts that have been reported in literature. It can be seen that K3PMo12O40/WO3 has more significant sonocatalytic activity in the degradation of organic dyes compared to the published sonocatalysts such as Bi2WO6, rutile TiO2, g-C3N4, and LuFeO3 materials. The results further indicate that K3PMo12O40/WO3 is a material with great potential for application in the sonocatalytic degradation of organic pollutants.
| Catalyst | Pollutant | Concentration (mg L−1) | Dosage (g L−1) | Time (min) | pH | Degradation (%) | Ref. |
|---|---|---|---|---|---|---|---|
| Bi2WO6 | MO | 10 | 1.00 | 60 | 7 | 83 | He, et al.49 |
| Rutile TiO2 | MB | 10 | 0.50 | 150 | 3 | 99 | Wang, et al.50 |
| g-C3N4 | MO | 10 | 1.00 | 180 | 7 | 48 | Song, et al.51 |
| LuFeO3 | MO | 5 | 4.00 | 30 | — | 73 | Zhou, et al.52 |
| K3PMo12O40/WO3 | MO/AR88 | 10 | 1.00 | 120 | 3/7 | 98 | This work |
4. Conclusion
In conclusion, this work showed that KW nanocomposites can be synthesized simply by stirring at room temperature and can be further applied for the sonocatalytic degradation of dyes of MO and AR88. XRD patterns depicted that the synthesized complexes own high crystallinity, and no impurities were found. SEM images and TEM images indicated that WO3 forms heterojunctions on the surface loading of KPM, which accelerated the separation of e− and h+ and promoted the transfer of electrons, which contributed to the sonocatalytic degradation performance of the composite. XPS spectra revealed that WO3 was successfully loaded into the polyoxometalates KPM. The results have demonstrated that the amount of catalyst, the initial concentration of the dye, the pH of the dye solution, and the intensity of the ultrasonic treatment all have varying degrees of effect on the removal of the organic dyes MO and AR88 during the experimental procedure. The degradation of pollutants by the KW sonocatalyst was significantly improved by optimizing these key parameters. According to the experimental results, the selection of optimal experimental conditions after the addition of the KW sonocatalyst could increase the ultrasonically catalyzed degradation rates of MO and AR88 to 96% and 94%, respectively. The reusability test verified the tremendous potential of KW from an application standpoint in multiple runs without significant reduction in sonocatalytic activity. Along with a systematic study of the KW sonocatalyst and its application conditions, this work is hoped to debut a research trend in using polyoxometalates oxides for wastewater remediation through sonocatalysis.Conflicts of interest
The authors declare that they have no known competing financial interests or personal relationships that could have appeared to influence the work reported in this paper.Acknowledgements
The authors acknowledge with thanks the financial support of the National Natural Science Foundation of China (21601149). W. Cao acknowledges funding from the European Research Council (ERC) under the European Union’s Horizon 2020 research and innovation programme (grant agreement no. 101002219).References
- A. Nt, A. Sm, A. Ah and B. Sb, Adv. Powder Technol., 2019, 30, 257–265 CrossRef.
- S. Y. Lai, K. H. Ng, C. K. Cheng, H. Nur and M. Arumugam, Chemosphere, 2021, 263, 128244 CrossRef CAS PubMed.
- G. Yang, Y. Liang, H. Zheng, J. Yang, S. Guo and H. Yu, Sep. Purif. Technol., 2023, 309, 123084 CrossRef CAS.
- L. Xu, X. Zhou, G. Wang, L. Zhou and X. Sun, Sep. Purif. Technol., 2021, 276, 119417 CrossRef CAS.
- A. Mukhopadhyay, B. K. Tripathy, A. Debnath and M. Kumar, Surf. Interfaces, 2021, 26, 101412 CrossRef CAS.
- G. Yang, Y. Liang, Z. Xiong, J. Yang, K. Wang and Z. Zeng, Chem. Eng. J., 2021, 425, 130689 CrossRef CAS.
- G. Yang, Y. Liang, H. Zheng, X. Zhang and J. Jia, Sep. Purif. Technol., 2023, 310, 123167 CrossRef CAS.
- J. H. Bang and K. S. Suslick, Adv. Mater., 2010, 22, 1039–1059 CrossRef CAS PubMed.
- N. Shimizu, C. Ogino, M. F. Dadjour and T. Murata, Ultrason. Sonochem., 2007, 14, 184–190 CrossRef CAS PubMed.
- A. Khataee, B. Vahid, S. Saadi and S. W. Joo, Ultrason. Sonochem., 2016, 29, 146–155 CrossRef CAS PubMed.
- Y. Q. Gao, J. Q. Zhou, Y. Y. Rao, H. Ning, J. Zhang, J. Shi and N. y. Gao, Ultrason. Sonochem., 2022, 82, 105906 CrossRef CAS PubMed.
- J. Dong, F. Yang, Q. Wang, C. Jiang, H. Wang, X. Cao, Z. Li and Z. Wang, J. Mol. Liq., 2022, 367, 120469 CrossRef CAS.
- W. Zhang, D. Liu, Z. Mu, X. Zhang, G. Dong, L. Bai, R. Guo, J. Li, M. Zhao and Z. Zhang, J. Inorg. Organomet. Polym. Mater., 2023, 33, 90–104 CrossRef CAS.
- M. B. Tahir, G. Nabi, N. R. Khalid and W. S. Khan, J. Inorg. Organomet. Polym. Mater., 2018, 28, 777–782 CrossRef CAS.
- H. Zhang, Y. Huang, G. Li, G. Wang, D. Fang, Y. Song and J. Wang, Ultrason. Sonochem., 2017, 35, 478–488 CrossRef CAS PubMed.
- H. Kiran, M. B. Tahir, T. Iqbal and A. Hassan, J. Inorg. Organomet. Polym. Mater., 2019, 29, 869–875 CrossRef.
- H. Yang, X. Liu, S. Sun, Y. Nie, H. Wu, T. Yang, S. Zheng and S. Lin, Mater. Res. Bull., 2016, 78, 112–118 CrossRef CAS.
- Y. Cui, Z. Xing, M. Guo, Y. Qiu, B. Fang, Z. Li, S. Yang and W. Zhou, J. Colloid Interface Sci., 2022, 607, 942–953 CrossRef CAS PubMed.
- P. He, W. Chen, J. Li, H. Zhang, Y. Li and E. Wang, Sci. Bull., 2020, 65, 35–44 CrossRef CAS PubMed.
- H. R. Ghalebi, S. Aber and A. Karimi, J. Mol. Catal. A: Chem., 2016, 415, 96–103 CrossRef.
- Y. Qiu, Z. Xing, M. Guo, T. Zhao, Y. Wang, P. Chen, Z. Li, K. Pan and W. Zhou, J. Colloid Interface Sci., 2021, 582, 752–763 CrossRef CAS PubMed.
- R. Guo, L. Bai, G. Dong, D. Chai, K. Lang, Z. Mou and M. Zhao, J. Inorg. Organomet. Polym. Mater., 2022, 32, 1599–1615 CrossRef CAS.
- Y. Wu, Y. Li, T. Zhao, X. Wang, V. I. Isaeva, L. M. Kustov, J. Yao and J. Gao, Carbohydr. Polym., 2022, 296, 119969 CrossRef CAS PubMed.
- H. Guo, C. G. Niu, L. Zhang, X. J. Wen, C. Liang, X. G. Zhang, D. L. Guan, N. Tang and G. M. Zeng, ACS Sustainable Chem. Eng., 2018, 6, 8003–8018 CrossRef CAS.
- R. Liang, R. Chen, F. Jing, N. Qin and L. Wu, Dalton Trans., 2015, 44, 18227–18236 RSC.
- H. He, S. Xue, Z. Wu, C. Yu, K. Yang, L. Zhu, W. Zhou and R. Liu, J. Mater. Res., 2016, 31, 2598–2607 CrossRef CAS.
- L. Wang, J. Wang, C. Ye, K. Wang, C. Zhao, Y. Wu and Y. He, Ultrason. Sonochem., 2021, 80, 105813 CrossRef CAS PubMed.
- L. Xu, N. P. Liu, H. L. An, W.-T. Ju, B. Liu, X.-F. Wang and X. Wang, Ultrason. Sonochem., 2022, 89, 106147 CrossRef CAS PubMed.
- N. Ertugay and F. N. Acar, Appl. Surf. Sci., 2014, 318, 121–126 CrossRef CAS.
- Y. L. Pang and A. Z. Abdullah, Appl. Catal., B, 2013, 129, 473–481 CrossRef CAS.
- Y. L. Pang, A. Z. Abdullah and S. Bhatia, Desalination, 2011, 277, 1–14 CrossRef CAS.
- A. Khataee, S. Saadi, B. Vahid, S. W. Joo and B.-K. Min, Ultrason. Sonochem., 2016, 29, 27–38 CrossRef CAS PubMed.
- A. Khataee, R. D. C. Soltani, A. Karimi and S. W. Joo, Ultrason. Sonochem., 2015, 23, 219–230 CrossRef CAS PubMed.
- A. G. Chakinala, P. R. Gogate, A. E. Burgess and D. H. Bremner, Ultrason. Sonochem., 2007, 14, 509–514 CrossRef CAS PubMed.
- W. Yuan, C. Zhang, H. Wei, Q. Wang and K. Li, RSC Adv., 2017, 7, 22825–22835 RSC.
- N. Golash and P. R. Gogate, Ultrason. Sonochem., 2012, 19, 1051–1060 CrossRef CAS PubMed.
- A. Khataee, A. Karimi, S. Arefi-Oskoui, R. D. C. Soltani, Y. Hanifehpour, B. Soltani and S. W. Joo, Ultrason. Sonochem., 2015, 22, 371–381 CrossRef CAS PubMed.
- J. Madhavan, P. S. S. Kumar, S. Anandan, F. Grieser and M. Ashokkumar, Sep. Purif. Technol., 2010, 74, 336–341 CrossRef CAS.
- L. Hou, H. Zhang, L. Wang and L. Chen, Chem. Eng. J., 2013, 229, 577–584 CrossRef CAS.
- A. Khataee, R. Darvishi Cheshmeh Soltani, Y. Hanifehpour, M. Safarpour, H. Gholipour Ranjbar and S. W. Joo, Ind. Eng. Chem. Res., 2014, 53, 1924–1932 CrossRef CAS.
- V. Leandri, J. M. Gardner and M. Jonsson, J. Phys. Chem. C, 2019, 123, 6667–6674 CrossRef CAS.
- Y. Rao, H. Yang, D. Xue, Y. Guo, F. Qi and J. Ma, Ultrason. Sonochem., 2016, 32, 371–379 CrossRef CAS PubMed.
- W. Xie, Y. Qin, D. Liang, D. Song and D. He, Ultrason. Sonochem., 2011, 18, 1077–1081 CrossRef CAS PubMed.
- L. Kai, Y. Liang, Y. Jian, Y. Gui, X. Rui and X. Xie, Catal. Sci. Technol., 2018, 8, 6057–6061 RSC.
- K. Li, Y. Liang, Y. Jian, H. Zhang, G. Yang and W. Lei, J. Photochem. Photobiol., A, 2018, 364, 240–249 CrossRef CAS.
- J. Singh, Y. Y. Chang, J. R. Koduru, J. K. Yang and D. P. Singh, Environ. Sanit. Eng. Res., 2017, 22, 245–254 CrossRef.
- L. Ruíz-Baltazar, Ultrason. Sonochem., 2021, 73, 105521 CrossRef PubMed.
- C. H. Nguyen, C. C. Fu and R. S. Juang, J. Cleaner Prod., 2018, 202, 413–427 CrossRef CAS.
- L.-L. He, X.-P. Liu, Y.-X. Wang, Z.-X. Wang, Y.-J. Yang, Y.-P. Gao, B. Liu and X. Wang, Ultrason. Sonochem., 2016, 33, 90–98 CrossRef CAS PubMed.
- J. Wang, B. Guo, X. Zhang, Z. Zhang, J. Han and J. Wu, Ultrason. Sonochem., 2005, 12, 331–337 CrossRef CAS PubMed.
- L. Song, S. Zhang, X. Wu and Q. Wei, Chem. Eng. J., 2012, 184, 256–260 CrossRef CAS.
- M. Zhou, H. Yang, T. Xian, Y. Yang and Y. Zhang, Chin. J. Catal., 2015, 36, 1987–1994 CrossRef CAS.
| This journal is © The Royal Society of Chemistry 2023 |