
 Open Access Article
 This Open Access Article is licensed under a Creative Commons Attribution-Non Commercial 3.0 Unported Licence
Point-of-care paper-based analytical device for potentiometric detection of myoglobin as a cardiovascular disease biomarker
Abdulrahman A. Almehizia a,
Ahmed M. Naglaha,
Lamees S. Alrasheedb,
Mashael G. Alanazib,
Abdel El-Galil E. Amrc and
Ayman H. Kamel*de
a,
Ahmed M. Naglaha,
Lamees S. Alrasheedb,
Mashael G. Alanazib,
Abdel El-Galil E. Amrc and
Ayman H. Kamel*de
aDrug Exploration and Development Chair (DEDC), Department of Pharmaceutical Chemistry, College of Pharmacy, King Saud University, P.O. Box 2457, Riyadh 11451, Saudi Arabia
bDepartment of Pharmaceutical Chemistry, College of Pharmacy, King Saud University, P.O. Box 2457, Riyadh 11451, Saudi Arabia
cApplied Organic Chemistry Department, National Research Center, Dokki, Giza 12622, Egypt
dDepartment, College of Science, University of Bahrain, Sokheer 32038, Kingdom of Bahrain. E-mail: ahkamel76@sci.asu.edu.eg; ahmohamed@uob.edu.bh
eDepartment of Chemistry, Faculty of Science, Ain Shams University, Cairo 11566, Egypt
First published on 18th May 2023
Abstract
One of the cardiac biomarkers, myoglobin (Mb), is important in the rapid identification of cardio-vascular disorders. Therefore, point-of-care monitoring is essential. Pursuing this goal, a robust, reliable, and affordable paper-based analytical apparatus for potentiometric sensing has been developed and characterized. The molecular imprint technique was used to create a customized biomimetic antibody for myoglobin (Mb) on the surface of carboxylated multiwalled carbon nanotubes (MWCNT–COOH). This was accomplished by attaching Mb to carboxylated MWCNTs' surfaces and then filling the empty spaces through the mild polymerization of acrylamide in N,N-methylenebisacrylamide and ammonium persulphate. The modification of the MWCNTs' surface was verified by SEM and FTIR analysis. A hydrophobic paper substrate coated with fluorinated alkyl silane (CF3(CF2)7CH2CH2SiCl3, CF10) has been coupled with a printed all–solid–state Ag/AgCl reference electrode. The presented sensors showed a linear range of 5.0 × 10⁻⁸ to 1.0 × 10⁻⁴ M with a potentiometric slope of −57.1 ± 0.3 mV decade−1 (R2 = 0.9998) and a detection limit of 28 nM at pH 4. Compared to creatinine, sucrose, fructose, galactose, sodium glutamate, thiamine, alanine, ammonium, uric acid, albumin, glutamine, guanine, troponine T, and glucose, the sensor showed good selectivity for Mb. It demonstrated a good recovery for the detection of Mb in several fake serum samples (93.0–103.3%), with an average relative standard deviation of 4.5%. The current approach might be viewed as a potentially fruitful analytical tool for obtaining disposable, cost-effective paper-based potentiometric sensing devices. These types of analytical devices can be potentially manufacturable at large scales in clinical analysis.
1. Introduction
Myoglobin (Mb) is an iron- and oxygen-binding protein that is present in the cardiac and skeletal muscle tissue of nearly all mammals and other vertebrates in general. It has a stronger affinity for oxygen than hemoglobin and does not cooperate with oxygen like hemoglobin does.1 Damaged muscle tissue (rhabdomyolysis), which contains a very high proportion of myoglobin, releases myoglobin.2 The kidneys filter the released myoglobin, but because it is harmful to the renal tubular epithelium, it may lead to acute kidney injury.3 It is not the myoglobin itself that is toxic (it is a protoxin) but the ferrihemate portion that is dissociated from myoglobin in acidic environments (e.g., acidic urine, lysosomes). Since myoglobin is a sensitive marker for muscle damage, it may be a sign of a heart attack in people who have chest pain.4 The diagnosis should consider CK-MB, cardiac troponin, and clinical symptoms because increased myoglobin has a low specificity for acute myocardial infarction (AMI).5Cardiovascular diseases, which include coronary heart disease, cerebrovascular disease, high blood pressure, peripheral artery disease, rheumatic heart disease, congenital heart disease, and heart failure, are the world's largest cause of death.6 Chest pain, pressure, shortness of breath, and/or nausea are all signs of distinct acute coronary syndrome (ACS) diseases. Although these symptoms are frequently linked to angina and heart attacks, they can also occur with other illnesses unrelated to the heart. It is essential that physicians are given more information in a timely manner so they can carry out swift and correct diagnosis because the therapy for each of the conditions varies, and most of them call for urgent measures.7 To date, cardiac biomarkers have been used to do this. When the heart muscle is injured, chemicals known as cardiac biomarkers are released into the blood.8 When a patient exhibits ACS symptoms, a blood sample is taken to monitor them. Several important cardiac indicators have fluctuating values over time.9 Myoglobin (Mb) is one of the very first known indicators that rises after an acute myocardial infarction, despite not being cardiac-specific,10 and its quick screening under acute physiological settings is crucial. The 153 amino acid residues that make up human Mb are folded into a highly compact structure with eight different alpha helical secondary structures, giving it a molecular weight of 16.7 kDa. Myoglobin has the following dimensions: (3 nm, 4 nm, and 5 nm), and its molar volume is 1.87 × 10⁴ mL mol−1.11
Several analytical techniques have been used to identify and measure Mb. Some of these methods include spectrofluorimetric,12–15 electrochemiluminescence,16 chemiluminescence,17 surface plasmon resonance method,18 mass spectroscopy,19 liquid chromatography,20 spectrophotometric,21,22 molecularly imprinting,23,24 Immunoassay,25,26 and electrochemical methods.27–35 Most of these techniques lack the necessary specificity, entail multiple stages, take a long time, and cost a lot of money in reagents like pricey antibodies and noble metals like Au, Ag, or Pt, which restricts their use. Additionally, they are costly for routine analytical measurements and time consuming for use at the point of treatment.
It might be useful to replace natural receptors with their synthetic equivalents when determining Mb. These natural receptors can provide greater mechanical strength, greater stability in pH and temperature extremes, reduced cost, and reusability. To successfully create an artificial antibody for Mb, suitable molecular imprinting (MI) procedures may be chosen. Since it is a rapidly evolving technology, potentiometric transduction applications for sensing have also been studied.36,37
Rapid cardiac disease management may be enabled by the creation of accurate point-of-care (POC) diagnosis utilizing an electrochemical paper-based analytical device (ePAD). Fast analysis times, great sensitivity, simplicity, mobility, and low cost are only a few of ePADs' key benefits.38–42 It is possible to increase the specificity and provide portable testing devices for point-of-care monitoring by particularly combining ePADs with immunoassay. Even if the sensitivity of the electrochemical measurement is increased by the inclusion of these labeling materials, labeled immunoassays sometimes require expensive chemicals and a labor-intensive, time-consuming labeling process. Because this method enables direct detection of the antigen/biomarker–antibody combination, a label-free immunoassay can greatly simplify the assay platform and lower the cost of production.43,44
In this work, we demonstrated a potentiometric PAD coupled with Mb imprinting polymer/MWCNTs composite for Mb detection. The appropriate MIP particles were added to a polymeric membrane to act as a Mb receptor. The same method was used without a template to test the imprinting effect (Mb). The obtained non-imprinted (NIP) particles were inserted in polymeric membranes in a similar manner and served as a control. The presented potentiometric PAD was further improved, assessed against various background media, and used to analyze Mb in artificial serum samples.
2. Materials and methods
2.1. Apparatus
Benchtop mV/pH meter (PXSJ-216, INESA Scientific Instrument Co., Ltd, Shanghai, China) was used for all mV measurements. With the aid of a Metrohm potentiostat/galvanostat (Autolab, model 204, Herisau, Switzerland), reversed-current chronopotentiometry was performed. These measurements were conducted using a three-electrode cell. The reference electrode was Ag/AgCl/1 M (KCl), while the auxiliary electrode was Pt wire.2.2. Reagents and solutions
De-ionized water (conductivity 0.1 μS cm−1) and analytical-grade chemicals were also used throughout. Multi-walled carbon nanotubes (MWCNTs–COOH) (>8% carboxylic acid functionalized, avg. diam. × L 9.5 nm × 1.5 μm), Myoglobin (Mb) from equine skeletal muscle-95–100%, essentially salt-free, lyophilized powder, 4-(2-hydroxyethyl)-1-piperazineethanesulfonic acid (HEPES), piperazine-N,N-bis(2-ethanesulfonic acid) (PIPES), o-nitrophenyloctyl ether (o-NPOE), and Fluorinated alkyl silane (CF3(CF2)7CH2CH2SiCl3, CF10) were purchased from Sigma-Aldrich. High-molecular poly(vinyl chloride) (PVC), acrylamide (AAM), N,N-methylenebisacrylamide (NNMBA), tetrahydrofuran (THF), oxalic acid (Oxa), N-hydroxysuccinimide (NHS), N-ethyl-N-(3-dimethylaminopropyl) carbodiimide hydrochloride (EDAC), tetrahydrofuran (THF) and ammonium persulfate (APS) were purchased from Fluka. Ag/AgCl ink (E2414) was purchased from Ercon (Wareham, MA).Stock solutions containing 1.0 × 10⁻⁴ M Mb were prepared in de-ionized water. Less concentrated Mb solutions were prepared by serial dilution from the stock solution using 10 mM HEPES buffer solution, pH 4.
The interference effect was evaluated for 1.0 μM Mb prepared in HEPES buffer, pH 4.5. All interfering species were prepared in the same buffer and the same pH. For this purpose, creatinine (Creat, 1.0 mM), sucrose (Sac, 15 μM), fructose (Fru, 1.0 mM), galactose (Gat, 50 μM), sodium glutamate (Glt, 80 μM), thiamine (Thia, 10 μM), alanine (Ala, 50 μM), ammonium (NH4+, 100 μM), uric acid (Urate, 80 μM), albumin (alb, 100 μM), glutamine (Glut, 70 μM), guanine (Guan, μM), troponine T (TPN, 20 μM) and glucose (Gluc, 50 μM) solutions were prepared.
An artificial serum solution was prepared as reported in the literature.45 A 6.8 g of NaCl, 2.2 g of NaHCO3, 0.4 g of KCl, 0.2 g of CaCl2, 0.1 g of MgSO4, 0.12 g of Na2HPO4, and 0.02 g of NaH2PO4 were dissolved in 1.0 L of deionized water.
2.3. MIPs synthesis
About 3.0 mg of carboxylated MWCNTs were suspended in 1.0 mL of deionized water and then sonicated for another 1 minute. After, 1.0 mL of an aqueous solution containing 2 mM EDAC, and 5 mM NHS was added to the suspension. The mixture was continuously agitated at room temperature for 45 min. Nylon membrane filter of a 0.45 μm pore size and a 47 mm diameter was used to filter the suspension. To get rid of the unreacted chemicals, the solid material was extensively rinsed with deionized water.To bind the template, the modified MWCNTs were re-dispersed for 4 h at 4 °C in 1 mL of a 10 mM HEPES buffer solution, pH 4 containing 10.0 μM Mb and 0.1 M NaCl. To block the unreacted ester groups, the MWCNTs were then incubated in 1 M Tris buffer for 30 min. Finally, 1 mL of a 50 mM AAM and 50 mM NNMBA (dissolved in PIPES solution, pH 7.0) was added to the MWCNTs after several washing with deionized water. To begin the polymerization process, 1 mL of a 50 mM APS solution in PIPES (pH 7.0) was added. After one hour of polymerization at room temperature, the MIPs beads were washed several times with deionized water. For template removal, 1 mL of 1 M H2C2O4 was introduced to the beads and incubated for 12 hours at room temperature. To raise the pH and get rid of the peptide fractions created by the oxalic acid treatment, the imprinted MWCNTs were washed and conditioned in 10 mM phosphate buffer, pH 8.0 (Fig. 1). The non-imprinted beads (NIP) were synthesized using the same procedure as the imprinted material (MIPs), but without Mb molecule.
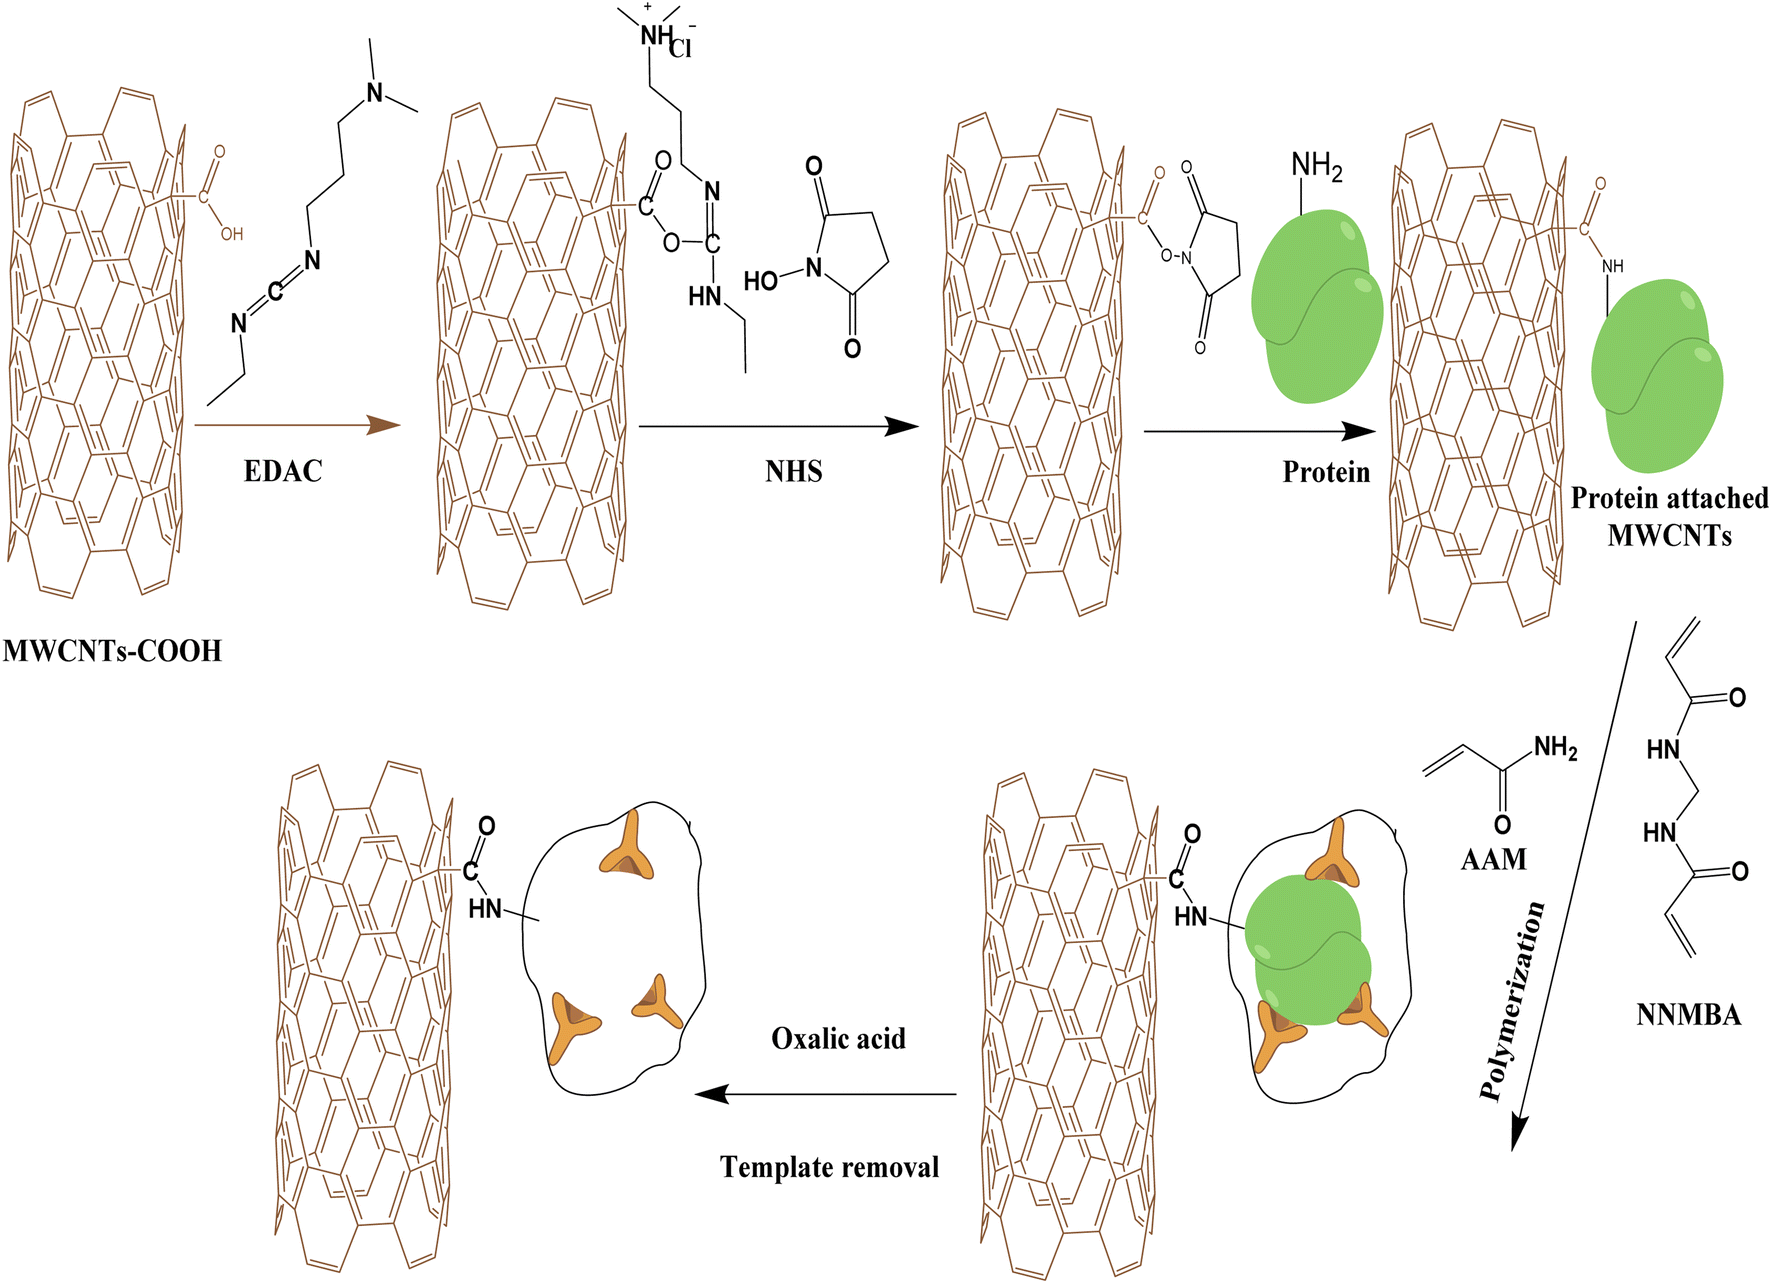 | ||
| Fig. 1 A schematic illustration of the imprinting process of Mb. | ||
2.4. Electrode design and membrane preparation
A hydrophobic paper was used as an electrode substrate. A Petri dish was filled with 20 mL of CF10 and then the paper substrate is immersed in this solution. The CF10 was evaporated under vacuum for 30 min at 80 °C. A homogeneous and uniform layer of CF10 is coated on the surface of the paper-electrode substrate. For the preparation of the ion-sensing membrane, o-NPOE (48 mg), PVC (48 mg), and the sensing polymer MIP or NIP beads (4 mg) were dissolved in 1.5 mL THF. To create the modified Mb-ISE, 20 μL of the membrane cocktail was drop-casted over the modified CF10-paper and allowed to dry for 2 hours.45 Ag/AgCl ink with an original width of 2 mm was printed on the CF10-paper to create the solid-state reference electrode. As a result, 1 mL of methanol was used to dissolve 70.5 mg of polyvinyl butyral (PVB) along with 50 mg of sodium chloride (Fig. 5). These sensors were conditioned in a 1 × 10⁻⁷ M Mb solution. When not in use, the sensors were stored in this solution.2.5. Potentiometric procedures
At room temperature, steady stirring was used to conduct all potentiometric measurements. By transferring 20 μL to 2.5 mL aliquots of 1.0 × 10⁻⁴ M Mb aqueous solution to a 50 mL beaker containing 20.0 mL of 10 mM HEPES buffer solution, pH 4, increasing concentrations of Mb were achieved. After potential stabilization to ±0.2 mV, the potential readings of the stirred Mb solutions were monitored at room temperature and recorded. The sensors were conditioned in a 1 × 10⁻⁵ M Mb solution in between experiments.By using the matched potential method (MPM),46 potentiometric selectivity coefficients were evaluated (MPM). The concentration of Mb solution (aA′) added to the original Mb concentration (aA, 1.0 μM) was 4.0 μM (aA′). About 13 mV was the corresponding potential change. Small aliquots of the interfering ion solutions [e.g., creatinine, sucrose, fructose, alanine, glucose, galactose, glutamine, NH4+, Uric acid, albumin, thiamine, guanine, and troponine T were added into the primary ion solution of aA until the same potential change was observed.
2.6. Sensors' applicability
The capacity of the suggested sensors to recover Mb from a synthetic serum solution was tested. A 25 mL beaker was filled with 1 mL of the prepared artificial serum solution after it had been combined with 9 mL of 10 mM HEPES buffer solution, pH 4. The serum solution was blended with various aliquots of Mb standard solution. After inserting the paper-based analytical device into the solution, the potential after attaining equilibrium was then measured. With the help of the created calibration plot, the quantity of Mb spiked was computed.3. Results and discussions
3.1. MIP characterization
Imprinting was used to create synthetic receptors (MIP) to increase the amount of functional binding sites on the carboxylated MWCNTs. MWCNTs–COOH was chosen for this purpose due to its substantial surface area, good recognizing capacity to adsorb Mb, and compatible with a variety of transducers. The general procedure for creating the plastic antibody involved attaching the protein to MWCNTs–COOH surface, filling up the spaces around it with an appropriate stiff structure, and then removing the protein (Fig. 1). To guarantee that Mb's tridimensional distribution and electrostatic environment were unaffected, nearly all procedures were carried out in a moderate environment. Fig. 1 depicts a summary of the processes that were used to attach Mb to the MWCNT–COOH covalently. By including EDAC, the COOH groups on the MWCNTs' surface were activated. This reaction creates a highly reactive intermediate called O-acylisourea, which combines swiftly with NHS to create a more stable ester (succinimidyl intermediate). The MWCNTs and Mb establish an amide bond because of this ester's nucleophilic replacement with any readily available amine group on Mb. To inhibit the unreacted ester groups, Mb-MWCNTs were then incubated in a 1 M Tris solution for 30 min. The Mb-MWCNTs particles were for 45 minutes in both AAM (vinyl monomer) and NNMBA (crosslinker) to allow the alignment of monomers and cross-linkers around the template via electrostatic interactions. After the incubation time, the polymerization process started after the addition of APS. The polymerization process was conducted at room temperature for 1 hour to prevent any modifications to the protein structure. After that, a reaction using oxalic acid was used to remove the bounded protein. The imprinted MWCNTs were then cleaned five times, filtered, and treated for an hour in 10 mM phosphate buffer, pH 8.0. To aid the removal of peptides and amino acids at this point, the pH was raised from 1.2 to 8.0.3.2. SEM analysis
The surface morphology of MWCNTs–COOH and MWCNTs–COOH/protein composite was identified using scanning electron microscope (SEM). Fig. 2A displays the SEM images of the carboxylated MWCNT. The average thickness of the carbon multiwalled tubes was 9–12 nm. The MWCNTs' thickness was raised by the surface modification to 18–22 nm (Fig. 2B). SEM was also used to examine the surface morphologies of NIP and MIP after Mb was removed, and the results are shown in Fig. 3. The MIP beads' SEM micrograph (Fig. 3A) revealed semi-spherical, asymmetrical granules with an average diameter of 0.9 μm. While the NIPs beads' SEM micrograph (Fig. 3B) revealed granules with an average diameter of 1.10 μm that were more spherical, smooth, and uniform in shape than those of the MIPs beads. These morphological variations reveal the presence of the imprinting process in the MIP beads and are caused by the lack of certain binding sites in the NIP beads. MIP beads are hence more effective at absorbing and accommodating Mb than NIP beads.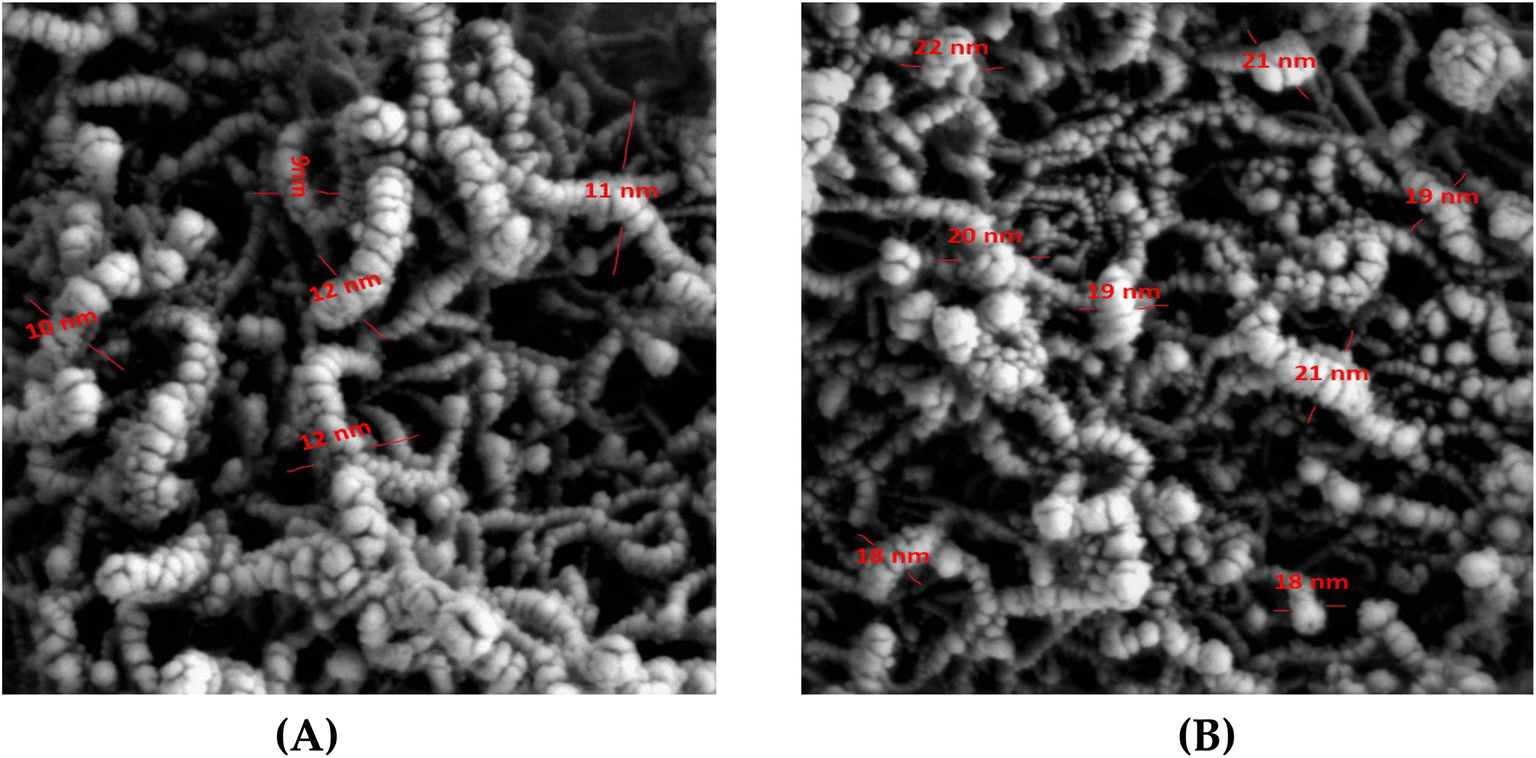 | ||
| Fig. 2 SEM photographs of MWCNTs–COOH (A) and MWCNTs–COOH/protein composite (B). [Mag. = 20.00 KX; EHT = 5.00 kV; WD = 7.8 mm]. | ||
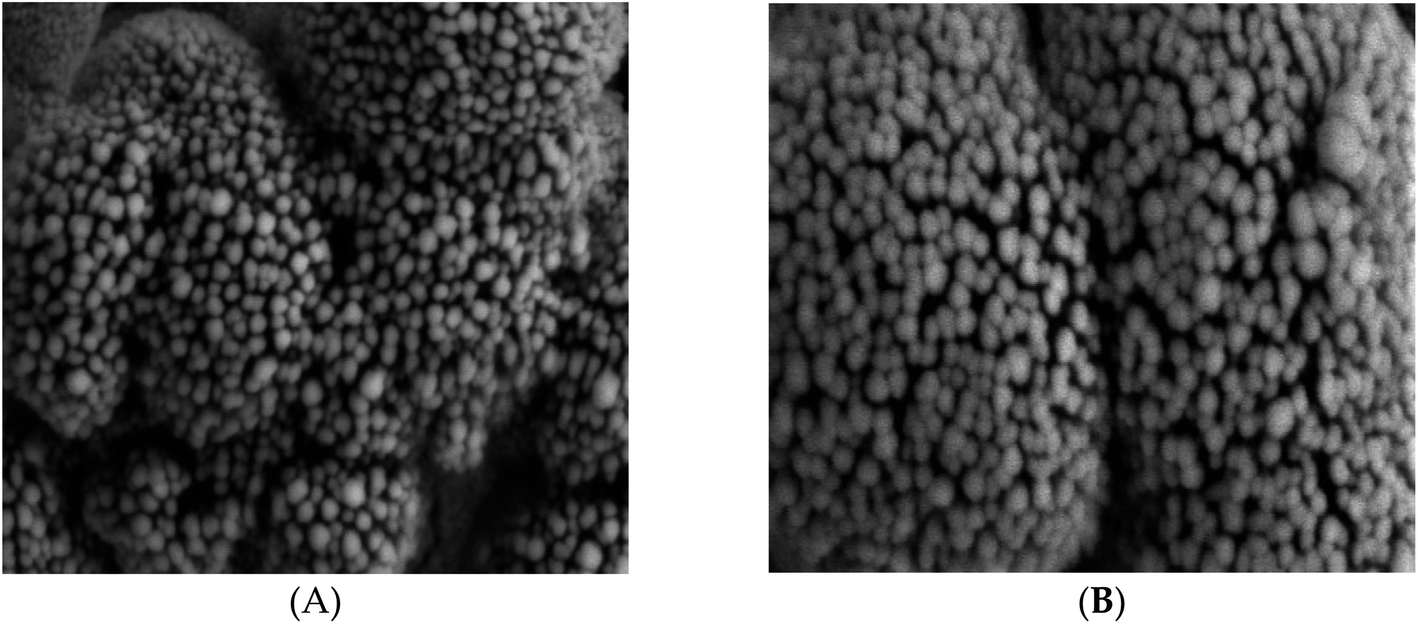 | ||
| Fig. 3 SEM photographs of MIPs (A) [Mag. = 20.00 KX; EHT = 5.00 kV; WD = 6.9 mm] and NIPs (B) [Mag. = 20.00 KX; EHT = 5.00 kV; WD = 8.8 mm]. | ||
3.3. FTIR analysis
Fig. 4 shows the spectra of unmodified and modified MWCNTs–COOH. As shown in Fig. 4A, the presence of a carbonyl group (C![[double bond, length as m-dash]](https://www.rsc.org/images/entities/char_e001.gif) O) by a high absorption near 1628 cm−1 indicates that the carboxylated MWCNTs bear carboxylic groups, which are useful to link proteins by their free amine groups. The hydroxyl (OH) functional group is also related to the significant absorbance seen at about 3424 cm−1. The C–H bond present in MWCNT is attributed to the peak at 2922 cm−1.
O) by a high absorption near 1628 cm−1 indicates that the carboxylated MWCNTs bear carboxylic groups, which are useful to link proteins by their free amine groups. The hydroxyl (OH) functional group is also related to the significant absorbance seen at about 3424 cm−1. The C–H bond present in MWCNT is attributed to the peak at 2922 cm−1.
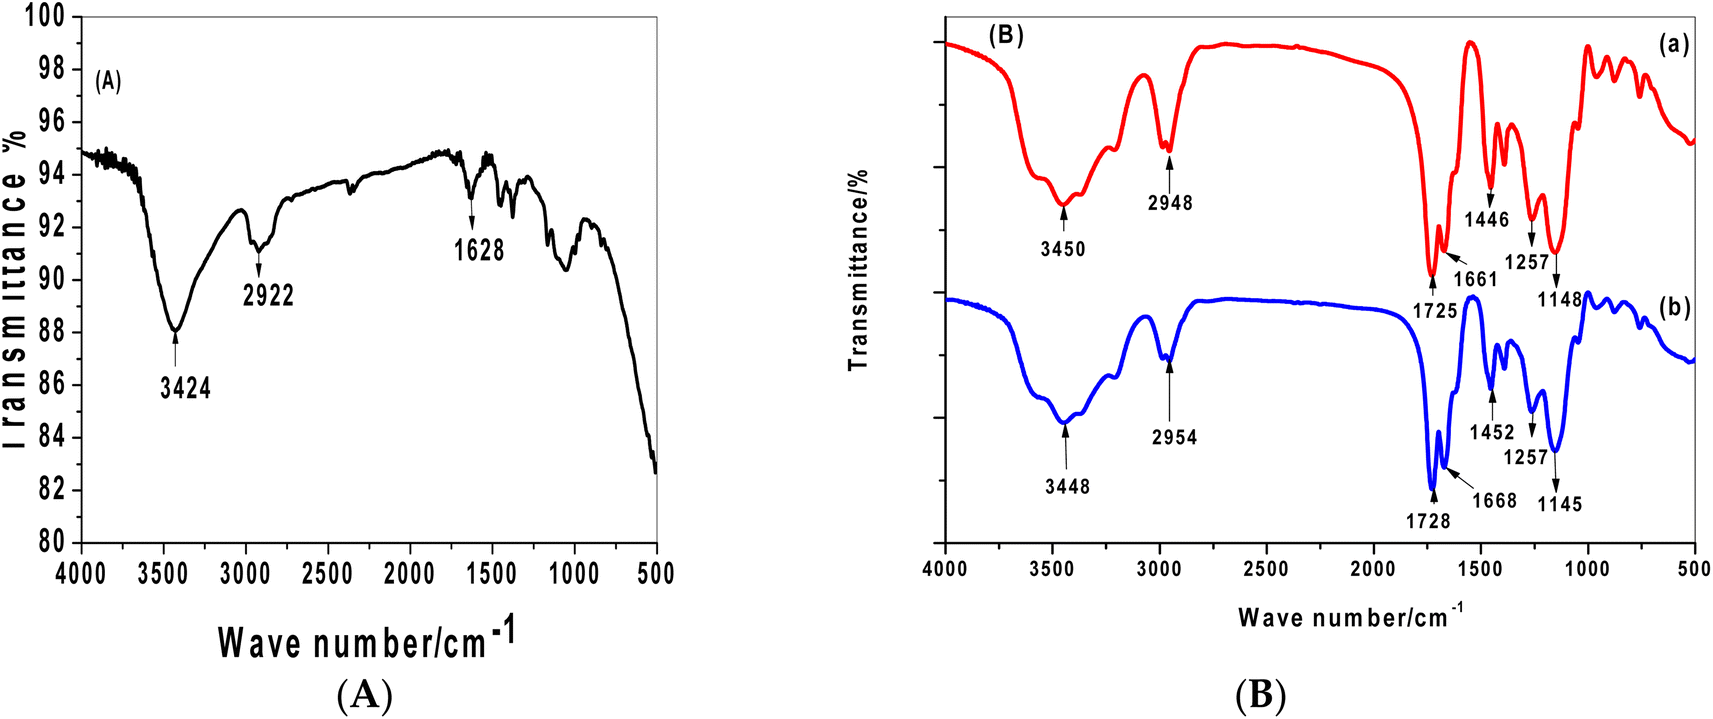 | ||
| Fig. 4 FTIR spectra for: (A) carboxylated-MWCNT; (B) [washed modified MIP/MWCNT (a) and non-imprinted NIP/MWCNT (b)]. | ||
The MIP and NIP materials shown in Fig. 4B had their surfaces modified, which caused several amide bonds to form. The MWCNTs' carboxylic group was converted to an amide, and this functional group is present in both the monomer and cross-linker structures. As a result, the N–H stretching can be seen in both spectra, which also show a broad band between 3567 and 3214 cm−1 and a peak at 1661–1668 cm−1 that is indicative of the amide carbonyl group produced by the acrylamide monomer. Additionally, there were two distinct peaks in 1725 and 1257 cm−1 that were attributed to –CO and −C−N stretching and came from the usage of NNMBA as a cross linker.
3.4. Design of paper-based sensor
As shown in Fig. 5, it illustrated the paper-based sensor's design and manufacturing process. CF10 was applied to the paper surface to increase its hydrophobicity and get rid of the water-layer effect. After that, a layer of carbon ink was added to the paper to act as a medium for converting the paper into conductive substrate. The electrical resistance of the conducted paper was measured as a function of the quantity of spraying cycles. The resistivity of the paper reduces with an increase in spraying cycles. After seven spraying cycles, the resistance remains constant and reaches ∼140 Ω. The paper was repeatedly bent at several angles of bending (i.e. 30, 60, and 90) to test the mechanical flexibility of the paper-based sensor. The electromotive force (EMF) and resistance both showed a potential drift of 35 Ω and 3.5 mV, respectively. These findings show that the constructed paper-based sensor had strong conductivity and good mechanical flexibility.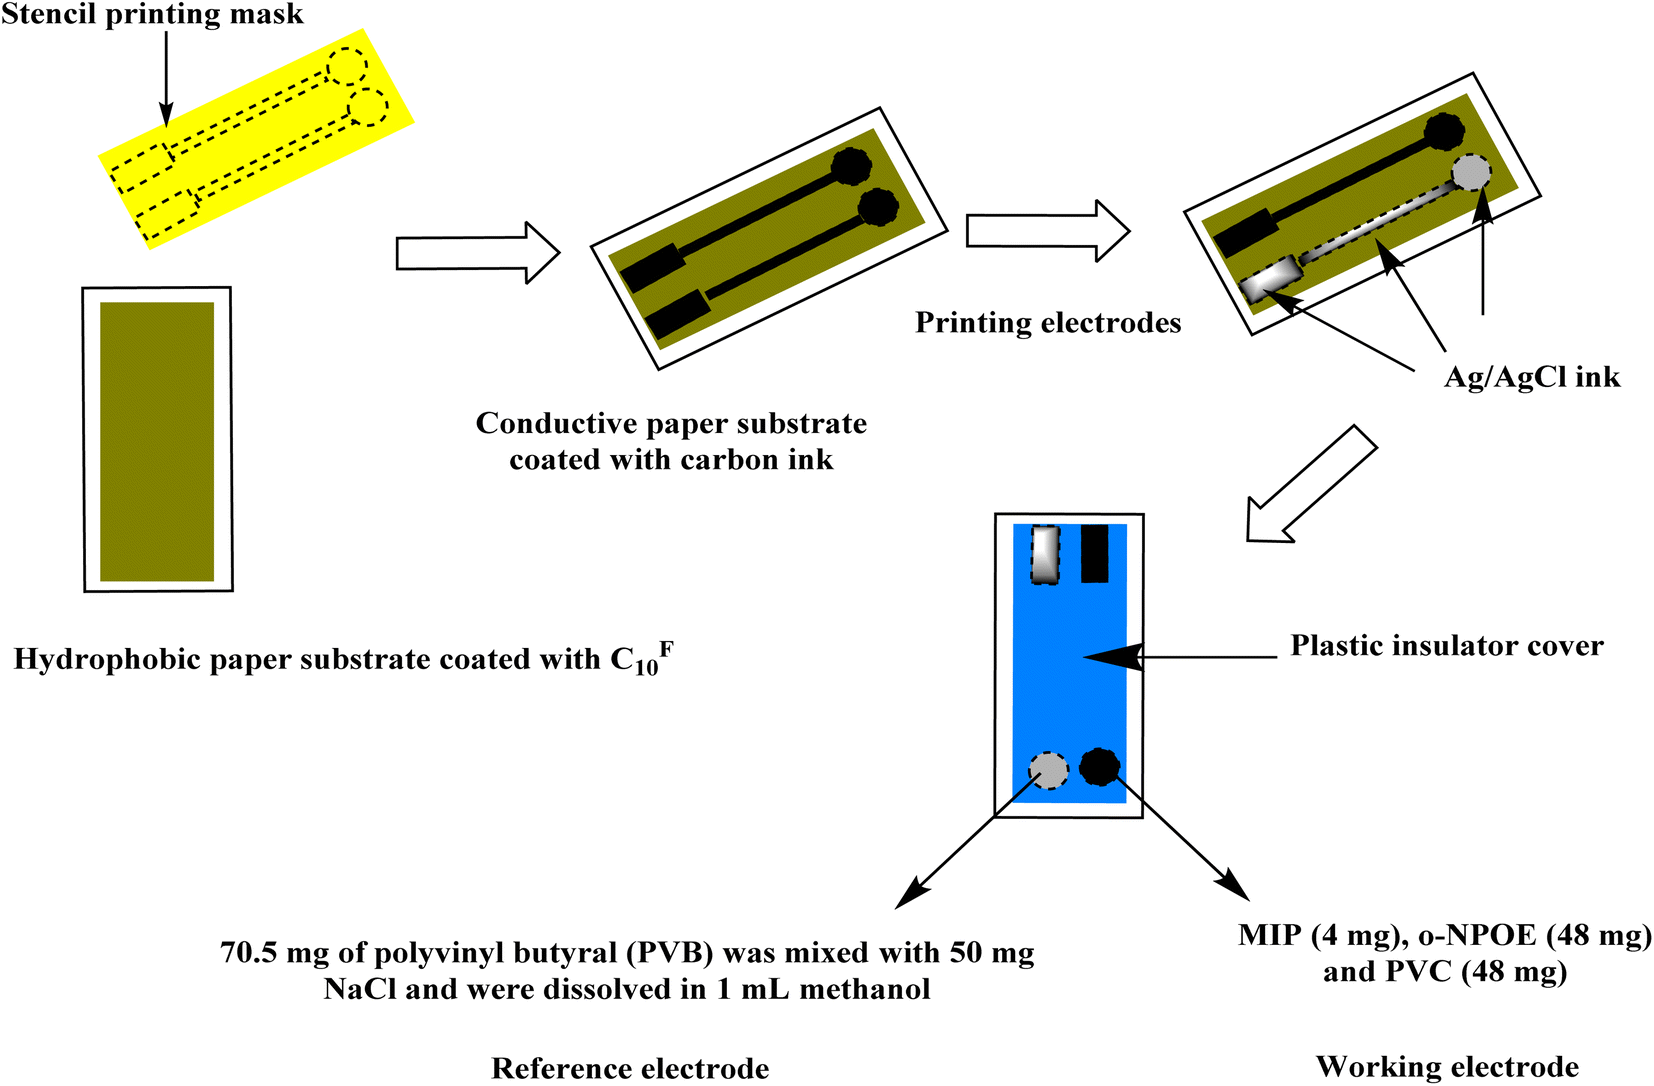 | ||
| Fig. 5 A schematic illustration of how paper-based ISE is made. | ||
3.5. Potentiometric performance of Mb-paper-based analytical device
The MIP/MWCNTs and NIP/MWCNTs were used as electroactive components to examine their capacity for rebinding towards Mb. For this reason, these imprinted beads were mixed with PVC and a solvent mediator. As a control, MWCNTs that hadn't been altered were also used. The Mb sensor and the reference Ag/AgCl electrode are both parts of the potentiometric paper-based analytical device. For each ionophore, various paper-based analytical devices were built, and their analytical performances were assessed in accordance with IUPAC guidelines.46For concentrations ranging from 1.0 × 10⁻⁸ to 1.0 × 10⁻³ M, the potential readings for MIP membrane-based sensors changed linearly with log[Mb], displaying detection limits down to 1.0 × 10⁻⁷ M decade. The potentiometric sensor made with NIP particles, on the other hand, has a detection limit of 2.0 × 10⁻⁷ M with a slope of −24.4 mV decade−1 and a linearity range of 1.0 × 10⁻⁶ to 1.0 × 10⁻⁴ M. These findings suggested that the potentiometric response was not primarily caused by the non-specific sites of interaction (the only kind that occur on NIP particles) between the template and the polymer. The unique interaction between the template and the sensor was only possible when monomers polymerized in the presence of a template and had imprinted cavities. As a result, the topographic recognition of the analyte at the imprinted cavities was the primary cause of the potentiometric response seen for the MIP particles.
Paper-based sensors integrated with MIP beads were calibrated in a variety of pH ranges, from pH 4 to pH 8. The obtained potentiometric response is displayed in Fig. 6. With slopes of −57.1, −20.7, −16.1, −4.2, and +14.5 mV decade−1 and detection limits of 2.8 × 10⁻⁸, 1.5 × 10⁻⁷, 4.3 × 10⁻⁷, 6.0 × 10⁻⁷, and 1.5 × 10⁻⁶ M for pH values 4, 5, 6, 7 and 8, respectively, a linear behavior was seen down to 5.0 × 10⁻⁸, 3.2 × 10⁻⁷, 3.1 × 10⁻⁶, 1.0 × 10⁻⁶, and 1.0 × 10⁻⁵ M of Mb. Basically, the slopes became cationic for pH 8.0 and became anionic below pH 7. According to these findings, Mb was positively charged above pH 7.5 and negatively charged below.47 The isoelectric point for Mb, which is equal to 7.2, would predict the exact opposite reaction from this, though. Numerous ionizable functional groups on the outside of myoglobin could potentially interact with the membrane. The protein is thought to be approaching the membrane by its negatively charged groups, which is the best explanation for the negative behavior of these selective sensors in acidic medium. The positively charged H+, which is near to the membrane and fosters a favorable environment, favors these groups. For subsequent measurements, a pH of 4 was chosen for analytical use. Assuming that Mb was singly charged in this situation, this was the sole circumstance in which the sensor showed behavior that was close to the Nernstian behavior.
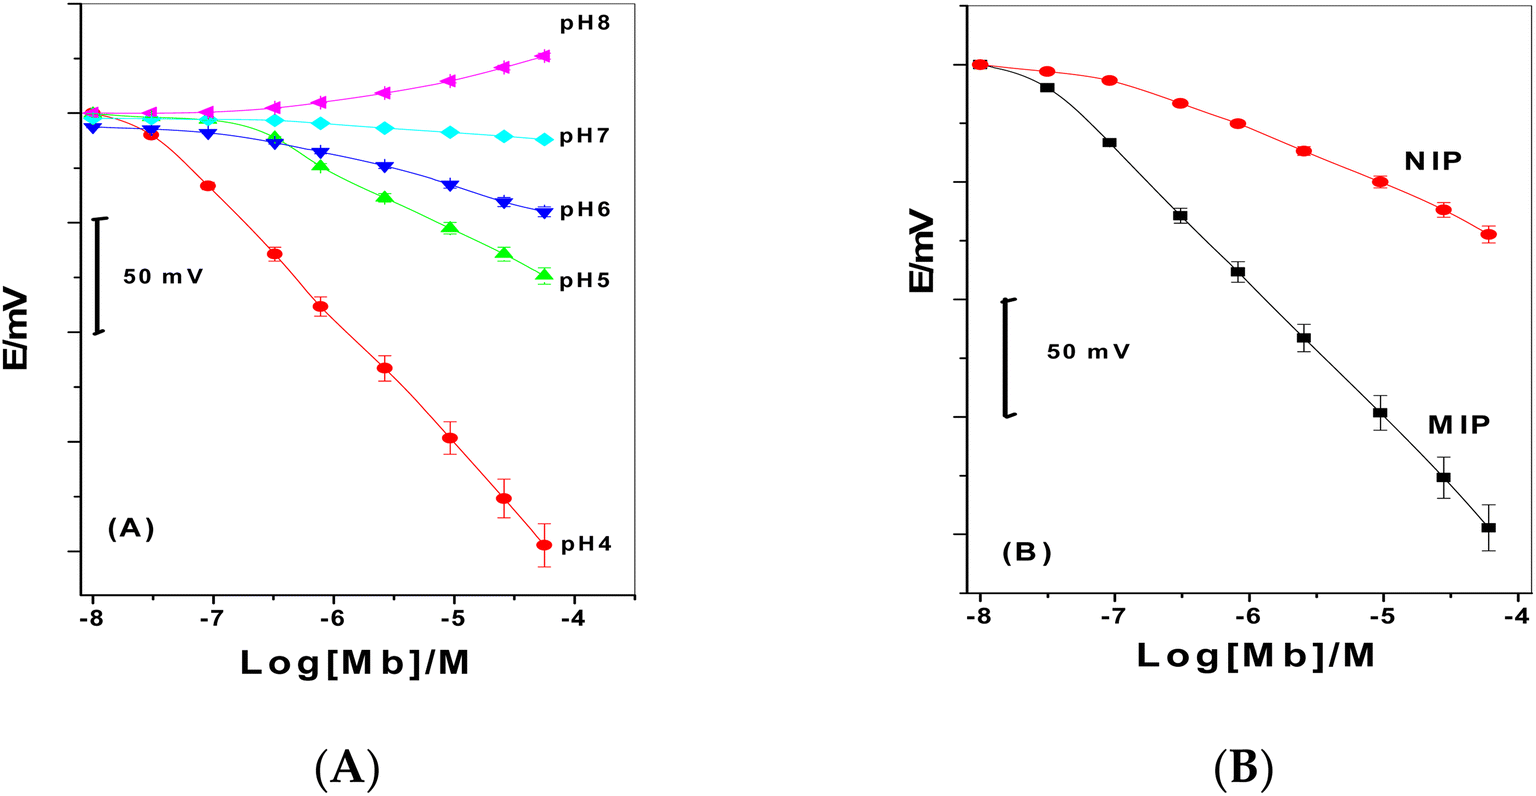 | ||
| Fig. 6 (A) Calibration plots of Mb membrane-based sensors in different pH solutions, and (B) calibration plots of both MIP and NIP membrane-based sensors in pH 4. | ||
For the employment of these paper-based analytical devices in decentralized analysis, the sensors achieved a steady-state potential response in <10 s, which is satisfactory and reasonable. Given that these analytical devices are designed for a single-short reading, a long-term potential stability test revealed a potential drift of roughly 0.25 mV h−1 (16 h), which is also acceptable.
For the paper-based analytical devices that were shown, intra-day and inter-day precision were looked at. Internal quality control sample of Mb was tested at 1.0 mg mL−1 (n = 6). The results showed that the relative standard deviations were 0.9. A known Mb quantity (0.5 mg mL−1) was spiked to test the method's accuracy, which was discovered to be 98.2 ± 0.7%.
3.6. Selectivity study
The electroactive biomaterial's and Mb's ion exchange constants determine the potentiometric sensor's selectivity behavior. This proposes using ligands that have a great affinity for the desired ion and a poor affinity for the others. Therefore, using MIPs should result in a higher level of selectivity behavior than using either NIP material. By determining the potentiometric selectivity coefficients, KPOTMb,B, the selectivity behavior was evaluated for both MIP/Mb and NIP/Mb membrane-based sensors. The MIP/Mb membrane-based sensor increased its selectivity for Mb as the KPOTMb,B fell. As it is closer to a real-application use of the sensor, the matched potential method (MPM) was employed. It examines the primary and interfering ions simultaneously and does not demand that the sensor behave in a Nernstian behavior regarding each interfering species (see Table 1).| Interfering ion, B | KPOTMb,B ± SDa | |
|---|---|---|
| MIP/Mb | NIP/Mb | |
| a ±SD (standard deviation) (n = 3). | ||
| Creatinine | −2.8 ± 0.2 | −2.1 ± 0.1 |
| Sucrose | −2.1 ± 0.1 | −1.7 ± 0.2 |
| Fructose | −2.7 ± 0.3 | −2.0 ± 0.2 |
| Galactose | −1.9 ± 0.1 | −1.5 ± 0.2 |
| Glucose | −2.6 ± 0.3 | −1.9 ± 0.1 |
| Glutamate | −2.9 ± 0.1 | −2.7 ± 0.2 |
| Thiamine | −1.3 ± 0.2 | −1.0 ± 0.1 |
| Guanine | −1.5 ± 0.1 | −1.1 ± 0.1 |
| Glutamine | −1.6 ± 0.2 | −1.3 ± 0.3 |
| Alanine | −1.8 ± 0.2 | −1.4 ± 0.1 |
| Albumin | −2.2 ± 0.1 | −1.7 ± 0.1 |
| Troponine T | −1.1 ± 0.3 | −0.8 ± 0.05 |
| Uric acid | −3.1 ± 0.1 | −3.0 ± 0.2 |
| NH4+ | −3.4 ± 0.2 | −3.3 ± 0.1 |
Several organic species that are frequently found in biological samples, such as proteins, carbohydrates, amino acids, and metabolites, were chosen as potential interfering substances. For this reason, creatinine, sucrose, fructose, galactose, sodium glutamate, thiamine, alanine, ammonium, uric acid, albumin, glutamine, guanine, troponine T and glucose were taken into consideration. Their influence was deemed to be minimal. As shown in Table 1, most logarithm selectivity coefficient values were under 2.0. There is negligible interference from most of the studied interfering species.
3.7. Assessment of myoglobin
To determine Mb in samples of spiked artificial serum, the presented sensor was successfully used. Five samples were tested after the operation. When comparing the data produced using the presented potentiometric method with the spiked amounts, the results were accurate (Table 2). Recovery ranged from 93.0 to 103.3%, with an average relative standard deviation of 4.5%, according to the potentiometric analysis's results. The average relative standard deviation was 0.02%, while the relative error ranged from −7.0 to +3.3.The normal range for Mb in blood is 1.28 to 3.67 nM. A real blood sample was spiked with known amounts of Mb. The % recovery of the spiked amount of Mb was calculated. The results were compared with those obtained by the conventional approach.48 All results are presented in Table 3. No significant difference between the values at 95% confidence was noticed.
4. Conclusions
In this work, we aimed to develop paper-based potentiometric analytical devices that are trustworthy, durable, and affordable and are appropriate for mass production in the future for myoglobin determination. On a commonly used filter paper, an all-solid-state ISE for Mb and a reference Ag/AgCl electrode were successfully printed on the conductive paper. Biomimetic Mb tailored polymers were synthesized, characterized, and used as a sensory material based on host–guest interactions. To increase the number of imprinted sites, MWCNTs–COOH were used as the support biomaterial. The paper-based analytical device that was demonstrated had easy design, quick measurement times, high accuracy, high analytical throughput, low detection limit, and strong selectivity. The literature only mentions one potentiometric sensor for Mb.47 Yet the analytical performance of the presented sensor showed better detection limit, higher sensitivity, and lower production cost. Additionally, it offers portable testing equipment for point-of-care monitoring. Compared to other techniques for Mb detection, the only tests that were created were immunoassays. Although these techniques possess lower detection levels, but they are more expensive, take longer to establish a steady response, and may be difficult to replicate when utilizing substances with biological origins. The proposed paper-based analytical device is successfully applied to quickly quantify Mb in samples of synthetic serum. This approach can be modified to make more disposable, low-cost potentiometric sensing devices based on paper at large scales using high-speed paper printing technologies.Ethical statement
All experiments were performed in accordance with the guidelines “National research center (NRC), Dokki, Egypt”, and approved by the ethics committee at “NRC”. Informed consents were obtained from human participants of this study.Author contributions
The listed authors contributed to this work as follows: A. E. A. and A. H. K. provided the concepts of the work; A. A. A. and A. M. N interpreted the results. A. H. K., L. S. A. and M. G. A. performed the experimental part. A. H. K. and A. E. A. prepared the manuscript; A. H. K. performed the revision before submission; A. A. A. and A. M. N. obtained the financial support for the work. All authors have read and agreed to the published version of the manuscript.Conflicts of interest
The authors declare that there are no conflicts of interest.Acknowledgements
This research was funded by the Deputyship for Research & Innovation, Ministry of Education in Saudi Arabia through project no. (IFKSURC-1-0106). The authors extend their appreciation to the Deputyship for Research & Innovation, Ministry of Education in Saudi Arabia for funding this research. (IFKSURC-1-0106).References
- R. C. Hardison, Cold Spring Harbor Perspect. Med., 2012, 2, a011627 CrossRef PubMed.
- B. R. Berridge, J. F. van Vleet and E. Herman, Cardiac, Vascular, and Skeletal Muscle Systems, Haschek and Rousseaux's Handbook of Toxicologic Pathology, Elsevier, 2013, pp. 1567–1665 Search PubMed.
- T. Naka, D. Jones, I. Baldwin, N. Fealy, S. Bates, H. Goehl, S. Morgera, H. H. Neumayer and R. Bellomo, Crit. Care, 2005, 9, R90 CrossRef PubMed.
- M. Weber, M. Rau, K. Madlener, A. Elsaesser, D. Bankovic, V. Mitrovic and C. Hamm, Diagnostic utility of new immunoassays for the cardiac markers cTnI, myoglobin and CK-MB mass, Clin. Biochem., 2005, 38, 1027–1030 CrossRef CAS PubMed.
- A. Dasgupta and A. Wahed, Cardiac Markers, Clinical Chemistry, Immunology and Laboratory Quality Control, Elsevier, 2014, pp. 127–144 Search PubMed.
- WHO, World Health Organization, Health Topics, Cardiovascular Diseases, http://www.who.int/topics/cardiovasculardiseases/en/, accessed on April, 2011 Search PubMed.
- E. Akaboshi, Cloning of the human myoglobin gene, Gene, 1985, 33, 241–249 CrossRef CAS PubMed.
- J. E. Adams and V. A. Miracle, Am. J. Crit. Care., 1998, 6, 418 Search PubMed.
- M. Plebani and M. Zaninotto, Int. J. Clin. Lab. Res., 1999, 29, 56–63 CrossRef CAS PubMed.
- C. Montague and T. Kircher, Am. J. Clin. Pathol., 1995, 4, 472–476 CrossRef PubMed.
- N. S. K. Gunda and S. K. Mitra, Biomicrofluidics, 2010, 4, 014105 CrossRef PubMed.
- C. Jishun, R. Fengying, Q. Chen, L. Dan, M. Weidong, H. Tuo, W. Ceming and W. Congxia, RSC Adv., 2019, 9, 4463–4468 RSC.
- L. P. Ana Margarida, D. S. M. Ribeiro, S. S. M. Rodrigues, J. L. M. Santos, P. Sampaio and M. G. F. Sales, ACS Appl. Bio Mater., 2012, 4, 4224–4235 Search PubMed.
- M. V. Sullivan, W. J. Stockburn, P. C. Hawes, T. Mercer and S. M. Reddy, Nanotechnology, 2021, 32, 095502 CrossRef CAS PubMed.
- M. Dongwei, L. Dongkui, Z. Yanbo, Z. Guobao, X. Wei, Y. Yiwen, W. Hailong, Z. Jian, Z. Yunyun, Z. Zulei and L. Lei, Spectrochim. Acta, Part A, 2020, 2285, 117714 Search PubMed.
- C. Chen, M. Jin-Xin, W. Hu, L. Hui-Qiao, R. Shu-Wei, C. Jun-Tao and L. Yan-Ming, New J. Chem., 2022, 46, 17331–17337 RSC.
- Q. Yue and Z. Song, Microchem. J., 2006, 84, 10–13 CrossRef CAS.
- O. V. Gnedenko, Y. Mezentsev, A. A. Molnar, A. V. Lisitsa, A. Ivanov and A. I. Archakov, Anal. Chim. Acta, 2013, 759, 105–109 CrossRef CAS PubMed.
- B. Naveena, C. Faustman, N. Tatiyaborworntham, S. Yin, R. Ramanathan and R. Mancini, Food Chem., 2010, 122, 836–840 CrossRef CAS.
- N. Giaretta, A. M. Di Giuseppe, M. Lippert, A. Parente and A. Di Maro, Food Chem., 2013, 141, 1814–1820 CrossRef CAS PubMed.
- X. Zhang, X. Kong, W. Fan and X. Du, Langmuir, 2011, 27, 6504–6510 CrossRef CAS PubMed.
- S. Modi, V. P. Shedbalkar and D. V. Behere, Indian J. Biochem. Biophys., 1989, 26, 84–86 CAS.
- I. Dolak, R. Keçili, R. Onat, B. Ziyadanoğulları, A. Ersöz and R. Say, J. Mol. Struct., 2018, 1174, 171–176 CrossRef CAS.
- R. Keçili, Int. J. Anal. Chem., 2018, 2018, 1–9 Search PubMed.
- P. Karami, H. Bagheri, M. Johari-Ahar, H. Khoshsafar, F. Arduini and A. Afkhami, Talanta, 2019, 202, 111–122 CrossRef CAS PubMed.
- Z. Yang, H. Wang, X. Dong, H. Yan, C. Lei and Y. Luo, Anal. Methods, 2017, 9, 3636–3642 RSC.
- M. Adeel, M. Rahman and J.-J. Lee, Biosens. Bioelectron., 2019, 126, 143–150 CrossRef CAS PubMed.
- D. Sharma, J. Lee and H. Shin, Biosens. Bioelectron., 2018, 107, 10–16 CrossRef CAS PubMed.
- A. Al Fatease, M. Haque, A. Umar, S. G. Ansari, Y. Alhamhoom, A. Bin Muhsinah, M. H. Mahnashi, W. Guo and Z. A. Ansari, Molecules, 2021, 26, 4252 CrossRef CAS PubMed.
- L. Sun, W. Li, M. Wang, W. Ding and Y. Ji, Int. J. Electrochem. Sci., 2017, 12, 6170–6179 CrossRef CAS.
- N. Puri, S. K. Mishra, A. Niazi, A. K. Srivastava and R. Rajesh, J. Chem. Technol. Biotechnol., 2014, 90, 1699–1706 CrossRef.
- H. Y. Lee, J. S. Choi, P. Guruprasath, B.-H. Lee and Y. W. Cho, Anal. Sci., 2015, 31, 699–704 CrossRef CAS PubMed.
- Y. Wang, M. Han, X. Ye, K. Wu, T. Wu and C. Li, Microchim. Acta, 2017, 184, 195–202 CrossRef CAS.
- F. T. Moreira, R. A. Dutra, J. P. Noronha and M. G. F. Sales, Electrochim. Acta, 2013, 107, 481–487 CrossRef CAS.
- X. Wang, Z. You, H. Sha, Z. Sun and W. Sun, J. Solid State Electrochem., 2014, 18, 207–213 CrossRef CAS.
- A. H. Kamel and H. R. Galal, Int. J. Electrochem. Sci., 2014, 9, 4361–4373 Search PubMed.
- N. S. Abdalla, M. A. Youssef, H. Algarni, N. S. Awwad and A. H. Kamel, Molecules, 2019, 24, 712 CrossRef CAS PubMed.
- T. R. de Oliveira, W. T. Fonseca, G. de Oliveira Setti and R. C. Faria, Talanta, 2019, 195, 480–489 CrossRef CAS PubMed.
- L. A. Pradela-Filho, E. Noviana, D. A. G. Araújo, R. M. Takeuchi, A. L. Santos and C. S. Henry, ACS Sens., 2005, 5, 274–281 CrossRef PubMed.
- E. Noviana, C. P. McCord, K. M. Clark, I. Jang and C. S. Henry, Lab Chip, 2020, 20, 9–34 RSC.
- P. T. Trieu and N. Y. Lee, Anal. Chem., 2019, 91, 11013–11022 CrossRef CAS PubMed.
- Y. Zhang, J. Xu, S. Zhou, L. Zhu, X. Lv and J. Zhang, et al., Anal. Chem., 2020, 92, 3874–3881 CrossRef CAS PubMed.
- G. Dutta and P. B. Lillehoj, Sci. Rep., 2018, 8, 17129 CrossRef PubMed.
- F. Giavazzi, M. Salina, E. Ceccarello, A. Ilacqua, F. Damin and L. Sola, et al., Biosens. Bioelectron., 2014, 58, 395–402 CrossRef CAS PubMed.
- H. S. M. Abd-Rabboh, A. E. Amr, E. A. Elsayed, A. Y. A. Sayed and A. H. Kamel, RSC Adv., 2021, 11, 12227–12234 RSC.
- Y. Umezawa, P. Bühlmann, K. Umezawa, K. Tohda and S. Amemiya, Pure Appl. Chem., 2000, 72, 1851–2082 CrossRef CAS.
- F. T. C. Moreira, R. A. F. Dutra, J. P. C. Noronha and M. G. F. Sales, Biosens. Bioelectron., 2011, 26, 4760–4766 CrossRef CAS PubMed.
- C. C. Chernecky and B. J. Berger, Myoglobin – serum, in Laboratory Tests and Diagnostic Procedures, ed. C. C. Chernecky and B. J. Berger, Elsevier Saunders, St Louis, MO, 6th edn, 2013, pp. 808–809 Search PubMed.
| This journal is © The Royal Society of Chemistry 2023 |