
 Open Access Article
 This Open Access Article is licensed under a Creative Commons Attribution-Non Commercial 3.0 Unported Licence
Development of nanostructured formulation from naringenin and silk fibroin and application for inhibition of lipoxygenase (LOX)
Fabrício H. Holandaab,
Rayanne R. Pereirac,
Victor Hugo S. Marinhoa,
David E. Q. Jimeneza,
Lindalva M. M. Costa Ferreirad,
Roseane M. Ribeiro-Costad,
Francisco Fábio O. de Sousab and
Irlon M. Ferreira *ab
*ab
aLaboratório de Biocatálise e Síntese Orgânica Aplicada, Departamento de Ciências Exatas e Tecnológicas, Universidade Federal do Amapá, Rod. JK, km 02, 68902-280, Macapá, Amapá, Brazil. E-mail: irlon.ferreira@gmail.com
bPrograma de Pós-graduação em Inovação Farmacêuticas, Departamento de Ciências Biológicas e da Saúde, Universidade Federal do Amapá, Rod. JK, km 02, 68902-280, Macapá, Amapá, Brazil
cUniversidade Federal do Oeste do Pará, Instituto de Saúde Coletiva (Unidade Tapajós), 68035-110, Santarém, Pará, Brazil
dLaboratório de Planejamento e Desenvolvimento de Fármacos, Universidade Federal do Pará, Belém, PA, Brazil
First published on 31st July 2023
Abstract
A simple low-energy method was used to obtain polymeric nanoparticles containing silk fibroin (SF), fatty butyl esters (oily phase) and the flavonoid naringenin. Experimental planning (Box–Behnken) was applied to investigate the optimal conditions for three factors (variation of the concentrations of SF, naringenin and fatty butyl ester) at three levels, with evaluation of particle size, polydispersity index (PDI) and zeta potential (ZP) as responses. The results showed that the polymeric particle was formed with sizes of 179.6 to 633.9 nm, PDI of 0.33 to 0.77 and ZP of −60.4 to −38.8 mV. The best responses under the optimized conditions (Nari–SF 9 and 15) were characterized through transmission electron microscopy (TEM), Fourier-transform infrared (FT-IR), visible ultraviolet (UV-vis) and fluorescence, which confirmed that coated nanoparticles had been obtained. It was shown that the nanoformulation had excellent stability, the bioavailability of naringenin had been improved through use of the biopolymer and high inhibition of the enzyme lipoxygenase had been achieved in vitro.
1 Introduction
Over recent years, biopolymers have gained prominence in research through presenting advantageous alternatives to synthetic polymers.1 Among the biopolymers most studied, silk fibroin (SF) stands out. This is a protein that can also be extracted from the cocoon of Bombyx mori, among other insect species. Currently, there is interest in the use of SF for production of biomaterials used in different fields of knowledge,2–5 especially medicine and pharmaceuticals, for development of promising formulations that can act as carriers of substrates with low solubility in aqueous systems.6–8SF has already been seen to have several advantages, such as high biocompatibility, capacity for self-assembly, resistance to thermal and microbial degradation, lack of toxicity in both in vitro and in vivo models, facilitation of drug carriage through sustained release and action as a surfactant for elaboration of nanostructured formulations.9,10 The molecular characteristics of SF include a diameter of about 10 to 25 mm and presence of three structural proteins and a glycoprotein (P25) with amphiphilic nature. Its hydrophobic region is responsible for creating a β-antiparallel crystalline structure.11,12
These characteristics have shown silk fibroin to be an emerging subject for studies on drug delivery.11,12
Different methods for obtaining nanostructured formulations from silk fibroin solution have been developed.13,14 These have included the following: (A) direct mixture, in which nanoparticles (NPs) are added to the protein solution. There is a tendency to aggregation, and the solution needs to undergo mechanical agitation or ultrasonic dispersion in order to achieve uniform distribution of NPs, films, nanofibers, scaffolds or hydrogels may be formed;15 (B) in situ synthesis. This is another method commonly used for formation of NPs using SF, which is used as “molds” for NP synthesis. SF is placed in the solution containing the substrate of interest and formation of NPs is achieved through the high intrinsic reducing capacity of the SF material, thus grafting or coating functional groups to the material; (C) the recently developed method of feeding silkworm. This method is less commonly used, and it consists of obtaining natural fibers composed of SF-NPs through directly feeding the animals with feed containing nanomaterials such as metallic or carbon-based NPs.16
Naringenin (2,3-di-hydro-5,7-dihydroxy-2-(4-hydroxyphenyl)-4H-1-benzopyran-4-one) is one of the flavonoids with greatest natural occurrence. It can be found mainly in citrus fruits, tomatoes and figs.17 Naringenin has benefits for human health, like other polyphenols, through antioxidant and anti-inflammatory action,18 and it acts towards modulation of the transcription factor NF-kB.19 In addition, naringenin is able to regulate several cell signalling pathways that are directly involved in the pathogenesis of obesity and metabolic syndrome,20 through anti-LDL cholesterol, antidiabetic,21 anticancer,22 promising anti-SARS-COV-22 (ref. 23) and hepatoprotective activity.24 This flavonoid has been the subject of extensive studies aimed at development of nanostructured pharmaceutical formulations for investigation of biological activity.25–27
In this context, lipoxygenase (LOX) is a versatile enzyme involved in synthesis of eicosanoids via metabolism of arachidonic acid (AA). This especially generates leukotrienes,28 which are involved in various stages of the inflammatory response, such as chemotaxis, vasoconstriction, bronchospasm and increased vascular permeability.29 Thus, it is highly important to develop and refine drugs or formulations with the capacity to inhibit LOX, particularly from natural products with low toxicity and high viability.
Therefore, a nanostructured formulation from silk fibroin and alkyl butyl esters (in the oily phase) containing the flavonoid naringenin was developed through a new methodology, with factor planning and application in anti-LOX activity. This was shown to have great pharmacological potential.
2 Materials and methods
2.1 Solvents and reagents
Naringenin (98%) was purchased from Sigma-Aldrich (São Paulo, Brazil). The other reagents, i.e. sodium carbonate (99.5%) and calcium chloride (99%), were purchased from Vetec® and Alphatec®, respectively. The solvents ethanol (99%), isopropyl (99.5%) and dimethylsulfoxide (98%) were acquired from Quimex®. Silkworm cocoons were acquired from Bratac, Brazil.2.2 Preparation of the silk fibroin solution
The silk fibroin solution was prepared based on the method developed by Ferreira et al. 2014.30,31 Silkworm cocoon material (3.0 g) was degummed in a boiling with 500 mL of a Na2CO3 solution (2% w/v) for 30 min, to remove sericin. The resultant fibers were filtered and washed with distilled water (3 × 500 mL), and dried at room temperature. The silk fibers were then dissolved in a ternary solution (50 mL) of H2O![[thin space (1/6-em)]](https://www.rsc.org/images/entities/char_2009.gif) :EtOH:CaCl2 (8:2:1 molar proportions) at 85 °C, until total dissolution. This mixture was then dialyzed (cellulose tube with an exclusion limit of 16 kDa, from Viskase, Brazil) for 3 days at room temperature, and the water was changed every 24 hours. The fibroin solution was centrifuged (6000 rpm for 10 min) to remove impurities and larger particles. The concentration of the silk fibroin solution was adjusted to 2% (w/v).
:EtOH:CaCl2 (8:2:1 molar proportions) at 85 °C, until total dissolution. This mixture was then dialyzed (cellulose tube with an exclusion limit of 16 kDa, from Viskase, Brazil) for 3 days at room temperature, and the water was changed every 24 hours. The fibroin solution was centrifuged (6000 rpm for 10 min) to remove impurities and larger particles. The concentration of the silk fibroin solution was adjusted to 2% (w/v).
2.3 Preparation of Nari–SF nanostructure formulation
The nanostructured nanoformulation was prepared as follows. A naringenin stock solution (50 mg mL−1) in DMSO was firstly prepared. Next, 50 μL mL−1 of a 1:1 mixture of alcohols (isopropyl:ethanol) was added to the naringenin solution at the desired concentration, followed by vortex agitation (5 min). In the next step, the silk fibroin solution was added, followed by vortex agitation (5 min). Fatty acid butyl ester (FABE) was then added at the concentrations determined, followed by vortex agitation up to 5 min. The procedure was completed through magnetic agitation of the formulations for 30 min, and then water was injected until the planned volume had been completed (Fig. 1).
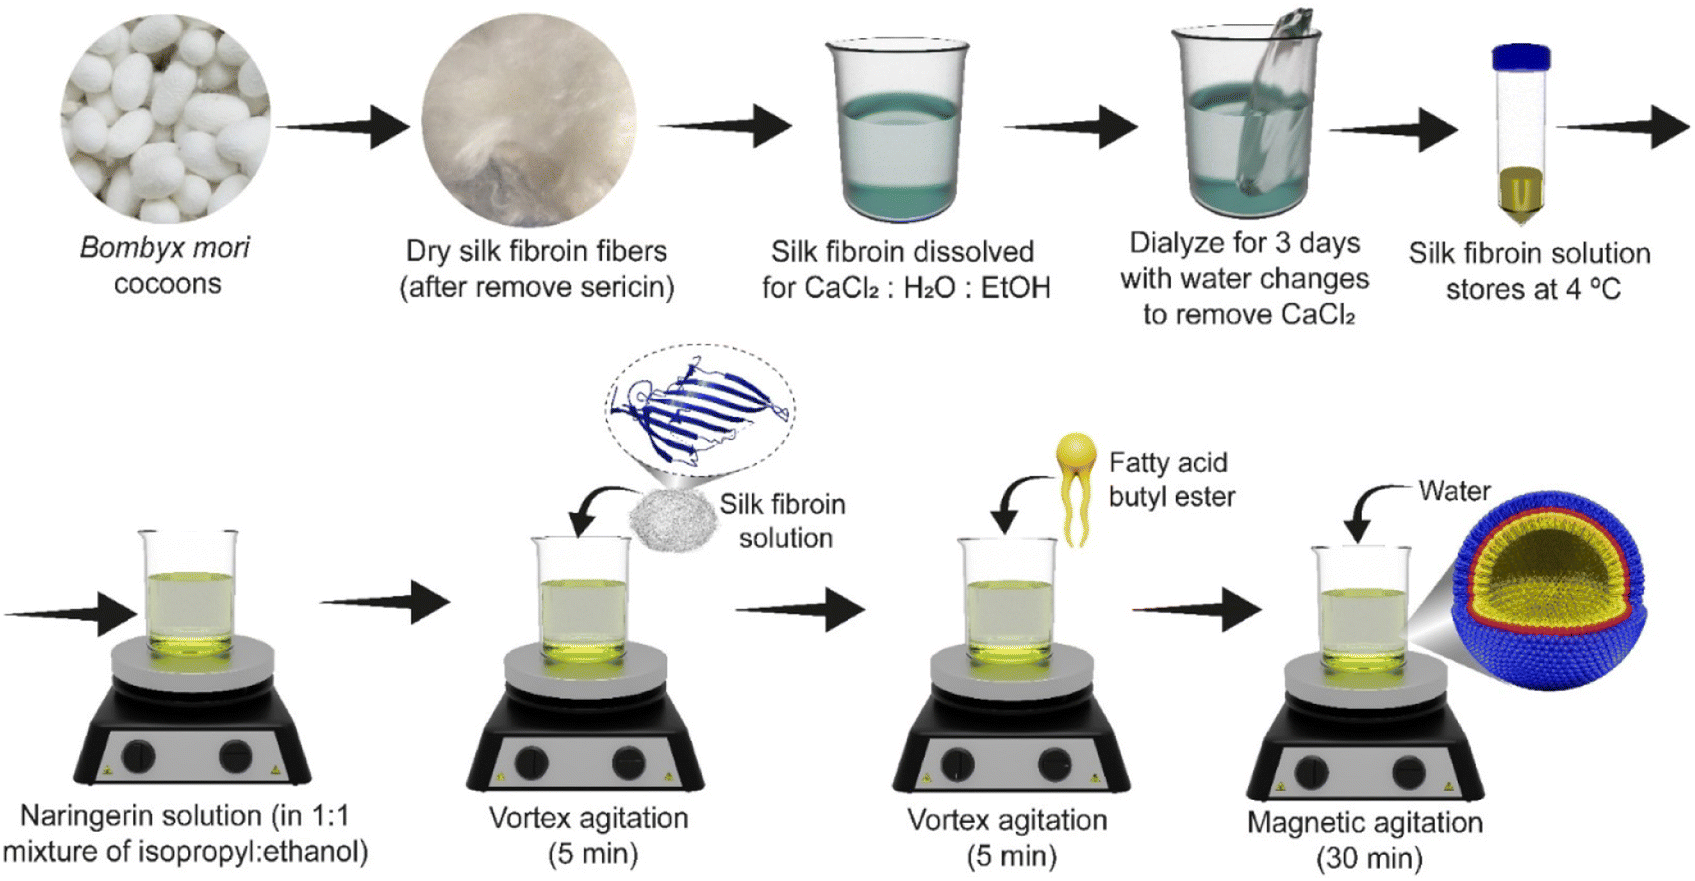 | ||
| Fig. 1 Preparation of naringenin–silk fibroin nanoformulation. | ||
2.4 Experimental design
A three-level three-factor Box–Behnken design (BBD) was applied for optimization of the Nari–SF production process, using the statistical package Design-Expert® Software (version 11, Stat-Ease Inc., Minneapolis, MN, USA). For this purpose, we selected three input factors or critical process parameters (CPPs), namely: the naringenin concentration (mg mL−1), the ester concentration (extracted from Brazil nut oil) and the silk fibroin concentration in its solution (%). These input factors were set at three levels, i.e. low, middle and high values, indicated conventionally as −1, 0 and +1, respectively. The design included five repetitions of the central point, and thus consisted of a total of 15 experiments.32,33 The responses measured, which were named the critical quality attributes (CQAs), were the particle size (Y1), polydispersity index (PDI) (Y2) and zeta potential (ZP) (Y3) (Table 1).| Factors | Levels | ||
|---|---|---|---|
| −1 | 0 | +1 | |
| Naringenin concentration (mg mL−1, X1) | 0.5 | 1.0 | 1.5 |
| Silk fibroin solution (% w/v, X2) | 5.0 | 5.5 | 6.0 |
| FABE concentration (g mL−1, X3) | 0.01 | 0.02 | 0.03 |
For each CQA, the influence of the input factors and their interactions in the responses could be described through the following nonlinear quadratic model generated by the design:
| Y = β0 + β1x1 + β2x2 + β3x3 + β11x12 + β22x22 + β33x32 + β12x1x2 + β13x1x3 + β23x2x3 | (1) |
2.5 Particle size and polydispersity index (PDI)
The Nari–SF solution was characterized through dynamic light scattering using a Zetasizer Nano ZS (Malvern Panalytical, Malvern, UK), by applying noninvasive back-scatter (scattering angle 173°) at a temperature of 25 °C. The Nari–SF solution was diluted (1:100) with ultrapure water before measurements were made. The average particle size (Z-average) and polydispersity index (PDI) obtained through cumulative analysis on the scattering data in the instrument software were measured in triplicate, and the results were expressed as means and standard deviations.34,35
2.6 Zeta potential
The zeta potential, which represented the surface electrostatic charge on the particles, was determined in terms of electrophoretic mobility (Zetasizer Nano ZS, Malvern Panalytical, Malvern, UK). The samples were diluted in NaCl at 10 mM (1:500). The Helmholtz–Smoluchowski equation was used to calculate the zeta potential, through the instrument software.34,35
2.7 Determination of pH
A digital pH meter (pH Pro LineLab®) was used to measure the pH of the nanoemulsions. All the measurements were carried out at room temperature (28 °C), in triplicate, and were expressed as means and standard deviations (mean ± SD).2.8 Determination of entrapment efficiency (EE)
The EE% of the Nari–SF solution was determined based on the free (unencapsulated) naringenin content in the dispersion medium, as described by Pinto et al. (2018),36 with some adaptations. Hexane (2 mL) was added to an aliquot (2 mL) of the formulation and this mixture was magnetically stirred at 150 rpm for 15 min, and then centrifuged at 3000 rpm for 10 min. The supernatant was collected and evaporated under low pressure to remove the solvent. The naringenin residue was resuspended in 2 mL of ethanol and quantified, as described by Vale et al. (2022)37 in a visible ultraviolet (UV-vis) spectrometer (PerkinElmer®) at the wavelength 290 nm, using the following calibration curve: y = 0.4971x + 0.3036 (R2 = 0.9975). The EE% was calculated from the following equation:where MEnc is the real content of bixin in the nanoparticles; and M0 is the theoretical amount of bixin in the formulation (theoretical load).
2.9 Nanoparticle morphology
Transmission electron microscopy (TEM) analysis on the Nari–SF (naringenin–silk fibroin nanoformulation) produced was carried out using a JEM 400-FS microscope (JEOL Ltd., Tokyo, Japan), operated at 80 kV. For sample preparation, a drop of the suspension was deposited on formvar/carbon-coated copper grids (300 mesh, Electron Microscopy Sciences, Holfield, PA, USA). After 60 s, the excess was gently dried with filter paper and the grid was stained using a drop of 2% w/v of uranyl acetate solution (Sigma Aldrich, St. Louis, MO, USA) for 120 s. The staining solution was gently eliminated with filter paper and the grid was rapidly dipped in particle-free ultrapure water to further eliminate loosely bound material and excess staining. The images were processed using the Digital Micrograph software (Gatan Inc., Pleasanton, CA, USA).2.10 In vitro drug release
In vitro release of Nari–SF was performed using the dialysis bag method, with modifications.38 The experiment was performed at 37 °C using phosphate buffer (pH 7.4) as the release medium. The dialysis bag (MWCO 12000 to 14000 Da, Sigma-Aldrich, St. Louis, MO, USA) containing 2 mL of the Nari–SF 9 and Nari–SF 15 samples was placed in contact with 100 mL of release medium, thus ensuring sinking conditions, under moderate magnetic stirring. 2 mL of the release medium was removed and replaced with the same volume of fresh medium at predetermined times (0, 1, 2, 3, 4, 5, 6, 7, 8 and 24 h) for analysis. The concentrations of the released naringenin from the samples were obtained at 311 nm using a spectrophotometer (PerkinElmer Lambda 35 UV-Vis, Canada). The data were analysed using mathematical modelling (KinetDS software, version 3.0, Krakow, Poland) in order to gain a better understanding of the ester release behaviour of the nanoparticles. The model that best described the release profile was selected based on the correlation coefficient (r).
2.11 Stability test
The nanostructure formulations (entries 9 and 15, Table 2) were evaluated over a 28 day period under two different conditions (32 ± 2 °C and 5 ± 2 °C) to determine the most favourable and the best storage conditions. At pre-established times (0, 7, 15 and 30 days), the formulations were evaluated in terms of particle size, PDI, zeta potential and pH. They were also evaluated at 40 ± 2 °C for 48 h to assess their behaviour under heat stress: for example, under heating from exposure to sunlight.| Experiment | Naringenin (mg mL−1) | Silk fibroin (%) | FABE (g mL−1) | Size (nm) | PDIa | Zeta potential (mV) |
|---|---|---|---|---|---|---|
| a Polydispersity index (PDI ≤ 0.1 highly monodisperse particles; 0.1–0.4 slightly polydisperse; ≥0.4 highly polydisperse samples).b Experiments 9 and 15 were selected for the next study, regarding encapsulation efficiency, sustained release rate, transmission microscopy, stability test, infrared and fluorescence evaluations and inhibition of lipoxygenase (LOX) enzyme. | ||||||
| 1 | 1.5 | 6.0 | 0.02 | 448.8 ± 27.9 | 0.7 ± 0.1 | −44.0 ± 0.4 |
| 2 | 1.0 | 6.0 | 0.03 | 387.6 ± 17.2 | 0.6 ± 0.1 | −55.9 ± 3.1 |
| 3 | 1.0 | 5.5 | 0.02 | 261.2 ± 5.8 | 0.5 ± 0.1 | −40.1 ± 0.7 |
| 4 | 0.5 | 5.5 | 0.03 | 319.4 ± 9.9 | 0.7 ± 0.0 | −41.9 ± 0.7 |
| 5 | 1.0 | 5.0 | 0.01 | 237.3 ± 15.8 | 0.4 ± 0.0 | −40.8 ± 1.2 |
| 6 | 0.5 | 5.0 | 0.02 | 323.0 ± 29.1 | 0.6 ± 0.1 | −60.4 ± 2.6 |
| 7 | 1.5 | 5.5 | 0.01 | 269.4 ± 18.8 | 0.4 ± 0.0 | −36.5 ± 1.0 |
| 8 | 1.0 | 5.0 | 0.03 | 498.3 ± 21.3 | 0.8 ± 0.1 | −47.8 ± 0.3 |
| 9b | 1.5 | 5.5 | 0.03 | 179.6 ± 4.5 | 0.3 ± 0.0 | −43.3 ± 0.7 |
| 10 | 1.5 | 5.0 | 0.02 | 519.3 ± 47.6 | 0.7 ± 0.1 | −47.3 ± 1.4 |
| 11 | 0.5 | 5.5 | 0.01 | 431.4 ± 30.1 | 0.6 ± 0.1 | −43.1 ± 1.2 |
| 12 | 1.0 | 5.5 | 0.01 | 327.3 ± 30.3 | 0.5 ± 0.0 | −38.8 ± 0.9 |
| 13 | 1.0 | 5.5 | 0.02 | 244.0 ± 31.9 | 0.4 ± 0.1 | −41.2 ± 0.8 |
| 14 | 0.5 | 6.0 | 0.02 | 633.9 ± 27.1 | 0.8 ± 0.1 | −41.5 ± 0.9 |
| 15b | 1.0 | 5.5 | 0.02 | 226.4 ± 9.2 | 0.4 ± 0.0 | −42.0 ± 0.7 |
2.12 Infrared spectroscopy analysis
Fourier-transform infrared (FT-IR) spectra of oils and esters were obtained using a spectrometer (Spectrum Two FT, PerkinElmer Inc., Waltham, MA, USA) with a diamond-attenuated total reflectance (ATR) accessory and deuterated triglycine sulphate (DTGS) detector. This had a spectral range from 350 to 4000 cm−1, with a resolution of 0.5 cm−1.2.13 Fluorescence analysis
The fluorescence spectrum of each sample was obtained using a fluorescence spectrophotometer (F-7000 Fluorescence Spectrophotometer; Hitachi). Nari–SF solution at different concentrations of naringenin (0.25, 0.5, 1.0 and 1.5 mg mL−1) and SF solution were placed in a quartz cuvette with path length of 1 cm. The fluorescence was recorded over an excitation wavelength range of 300–500 nm. Excitation of the sample was carried out using a 310 nm diode laser as a light source. The photomultiplier voltage was 400 V. The entire experiment was conducted at the ambient temperature, i.e. 25 ± 1 °C.392.14 Lipoxygenase inhibition test
The lipoxygenase inhibition activity was assessed in accordance with the method used by Ksiksi et al.,40 with some adaptations. Briefly, a mixture of sodium borate buffer (1 mL, 0.1 M, pH 8.8), lipoxygenase soybean (10 μL, final concentration 8.000 U mL−1) and test substances [Nari–SF 9 (1.5 mg mL−1) and Nari–SF 15 (1.0 mg mL−1)] (10 μL) was incubated in a 1 mL cuvette at room temperature for 15 minutes. The reaction was started by adding linoleic acid substrate (10 μL, 51 mM). Absence of the resulting mixture was assessed at 234 nm (PerkinElmer Lambda 35, Brazil) over a three-minute period (three times). LOX inhibition was assessed using the following equation:where A1 and A2 represent the absorbance in the absence and presence of sample, respectively.
2.15 Statistical analysis
The data were expressed as means ± standard error of the mean (SEM). One-way analysis of variance (ANOVA) was used, followed by Tukey's post hoc method. Statistical calculation was done using the software GraphPad Prism 9, Statistic Release 7 and Design Expert 13. Statistical significance was taken to be indicated when p ≤ 0.05.3 Results and discussion
3.1 Naringenin–silk fibroin nanoformulation (Nari–SF)
Drug delivery mechanisms not only protect and/or stabilize the active biocompound but also help in the therapeutic response at low frequencies of administration and in reducing the toxicity levels.41,42 In this regard, the silk protein extracted from the silkworm cocoon (Bombyx mori) stands out through promoting substitution or reduction of the use of synthetic surfactant agents.41 Moreover, it increases the bioavailability of naringenin in the medium, reduces toxic effects, is biodegradable, has low cost and has an easy handling process.43In this study, we used fatty acid butyl esters (FABE) as an oily phase, obtained through the transesterification reaction of triglycerides from Brazil nut oil. According to Marinho et al. 2022,13 FABE obtained from Astrocaryum murumuru Mart. improves the physical–chemical properties and stability of the nanostructure from silk fibroin, in relation to temperature and storage time, compared with ethyl or propyl esters.
3.2 Experimental design
A Box–Behnken design (BBD) was applied to evaluate the interactions and the quadratic effects of formulation parameters selected at different levels for three responses: particle size (nm), polydispersity index and zeta potential (mV). Table 2 summarizes the experimental results from the Box–Behnken project. A BBD is a model that as closely as possible describes the effects of factors and their levels on the critical attributes of a product.32The significance of the regression coefficients was evaluated through their p value (<0.05) calculated by means of ANOVA. P-values less than 0.05 were considered to be an indication of significant factor contribution. The model fit was evaluated by using the coefficient of determination (R2).
Experimental planning (EP) is an important statistical tool for development and evaluation of the parameters and quality of pharmaceutical formulations. It has been used for various types of formulation, such as tablets, sprays, syrups, ointments and others.38 Recent studies have shown the research efficiency of EP with regard to innovative discoveries, better factor conditions and achievement of novel results for nanostructured systems.44 Nevertheless, formulations containing silk fibroin remain little evaluated through application of this statistical method.
All nanoformulations obtained through combinations of different concentrations of SF, naringenin and FABE were found to have a homogeneous milky appearance, without the presence of precipitates, and were found to be relatively uniform and perennial.
According to the analyses, the particle size ranged from 633.9 nm (experiment 14) to 179.6 nm (experiment 9), PDI from 0.33 (experiment 9) to 0.77 (experiment 14) and ZP from −60.4 (experiment 6) to −36.5 (experiment 7). The results were analyzed taking into account the crossing of the levels used in each experiment (Table 1).
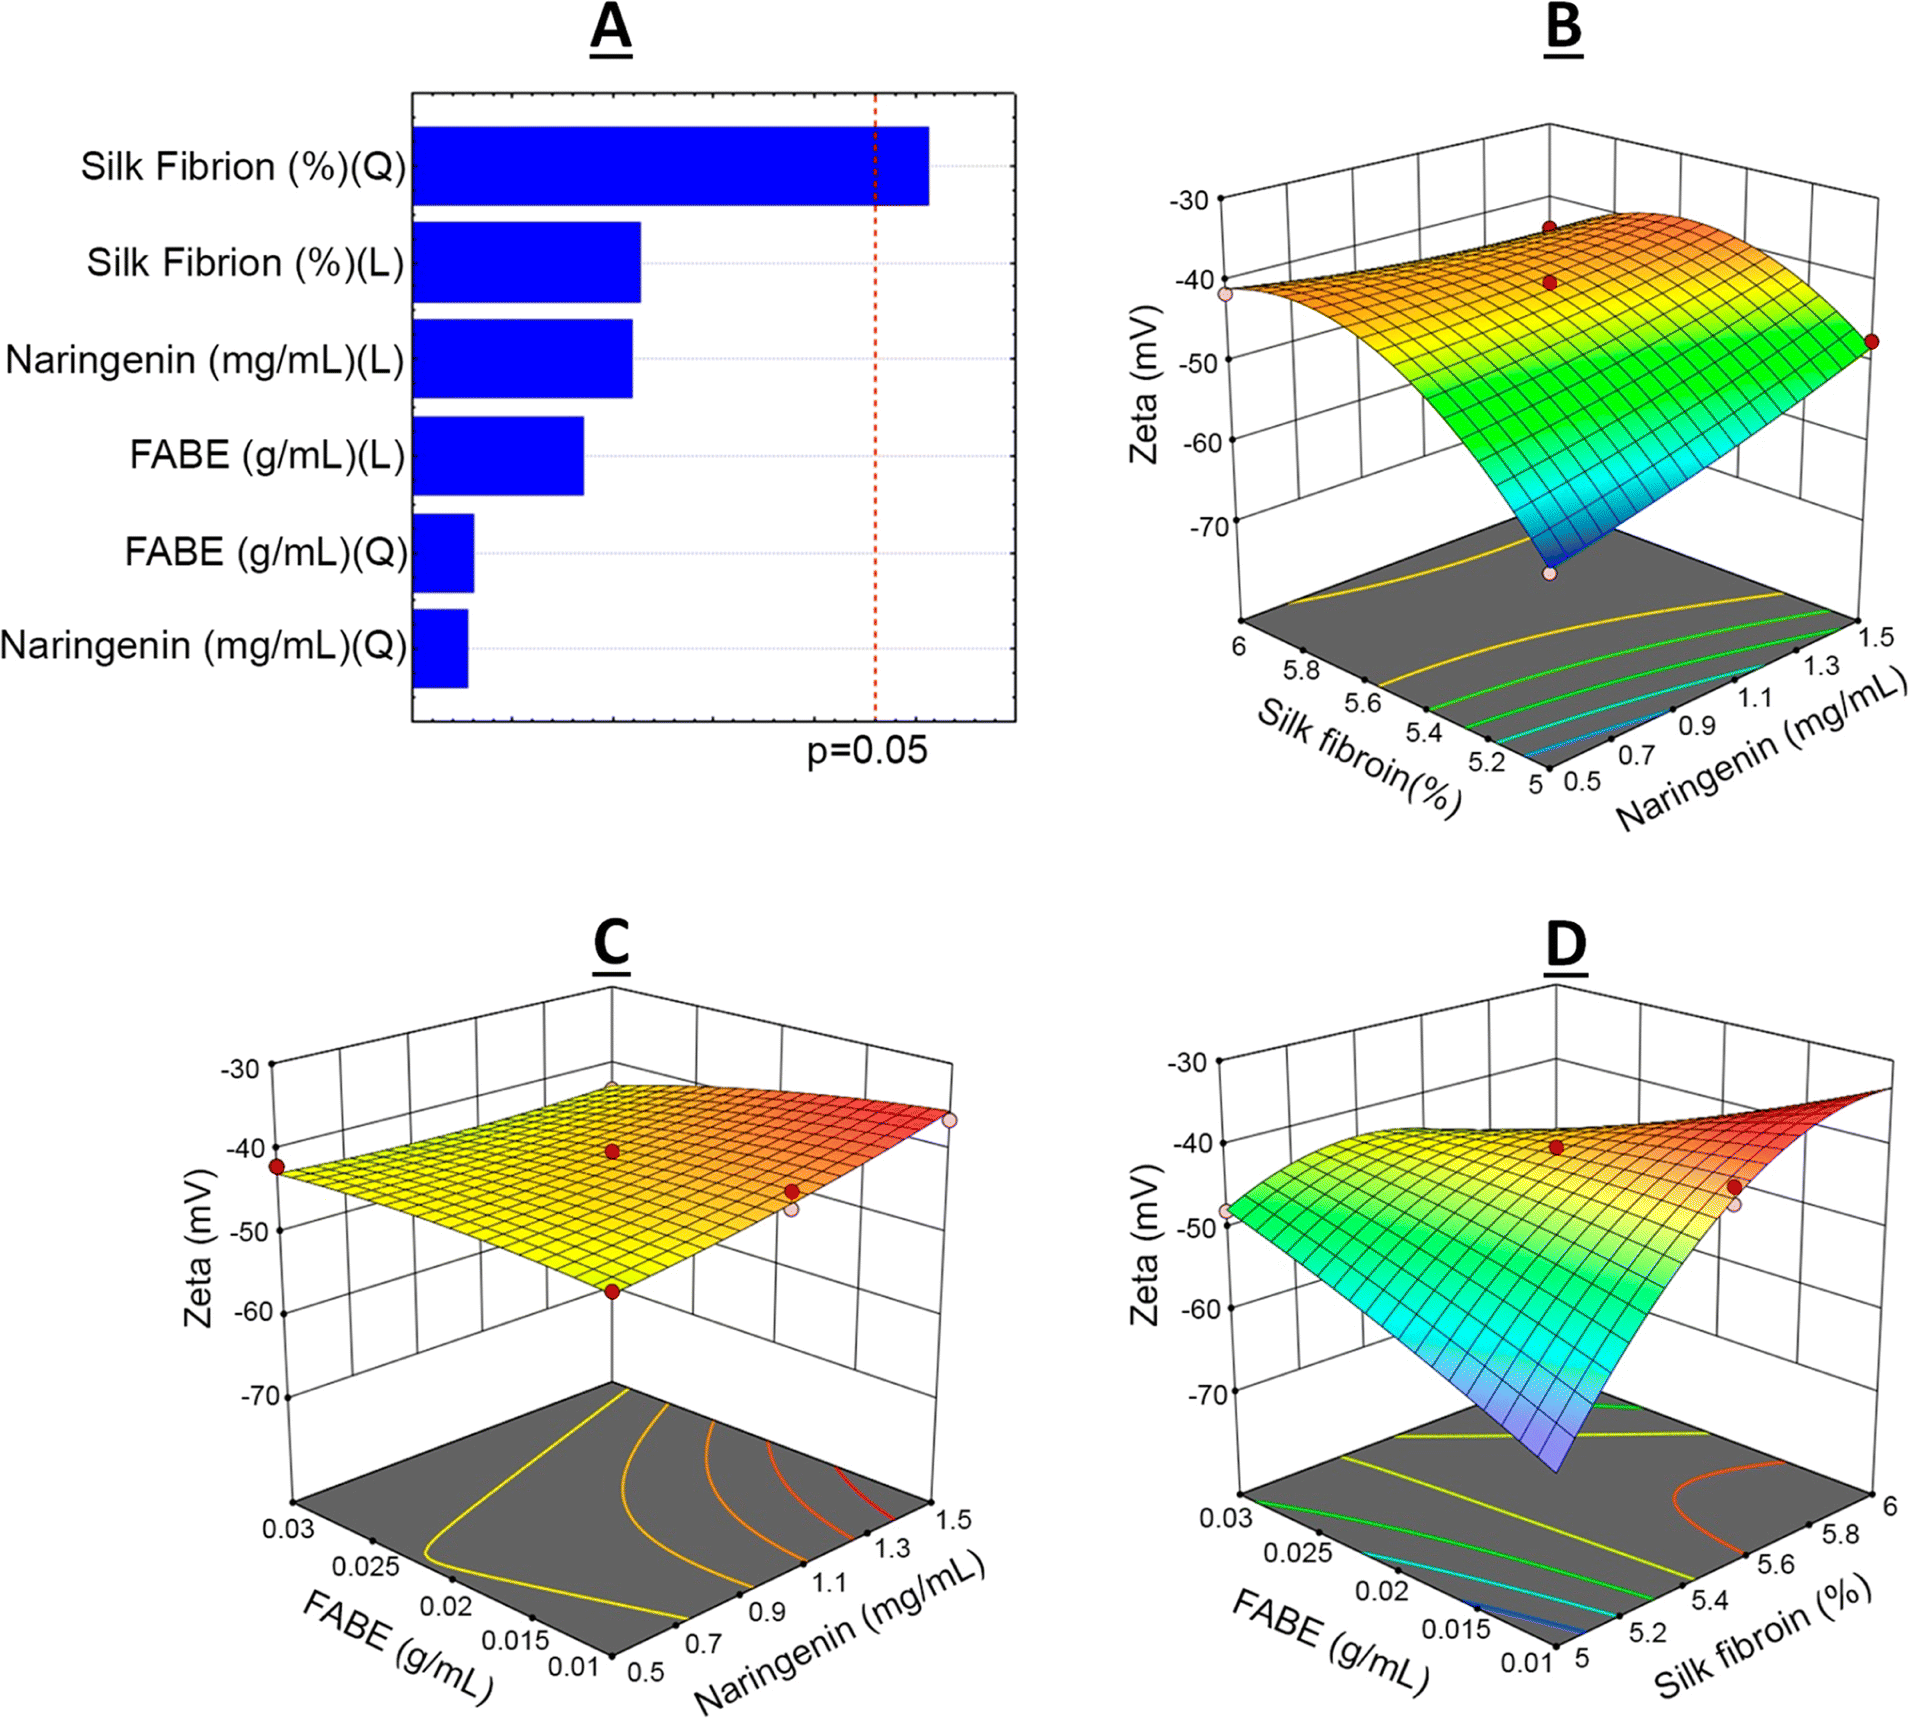
From the BBD quadratic polynomial model, a Pareto graph and response surface could be generated for all variables, with the aim of understanding the factor–response relationship and optimal conditions.45 The vertical line of the Pareto graph represents the boundary between significant and non-significant effects with 5% error risk.33 The silk fibroin was the factor that had the most significant influence on the 95% confidence level in the experimental model studied (Fig. 2–4).
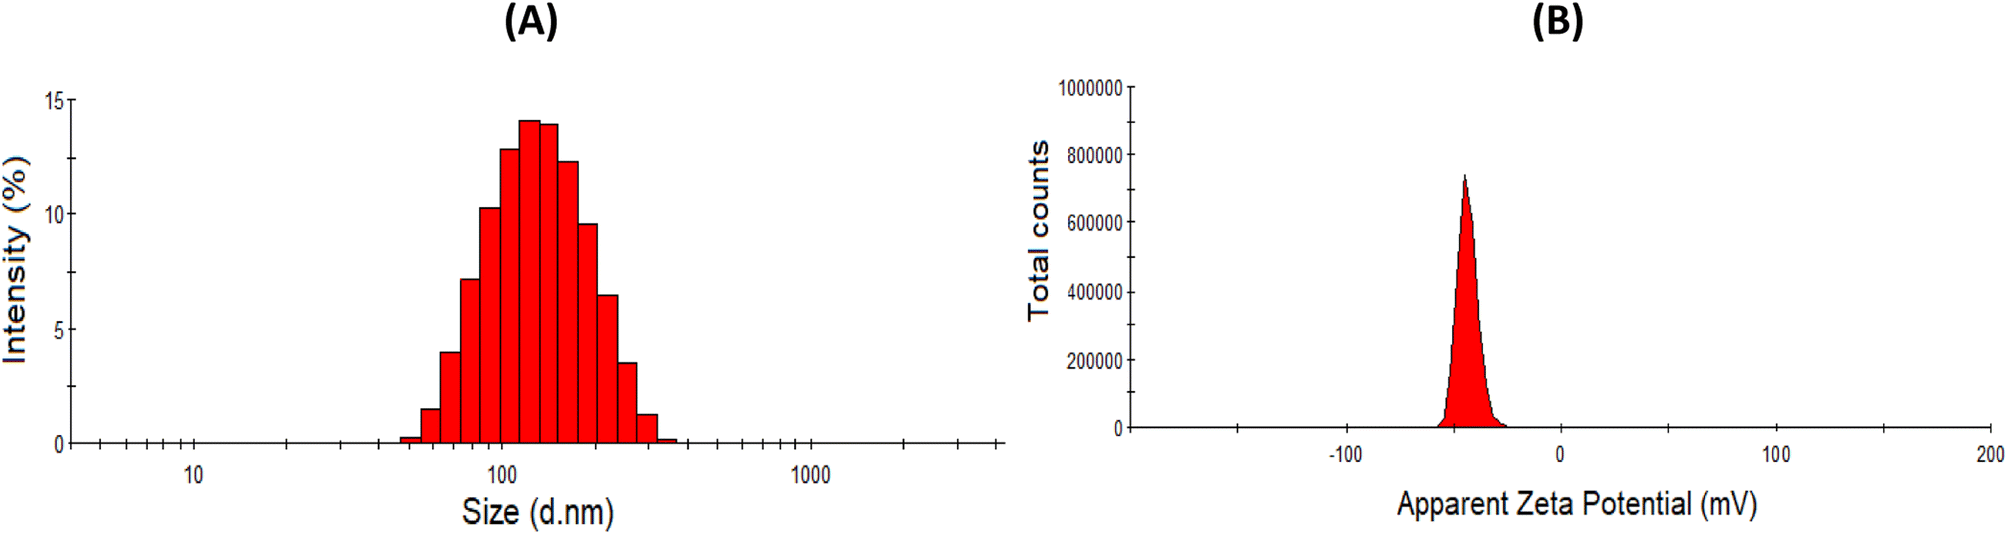 | ||
| Fig. 2 Particle size distribution (A) and zeta potential (B) of Nari–SF 15 (Table 2, experiment 15). | ||
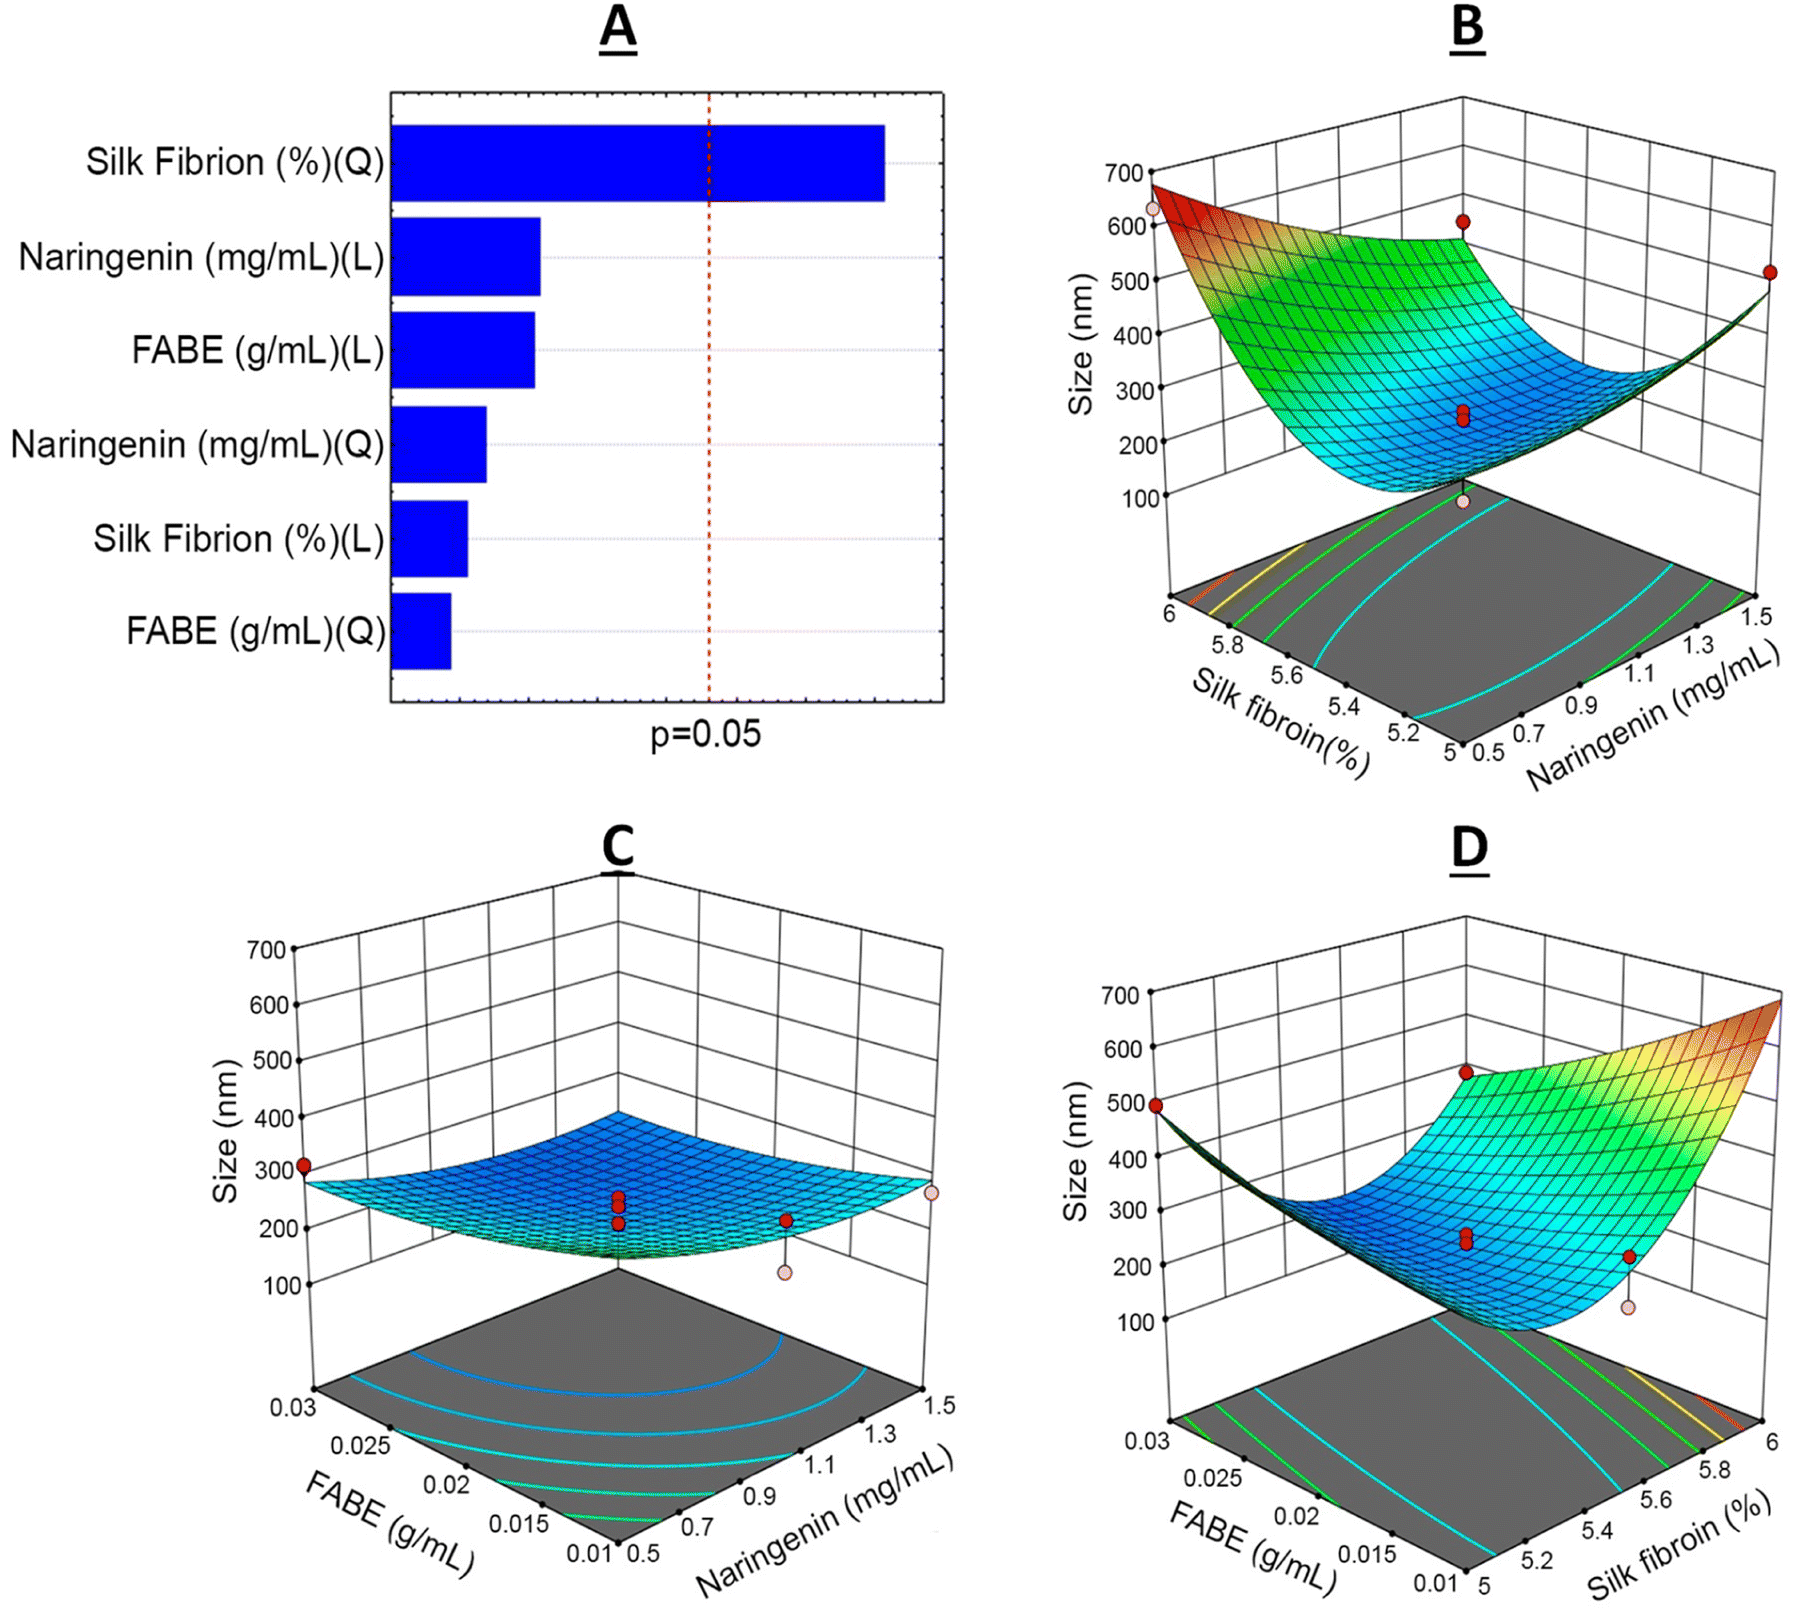 | ||
| Fig. 3 Particle size response. Pareto plot (A) and three-dimensional response surface plots showing the effects of (B) the concentrations of naringenin and silk fibroin, (C) the concentrations of naringenin and ester (FABE) and (D) the concentrations of silk fibroin and ester (FABE). | ||
The coefficient of determination was R2 = 0.9211 for the particle size analysis. This indicated that 17.16% of the total variation was not explained by the model.
The smallest particle sizes were obtained in experiments 9 and 15, with sizes of 179.6 ± 4.50 nm and 226.4 ± 9.23 nm, respectively. The levels used in these experiments revealed that the smallest particles obtained through the experimental planning were found through combining naringenin concentration at 1.5 mg mL−1 (+1), fibroin solution at 5.5% (0) and FABE at 0.03 g mL−1 (+1) (Table 2). It is worth mentioning that higher or lower values of the fibroin content resulted in an increase in particle size to 633.9 nm, but this remained classified on the nanoparticle scale.46
According to the PDI values (Fig. 4) generated through factor planning, the coefficient of determination was R2 = 0.8565. This indicated that 17.52% of the total variation was not explained by the model. The best responses obtained again dame from experiments 9 (0.33 ± 0.01) and 15 (0.36 ± 0.04), under the same experimental conditions as presented above. The PDI values obtained in the experimental planning ranged from 0.33 to 0.77, thus demonstrating the homogeneity of the nanoparticles in the system. It should be noted that good nanostructured polydispersion depends on PDI values > 0.4.14,46 Increased silk fibroin content and diminished naringenin concentration both gave rise to substantial increases in PDI. Correlation of SF concentrations with lower concentrations of the active agent (0.5 mg mL−1) was unfavorable for polydispersion. This could be explained by an excess of SF in the aqueous system, thereby leading to formation of micelles.
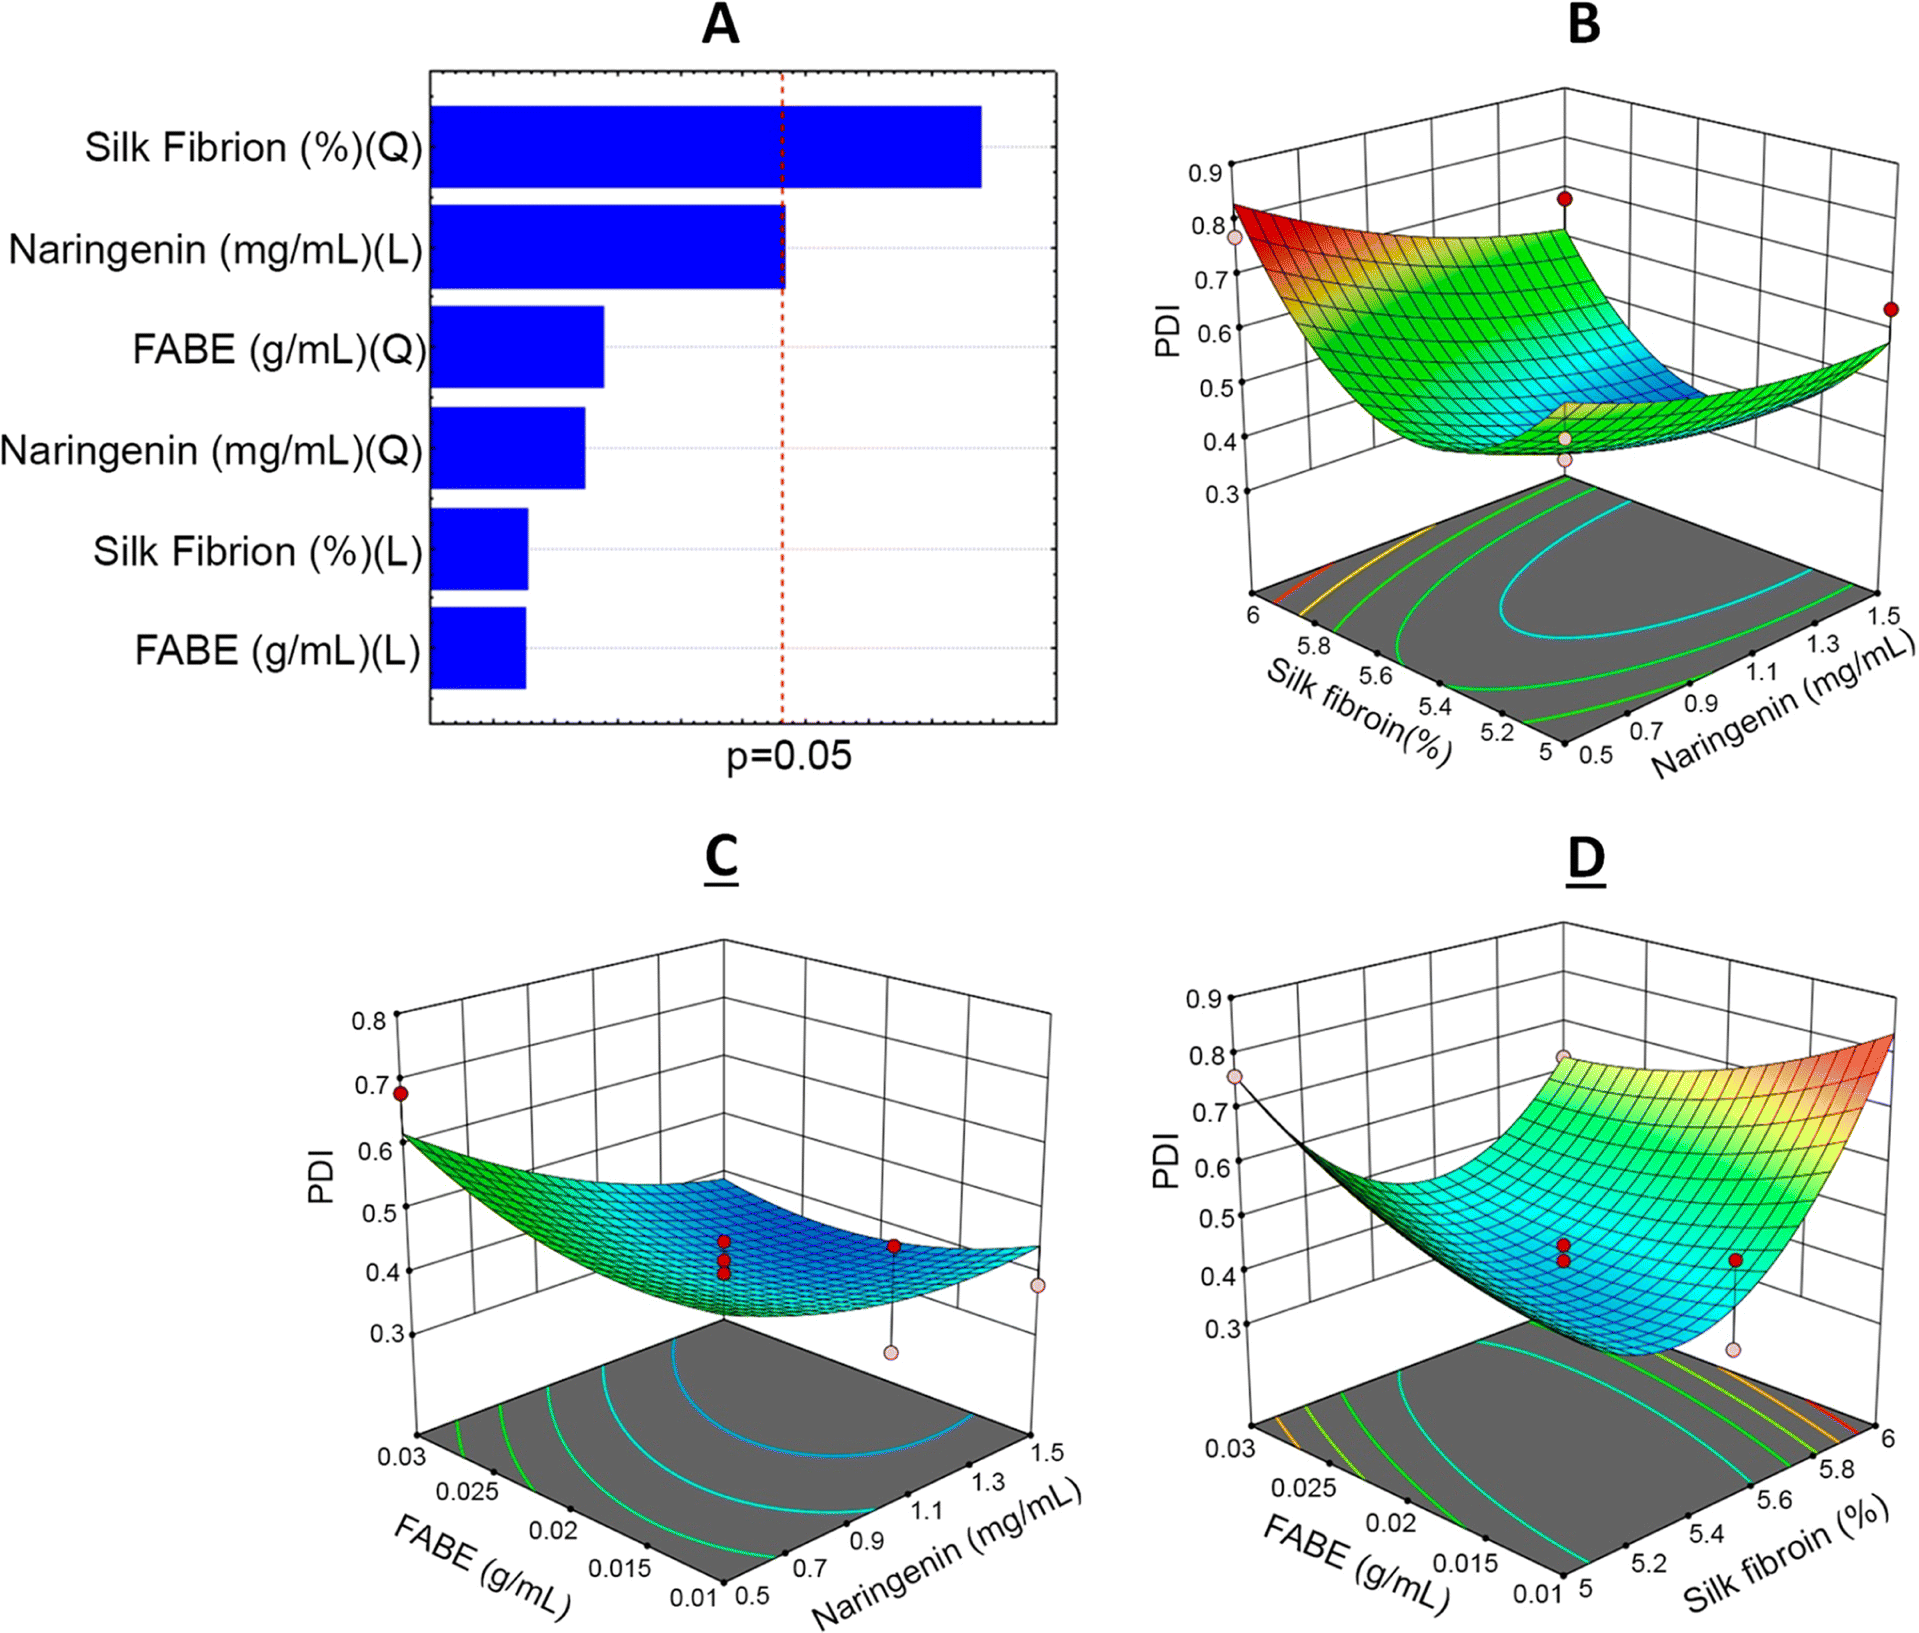 | ||
| Fig. 4 PDI response. Pareto plot (A) and three-dimensional response surface plots showing the effects of (B) the concentrations of naringenin and silk fibroin, (C) the concentrations of naringenin and ester (FABE) and (D) the concentrations of silk fibroin and ester (FABE). | ||
Lastly, the zeta potential (ZP) presented a coefficient of determination of R2 = 0.9855, which indicated that only 2.89% of the total variation was not explained by the model (Fig. 5). The best results were from experiments 7 (−36.5 ± 1.04 mV) and 12 (−38.8 ± 0.87 mV), in which the experimental conditions were expressed as the variables of naringenin = 1.5 mg mL−1 (+1), silk fibroin solution = 5.5% (0) and FABE = 0.01 g mL−1 (−1). However, experiments 9 and 15, which were selected in the factor planning, also presented excellent ZP results: −43.3 ± 0.68 and −42.0 ± 0.68.
 | ||
| Fig. 5 Zeta potential response. Pareto plot (A) and three-dimensional response surface plots showing the effects of (B) the concentrations of naringenin and silk fibroin, (C) the concentrations of naringenin and ester (FABE) and (D) the concentrations of silk fibroin and ester (FABE). | ||
ZP is an important parameter for properly assessing and characterizing a colloidal system. The stability of nanostructured systems can be classified through ZP evaluation as highly stable (±0–10 mV), relatively stable (±10–20 mV), moderately stable (±20–30 mV) or again as highly stable (±30 mV). However, elucidation of the stability of a nanoformulation also depends on assessing other parameters.47
The Nari–SF nanoformulations showed ZP ranging from −60.4 to −36.5 mV in the experimental planning. This variation was due to the different concentrations of silk fibroin used, such that reduction of the SF concentration led to a greater negative value for ZP. According to the literature, ZP values that correlated with SF solutions or nanostructured form ranged from −47 to −17 m.43,48 The high negative values found in Nari–SF indicated the existence of high repulsive force between the particles, which would impede the process of agglomerations of polymeric chains.49
After using the experimental planning to determine the best conditions for preparing the nanoformulations, we designed a series of evaluations on Nari–SF 9 and Nari–SF 15. These included assessments on the efficiency of encapsulation (% EE) and morphology of the nanoparticles; release tests; stability tests; analyses on UV-vis, infrared and fluorescence; and assessment of inhibition of the enzyme lipoxygenase (LOX). The characteristics of the polymeric nanostructures could thus be elucidated through these steps.
3.3 Nanoparticle morphology
From TEM analysis on the Nari–SF sample (Fig. 6), it could be seen that the nanostructured formulation consisted of globular particles with a homogeneous spherical nucleus. We suggest that the formation of polymeric fibroin nanoparticles is with nuclei formed by naringenin and esters, this hypothesis is raised because the fibroin of silk has amphiphilic properties and the residues of Ser, which have free hydroxyl groups, align in the hydrophilic phase, while the residues of alanine project to the hydrophobic phase.50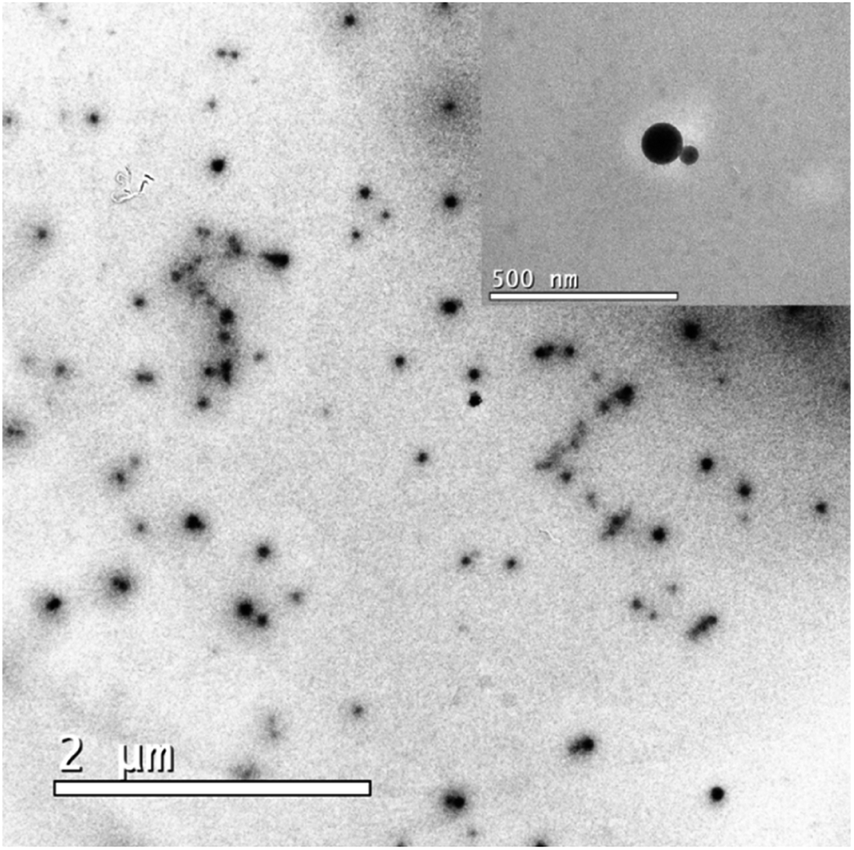 | ||
| Fig. 6 Transmission electronic microscopy analysis on the Nari–SF 15 nanoparticles, and magnification. | ||
3.4 UV-vis, FT-IR and fluorescent spectroscopy analysis
UV-vis analysis, which is a commonly used technique for measuring protein materials, showed that the SF solution had a maximum absorption peak at 275, due to the presence of aromatic amino acids in the silk fibroin,51 whereas the flavonoid solution presented maximum absorption at 289 nm. The Nari–SF nanostructure solution had a maximum absorption peak at 290 nm (Fig. 7B). The various functional groups present in the silk protein, such as amines, alcohols, phenols, thiols and carboxylic acids, contributed to the interaction sites between naringenin and the oily phase. The UV-vis spectrum observed in the Nari–SF solution indicated that there was an interaction by a percentage of unencapsulated naringenin that was probably adsorbed in the external wall of the silk fibroin, with a small change in polarity that probably occurred through hydrogen bonding.52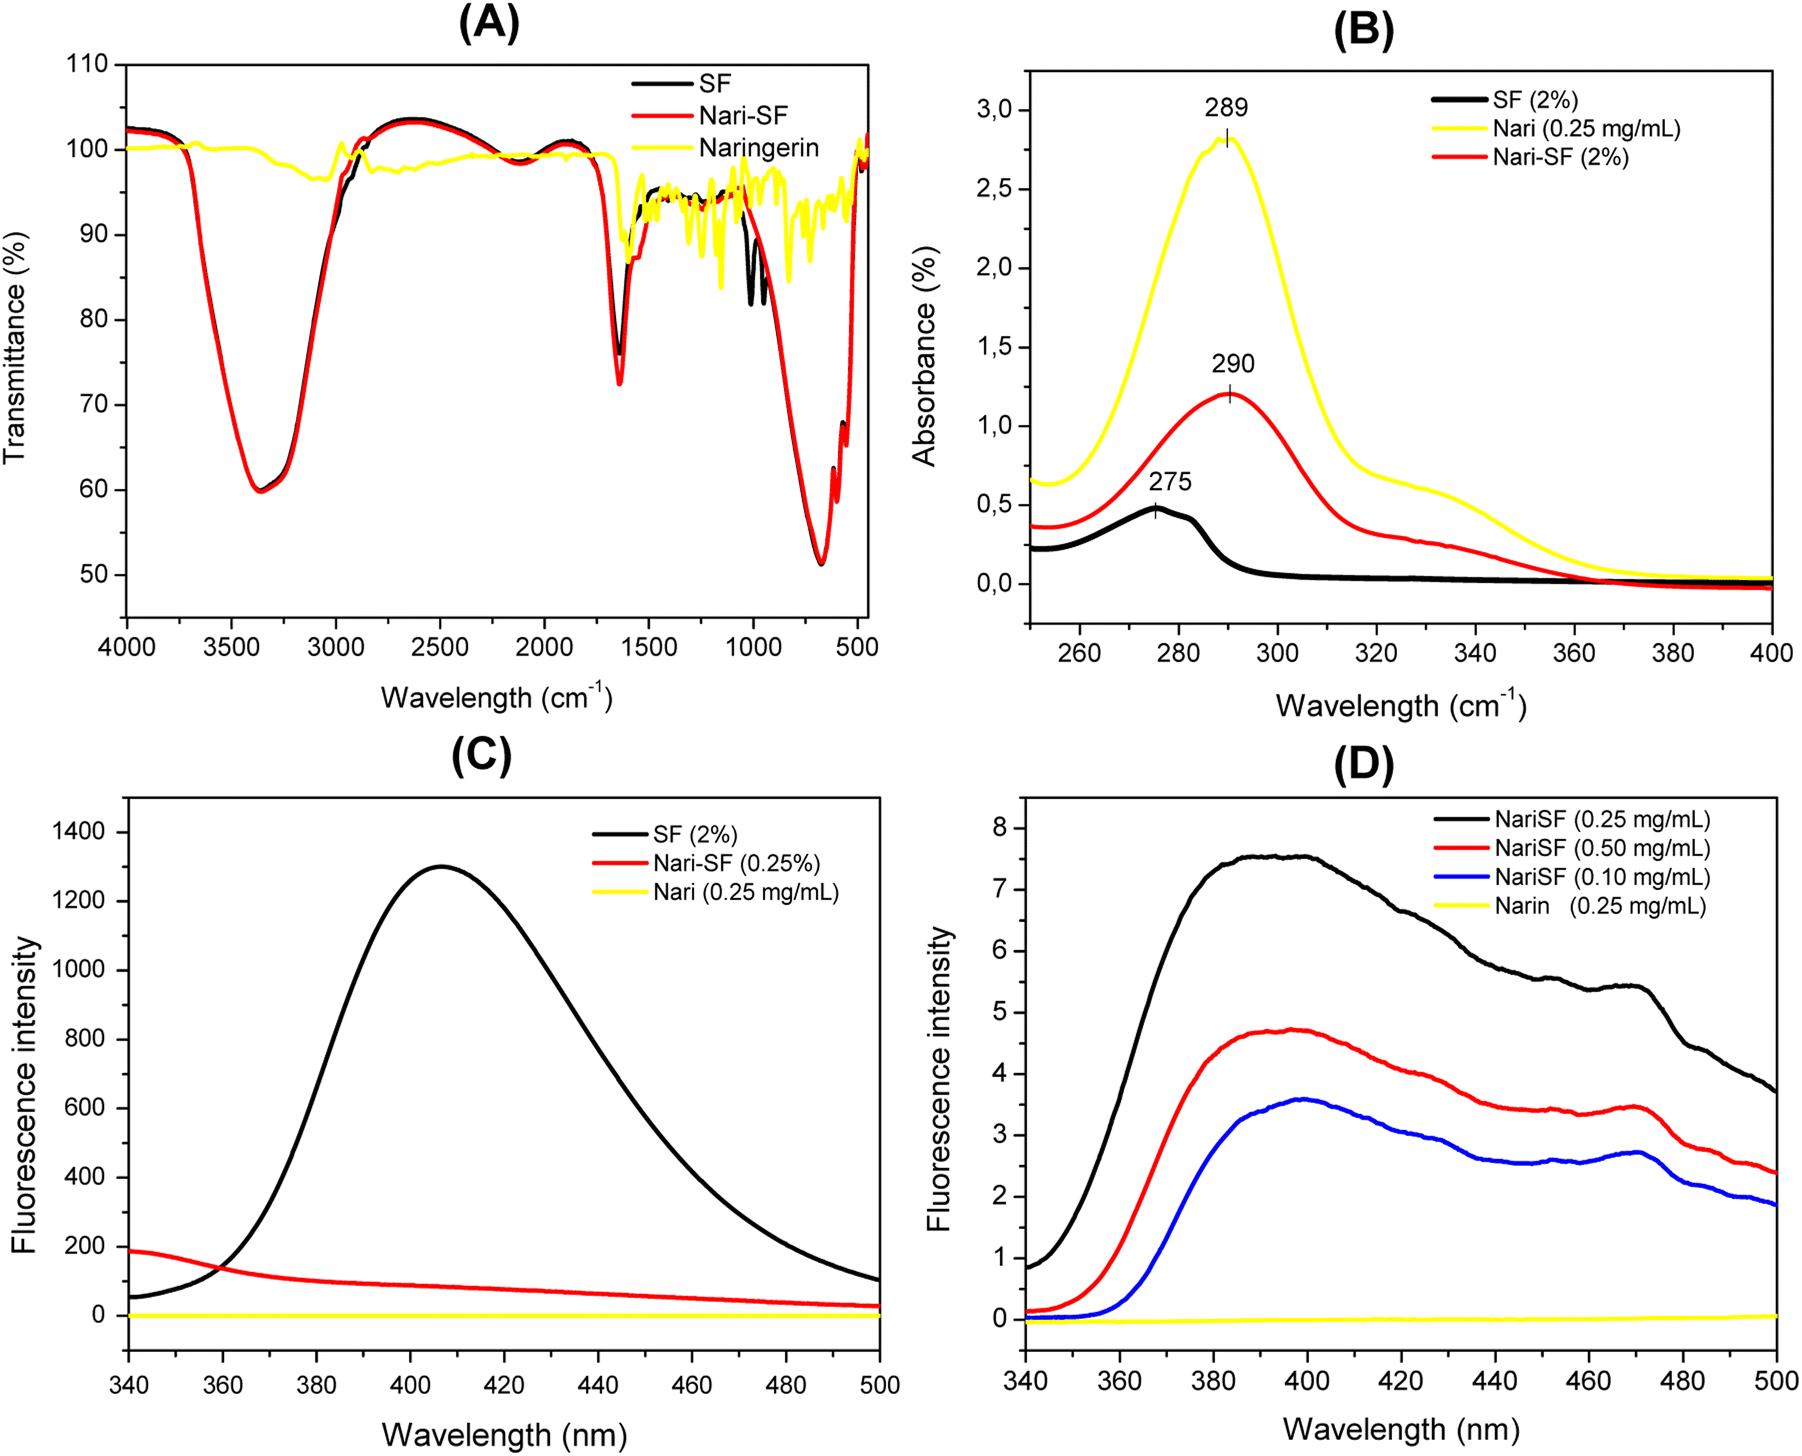 | ||
| Fig. 7 FT-IR spectrum analysis (A); UV-vis spectrum (B); and fluorescence spectra (C and D). | ||
The FT-IR analyses were performed using the main components of the nanoformulation that was developed: naringenin, silk fibroin solution as a control and the Nari–SF 9 nanoformulation. Fig. 7A shows the spectrum of free naringenin, in which the absorption bands at 1597, 1520 and 1456 cm−1 are characteristic for aromatic bending and stretching. Wang et al. (2022)53 explained that the major characteristic peaks of naringenin located at 1200–1400 cm−1, 1630 cm−1 and 3296 cm−1 were attributable to –OH phenolic bending, –C![[double bond, length as m-dash]](https://www.rsc.org/images/entities/char_e001.gif) O stretching and broad phenolic –OH of the naringenin molecule, respectively. The same bands were observed in the present study. The nanoparticle spectrum showed bands similar to those of silk fibroin, although there was a band at 1012 cm−1 that differed from silk fibroin, probably due to interaction with the flavonoid. The characteristic band for –OH appeared at 3364 cm−1, in the naringenin formulations. The band at 1012 cm−1 suggests the existence of intermolecular interaction, such as the hydrogen bonding present between fibroin and naringenin,53 or alternatively, it may have been due to the presence of naringenin, adsorbed onto the surface of the nanoparticle. In either case, the hypotheses lead to the conclusion that naringenin is encapsulated and fibroin covers the exterior of the nanoparticle.38,53
O stretching and broad phenolic –OH of the naringenin molecule, respectively. The same bands were observed in the present study. The nanoparticle spectrum showed bands similar to those of silk fibroin, although there was a band at 1012 cm−1 that differed from silk fibroin, probably due to interaction with the flavonoid. The characteristic band for –OH appeared at 3364 cm−1, in the naringenin formulations. The band at 1012 cm−1 suggests the existence of intermolecular interaction, such as the hydrogen bonding present between fibroin and naringenin,53 or alternatively, it may have been due to the presence of naringenin, adsorbed onto the surface of the nanoparticle. In either case, the hypotheses lead to the conclusion that naringenin is encapsulated and fibroin covers the exterior of the nanoparticle.38,53
The protein structure of silk fibroin can show a fluorescence excitation signal, which can be attributed to residues of the amino acids present, such as tyrosine and phenylalanine.54 The fluorescence profile of Nari–SF was monitored using different flavonoid concentrations. Nari–SF nanoparticles showed characteristic fluorescence at 390 nm when excited at 300 nm (Fig. 7C and D), which can be attributed mainly to intrinsic fluorescence from tyrosine residues found in the hydrophobic cavities of the protein.55 The naringenin solution presents absence of fluorescence excitation signal in this region. When naringenin was added, the maximum emission peak of the nanoparticles decreased, thus indicating formation of interactions between the amino acid residues of the protein and the hydrophilic flavonoid groups, thereby resulting in a decline in fluorescence.39
3.5 Encapsulation efficiency (EE)
The percentage encapsulation efficiency (% EE) of Nari–SF 9 and Nari–SF 15 was determined from the equation of the line generated by the standard curve. The results showed that the rate of encapsulation through the method developed was remarkably high, with 94.41 ± 0.13% for Nari–SF 9 and 93.44 ± 0.08% for Nari–SF 15. This showed the efficiency of the method, with the components used. There was no statistical difference between the nanoformulations in relation to encapsulation, thus leading to the conclusion that the relationships between flavonoid concentrations were proportional with regard to the fibroin of the seed, with the mixture of esters.The lipid matrix formed by the FABE mix from Brazil nut oil was sufficient to solubilize the flavonoids and encapsulate them with silk fibroin.56 It is likely that the residual unencapsulated naringenin was adsorbed into the outer wall of the polymer.57 In addition, the negative burden of the SF combined with the cationic load of naringenin contributed to high EE. This was as efficient as in other forms of encapsulation,58–60 thus increasing the bioaccessibility of naringenin27 and can facilitate the specific drug release in the targeted cells via microenvironmental stimuli.
3.6 Stability test
A stability test was performed on the nanoformulations Nari–SF 9 and Nari–SF 15 for 15 days. Particle size, polydispersity index (PDI), ZP and pH were evaluated during this period. The samples were stored at room temperature (±25 °C) and under refrigeration (±4 °C), as described in Table 3.| Time (days) | Nari–SF 9 | Nari–SF 15 | ||||||
|---|---|---|---|---|---|---|---|---|
| Size (nm) | PDI | Zeta (mV) | pH | Size (nm) | PDI | Zeta (mV) | pH | |
| Storage at 25 °C | ||||||||
| 0 | 183.8 ± 4.0 | 0.3 ± 0.0 | −43.8 ± 0.0 | 4.6 ± 0.1 | 247.5 ± 8.60 | 0.4 ± 0.0 | −43.4 ± 0.1 | 4.5 ± 0.0 |
| 7 | 517.6 ± 2.0 | 0.5 ± 0.2 | −43.1 ± 1.7 | 5.1 ± 0.0 | 303.4 ± 24.42 | 0.7 ± 0.1 | −45.3 ± 0.7 | 5.0 ± 0.0 |
| 15 | 501.5 ± 6.8 | 0.6 ± 0.0 | −43.9 ± 0.0 | 4.8 ± 0.0 | 810.2 ± 206.8 | 0.7 ± 0.0 | −46.5 ± 1.7 | 4.4 ± 0.1 |
|
||||||||
| Storage at 4 °C | ||||||||
| 0 | 190.7 ± 0.8 | 0.3 ± 0.0 | −42.3 ± 0.0 | 4.62 ± 0.2 | 226.4 ± 6.2 | 0.3 ± 0.0 | −43.5 ± 0.1 | 4.4 ± 0.0 |
| 7 | 304.3 ± 30.4 | 0.6 ± 0.1 | −43.2 ± 1.6 | 4.68 ± 0.1 | 279.5 ± 21.0 | 0.3 ± 0.1 | −45.6 ± 1.0 | 5.2 ± 0.1 |
| 15 | 701.1 ± 243 | 0.7 ± 0.1 | −41.4 ± 2.8 | 4.55 ± 0.1 | 617.9 ± 146 | 0.7 ± 0.0 | −38.3 ± 7.2 | 4.5 ± 0.0 |
When the Nari–SF 9 was stored at room temperature, the particles already showed a significant change in size on the 7th day, to 517.6 ± 175.4 nm, and then remained practically unchanged until the 15th day, with a size of 501.5 ± 67.30 nm (Table 3). Nari–SF 15 was seen to be more stable from the 1st day (247.5 ± 8.60 nm) to the 7th day (303.4 ± 24.42 nm) when stored at 25 °C, but on the 15th day a significant change in size was observed, to 810.2 ± 206.8 nm (Table 3). On the other hand, the two nanoformulations showed similar profiles of gradual increases in size when the nanoparticles were stored at 4 °C (Table 3). The observed increase in particle size may have been be influenced by the process of adsorption of protein dispersed in the middle of the surface of the nanoparticles.61
The PDI values for Nari–SF 9 showed a slight increase from the 1st to the 15th day (0.33 ± 0.02 to 0.54 ± 0.03, respectively), while Nari–SF 15 showed greater variation of PDI values, from 0.41 ± 0.01 on the 1st day to 0.70 ± 0.01 on the 15th day of observation when stored at 25 °C (Table 3). There were significant changes between the 7th and 15th day for both samples (Nari–SF 9 and Nari–SF 15). From these results, we concluded that the increase in the polydispersion index of the polymeric nanostructure of Nari–SF over the 15 day period did not depend on temperature.
The ZP remained without significant changes, ranging from −43.9 to −38.6 mV for Nari–SF 15, at 25 °C (Table 3). Changes in particle size were maintained until the end of the experiment, especially on the 15th day (810.2 nm). In relation to the PDI, there were also significant changes, such that the value remained >0.4 on the 30th day. The pH of the samples changed from 4.54 to 4.68, but this was not a significant alteration (Table 3).
Good stability of nanoparticles and fibroin of seeds in water has been noted,61 even in the presence of acid pH and temperature variations. The results indicate that the surface properties of SF nanoparticles, such as high electrostatic repulsion, substantially improve the stability of the nanoparticles.62
3.7 In vitro drug release
A dissolution experiment was carried over a 24 h period in order to evaluate the in vitro release profile of Nari–SF 9 and Nari–SF 15 (Fig. 8). Naringenin solution (1.0 mg mL−1) was used as a control to evaluate the barrier diffusion of naringenin, determined by the dialysis membrane. The results showed that over the first 4 hours of the analyses, about 13.84 and 21.67% of the naringenin was released in the nanoformulations. Thus, over this time period, there was rapid release of naringenin, with high inclination of the curve. It is likely that the naringenin released over the first 4 hours was the portion that had been unencapsulated or that had been adsorbed on the surface of the nanoparticle. Over the entire 24 h period, the naringenin release rate was 37.32 ± 1.27% and 35.79 ± 2.4% for Nari–SF 15 and Nari–SF 9, respectively. However, the naringenin solution was diffused in a higher percentage to the release medium (>50%). We concluded that the modulation of naringenin release rates in the nanostructures every hour occurred in a continuously increasing manner. The best-fitting model for the release profile for Nari–SF 9 (R2 0.9997) and 15 (R2 0.9985) was Korsmeyer–Peppas (with lag), which generally describes the release of drugs in polymeric systems in which several mechanisms are involved.63 After the first 4 hours, the inclination of the curve diminishes and tends to become more horizontal, thus showing a decrease in the speed of drug release. Polymeric systems generally have the ability to exhibit this behavior, given that drug release can be controlled through erosion of the polymers and diffusion of the drug. In addition, because of the slow degradability of SF protein in the body and the low molecular weight of naringenin (272.257 g mol−1), drug release can be controlled mainly through its diffusion, in relation to the model for Nari–SF 9 and Nari–SF 15.64 Drug release is explained by various mathematical models, using KinetDS software drugs in polymeric systems. This model suggests that naringenin is released from the polymeric matrix by an anomalous diffusion, in which the diffusion curves are very similar to a Fickian process, however, it reaches release equilibrium more quickly.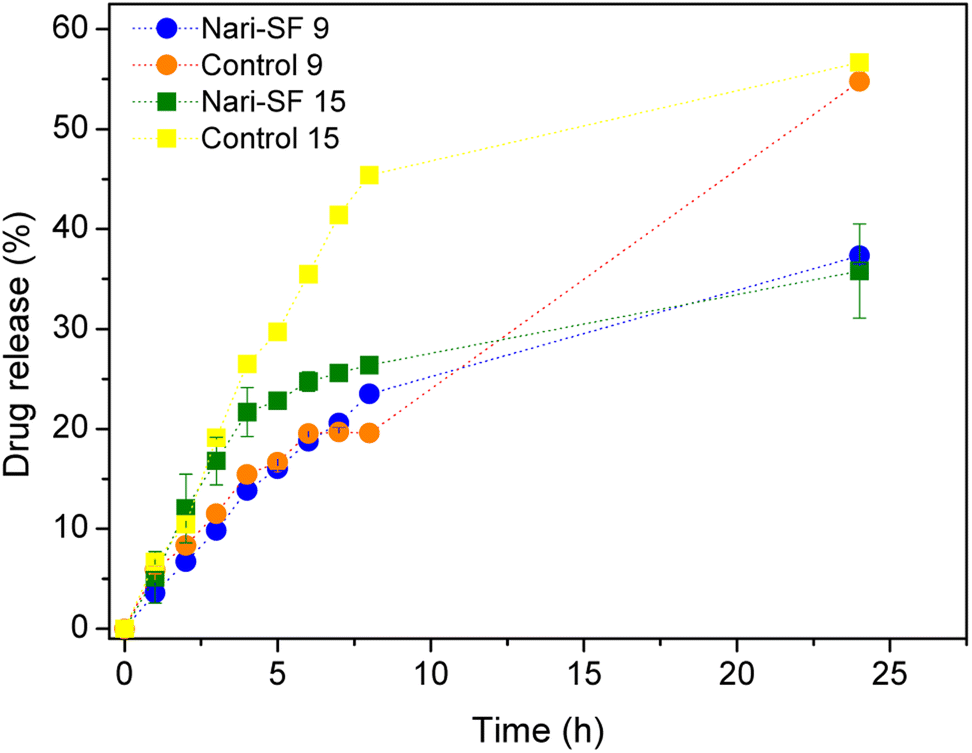 | ||
| Fig. 8 Release profile of naringenin from Nari–SF 9 and Nari–SF 15 using dialysis bag (n = 3, ± SD). | ||
3.8 Lipoxygenase (LOX) inhibition assay
The inhibition of lipoxygenase is shown in Fig. 9. The nanoformulation Nari–SF 9 showed high capacity to inhibit the LOX enzyme (90.21 ± 3.91%). However, the inhibition obtained through use of dexamethasone as a positive control was 94.13 ± 1.67%. Nari–SF 15 also presented anti-LOX activity (58.24 ± 16.39%). The difference in activity between the nanoformulations 9 and 15 was probably due to the effect of their concentrations (Nari–SF 9 at 1.5 mg mL−1 and Nari–SF 15 at 1.0 mg mL−1), thus showing that there was a dose–response trend between them.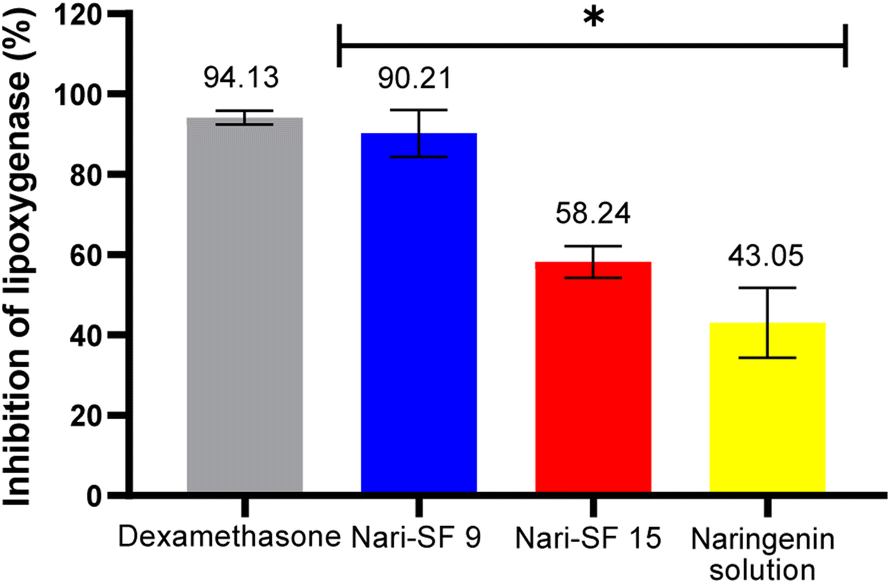 | ||
| Fig. 9 LOX inhibitory activity of Nari–SF and naringenin solution. Values are means ± SE from three experiments. Conditions of preparation Nari–SF 9 and Nari–SF 15 as describe in the experiments 9 and 15 (Table 2). | ||
The results reported suggest that Nari–SF has a potentially high anti-LOX effect, with IC50 of 7.35 μg mL−1. This may be related to the polyphenolic content of naringenin and its increased bioavailability through nanostructures formed with fibroin. This effect is substantially better than that of non-nanostructured formulations (IC50 = 66.75 μg mL−1).65 Absence of biopolymer (SF) and nanometric particles in the formulation were shown to significantly decrease the anti-LOX effect (43.05 ± 22.89%) in naringenin solution, in comparison with Nari–SF 9, prepared with the same flavonoid concentration in solution (1.5 mg mL−1).
The LOX enzyme plays an important role in the inflammatory response. Together with increased levels of reactive oxygen species, it can cause inflammation, thus stimulating the production of cytokines and consequently LOX. In addition, LOX is directly involved in the biosynthesis of arachidonic acid in leukotrienes. Hence, LOX inhibition can lower the presence of leukotrienes, thereby producing an anti-inflammatory effect.66 This enzyme is involved in the pathogenesis of several diseases such as ulcerative colitis, atherosclerosis, asthma, rheumatoid arthritis and various types of cancer.66 Flavonoids have an anti-inflammatory effect through inhibiting various enzymes, including LOX, mainly due to the presence of the OH group in the structure.67
The formation of SF nanoparticles significantly increased the bioavailability of naringenin, thus reaching levels of inhibition of the LOX enzyme similar to that of dexamethasone, which is a commercially available anti-inflammatory drug commonly used for treating rheumatoid arthritis, allergies and asthma.68 Among them, fibroin is an FDA-approved polymer that has been popularly used in numerous medical applications.50
4 Conclusions
Silk fibroin was efficiently applied as a surfactant for development of polymeric nanoparticles with naringenin, through a simple low-energy process. By means of experimental planning, it was possible to optimize the conditions for better results with regard to particle size, PDI and ZP, thus resulting in a predictive mathematical model. Silk fibroin was a parameter that significantly influenced the responses relating to formation of polymeric nanoparticles. The best polymeric nanoparticles (Nari–SF 9 and 15) were characterized by using TEM, UV-vis, FT-IR and fluorescence. The percentage encapsulation was above 90%, thus showing the efficiency of the method. Sustained release of naringenin occurred gradually and continuously. In addition, high anti-LOX activity was shown in vitro (90.21 ± 3.91%), which may be promising for future studies using in vivo models.Author contributions
Fabrício H. Holanda, Rayanne R. Pereira and Irlon M. Ferreira: conceptualization, methodology, software, formal analysis, investigation, data curation, writing – original draft. Victor H. S. Marinho, David E. Q. Jimenez and Lindalva M. M. C. Ferreira: methodology, investigation, writing – original draft, writing – review & editing, visualization. Irlon M. Ferreira, Roseane M. R. Costa and Francisco F. O. de Sousa: conceptualization, supervision, project administration, funding acquisition.Conflicts of interest
There are no conflicts to declare.Acknowledgements
The authors would like to acknowledge the Research Support Foundation of the State of Amapá (Fundação de Amparo à Pesquisa do Estado do Amapá – FAPEAP) (grant no. 88887.568501/2020-00), the Coordination for the Improvement of Higher Education Personnel (Coordenação de Aperfeiçoamento de Pessoal de Nível Superior – CAPES) (grant no. 23038.006914/2020-12), for the financing in part of the present work.References
- M. Akrami-Hasan-Kohal, M. Eskandari and A. Solouk, Colloids Surf., B, 2021, 205, 111892 CrossRef CAS PubMed.
- I. F. Araújo, H. A. Loureiro, V. H. S. Marinho, F. B. Neves, R. S. F. Sarquis, S. M. M. Faustino, S. A. Yoshioka, R. M. A. Ferreira, R. N. P. Souto and I. M. Ferreira, Biocatal. Agric. Biotechnol., 2020, 24, 101550 CrossRef.
- E. B. M. Júnior, F. B. Neves, S. Q. Lopes, F. H. Holanda, T. M. Souza, E. P. Pinto, A. N. Oliveira, L. P. Fonseca, S. A. Yoshioka and I. M. Ferreira, Curr. Catal., 2021, 10, 119–129 CrossRef.
- F. B. Neves, L. L. Zanin, R. R. Pereira, J. O. C. S. Júnior, R. M. R. Costa, A. L. M. Porto, S. A. Yoshioka, A. N. de Oliveira, D. E. Q. Jimenez and I. M. Ferreira, Catalysts, 2022, 12, 904 CrossRef CAS.
- I. M. Ferreira, L. d. S. Ganzeli, I. G. Rosset, S. A. Yoshioka and A. L. M. Porto, Catal. Lett., 2017, 147, 269–280 CrossRef CAS.
- K. Chen, Y. Li, Y. Li, W. Pan and G. Tan, Macromol. Biosci., 2023, 23, 2200380 CrossRef CAS.
- S. Singh, G. Cortes, U. Kumar, T. S. Sakthivel, S. M. Niemiec, A. E. Louiselle, M. Azeltine-Bannerman, C. Zgheib, K. W. Liechty and S. Seal, Biomater. Sci., 2020, 8, 5900–5910 RSC.
- A. P. R. Bitencourt, J. L. Duarte, A. E. M. F. M. Oliveira, R. A. S. Cruz, J. C. T. Carvalho, A. T. A. Gomes, I. M. Ferreira, R. M. Ribeiro-Costa, J. O. C. Silva-Júnior and C. P. Fernandes, Food Chem., 2018, 257, 196–205 CrossRef CAS PubMed.
- A. Opálková Šišková, E. Kozma, A. Opálek, Z. Kroneková, A. Kleinová, Š. Nagy, J. Kronek, J. Rydz and A. Eckstein Andicsová, Materials, 2020, 13, 3580 CrossRef.
- F. H. Holanda, A. N. Ribeiro, B. L. Sánchez-Ortiz, G. C. de Souza, S. F. Borges, A. M. Ferreira, A. C. Florentino, S. A. Yoshioka, L. S. Moraes, J. C. T. Carvalho and I. M. Ferreira, Biotechnol. Lett., 2023, 45, 235–253 CrossRef CAS.
- D. T. Pham and W. Tiyaboonchai, Drug Delivery, 2020, 27, 431–448 CrossRef CAS PubMed.
- F. Mottaghitalab, M. Farokhi, M. A. Shokrgozar, F. Atyabi and H. Hosseinkhani, J. Controlled Release, 2015, 206, 161–176 CrossRef CAS.
- V. H. S. Marinho, F. B. Neves, D. E. Q. Jimenez, F. R. Oliveira, A. V. T. L. T. Santos, R. M. A. Ferreira, R. N. P. Souto, J. C. T. Carvalho, S. A. Yoshioka and I. M. Ferreira, J. Drug Delivery Sci. Technol., 2022, 75, 103626 CrossRef CAS.
- A. M. Bossi, A. Bucciarelli and D. Maniglio, ACS Appl. Mater. Interfaces, 2021, 13, 31431–31439 CrossRef CAS.
- R. Eivazzadeh-Keihan, F. Khalili, N. Khosropour, H. A. M. Aliabadi, F. Radinekiyan, S. Sukhtezari, A. Maleki, H. Madanchi, M. R. Hamblin, M. Mahdavi, S. M. A. Haramshahi, A. E. Shalan and S. Lanceros-Méndez, ACS Appl. Mater. Interfaces, 2021, 13, 33840–33849 CrossRef CAS.
- C. Nambajjwe, W. B. Musinguzi, S. Rwahwire, A. Kasedde, C. Namuga and I. Nibikora, Mater. Today: Proc., 2020, 28, 1221–1226 CrossRef CAS.
- B. Salehi, P. Fokou, M. Sharifi-Rad, P. Zucca, R. Pezzani, N. Martins and J. Sharifi-Rad, Pharmaceuticals, 2019, 12, 11 CrossRef CAS PubMed.
- A. H. El-desoky, R. F. Abdel-Rahman, O. K. Ahmed, H. S. El-Beltagi and M. Hattori, Phytomedicine, 2018, 42, 126–134 CrossRef CAS PubMed.
- J. Jayaraman, V. A. S. Jesudoss, V. P. Menon and N. Namasivayam, Toxicol. Mech. Methods, 2012, 22, 568–576 CrossRef CAS.
- R. Tsuhako, H. Yoshida, C. Sugita and M. Kurokawa, J. Nat. Med., 2020, 74, 229–237 CrossRef CAS PubMed.
- D. J. Den Hartogh and E. Tsiani, Biomolecules, 2019, 9, 99 CrossRef PubMed.
- M. Motallebi, M. Bhia, H. F. Rajani, I. Bhia, H. Tabarraei, N. Mohammadkhani, M. Pereira-Silva, M. S. Kasaii, S. Nouri-Majd, A. L. Mueller, F. J. B. Veiga, A. C. Paiva-Santos and M. Shakibaei, Life Sci., 2022, 305, 120752 CrossRef CAS PubMed.
- H. Tutunchi, F. Naeini, A. Ostadrahimi and M. J. Hosseinzadeh-Attar, Phytother. Res., 2020, 34, 3137–3147 CrossRef CAS PubMed.
- R. Lu, R.-J. Yu, C. Yang, Q. Wang, Y. Xuan, Z. Wang, Z. He, Y. Xu, L. Kou, Y.-Z. Zhao, Q. Yao and S.-H. Xu, Drug Delivery, 2022, 29, 3256–3269 CrossRef CAS PubMed.
- Y. Singh, J. G. Meher, K. Raval, F. A. Khan, M. Chaurasia, N. K. Jain and M. K. Chourasia, J. Controlled Release, 2017, 252, 28–49 CrossRef CAS.
- Z. Dong, X. Wang, M. Wang, R. Wang, Z. Meng, X. Wang, B. Yu, M. Han and Y. Guo, Molecules, 2022, 27, 3736 CrossRef CAS PubMed.
- W. Tang, Y. Wei, W. Lu, D. Chen, Q. Ye, C. Zhang, Y. Chen and C. Xiao, Food Chem.: X, 2022, 16, 100477 CAS.
- B. Samuelsson, S.-E. Dahlén, J. Å. Lindgren, C. A. Rouzer and C. N. Serhan, Science, 1979, 1987(237), 1171–1176 Search PubMed.
- R. Wisastra and F. Dekker, Cancers, 2014, 6, 1500–1521 CrossRef CAS PubMed.
- I. M. Ferreira, S. A. Yoshioka, J. V. Comasseto and A. L. M. Porto, RSC Adv., 2017, 7, 12650–12658 RSC.
- I. M. Ferreira, R. H. V. Nishimura, A. B. D. A. Souza, G. C. Clososki, S. A. Yoshioka and A. L. M. Porto, Tetrahedron Lett., 2014, 55, 5062–5065 CrossRef CAS.
- S. L. C. Ferreira, R. E. Bruns, H. S. Ferreira, G. D. Matos, J. M. David, G. C. Brandão, E. G. P. da Silva, L. A. Portugal, P. S. dos Reis, A. S. Souza and W. N. L. dos Santos, Anal. Chim. Acta, 2007, 597, 179–186 CrossRef CAS PubMed.
- F. H. e. Holanda, W. G. Birolli, E. d. S. Morais, I. S. Sena, A. M. Ferreira, S. M. M. Faustino, L. G. d. S. Solon, A. M. Porto and I. M. Ferreira, Biocatal. Agric. Biotechnol., 2019, 20, 101200 CrossRef.
- S. S. C. Oliveira, E. S. Sarmento, V. H. Marinho, R. R. Pereira, L. P. Fonseca and I. M. Ferreira, Molecules, 2022, 27, 5187 CrossRef CAS.
- I. R. Sarquis, R. S. F. R. Sarquis, V. H. S. Marinho, F. B. Neves, I. F. Araújo, L. F. Damasceno, R. M. A. Ferreira, R. N. P. Souto, J. C. T. Carvalho and I. M. Ferreira, Ind. Crops Prod., 2020, 157, 112931 CrossRef CAS.
- F. Pinto, D. P. C. de Barros and L. P. Fonseca, Ind. Crops Prod., 2018, 118, 149–159 CrossRef CAS.
- E. P. Vale, E. d. S. Morais, W. d. S. Tavares and F. F. O. de Sousa, J. Mol. Liq., 2022, 358, 119107 CrossRef CAS.
- Y.-Q. Zhang, W.-D. Shen, R.-L. Xiang, L.-J. Zhuge, W.-J. Gao and W.-B. Wang, J. Nanopart. Res., 2007, 9, 885–900 CrossRef CAS.
- X. Li, H. Liu, X. Wu, R. Xu, X. Ma, C. Zhang, Z. Song, Y. Peng, T. Ni and Y. Xu, Spectrochim. Acta, Part A, 2021, 258, 119859 CrossRef CAS PubMed.
- T. Ksiksi and A. Hamza, Molecules, 2012, 17, 12521–12532 CrossRef CAS PubMed.
- Y. Wang, X. Xu, Y. Gu, Y. Cheng and F. Cao, Expert Opin. Drug Delivery, 2018, 15, 687–701 CrossRef CAS PubMed.
- B. Yavuz, L. Chambre and D. L. Kaplan, Expert Opin. Drug Delivery, 2019, 16, 741–756 CrossRef CAS PubMed.
- M. A. Asensio Ruiz, M. G. Fuster, T. Martínez Martínez, M. G. Montalbán, J. L. Cenis, G. Víllora and A. A. Lozano-Pérez, Polymers, 2022, 14, 498 CrossRef CAS PubMed.
- W. K. Delan, M. Zakaria, B. Elsaadany, A. N. ElMeshad, W. Mamdouh and A. R. Fares, Int. J. Pharm., 2020, 577, 119038 CrossRef CAS PubMed.
- B. Shahbazi, M. Taghipour, H. Rahmani, K. Sadrjavadi and A. Fattahi, Colloids Surf., B, 2015, 136, 867–877 CrossRef CAS PubMed.
- B. Begines, T. Ortiz, M. Pérez-Aranda, G. Martínez, M. Merinero, F. Argüelles-Arias and A. Alcudia, Nanomaterials, 2020, 10, 1403 CrossRef CAS PubMed.
- S. Bhattacharjee, J. Controlled Release, 2016, 235, 337–351 CrossRef CAS PubMed.
- B. Begines, T. Ortiz, M. Pérez-Aranda, G. Martínez, M. Merinero, F. Argüelles-Arias and A. Alcudia, Nanomaterials, 2020, 10, 1403 CrossRef CAS PubMed.
- G. Carissimi, A. A. Lozano-Pérez, M. G. Montalbán, S. D. Aznar-Cervantes, J. L. Cenis and G. Víllora, Polymers, 2019, 11, 2045 CrossRef CAS PubMed.
- D. T. Pham and W. Tiyaboonchai, Drug Delivery, 2020, 27, 431–448 CrossRef CAS PubMed.
- K. G. Lee, H. Y. Kweon, J. H. Yeo, S. O. Woo, S. M. Han and J. H. Kim, Int. J. Biol. Macromol., 2011, 48, 223–226 CrossRef CAS.
- W. P. Chan, K.-C. Huang and M.-Y. Bai, J. Biomed. Mater. Res., Part B, 2017, 105, 420–430 CrossRef CAS PubMed.
- S. Wang, T. Xue, B. Niu, L. Wei and H. Wang, Prog. Nat. Sci.: Mater. Int., 2022, 32, 498–503 CrossRef CAS.
- M. Amirikia, S. M. A. Shariatzadeh, S. G. A. Jorsaraei and M. S. Mehranjani, Eur. Biophys. J., 2018, 47, 573–581 CrossRef CAS PubMed.
- Y.-Q. Zhang, W.-D. Shen, R.-L. Xiang, L.-J. Zhuge, W.-J. Gao and W.-B. Wang, J. Nanopart. Res., 2007, 9, 885–900 CrossRef CAS.
- R. R. Pereira, M. Testi, F. Rossi, J. O. C. Silva Junior, R. M. Ribeiro-Costa, R. Bettini, P. Santi, C. Padula and F. Sonvico, Pharmaceutics, 2019, 11, 284 CrossRef CAS PubMed.
- M. H. Ebrahimi, H. Samadian, S. T. Davani, N. R. Kolarijani, N. Mogharabian, M. S. Salami and M. Salehi, J. Mol. Liq., 2020, 318, 114226 CrossRef CAS.
- S. Raeisi, H. Chavoshi, M. Mohammadi, M. Ghorbani, M. Sabzichi and F. Ramezani, Process Biochem., 2019, 83, 168–175 CrossRef CAS.
- S. Sharma, A. Hafeez and S. A. Usmani, J. Drug Delivery Sci. Technol., 2022, 76, 103724 CrossRef CAS.
- P. Parashar, M. Rathor, M. Dwivedi and S. A. Saraf, Pharmaceutics, 2018, 10, 33 CrossRef PubMed.
- J. Kundu, Y. Il Chung, Y. H. Kim, G. Tae and S. C. Kundu, Int. J. Pharm., 2010, 388, 242–250 CrossRef CAS PubMed.
- L. Jia, L. Guo, J. Zhu and Y. Ma, Mater. Sci. Eng., C, 2014, 43, 231–236 CrossRef CAS PubMed.
- S. Gooneh-Farahani, S. M. Naghib and M. R. Naimi-Jamal, Fibers Polym., 2020, 21, 1917–1926 CrossRef CAS.
- Z. Zhao, Y. Li and M.-B. Xie, Int. J. Mol. Sci., 2015, 16, 4880–4903 CrossRef CAS PubMed.
- V. Singh, S. Jubie, S. Jupudi, A. Wadhwani, S. P. Dhanabal, R. Singh and M. P. Singh, Rev. Bras. Farmacogn., 2022, 32, 484–490 CrossRef CAS.
- P. K. Vogt, S. Kang, M. A. Elsliger and M. Gymnopoulos, Trends Biochem. Sci., 2007, 32, 342–349 CrossRef CAS PubMed.
- S. R. M. Ibrahim, G. A. Mohamed, K. Z. Alshali, R. A. A. Haidari, A. A. El-Kholy and M. F. Zayed, Rev. Bras. Farmacogn., 2018, 28, 320–324 CrossRef CAS.
- N. Mukhopadhyay, A. Shukla, P. N. Makhal and V. R. Kaki, Heliyon, 2023, 9, 14569 CrossRef.
| This journal is © The Royal Society of Chemistry 2023 |