 Open Access Article
Folic acid–maltodextrin polymer coated magnetic graphene oxide as a NIR-responsive nano-drug delivery system for chemo-photothermal synergistic inhibition of tumor cells†
Tao Gong‡
a,
Xiaoyu Wang‡a,
Huirui Zhua,
Chaochao Wenb,
Qing Maa,
Xiaoning Lia,
Meining Lia,
Rui Guo*a and
Wenting Liang *b
*b
aDepartment of Biochemistry and Molecular Biology, Shanxi Medical University, Taiyuan 030001, China. E-mail: 15834151276@139.com
bInstitute of Environmental Science, Department of Chemistry, Shanxi University, Taiyuan 030006, China. E-mail: liangwt@sxu.edu.cn
First published on 24th April 2023
Abstract
The combination of chemo-photothermal therapy with high efficiency and fewer side effects has a good application prospect in cancer treatment. It is of great significance to construct a nano-drug delivery system with cancer cell targeting, high drug loading and excellent photothermal conversion efficiency. Therefore, a novel nano-drug carrier MGO-MDP–FA was successfully constructed by coating folic acid-grafted maltodextrin polymers (MDP–FA) on the surface of Fe3O4-modified graphene oxide (MGO). The nano-drug carrier combined the cancer cell targeting of FA and the magnetic targeting of MGO. A large amount of anti-cancer drug doxorubicin (DOX) was loaded by π–π interaction, hydrogen bond interaction and hydrophobic interaction, with the maximum loading amount and loading capacity of 657.9 mg g−1 and 39.68 wt%, respectively. Based on the excellent photothermal conversion efficiency of MGO, MGO-MDP–FA showed good thermal ablation effect of tumor cells in vitro under NIR irradiation. In addition, MGO-MDP–FA@DOX showed excellent chemo-photothermal synergistic tumor inhibition in vitro (tumor cell killing rate reached 80%). In conclusion, the novel nano-drug delivery system MGO-MDP–FA constructed in this paper provides a promising nano-platform for chemo-photothermal synergistic treatment of cancer.
1. Introduction
Photothermal therapy (PTT) has been widely used in cancer therapy with low toxic side effects, short acting time and remarkable curative effect. PTT utilizes photothermal conversion produced by photothermal agents with high photothermal conversion efficiency that convert light energy into heat to increase local temperature and induce cell death.1–3 Therefore, the selection of a suitable photothermal agent is critical for photothermal therapy. At present, many photothermal agents have been discovered by researchers, including carbon nanomaterials,4–8 gold nanomaterials,9–11 silica dioxide,12–14 etc. Among them, graphene oxide (GO) has been drawing attention as a novel carbon nanomaterial.Graphene oxide is a two-dimensional carbon nanomaterial of sp2-hybridized of carbon atoms with carboxyl, hydroxyl, and epoxide groups. It has been widely used in many fields due to its excellent physical and chemical properties.15–17 In addition, carbon nanomaterials are often used as drug carriers for targeted delivery of chemotherapy drugs.18–20 GO possesses large surface area and good water solubility, which can load a large number of hydrophobic chemotherapy drugs through π–π stacking and improve the water solubility of drugs.21–23 However, GO tends to accumulate in physiological environments, which greatly limits its application as a drug carrier.24,25
In recent years, GO has been functionalized by hydrophilic polymers to improve its physiological stability for drug delivery.26–28 Maltodextrin (MD) is a kind of hydrophilic polysaccharide hydrolyzed by amylase, with extremely rich hydroxyl groups, easy to modify and cross link to form polymers.29,30 Maltodextrin has good water solubility and biocompatibility, and is often used as a stabilizer to improve the stability of substances. However, functionalized modifications occupy vast functional groups on the GO surface, reducing the drug loading capacity of GO. Maltodextrin polymers have been reported to be capable of loading hydrophobic chemotherapeutic agents through molecular interactions (hydrophobic interactions, hydrogen bonding, etc.), enhancing the stability of GO while improving its drug loading performance.31,32
A targeting strategy can improve the selectivity of nanomaterials to tumor tissue and improve the effectiveness of chemotherapy drug delivery.33,34 At present, active targeting has received extensive research and attention due to its high specificity and selectivity. Active targeting usually involves ligands with high affinity to specific surface molecules that are highly expressed on the surface of cancer cells. These ligands mainly include peptides, proteins, aptamers and so on.35–37 Folic acid (FA) has the advantages of small size, poor immunogenicity, high utilization rate and simple conjugation, and is widely used in specific transport of chemotherapy drugs. Folate endows nanomaterials with active targeting by specifically binding to folate receptors (FR) that are highly expressed on the surface of tumor cells.38,39
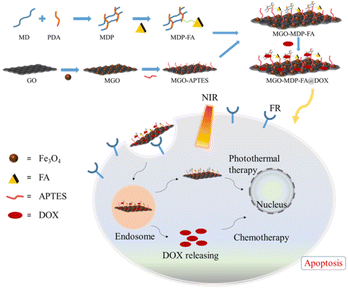
In this study, magnetic graphene oxide (MGO) was prepared and its surface was modified with hydrophilic maltodextrin polymer (MDP) and active cancer targeting folic acid (FA) to construct a novel nano drug carrier MGO-MDP–FA. Finally, DOX and GO were anchored on the GO surface by π–π stacking and hydrophobic interaction to obtain multifunctional MGO-MDP–FA@DOX nanocomposites. The nano drug carrier has the advantages of high drug loading, biocompatibility, water solubility, tumor specific targeting and excellent drug loading capacity (DLC). Modified by maltodextrin polymer, the biocompatibility and physiological stability of nanoparticles were significantly improved. Modification of FA ligands allows nanoparticles to actively target tumor cells and the drug was further released under near-infrared light. Under the action of active targeting and NIR responsiveness, MGO-MDP–FA@DOX nanocomposites can effectively kill tumor cells in combination with chemotherapy and photothermal therapy, and achieve better therapeutic effect than single therapy (Scheme 1).
2. Materials and methods
2.1 Materials
Graphene powder, folic acid (FA), 3-ammonia propyl-triethoxy silane (APTES), dicyclohexyl carbon imine (DCC), 4-dimethylaminopyridine (DMAP) and doxorubicin hydrochloride (DOX) were purchased from Aladdin Industrial Corporation.Anhydrous ethanol, dimethyl sulfoxide (DMSO), ferric chloride and ferrous chloride were obtained from Tianjin Hengxing chemical reagent Co. Ltd. Maltodextrin (MD, 99%) was purchased from Shanghai Ciwei Chemical Technology Co., Ltd. Pyromellitic dianhydride (PDA) was purchased from Shanghai McLean Biochemical Technology Co., Ltd. Triethylamine is analytical pure, purchased from Tianjin Damao Chemical Reagent Company. Ammonia solution (NH3, 25%) was supplied by Tianjin Beichen Reagent Factory. Phosphate Buffer Saline (PBS, pH 7.4) and 4′,6-diamidino-2-phenylindole (DAPI) were obtained from Boster Biological Technology Co., Ltd. Deionized water (DI water) was obtained from PURELAB Classic UVF system (ELGA, UK).
2.2 Synthesis of MDP–FA
MDP was firstly synthesized based on our previously published literature (the detailed synthesis process was described in ESI†).40 In briefly, MD (3.0 g) was added to DMSO (12 mL) for stirring and dissolution. Then triethylamine (3.0 mL) was added and stirred for 10 min, and PMDA (4.0 g) was added and reacted at room temperature for 20 h. After the reaction, distilled water and acetone were respectively used to wash for 3 times and filtered, and then washed with distilled water for 3 times. The white powder MDP was obtained by freeze-drying.Then the MDP–FA polymers were synthesized by esterification between MDP and FA. In briefly, FA (22 mg) was added into DMSO (20 mL) and stirred at 37 °C for 30 min. DCC (10.3 mg) and DMAP (6.1 mg) were added and stirred at room temperature for 1 h. Then MDP (22 mg) was added and stirred overnight at room temperature. After the reaction was completed, the suspension was centrifuged at 4000 rpm for 10 min and washed with anhydrous ethanol for 3 times. The white powder MDP–FA was obtained by centrifugation and vacuum drying.
2.3 Synthesis of MGO-MDP–FA
The MGO and aminated MGO (MGO-APTES) were synthesized according to our previously published literature (the detailed synthesis process was described in ESI†).41,42 In briefly, MGO-APTES (50 mg) was dissolved in DMSO by ultrasonic, DCC (20 mg) and DMAP (12 mg) were added and stirred for 30 min at room temperature, and then the pre-synthesized MDP–FA was added and stirred for 24 h at room temperature. After the reaction was completed, the product was separated with a permanent magnet repeatedly and washed with anhydrous ethanol for 3 times. Finally, MGO-MDP–FA was obtained by vacuum drying and used in subsequent experiments. The yield of MGO-MDP–FA was determined by measuring the change of ultraviolet absorption of MDP–FA, and the yield of MGO-MDP–FA was 50%.2.4 Characterization
Transmission electron microscopy (TEM) images were taken by a FEI Tecnai G2 F30 (Jeol, Japan) transmission electron microscope. Thermogravimetric Analysis (TGA) were recorded using a TA Instruments Q50 under flowing nitrogen atmosphere from room temperature to 800 °C. Magnetic properties were studied at room temperature by a Lakeshore 1600 vibrating sample magnetometer (VSM). X-ray diffraction (XRD) was carried out on a Bruker D8 Advance diffractometer in the 2θ range of 10–80°. Fourier transform infrared spectra (FTIR) were acquired by a Bruker FTIR spectrometer (INVENIO, GER). UV-VIS spectra were carried out on a UH5300 UV-VIS spectrophotometer (Tokyo, Japan). Fluorescence measurements were performed on a F-7000 fluorescence spectrophotometer (Tokyo, Japan). Fluorescence images were observed using a Nikon Eclipse Ti2 inverted fluorescent microscope (Tokyo, Japan). Laser irradiation was performed using an 808 nm laser (Hi-Tech Optoelectronics Co., Ltd).2.5 Photothermal effect of MGO-MDP–FA
To measure the photothermal conversion performance, the PBS dispersions (1.0 mL) of MGO-MDP–FA with different concentrations (0.1, 0.4, 0.8, 1.0 mg mL−1) and PBS (1.0 mL) were irradiated with NIR laser (808 nm, 2.0 W cm−2) for 0–5 min. In addition, the PBS dispersions (1.0 mL) of MGO-MDP–FA with concentration of 1.0 mg mL−1 was irradiated by 808 nm NIR laser with different power densities (0.5, 1.0, 1.5, 2.0 W cm−2) for 5 min. The temperature of all samples was monitored using a temperature measuring instrument (Testo AG 925).In addition, in order to determine whether both Fe3O4 and GO are conducive to the photothermal effect of MGO-MDP–FA, we measured the photothermal properties of Fe3O4 and GO in concentration of 1.0 mg mL−1, respectively under irradiation of NIR laser (808 nm, 2.0 W cm−2) for 5 min.
2.6 Drug loading capability and mechanism of MGO-MDP–FA
To study drug releasing in vitro, MGO-MDP–FA (1.0 mg) was dispersed by ultrasound in 4.0 mL DOX solution (0.01 mg mL−1) and vibrated avoid light at 200 rpm and 37 °C. At the certain time point, separating rapidly with a magnet and measuring the fluorescence intensity of supernatant. Then, the drug loading kinetics curve was drawn and Lagergren's pseudo first order kinetic model and Ho's pseudo second order kinetic model (the equations described in ESI†) were used to further analyze the load mechanism of drugs.Subsequently, the drug loading capacity of MGO-MDP–FA was determined by isothermal adsorption experiment. In shortly, 1.0 mg MGO-MDP–FA was dispersed into a series of 4.0 mL DOX solutions with different concentrations and vibrated avoids light at 37 °C for 8 h. After separating with a permanent magnet, the supernatant was taken to measuring the fluorescence intensity at 558 nm, and the drug loading capacity (DLC) was calculated by the following eqn (1). In addition, we investigated the possible loading mechanism of DOX on MGO-MDP–FA by Langmuir model and Freundlich model (the equations described in ESI†).
 | (1) |
2.7 Drug releasing experiments of MGO-MDP–FA
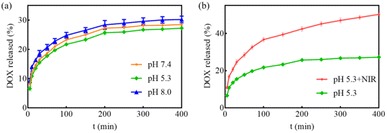
The drug releasing performance of DOX from MGO-MDP–FA was evaluated by fluorescence spectroscopy. Briefly, 1.0 mg MGO-MDP–FA@DOX was dispersed in 4.0 mL PBS at pH 5.3 and pH 7.4 respectively, and vibrated at 200 rpm in a 37 °C water bath. Then, separating with a permanent magnet rapidly at a specific time point, and taking the supernatant to measure the fluorescence intensity at 558 nm. Besides, in order to investigate the effect of NIR on drug releasing of DOX, the drug releasing performance of DOX from MGO-MDP–FA was researched with or without NIR (808 nm, 2.0 W cm−2) light irradiation at different time points at pH 5.3 for 5 min and the amount of drug releasing was calculated by the following eqn (2):
 | (2) |
2.8 Biocompatibility and stability
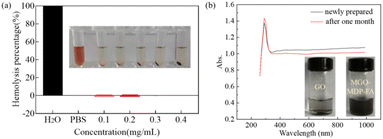
The biocompatibility of MGO-MDP–FA was evaluated by hemolysis test in vitro. Briefly, 2.0 mL mouse blood was taken out and centrifuged at 4000 rpm for 30 min to obtain red blood cells, and then washed with PBS solution for three times and diluted with PBS. Then, 200 μL red blood cell was added to 1.0 mL deionized water or 1.0 mL PBS as the positive control and the negative control, respectively. Afterwards, adding 200 μL red blood cell to 1.0 mL MGO-MDP–FA solution with different concentrations (0.1–0.4 mg mL−1) as experimental groups. Subsequently, incubating at 37 °C for 5 h and then centrifuged at 3000 rpm for 10 min. Finally, measuring the absorbance of the supernatant at 541 nm and calculated the hemolysis rate according to the following eqn (3):
 | (3) |
We also evaluated the stability of MGO-MDP–FA and MGO-MDP–FA@DOX by comparing the UV-vis spectra of MGO-MDP–FA and MGO-MDP–FA@DOX aqueous solution before and after one month of storage.
2.9 Cellular uptake of MGO-MDP–FA@DOX
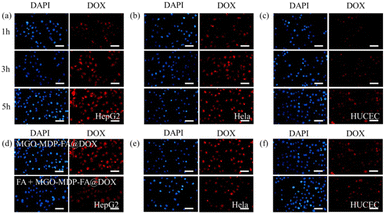
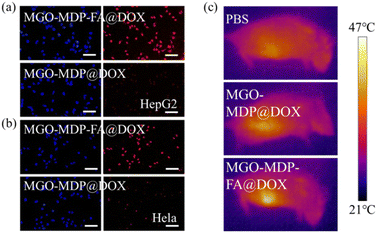
Human hepatocellular carcinoma cells (HepG2), cervical carcinoma cells (HeLa), and normal cervical epithelial cells (HUCEC) were seeded into 12-well plates at a density of 5 × 10⁴ cells per well. After attaching to the wall, cells were incubated with MGO-MDP–FA@DOX (10 μg mL−1) for 1 h, 3 h and 5 h, respectively. Furthermore, to evaluate the influence of FA on cell uptake properties, we firstly incubated cells with or without FA for 1 h, then incubated cells with MGO-MDP–FA@DOX at 37 °C for 5 h. Following by a washing step with PBS, cells were fixed by 4% paraformaldehyde at room temperature. After another washing step with PBS, the staining was performed with DAPI for 6 min. Finally, the cellular uptake of MGO-MDP–FA@DOX was observed under inverted fluorescence microscope. In addition, MGO-MDP without modification of FA was synthesized as a control to further evaluate the tumor targeting of FA by comparing the cellular uptake capacity of tumor cells for MGO-MDP and MGO-MDP–FA.We further verified the in vivo tumor targeting ability of MGO-MDP–FA@DOX by intravenous injection. C57 mice (4 weeks, Shanxi Jietman Biotechnology Co., Ltd) were injected subcutaneously with U14 cells on the right hind limb and then randomly divided into 3 groups: (i) PBS; (ii) MGO-MDP; (iii) MGO-MDP–FA. When the tumor volume increased to about 100 mm3, each group of mice were intravenously injected with the above corresponding formula. After injection for 24 h, each group was irradiated with NIR for 5 min. Then, infrared thermal camera was used for photothermal imaging of mouse tumor sites.
2.10 Evaluation of cytotoxicity in vitro
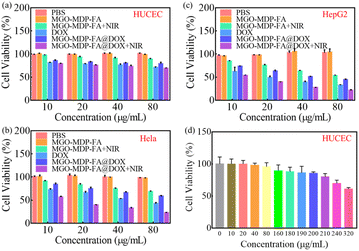
The vitro cytotoxicity of MGO-MDP–FA and the tumor cell killing efficiency of MGO-MDP–FA@DOX were carried out on HepG2, HeLa and HUCEC by Cell Counting Kit-8 (CCK-8). Firstly, cells were seeded into 96-well plates at a density of 1 × 10⁴ cells per well. After incubating overnight, cells were treated with 100 μL fresh medium containing PBS, MGO-MDP–FA, DOX, MGO-MDP–FA@DOX, MGO-MDP–FA + NIR, MGO-MDP–FA@DOX + NIR each at different concentrations (10, 20, 40, 80 μg mL−1) and incubated for 12 h in 37 °C, the groups requiring lighting treatment among them were stimulated with NIR (808 nm, 2.0 W cm−2) for 10 min. After that, replacing the old culture medium with the fresh culture medium containing CCK-8 and incubating for 1 h. The absorbance of cells in each well at 450 nm was detected with an enzyme-linked immunoassay. Finally, the cells without any treatment were used as the control group, and the relative survival rate of cells in each group was calculated according to eqn (4):
 | (4) |
2.11 PTT/chemotherapy effect of MGO-MDP–FA@DOX
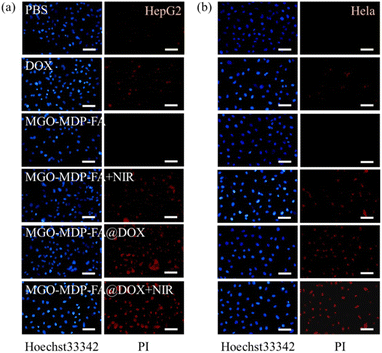
In order to further evaluate the PTT/Chemotherapy effect of MGO-MDP–FA@DOX in vitro, we analyzed the apoptosis and necrosis of cancer cells induced by MGO-MDP–FA@DOX using the Apoptosis and Necrosis Assay Kit (double staining method with Hoechst 33342 and PI). In brief, HepG2 and HeLa cells were inoculated in the 12-well plate at a density of 5 × 10⁴ cells per well and divided into the following 6 groups: (i) PBS; (ii) MGO-MDP–FA; (iii) DOX; (iv) MGO-MDP–FA@DOX; (v) MGO-MDP–FA + NIR; (vi) MGO-MDP–FA@DOX + NIR. After adhering to the wall, cells were treated with culture medium containing above formula (10 μg mL−1) for 24 h respectively, and the groups that needed lighting treatment were irradiated with NIR (808 nm, 2.0 W cm−2) for 10 min. After that, staining cells with cell diluting fluid contains Hoechst 33342 (5.0 μL) and propidium iodide (PI, 5.0 μL) for 30 min under ice bath conditions. Finally, the inverted fluorescent microscope was observed the blue/red fluorescence of cancer cells under an inverted fluorescent microscope was used to observe the fluorescence of cells.3. Results and discussion
3.1 Characterization of MGO-MDP–FA
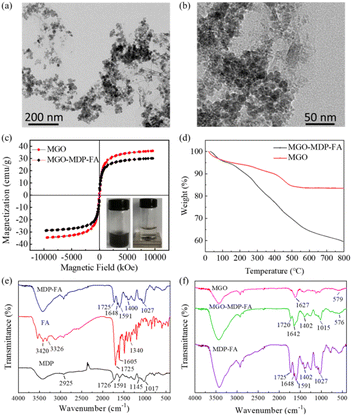
TEM images showed that MGO presented as a sheet structure and decorated with abundant Fe3O4 MNPs, which were nearly spherical in shape and uniform in size uniformly distributed on the surface of MGO with an average particle size of 11 ± 2 nm (Fig. 1a and S1†). After removing the unbound MDP–FA, the MGO-MDP–FA was obtained with the average size of 342 nm as examined by DLS (Fig. S2†). As shown in Fig. 1b, the dispersion of MGO was slightly enhanced and the morphology of MGO was not obviously changed after modifying with MDP and FA compared with the undecorated MGO. The results of hysteresis regression curve showed that the saturation magnetization value of MGO-MDP–FA (30.18 emu g−1) was slightly lower than that of MGO (36.26 emu g−1), which might be due to the successful modification of MDP and FA (Fig. 1c). In addition, the XRD diffraction pattern of the MGO was showed in Fig. S3,† which in accordance with our previous work and six characteristic peaks at 2θ of MGO corresponding to the standard XRD data cards of Fe3O4 crystal (JCPDS no. 85-1436).43,44FTIR spectra were measured to further verify the successful synthesis of MDP–FA and MGO-MDP–FA (Fig. 1e and f). For the spectra of MDP, the wide peak in the range of 3200–3600 cm−1 could be ascribed to the association peak of hydrogen bond and the peak at 2925 cm−1 could be confirmed as the stretching vibration of –C–H on the sugar ring skeleton. The vibration coupling peaks of –C–C at 1154 cm−1 and the anti-symmetric stretching vibration peak of C–O–C at 1017 cm−1 suggested that the existence of MD structure. In addition, the peak at 1725 cm−1 should be contributed to the stretching vibration of C![[double bond, length as m-dash]](https://www.rsc.org/images/entities/char_e001.gif) O of the carboxyl group of the PDA and the peak at 1591 cm−1 should be duo to the stretching vibration of C
O of the carboxyl group of the PDA and the peak at 1591 cm−1 should be duo to the stretching vibration of C![[double bond, length as m-dash]](https://www.rsc.org/images/entities/char_e001.gif) C, which proved that the MD was successfully cross-linked with PDA. In the FITR spectra of MDP–FA, the stretching vibration of C
C, which proved that the MD was successfully cross-linked with PDA. In the FITR spectra of MDP–FA, the stretching vibration of C![[double bond, length as m-dash]](https://www.rsc.org/images/entities/char_e001.gif) O bond of the carboxyl group at 1725 cm−1, the stretching vibration of C
O bond of the carboxyl group at 1725 cm−1, the stretching vibration of C![[double bond, length as m-dash]](https://www.rsc.org/images/entities/char_e001.gif) O of the amide bond at 1648 cm−1 and the stretching vibration of C–N at 1400 cm−1 indicated that FA was successfully grafted onto the MDP surface. In the FITR spectrum of MGO-MDP–FA, there was a new peak at 1642 cm−1, which should be attributed to the stretching vibration of the C
O of the amide bond at 1648 cm−1 and the stretching vibration of C–N at 1400 cm−1 indicated that FA was successfully grafted onto the MDP surface. In the FITR spectrum of MGO-MDP–FA, there was a new peak at 1642 cm−1, which should be attributed to the stretching vibration of the C![[double bond, length as m-dash]](https://www.rsc.org/images/entities/char_e001.gif) O bond of the amide group. The peak at 1015 cm−1 could be ascribed to the stretching vibration of C–O–C of MDP. And the peak at 576 cm−1 was probably cause by the stretching vibration of Fe–O in MGO,43,44 which indicated that MGO-MDP–FA was successfully prepared.
O bond of the amide group. The peak at 1015 cm−1 could be ascribed to the stretching vibration of C–O–C of MDP. And the peak at 576 cm−1 was probably cause by the stretching vibration of Fe–O in MGO,43,44 which indicated that MGO-MDP–FA was successfully prepared.
As shown in Fig. 1d, TGA was performed to further prove the successful preparation of the nanocomposite MGO-MDP–FA (heating rate was 10 °C min−1). For the curve of MGO, the total weight loss was estimated to be 18% from 25 °C to 800 °C. The slight weight loss at low temperatures (<200 °C) might be attributed to the volatilization of residual water and solvent, the mass loss of 200–500 °C was likely to be attributed to the removal of the oxygen-containing functional groups of GO and the damage of –OH groups on the surface of Fe3O4, and the left after 500 °C was likely to be Fe3O4 nanoparticles which are not easy to decompose.45,46 According to the TGA diagram of MGO in air, the relative content of Fe3O4 nanoparticles in the composite was calculated to be 80% (Fig. S4†). However, for the MGO-MDP–FA, the total weight loss was estimated to be 40.48% from 25 °C to 800 °C. In the same condition, 29.18% of significant weight loss of MGO-MDP–FA in the range of 200–600 °C could be attributed to the decomposition of MDP and FA on the surface of MGO, and the further weight loss in the high temperature region (about 600–800 °C) was due to the skeleton damage of GO. Compared with the MGO, the much higher weight loss of MGO-MDP–FA was further demonstrated the successful grafting of MDP and FA on the MGO.
3.2 Photothermal performance of MGO-MDP–FA
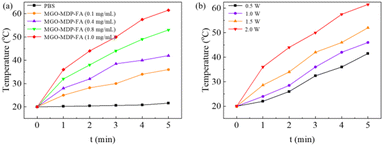
To evaluate the photothermal performance of MGO-MDP–FA, we monitored the real-time temperature of MGO-MDP–FA in PBS irradiating with 808 nm NIR laser by the infrared thermal imaging system. As shown in Fig. 2a, the temperature changed from 21.6 °C to 61.5 °C as the concentration of MGO-MDP–FA changed from 0 mg mL−1 to 1.0 mg mL−1 with the irradiation of near-infrared laser (808 nm, 2.0 W cm−2) for 5 min. In addition, the temperature of MGO-MDP–FA in PBS at the same concentration also rose with the increase of the laser power intensity (Fig. 2b). With the NIR laser irradiation intensity increased from 0.5 W cm−2 to 2.0 W cm−2, the temperature of MGO-MDP–FA solution at the same concentration rose from 41.5 °C to 61.5 °C. The above results demonstrated that the photothermal conversion efficiency of MGO-MDP–FA was concerned with solution concentration and laser irradiation intensity.Furthermore, we measured the photothermal effect of Fe3O4, GO and MGO respectively. As shown in the Fig. S5,† the photothermal effect of MGO is stronger than that of Fe3O4 and GO, and the photothermal effect of Fe3O4 is similar to GO. This result indicated that both Fe3O4 and GO have good photothermal conversion efficiency, and equally contribute to the photothermal effect of MGO.
3.3 Drug loading capacity of MGO-MDP–FA for DOX
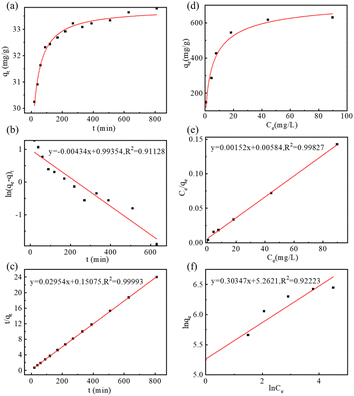
As a multifunctional drug carrier, the drug loading capacity of MGO-MDP–FA was researched by fluorescence spectroscopy. As shown in Fig. S6,† in the concentration range of 5 × 10⁻⁴–5 × 10⁻³ mg mL−1, DOX had a good calibration curve (R2 = 0.9938), which was used for subsequent calculation. Firstly, we researched the drug adsorption kinetic by measuring the loading quantity of DOX on MGO-MDP–FA with time-variation. As shown in Fig. 3a, the adsorption rate was the fastest as the initial DOX concentration was high in the first 200 min, the adsorption rate gradually slowed down as the concentration of DOX decreased within 200–400 min, and the adsorption was almost saturated and the adsorption rate was much at one after 400 min. Furthermore, Lagergren's pseudo-first-order kinetic model (eqn (S1)†) and Ho's pseudo-second-order kinetic model (eqn (S2)†) were used to study the probable drug adsorption mechanism. According to the linear fitting curves of Lagergren's pseudo-first-order kinetic model (Fig. 3b) and Ho's pseudo-second-order kinetic model (Fig. 3c), the kinetic parameters of two models were presented in Table S1.† It was obvious that the drug adsorption process of DOX onto MGO-MDP–FA was well corresponded with the Ho's pseudo-second-order kinetic model (R2 = 0.99993), and the qe value calculated following the Ho's pseudo-second-order kinetic model was nearer to the maximum drug loading in experiment, which indicated that chemical adsorption played a leading role in the interaction between DOX and MGO-MDP–FA probably focused on hydrogen bonding and π–π interaction.In addition, the adsorption isotherm of MGO-MDP–FA for DOX was measured to determine the drug loading amount and explore the possible drug loading mechanism. As shown in Fig. 3d, the drug loading efficiency of DOX on MGO-MDP–FA gradually improved with the increase of DOX concentration. Moreover, the adsorption isotherm process was evaluated by the single-layer Langmuir isotherm adsorption model (eqn (S3)†) and the multi-layer Freundlich isotherm adsorption model (eqn (S4)†), the corresponding linear fitting curves of two models were displayed respectively in Fig. 3e and f, and the relevant parameters of two models was revealed in Table S2.† Compared with the Freundlich adsorption model, the isotherm adsorption process of DOX onto MGO-MDP–FA was more in line with the Langmuir adsorption model (R2 = 0.99827), which indicated that the drug adsorption process was inclined to single-layer adsorption. In addition, the maximum drug loading amount of MGO-MDP–FA for DOX calculated via Langmuir adsorption model reached to 657.9 mg g−1 and the drug loading capacity (DLC) of MGO-MDP–FA was 39.68 wt%, which was considerably higher than that of the previously reported at the same concentration of DOX.19,20
3.4 Drug releasing performance of MGO-MDP–FA
The release behavior of DOX from MGO-MDP–FA in PBS with pH 5.3 and pH 7.4 at 37 °C was investigated by fluorescence spectroscopy. As shown in Fig. 4a, the release amount of DOX increased with the extension of time, but the drug releasing efficiency had no significant difference between PBS with pH 7.4 and PBS with pH 5.3. This phenomenon might be attributed to the tight connection between the drug and the nanocarrier, and the pH had no obvious effect on the interaction between them.Furthermore, considering tumor tissue is an acidic environment and the excellent photothermal conversion effect of MGO, we investigated the NIR-stimulative drug releasing of DOX from MGO-MDP–FA at pH 5.3 under the NIR laser irradiation for 5 min. As revealed in Fig. 4b, the drug release amount reached up to 50.24% under the irradiation of NIR, which was 1.84-fold than that without NIR irradiation at pH 5.3. Therefore, the NIR-stimulative drug releasing performance indicated that local high temperature induced by photothermal effect could promote the release of drugs at the tumor site and enhanced effect of chemotherapy, which provided the possibility for the chemo-photothermal co-treatment of tumors.
3.5 Biocompatibility and stability
Good blood compatibility is the precondition to ensure the nanometer drug carrier enter the organism smoothly and functioning normally.47 The hemolysis analysis of MGO-MDP–FA was performed to evaluate the blood compatibility in vitro. The percentage of hemolysis and the corresponding image of hemolysis were showed in Fig. 5a. Compared with the negative control group, there were no obvious hemolysis phenomenon within a certain concentration range (0.1–0.4 mg mL−1), and the percentage of hemolysis was less than one percent as the concentration of MGO-MDP–FA up to 0.4 mg mL−1. This demonstrated that our synthesized nano-drug carrier MGO-MDP–FA had excellent blood compatibility, which provided a powerful piece of evidence for the safe existence of MGO-MDP–FA nano-drug vector in vitro.In addition, we evaluated the stability of the MGO-MDP–FA in vitro through comparing the UV-vis absorption spectrum of the newly prepared MGO-MDP–FA aqueous solution and the MGO-MDP–FA aqueous solution placed for one month. As shown in Fig. 5b, there was no significant difference between the UV-vis spectra of newly prepared and placed for one month, indicating that MGO-MDP–FA had well stability in vitro over a long period of time. Furthermore, there was no significant change in UV absorption of MGO-MDP–FA@DOX solution after one month at room temperature, indicating that DOX had no obvious leakage and MGO-MDP–FA@DOX had good stability (Fig. S7†).
3.6 Anti-tumor activity of MGO-MDP–FA in vitro
To further verify the targeting ability of MGO-MDP–FA@DOX for cancer cell, three kinds of cells were co-cultured with MGO-MDP–FA@DOX + FA for 5 h. As shown in Fig. 6d and e, compared with co-cultured with the MGO-MDP–FA@DOX for 5 h, HepG2 cells and HeLa cells treated with MGO-MDP–FA@DOX + FA showed relatively weak red fluorescence and only few of the cells had red fluorescence. However, there were no distinct difference of red fluorescence between MGO-MDP–FA@DOX and MGO-MDP–FA@DOX + FA in HUCEC cells (Fig. 6f). It demonstrated that the addition of FA inhibited the uptake of MGO-MDP–FA@DOX by HepG2 cells and HeLa cells, which indicated that modification with FA could significantly enhance the cancer cell targeting ability of the MGO-MDP–FA@DOX. In addition, the intracellular red fluorescence intensity of the MGO-MDP–FA with modification of FA was stronger than that of the MGO-MDP without modification of FA in HepG2 and HeLa cells, indicating that the amount of MGO-MDP–FA entering tumor cells was more than that of MGO-MDP, further demonstrating the active tumor targeting effect of FA (Fig. 7a and b).
The purpose of nano-drug delivery system is to deliver the moderate amounts of drugs to the right place at the proper time, so as to improve the efficiency of drug utilization and reduce the toxic side effects on normal tissues. Therefore, we evaluated the tumor targeting ability of MGO-MDP and MGO-MDP–FA in vivo. As shown in Fig. 7c, it could be observed that the temperature at the tumor site of mice in the MGO-MDP–FA group (46.9 °C) was significantly higher than that in the PBS group (38.3 °C) and the MGO-MDP group (40.8 °C). This result indicated that MGO-MDP can be passively targeted to the tumor site through EPR effect, and the MGO-MDP–FA group could further concentrate in the tumor site as the modification of FA with active targeting the tumor, which was consistent with the results of in vitro experiments, and further demonstrated the tumor targeting effect of MGO-MDP–FA in vivo.
4. Conclusion
To sum up, a novel nano-drug delivery system MGO-MDP–FA was successfully constructed in this paper for dual-targeted chemo-photothermal therapy of cancer. The nano-drug carrier combined the targeting effect of FA on cancer cells and the magnetic targeting effect of MGO, which ensured that the nano-drug carrier can accurately target cancer cells and reduce the toxic side effects on the surrounding normal tissues. In addition, the large specific surface area of MGO nanomaterials and the modification of MDP polymer enabled the nano-drug carrier to effectively load a large number of anticancer drugs, and it also has the NIR-stimulating release performance. Based on the excellent photothermal conversion efficiency of MGO nanomaterials, MGO-MDP–FA could be used in the synergistic treatment of cancer chemotherapy and photothermal therapy in vitro. In brief, the novel nano-drug delivery system had potential applications in the integration of cancer diagnosis and treatment.Conflicts of interest
There are no conflicts to declare.Acknowledgements
This work was financially supported by the National Natural Science Foundation of China (No. 21976113), the Basic Research Project of Shanxi Province (No. 202103021224240, 202103021224238, 20210302123322), and Research Project Supported by Shanxi Scholarship Council of China (No. 2021-081).References
- H. S. Han and K. Y. Choi, Biomedicines, 2021, 9, 305 CrossRef CAS PubMed.
- J. Q. Chen, C. Y. Ning and Z. N. Zhou, et al, Prog. Mater. Sci., 2019, 99, 1–26 CrossRef CAS PubMed.
- V. D. Nguyen, H. K. Min and D. H. Kim, et al, ACS Appl. Mater. Interfaces, 2020, 12, 10130–10141 CrossRef CAS PubMed.
- X. Y. Deng, H. Liang and W. B. Yang, et al, J. Photochem. Photobiol., B, 2020, 208, 111913 CrossRef CAS PubMed.
- Q. Li, L. Hong and H. H. Li, et al, Biosens. Bioelectron., 2017, 89, 477–482 CrossRef CAS PubMed.
- K. J. Lagos, H. H. Buzzá and V. S. Bagnato, et al., Int. J. Mol. Sci., 2021, 23, 22 CrossRef PubMed.
- X. J. Liu, I. Marangon and G. Melinte, et al., ACS Nano, 2014, 8, 11290–11304 CrossRef CAS.
- R. Singh and S. V. Torti, Adv. Drug Delivery Rev., 2013, 65, 2045–2060 CrossRef CAS PubMed.
- A. Granja, M. Pinheiro and C. T. Sousa, et al., Biochem. Pharmacol., 2021, 190, 114639 CrossRef CAS PubMed.
- H. S. Kim and D. Y. Lee, Polymers, 2018, 10, 961 CrossRef PubMed.
- R. S. Riley and E. S. Day, Wiley Interdiscip. Rev.: Nanomed. Nanobiotechnol., 2017, 9, 1449 Search PubMed.
- Y. L Dai, H. T. Bi and X. R. Deng, et al, J. Mater. Chem. B, 2017, 5, 2086–2095 RSC.
- Z. X. Zhao, Y. Z. Huang and S. G. Shi, et al, Nanotechnology, 2014, 25, 285701 CrossRef CAS PubMed.
- R. Riedel, N. Mahr and C. Y. Yao, et al, Nanoscale, 2020, 12, 3007–3018 RSC.
- D. D. Chai, B. J. Hao and R. Hu, et al, ACS Appl. Mater. Interfaces, 2019, 11, 22915–22924 CrossRef CAS PubMed.
- J. Beik, Z. Alamzadeh and M. Mirrahimi, et al, ACS Appl. Bio Mater., 2021, 4, 4280–4291 CrossRef CAS PubMed.
- L. Yang, T. H. Kim and H. Y. Cho, et al, Adv. Funct. Mater., 2021, 31, 2006918 CrossRef CAS PubMed.
- K. Kostarelos, A. Bianco and M. Prato, Nat. Nanotechnol., 2009, 4, 627–633 CrossRef CAS.
- S. Y. Madani, N. Naderi and O. Dissanayake, et al., Int. J. Nanomed., 2011, 6, 2963–2979 CAS.
- C. Wells, O. Vollin-Bringe and V. Fiegel, et al., Adv. Funct. Mater., 2018, 28, 1706996 CrossRef.
- S. J. Cheng, H. Y. Chiu and P. V. Kumar, et al, Biomater. Sci., 2018, 6, 813–819 RSC.
- K. Vinothini, N. K. Rajendran and A. Ramu, et al, Biomed. Pharmacother., 2019, 110, 906–917 CrossRef CAS PubMed.
- R. K. Thapa, J. Y. Choi and B. K. Poudel, et al, Int. J. Nanomed., 2016, 11, 2799–2813 CAS.
- H. Chen and E. Ruckenstein, J. Phys. Chem. Lett., 2014, 5, 2979–2982 CrossRef CAS PubMed.
- K. Wang, J. Ruan and H. Song, et al, Nanoscale Res. Lett., 2010, 6, 8 CrossRef PubMed.
- N. Karki, H. Tiwari and M. Pal, et al, Colloids Surf., B, 2018, 169, 265–272 CrossRef CAS PubMed.
- T. Figueroa, C. Aguayo and K. Fernández, Int. J. Nanomed., 2020, 15, 1229–1238 CrossRef CAS PubMed.
- P. M. Sivakumar, M. Islami and A. Zarrabi, et al, Anti-Cancer Agents Med. Chem., 2020, 20, 1340–1351 CrossRef CAS PubMed.
- R. Ferrari, G. Storti and M. Morbidelli, J. Polym. Sci., 2020, 58, 1642–1654 CrossRef CAS.
- A. Das, S. Ray and U. Raychaudhuri, et al, Int. Food Res. J., 2017, 24, 720–725 CAS.
- N. Wathoni, S. Uray and C. Insani, J. Appl. Pharm. Sci., 2013, 3, 68–71 CAS.
- S. Yan, J. Ren and Y. Jian, et al, Biomacromolecules, 2018, 19, 4554–4564 CrossRef CAS PubMed.
- A. B. Shreya, S. Y. Raut and R. S. Managuli, AAPS PharmSciTech, 2018, 20, 15 CrossRef CAS.
- M. M. Agwa and S. Sabra, Int. J. Biol. Macromol., 2021, 167, 1527–1543 CrossRef CAS PubMed.
- B. Liu, W. Yang and C. Che, et al, ChemistryOpen, 2021, 10, 408–413 CrossRef CAS PubMed.
- X. Geng, D. Gao and D. Hu, et al, ACS Appl. Mater. Interfaces, 2020, 12, 55624–55637 CrossRef CAS PubMed.
- Y. Xu, H. Wu and J. Huang, et al., Theranostics, 2020, 10, 2479–2494 CrossRef CAS.
- P. Sun, N. Zhang and Y. Tang, et al, Int. J. Nanomed., 2017, 12, 2657–2672 CrossRef CAS PubMed.
- S. B. Ghaffari, M. H. Sarrafzadeh and Z. Fakhroueian, et al, Mater. Sci. Eng., C, 2019, 103, 109827 CrossRef CAS PubMed.
- W. Liang, C. Yang and D. Zhou, et al, Chem. Commun., 2013, 49, 3510–3512 RSC.
- W. Liang, Y. Huang and D. Lu, et al, Polymers, 2019, 11, 133 CrossRef PubMed.
- C. Wen, R. Cheng and T. Gong, et al, Colloids Surf., B, 2020, 199, 111510 CrossRef PubMed.
- X. Wang, Q. Ma and C. Wen, et al, RSC Adv., 2021, 11, 39804–39812 RSC.
- T. Gong, X. Wang and Q. Ma, et al, J. Inorg. Biochem., 2021, 223, 111558 CrossRef CAS PubMed.
- Y. H. Zhou, L. L. Sun and H. X. Wang, et al, Mater. Chem. Phys., 2016, 170, 83–89 CrossRef CAS.
- T. Gong, Y. H. Zhou and L. L. Sun, et al, RSC Adv., 2016, 6, 80955–80963 RSC.
- H. Zhang, Y. Li and Z. Pan, et al, Mol. Pharm., 2019, 16, 1982–1998 CrossRef CAS PubMed.
Footnotes |
| † Electronic supplementary information (ESI) available: TEM images of MGO. Size distribution of MGO-MDP-FA measured by DLS. XRD of MGO. TGA curves of MGO in air. Temperature change curves of Fe3O4, GO and MGO solution with the concentration of 1.0 mg mL−1 under NIR laser irradiation (808 nm, 2.0 W cm−2) for 0–5 min recorded by the thermal camera. Plot of calibration curves for DOX solution with different concentration. UV-Vis spectra of newly prepared MGO-MDP-FA@DOX aqueous solution placed for one month. The drug adsorption kinetic parameters for DOX on MGO-MDP–FA corresponded with Lagergren's pseudo-first-order model and Ho's pseudo-second-order model. Relevant parameters of Langmuir isotherm and Freundlich isotherm adsorption models for DOX by MGO-MDP–FA. See DOI: https://doi.org/10.1039/d3ra02306k |
| ‡ These authors contributed equally. |
| This journal is © The Royal Society of Chemistry 2023 |

