 Open Access Article
An ultrasensitive “mix-and-detect” kind of fluorescent biosensor for malaoxon detection using the AChE-ATCh-Ag-GO system†
Vinotha Alex. A and
Amitava Mukherjee *
*
Centre for Nanobiotechnology, Vellore Institute of Technology, Vellore 632014, India. E-mail: amit.mookerjea@gmail.com; amitav@vit.ac.in; Tel: +91 416 2202620
First published on 9th May 2023
Abstract
Malaoxon, a highly toxic metabolite of malathion, can lead to severe harm or death if ingested. This study introduces a rapid and innovative fluorescent biosensor that relies on acetylcholinesterase (AChE) inhibition for detecting malaoxon using Ag-GO nanohybrid. The synthesized nanomaterials (GO, Ag-GO) were evaluated with multiple characterization methods to confirm their elemental composition, morphology, and crystalline structure. The fabricated biosensor works by utilizing AChE to catalyze the substrate acetylthiocholine (ATCh), which generates positively charged thiocholine (TCh) and triggers citrate-coated AgNP aggregation on the GO sheet, leading to an increase in fluorescence emission at 423 nm. However, the presence of malaoxon inhibits the AChE action and reduces the production of TCh, resulting in a decrease in fluorescence emission intensity. This mechanism allows the biosensor to detect a wide range of malaoxon concentrations with excellent linearity and low LOD and LOQ values of 0.001 pM to 1000 pM, 0.9 fM, and 3 fM, respectively. The biosensor also demonstrated superior inhibitory efficacy towards malaoxon compared to other OP pesticides, indicating its resistance to external influences. In practical sample testing, the biosensor displayed recoveries of over 98% with extremely low RSD% values. Based on the results obtained from the study, it can be concluded that the developed biosensor has the potential to be used in various real-world applications for detecting malaoxon in food, and water samples, with high sensitivity, accuracy, and reliability.
1. Introduction
Currently, organophosphorus (OPs) pesticides are being harnessed to upsurge agricultural yield and lessen crop losses by eliminating unsolicited insects, worms, animals, and disease-carrying organisms in various regions worldwide. Particularly, malathion is a broad-spectrum insecticide containing chiral phosphorus, widely used since 1980 and known to be the fourth most effective pesticide in targeting the nervous system.1 However, its usage has resulted in environmental contamination and irreversible health impacts (genotoxicity, carcinogenicity, neurotoxicity, oxidative stress, etc.), affecting factory workers, farmers, and consumers of contaminated food and water.2 Malathion quickly metabolizes in mammals, plants, and the environment, and its oxidation by-products are the primary source of its toxicity.3Malaoxon, a potent metabolite, can result from hydrolysis in high/low relative humidity conditions, causing thion to oxidize into oxon compounds on water and fruit/vegetable surfaces.4,5 Malaoxon's toxic effects result from inhibiting the enzyme acetylcholinesterase (AChE), leading to an accumulation of acetylcholine (ACh), which can overstimulate muscarinic and nicotinic receptors, resulting in cholinergic toxic manifestations and ultimately death. Malaoxon is 40 times more toxic than malathion and other metabolites, making it a serious health hazard.6,7 Unfortunately, malaoxon residues can also be found in breast milk and can inhibit AChE in offspring, leading to psychological and biological complications.8 Therefore, it is crucial to prioritize the development of quick detection systems for malaoxon in agricultural commodities and environmental specimens, to shield both human health and the ecosystem from its deleterious consequences.
Presently, electrophoresis, electrochemical, immunosorbent assays, chromatography techniques, and so on, have been employed to monitor malaoxon in food and environmental specimens. Despite their sensitivity and selectivity, these methods have drawbacks such as high maintenance expenses, complex procedures and demanding trained operators, time-consuming, and lengthy pre-treatment that make them impractical. This led to a compelling urge for the development of quick detection methods, especially in urgent situations. In recent times, detecting techniques based on acetylcholinesterase (AChE) inhibition have gained attention due to their simplicity, accuracy, precision, speed, and specificity. With this approach, both AChE activity and OPs pesticides can be quantitatively measured indirectly by analyzing thiocholine (TCh) generation utilizing different signals like colorimetric, fluorescent signals, and so on.9
Significantly, the AChE-based colorimetric detection kit has disadvantages in detecting solely high pesticide concentrations and is susceptible to false positives when examining samples containing plant secondary substances. Additionally, the actual sample's background color may interfere with the analysis.10 In contrast, fluorometric biosensors offer the benefits of being straightforward, swift, accurate, and exceptionally sensitive when analyzing samples, rendering them an ideal choice for analyzing OPs pesticides using the AChE-inhibition strategy.11,12 Metal nanoparticle (NP)-based sensors have recently gained interest in pesticide detection due to their appealing optical, catalytic, and electrical properties. Out of the metallic NPs, silver NPs (AgNPs) are particularly attractive for their excellent sensing capabilities, biocompatibility, and photochemistry.
Moreover, AgNPs have been previously utilized for the fluorometric detection of OPs pesticides and other pollutants without the need for any external fluorophore or additional surface modification.13,14 The size, shape, and number of silver atoms in a cluster of AgNPs can significantly impact their fluorescence emission (FE),15,16 which is a crucial factor in their ability to detect pesticides. Noticeably, AgNPs tend to agglomerate and tarnish in the colloidal phase, this trait may potentially compromise their stability and durability, which can in turn affect their sensing abilities.17 To overcome these issues, different methods have been devised to stabilize AgNPs, including the deposition of the AgNPs on stable substrates like polymers, silica, or graphene oxide (GO). The objective of the current study was to entrap AgNPs onto GO sheets, as GO is known for its hydrophilicity, high surface area, mechanical strength, electrical conductivity, thermal stability, and chemical reactivity. In recent times, various detection approaches have been established for analyzing malaoxon.18–21 For instance, Zuo et al., have fabricated molecularly imprinted polymer solid phase extraction using TiO2 nanowires for the determination of malaoxon (LOD – 0.01 mg L−1).18 Hua and co-workers have proposed the enantiomer separation method for malaoxon analysis (LOD – 0.08 μg kg−1) using acetonitrile/water or methanol/water.19 Additionally, Celebanska et al., have constructed an electrochemical-based sensor for detecting malaoxon (LOD – 0.25 nM) using carbon NPs.21 Despite the achievement of a low detection limit in the aforementioned studies, the detection methods employed intricate protocols involving immobilization and pre-treatment steps.
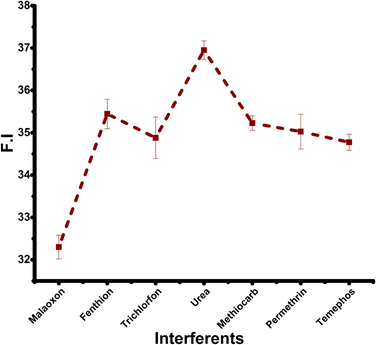
To the best of our knowledge, there were no prior reports on a “mix-and-detect” kind of fluorescence biosensor, that relies on AChE inhibition to detect malaoxon using a stable Ag-GO nanocomposite. This biosensor operates by using the enzyme AChE to hydrolyze the substrate acetylthiocholine (ATCh), which generates TCh, a positively charged molecule that influences the aggregation of citrate-coated AgNPs on the GO sheet, resulting in the FE enhancement. However, the presence of malaoxon inhibits AChE, leading to a decrease in TCh molecules and fewer AgNPs aggregation, ultimately causing a decrease in FE intensity at 423 nm. By exploiting this mechanism, we were able to detect a wide range of malaoxon concentrations using the AChE-ATCh-Ag-GO system with excellent linearity, low limit of detection (LOD), and limit of quantification (LOQ) values of 0.001 pM to 1000 pM, 0.9 fM, and 3 fM, respectively. Furthermore, the biosensor showed superior inhibitory efficacy towards malaoxon (0.001 pM) compared to other OPs pesticides (0.1 pM), indicating its anti-influence capability. Practical sample testing of the biosensor resulted in recoveries of >98% with remarkably low RSD% values.
2. Experimental
2.1. Chemicals and reagents
Acetylcholinesterase (AChE, from Electrophorus electricus), acetylthiocholine iodide (ATChI), graphite powder, silver nitrate (AgNO3), phosphorus pentoxide (P2O5), malaoxon (99%) and the commonly used interferents such as trichlorfon (99%), urea (98.8%), temephos (97.5%), permethrin (95%), methiocarb (99.8%), fenthion (98%) were acquired from Sigma Aldrich, India. The iodide ions from ATChI were removed, as explained in our prior study, to improve the sensitivity of the system.22 Acids including sulphuric acid (H2SO4, with a concentration of 25% v/v), hydrochloric acid (HCl), and nitric acid (HNO3, with a concentration of 69–71%) were obtained from Molychem Pvt. Ltd, India. Trisodium citrate (Na3C6H5O7), potassium persulfate (K2S2O8), sodium borohydride (NaBH4), sodium nitrate (NaNO3), and potassium permanganate (KMnO4), were purchased from SRL Pvt. Ltd, India.The stock solution of malaoxon (10−4 M) was prepared using ethanol, followed by further dilution with de-ionized water. The resulting solutions were preserved at 4 °C until required. The AChE and ATCh stock solutions were prepared by utilizing phosphate-buffered saline (PBS) with a pH range of 7–7.4 and a concentration of 10 mM. All glassware used in the experiment was cleaned with an Aqua regia solution consisting of a mixture of HCl and HNO3 in a 3![[thin space (1/6-em)]](https://www.rsc.org/images/entities/char_2009.gif) :
:![[thin space (1/6-em)]](https://www.rsc.org/images/entities/char_2009.gif) 1 ratio. Afterward, the glassware was rinsed with Milli-Q water with a resistivity of 18.2 MΩ cm that was obtained from Cascada bio water (Pall Corporation, USA). Finally, the glassware was dried in a hot air oven. Additional purification was not required for any of the chemicals used in the experiment as they were already of analytical grade.
1 ratio. Afterward, the glassware was rinsed with Milli-Q water with a resistivity of 18.2 MΩ cm that was obtained from Cascada bio water (Pall Corporation, USA). Finally, the glassware was dried in a hot air oven. Additional purification was not required for any of the chemicals used in the experiment as they were already of analytical grade.
2.2. Characterizations
Cary Eclipse fluorescence spectrometer (Agilent Technologies, USA) was utilized to verify the variations in FE intensity of Ag-GO in the presence of enzyme, substrate, and malaoxon. UV-2600 spectrophotometer manufactured by Shimadzu, Tokyo, Japan was used to measure the absorption spectra of prepared GO and Ag-GO. The functional groups of synthesized nanomaterials were examined via Fourier Transform Infra-Red Spectroscopy (FT-IR, Shimadzu, Japan). The morphology, lattice parameters, and elemental composition were investigated with High Resolution-Transmission Electron Microscopy (HR-TEM) (JEOL JEM 2100, Japan), which operated at a voltage of approximately 200 kV.2.3. Malaoxon detection assay
Graphite powder was used as the starting material for synthesizing GO, and GO was prepared using a modified Hummers' method.23 To serve as a fluorescent probe in this study, an Ag-GO nanocomposite was utilized, which was synthesized based on our prior publication.24 To begin with, 0.5 mg of Ag-GO was added to 1 mL of de-ionized water and sonicated for 15 minutes. Next, 400 mU mL−1 of AChE (10 μL) and 130 μM of ATCh (15 μL) were mixed and incubated for 10 minutes. To the above mixture, the dispersed Ag-GO (200 μL) was added, and the final volume was adjusted to 1 mL with Milli-Q water. As a result, the solution changed color from chartreuse to light pink, indicating that the AgNPs had aggregated on GO.To detect malaoxon, AChE was exposed to malaoxon concentrations such as 0.001 pM, 0.01 pM, 0.1 pM, 1 pM, 10 pM, 100 pM, 1000 pM (25 μL), ATCh was then added and incubated for 10 minutes. A consistent incubation time of 10 min was maintained for varying concentrations of malaoxon. Next, 200 μL of dispersed Ag-GO was added to the mixture, and the volume was brought up to 1 mL. The alterations in FE intensity were monitored through spectrofluorimetry, and the system's color stayed the same as chartreuse. The detection method outlined above is incredibly simple and enables the specific and sensitive detection of toxic malaoxon using only a few mixing steps. Unlike other detection methods that necessitate intricate protocols involving immobilization and pre-treatment steps, this technique does not mandate such procedures, rendering it a highly effective and straightforward strategy for detecting malaoxon.
2.4. Malaoxon determination in practical samples
The constructed biosensor was applied for malaoxon detection in real-world samples such as agricultural surplus water, carrot, and grape juice. The analysis was conducted in ambient conditions without modifying pH levels. In the case of agricultural surplus water, samples were collected during the paddy growth phase in Vellore, India, and filtered precisely to remove redundant materials. Subsequently, the working concentrations of malaoxon (1000 pM, 10 pM, and 1 pM) were added to the above samples. Control samples, which did not contain malaoxon, were tested alongside the spiked samples to ensure that any changes observed in the spiked samples were solely due to the presence of malaoxon and not due to other factors.In addition, after the application of OPs, they can penetrate to the tissues of plants and accumulate even more during post-harvest processes like pulping, and juicing. The level of OPs in juices is often higher compared to natural fruits and vegetables, resulting in higher exposure rates when consuming these juices.25,26 Therefore, the current research focuses on examining the presence of malaoxon residues in the extracts of green grapes and carrots, which were purchased from the farmer's market located in Vellore, India. The green grapes and carrots were rinsed with tap water, then distilled water and de-ionized water. They were subsequently dried to remove any remaining moisture at room temperature (RT). From that, 100 grams of each were blended with 10 mL of de-ionized water and then subjected to centrifugation at a speed of 6000 rpm for 15 min. The obtained supernatant was then filtered through syringe filters of 0.45 μm and subsequently with 0.22 μm. To avoid matrix interference, the filtrate obtained from the centrifuged samples was further diluted with de-ionized water at a 1![[thin space (1/6-em)]](https://www.rsc.org/images/entities/char_2009.gif) :
:![[thin space (1/6-em)]](https://www.rsc.org/images/entities/char_2009.gif) 10 ratio. After this, the diluted carrot and grape extracts were added with the malaoxon and investigated using the developed biosensor.
10 ratio. After this, the diluted carrot and grape extracts were added with the malaoxon and investigated using the developed biosensor.
3. Results and discussion
3.1. Nanomaterial characterizations
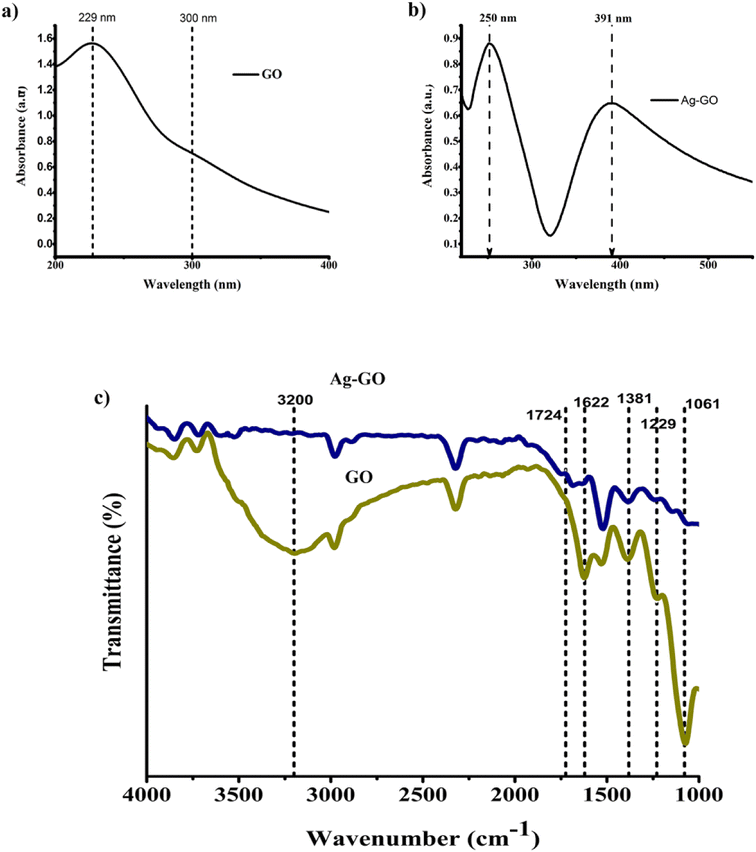
In this study, the modified Hummers' method was utilized to synthesize GO, which contains several oxidation procedures to entrench oxygen-containing functional groups (hydroxyl, carboxyl, and epoxy) on the GO surface.27 Further, the precursor AgNO3 was added to the dispersed GO solution. During this process, the defects and oxygen moieties present on the surface of the GO facilitate the adsorption of Ag+ cations through various mechanisms such as electrostatic attraction, charge transfer, and physical adsorption.28 Then, the reduction (Ag+ cations to Ag0) and the uniform deposition of AgNPs on GO were accomplished with the assistance of NaBH4 (reductant) and Na3C6H5O7 (stabilizer). It is understood that the oxygenated functional groups on the GO surface can also contribute to the stabilization and reduction of the citrate-coated AgNPs.29 Moreover, the synthesized nanomaterials were evaluated with multiple characterization methods to confirm their elemental composition, morphology, and crystalline structure.FT-IR spectroscopy was used to examine the functional groups of the produced GO and Ag-GO. An extensive band witnessed in the range of 2900–3500 cm−1 (Fig. 1c) is caused by the stretching vibration and shift in vibration frequency of O–H groups that are attached to the parent carbon network, extending from the center to the edges of the GO sheet. Furthermore, the broadening of the O–H band can also be attributed to the occurrence of residual H2O molecules located between the GO layers.30 In addition to this, strong C![[double bond, length as m-dash]](https://www.rsc.org/images/entities/char_e001.gif) O and C
O and C![[double bond, length as m-dash]](https://www.rsc.org/images/entities/char_e001.gif) C stretching modes ascribable to GO were represented by the peaks at 1724 and 1622 cm−1, respectively. Bands at 1381 and 1061 cm−1 indicated the presence of C–O in the epoxy and alkoxy groups, respectively. Moreover, C–OH stretching on GO is confirmed by the peak at 1229 cm−1.31 The decrease in the intensity of the aforementioned peaks in the Ag-GO spectrum suggests the GO is partially reduced in the synthesis of Ag-GO and the AgNPs attachment via these oxygen-bearing groups on the GO sheet.32
C stretching modes ascribable to GO were represented by the peaks at 1724 and 1622 cm−1, respectively. Bands at 1381 and 1061 cm−1 indicated the presence of C–O in the epoxy and alkoxy groups, respectively. Moreover, C–OH stretching on GO is confirmed by the peak at 1229 cm−1.31 The decrease in the intensity of the aforementioned peaks in the Ag-GO spectrum suggests the GO is partially reduced in the synthesis of Ag-GO and the AgNPs attachment via these oxygen-bearing groups on the GO sheet.32
Moreover, UV-Visible spectroscopic analysis was employed to confirm the synthesis of prepared GO and Ag-GO. As illustrated in the Fig. 1a, a clear absorption band at 229 nm, indicates the presence of π–π* transitions of aromatic C![[double bond, length as m-dash]](https://www.rsc.org/images/entities/char_e001.gif) C bonds in GO. Additionally, there is a shoulder peak at 300 nm, which corresponds to the n–π* transition of C
C bonds in GO. Additionally, there is a shoulder peak at 300 nm, which corresponds to the n–π* transition of C![[double bond, length as m-dash]](https://www.rsc.org/images/entities/char_e001.gif) O bonds in GO. Fig. 1b displays SPR bands at 250 nm and 391 nm, signifying the effective AgNPs deposition on GO sheet.33 Notably, the absorption peak of GO in the Ag-GO spectra has redshifted by 20 nm, suggesting that there has been a recovery of electronic conjugation within the GO sheet due to the removal of oxygenated groups during Ag+ ions reduction.34,35 These results are consistent with those obtained from FT-IR.
O bonds in GO. Fig. 1b displays SPR bands at 250 nm and 391 nm, signifying the effective AgNPs deposition on GO sheet.33 Notably, the absorption peak of GO in the Ag-GO spectra has redshifted by 20 nm, suggesting that there has been a recovery of electronic conjugation within the GO sheet due to the removal of oxygenated groups during Ag+ ions reduction.34,35 These results are consistent with those obtained from FT-IR.
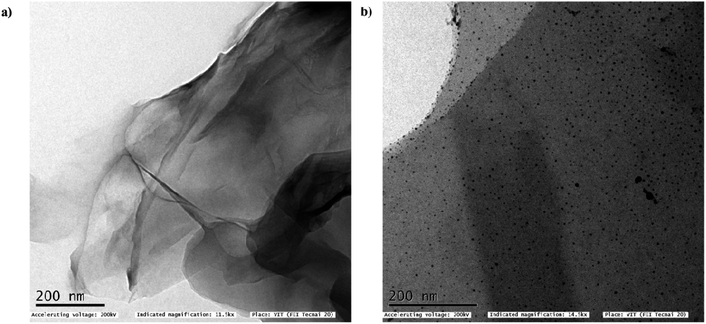
In addition, the thin and crumpled structure of GO nanosheets, and the loading of GO with AgNPs were investigated by means of HR-TEM analysis (Fig. 2a). The micrographs revealed that the creased GO surfaces were evenly sprinkled with round, small-sized AgNPs (Fig. 2b). Interestingly, the distribution of AgNPs was stretched up to the GO's borderline with no noticeable aggregation.
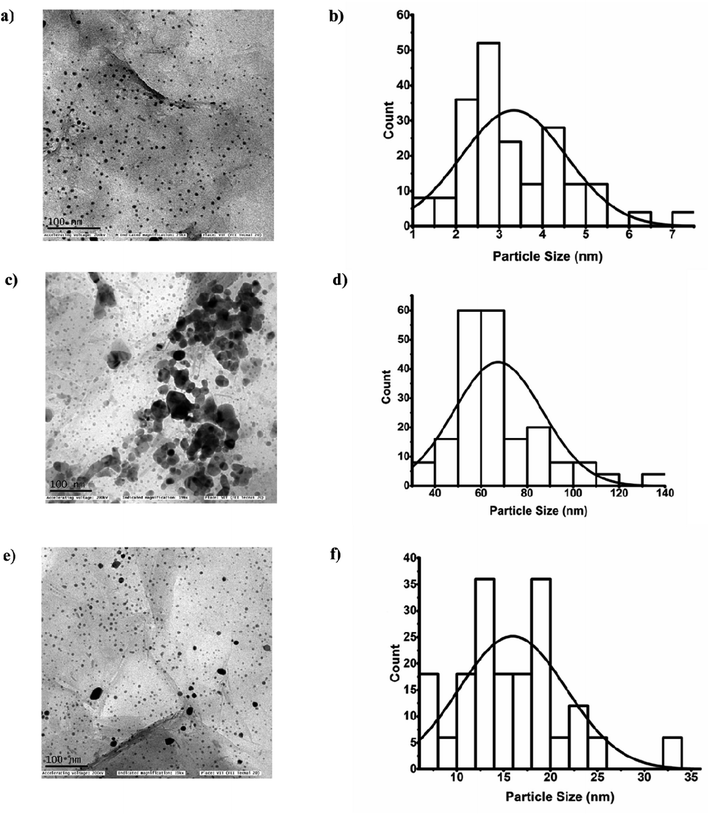
It can be inferred that the confinement of AgNPs impedes their unrestricted movement as well as their release, thereby reducing the likelihood of NP agglomeration.36 The average size of the AgNPs was determined by measuring the diameters of approximately 200 particles on the GO surface using Image J software and the mean diameter was found to be 3.4 ± 1.2 nm (Fig. 5b). The lattice fringe spacing values of fcc Ag were observed through HR-SAED pattern, where the distances were identified to be 0.23 nm, 0.121 nm and 0.144 nm corresponding to (111), (220), and (311) planes, respectively37 (Fig. S1a†). The EDX analysis was used to study the elemental composition and stoichiometry of the synthesized Ag-GO. The spectrum displayed peaks at 0.277, 0.525, 2.307, 1.041, and 3 keV corresponding to C, O, S, Na, and Ag, respectively (Fig. S1b†). These results validated the highly dispersed AgNPs have anchored on GO.38
3.2. Plausible detection principle of malaoxon using AChE-ATCh-Ag-GO
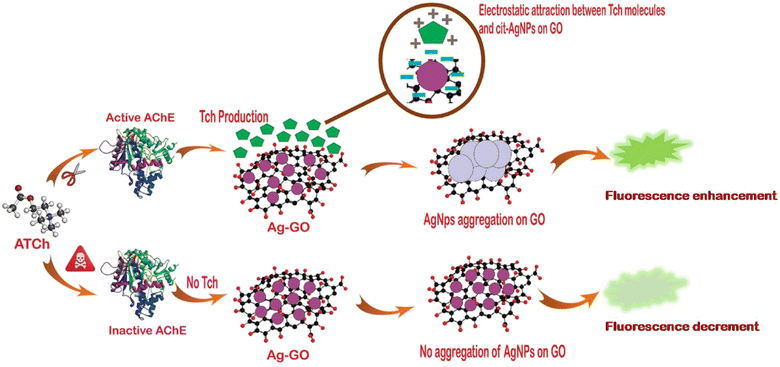
The fabricated bio-sensing platform is composed of an AgNPs (fluorescent probe), which is immobilized on a sturdy support made of a GO sheet, malaoxon (OPs insecticide), ATCh (substrate), and the AChE (enzyme). The fluorometric detection mechanism of malaoxon utilizing AChE-ATCh-Ag-GO is explained schematically in the Fig. 3.Usually, the nanocomposite Ag-GO at an excitation wavelength of 340 nm exhibits a maximum FE band at 423 nm. The conglomeration and the abatement in the particle-to-particle gap of AgNPs on GO in AChE and ATCh occurrence can increase the FE intensity. In other words, as the accretion of the AgNPs on the GO sheet increases, the FE intensity upsurges due to the enhanced scattering around the bigger particles.13,39,40 To put it in simpler terms, tiny colloids are likely to extinguish FE since they absorb light more than they scatter it, whereas larger nanostructures are expected to augment FE due to the domination of the scattering over the absorption component of the extinction spectra. Larger nanostructures are anticipated to demonstrate higher improvements in FE compared to smaller NPs.41–44
It is noteworthy that when excited with a 340 nm wavelength, GO did not exhibit any FE (Fig. S3†).45,46 This lack of FE may be attributed to various factors such as the presence of certain functional groups, the concentration and the size of GO, the surrounding reactants, and the increment in the defect sites.47–49 These factors can contribute to the trapping of excited electrons and the dissipation of their energy through non-radiative processes,50 this results in a lack of FE from the GO when stimulated with a 340 nm wavelength. Additionally, the oxidation rate of graphene nanosheets plays a crucial role in controlling energy level confinement to different degrees, which ultimately affects the FE of GO.46,51,52
As previously described, citrate ions along with the GO's oxygen moieties can assist in the prolonged stabilization of AgNPs on the GO nanosheet. Briefly, the overlaying of the anions around the AgNP's surface creates strong electrostatic repulsion that allows uniform AgNPs distribution on the GO sheet. Additionally, the catalytic reaction between AChE and the substrate ATCh produces TCh (positively charged) through hydrolysis, resulting in AgNPs aggregation on GO through the formation of the Ag–SH bond and electrostatic interactions. Therefore, the electrostatic attraction within the NPs induces particle movement which causes a reduction in the interparticle distance, thereby promoting AgNPs clustering on the GO sheet.24
Generally, the AChE's active site contains a triad of three crucial amino acids namely histidine, serine, and aspartic acid.53 In the enzyme's catalytic process, the negatively charged binding site of the triad attracts the cationic quaternary ammonium group of AChE. The serine hydroxyl group is further deprotonated by a histidine group in the triad, it becomes highly nucleophilic and attacks the ester, causing it to split. However, if an AChE inhibitor is present, the nucleophilic serine hydroxyl group in the active site becomes covalently bound to the phosphorus atom of the inhibitor.54
In the same way, when malaoxon is introduced into the designed biosensor, it binds irreversibly to the serine residue of AChE's active site, further impeding the generation of TCh. Briefly, the concentration of the malaoxon is correlated with the reduction of TCh formation. Therefore, the citrate ions capping on NPs remain untouched and thus averts the grouping of AgNPs on the GO sheet, consistent with the decrement in FE band intensity at 423 nm.55 This mechanism has been applied to analyze the malaoxon residues in environmental and agricultural specimens.
3.3. Optimization of parameters for malaoxon detection
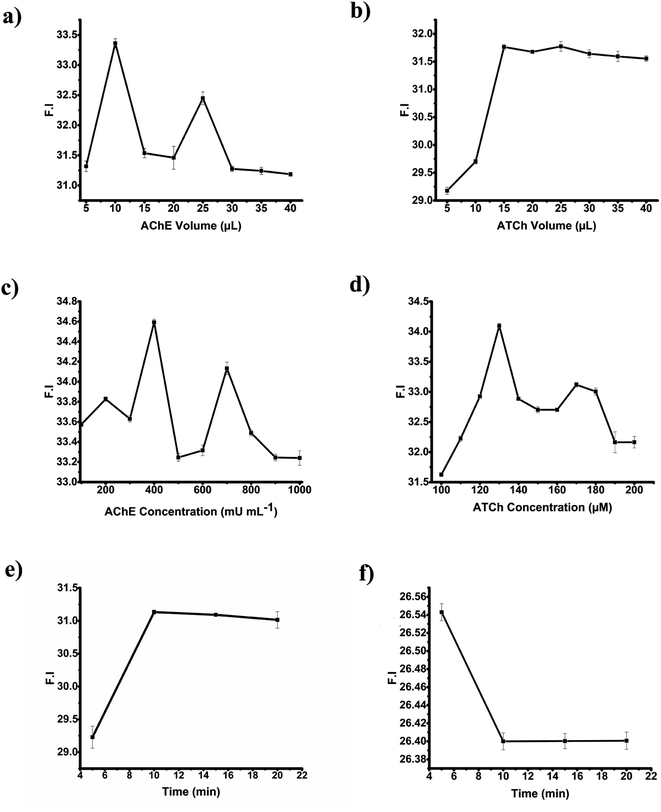
The optimization of the factors such as volume and concentrations of the AChE and ATCh, reaction time, and incubation time were executed to attain a highly repeatable, sensitive, and time-saving malaoxon detection platform.Similarly, several concentrations (i.e., 100, 110, 120, 130, 140, 150, 160, 170, 180, 190, and 200 μM) of ATCh were evaluated. A concentration of 130 μM was picked since it provided the higher FE intensity and the finest repeatability, as portrayed in the Fig. 4d. From the above experiments, the optimized concentrations and volume of AChE, and ATCh to obtain maximum AgNPs aggregation on GO are 400 mU mL−1, 130 μM, and 10 μL, 15 μL, respectively using the reaction time of 10 min.
For the optimization of incubation time (exposure period between AChE and malaoxon), the malaoxon of 1000 pM concentration was interacted with AChE by using different incubation times of 5, 10, 15, and 20 min. The study reported that 10, 15, and 20 min showed a decline in the emission intensity at 423 nm and thus 10 min was chosen as an optimal response time to pursue the subsequent detection studies (Fig. 4f).
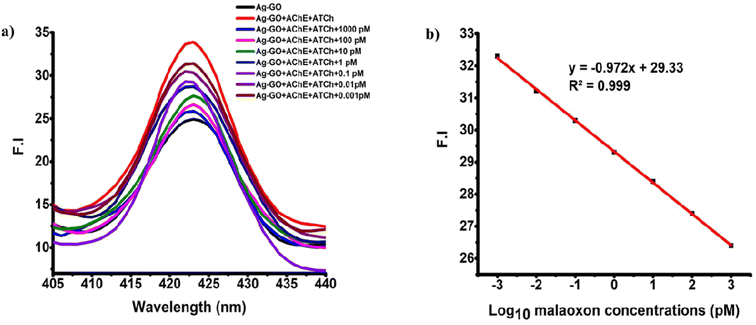
To study the malaoxon detection mechanism using the AChE-ATCh-Ag-GO system, a malaoxon of 1000 pM was added to the bio-sensing system. Later, the FE band intensity at wavelength 423 nm was observed under spectrofluorimetry. A significant decrement in the intensity of FE at 423 nm for Ag-GO was noticed, which signifies fewer AgNPs aggregation due to the inhibition of AChE by malaoxon (Fig. 6a).
Using HR-TEM images, the comparison in the size variations of per se nanocomposite, Ag-GO with enzyme + substrate and Ag-GO + enzyme + substrate with malaoxon was studied (Fig. 5a, c and e). Combined with ImageJ software, the particle distribution histogram of the Ag-GO nanocomposite, Ag-GO with enzyme + substrate, and Ag-GO + enzyme + substrate with malaoxon were demonstrated, and the estimated average particle sizes were 3.4 ± 1.22 nm, 67.4 ± 19 nm, 15.9 ± 5.7 nm (Fig. 5b, d and f).
Also, the impact of separate and the mixture of reactants, for example, malaoxon, enzyme, and substrate, on AgNPs aggregation in GO were studied. The different combinations, including Ag-GO/enzyme, Ag-GO/substrate, Ag-GO/malaoxon (1000 pM), Ag-GO/enzyme/malaoxon, Ag-GO/substrate/malaoxon were added separately to Ag-GO dispersion under analogous conditions.
The results showed that none of these combinations caused AgNPs aggregation or increased FE intensity, except for the combination of Ag-GO/substrate/enzyme due to electrostatic attraction between TCh and citrate ions (Fig. S2†). We also studied the impact of combining reactants, including enzyme/substrate/malaoxon and enzyme/substrate, on the bare GO sheet. However, we discovered that using GO alone as a fluorescence probe was not possible, as the GO did not exhibit any FE band when combined with the aforementioned reactant mixtures at an excitation wavelength of 340 nm (Fig. S3†).
In our earlier research, we investigated how individual and combined reactants, like enzyme, substrate, and OPs insecticide affect bare AgNPs.13,22 However, we observed that the AgNPs in the colloidal state were unstable because they tended to clump together and liberate Ag+ ions, which may have restricted their stability for fluorometric detection. In contrast, AgNPs enmeshed on GO nanosheets have limited mobility and are less prone to agglomeration, resulting in enhanced stability.59 Hence, we utilized the entire Ag-GO nanocomposite as a fluorescent probe for malaoxon detection.
3.4. Analytical performance
Additionally, the biosensor's capacity to detect malaoxon with accuracy and reliability was evaluated by testing its sensitivity, selectivity, and reproducibility. In other terms, its ability to detect malaoxon with high accuracy, resist interference from other substances, and produce consistent results was assessed.Fig. 6b discloses the exceptional correlation coefficient (R2) = 0.999 between log10 malaoxon concentrations and fluorescence intensity (FI) at 423 nm. The LOD and LOQ of the constructed biosensor were calculated and the attained values were 0.9 fM and 3 fM, respectively. The LOD and LOQ values were estimated using the formula 3σ/s and 10σ/s, respectively wherein σ signifies the standard deviation (SD) of the blank (n = 15), and s is the slope of the calibration curve.24
The fabricated sensing system for recognizing malaoxon has a wide range of detection capability, which has been confirmed in threefold cross-validation. The mean ± SD values for FE intensities at various concentrations of malaoxon, which ranged from 0.001 pM to 1000 pM were depicted (Table S1†). These values displayed significant variation and were consistent across multiple repeatability studies (n = 3) with minimal standard deviation.
Moreover, a one-way ANOVA statistical analysis utilizing GraphPad Prism software was conducted at a significance level of 0.05, and the results were summarized in the table. The probability value of <0.0001 obtained from the analysis indicates that the FE intensities at different concentrations of malaoxon were significantly distinct from one another, indicating that the detection study holds statistical significance (Table S2†). The AChE-ATCh-Ag-GO biosensor appears to be a promising tool for detecting malaoxon, with advantages over previously reported sensors in terms of its sensitivity and speed of detection (Table 1).
| Analysis method | Testing agent | Detection limit | R2 | Ref. |
|---|---|---|---|---|
| Enantiomeric separation | Chiral columns using acetonitrile/water or methanol/water | 0.08 μg kg−1 | 0.99 | 19 |
| Colorimetric | Au NPs | 10 ng mL−1 | — | 65 |
| Colorimetric | AChE/ATCh/Ellman's reagent | 5 nM | — | 66 |
| Fluorometric | Nanofibrous aerogels | 0.1 μg | — | 67 |
| Ultra-performance liquid chromatography-tandem mass spectrometry | AChE/Ach | 2.4 nM | — | 20 |
| Amperometric | AChE/choline oxidase (ChOx) | 0.5 μM | 0.994 | 58 |
| Electrochemical | Carbon NPs | 0.25 nM | 0.999 | 21 |
| Gas chromatography-tandem mass spectrometry | TiO2 nanowires | 0.01 mg L−1 | 0.998 | 18 |
| Fluorometric | Ag-GO nanohybrid | 0.9 fM | 0.999 | Current work |
Previous research has found malaoxon in surface and groundwater sources at concentrations ranging from 0.02 pM to 620 pM and from 66.1 pM to 600 pM in finished water. In raw water, the concentration has been reported to be 0.0018 pM.60 The European Union Maximum Residue Limits (EU MRL) has set a concentration limit of 0.013 pM for malaoxon in fruits.61 The current study employs a detection range (0.001 pM to 1000 pM) that corresponds to the range of concentrations previously reported. This suggests that the linear detection range utilized in this study is relevant and appropriate for detecting and measuring malaoxon levels that may exist in actual environmental and food samples.
The AChE enzyme is highly susceptible to malaoxon, a potent metabolite produced by malathion. When malaoxon binds to the enzyme's active site, it hinders its bioactivity and leads to an accumulation of ATCh. This distinct enzymatic response offers a remarkably specific and sensitive approach to quantify different concentrations of malaoxon.62 Additionally, the exceptional sensitivity of the biosensor can be attributed to malaoxon's more potent inhibitory effect on AChE than other OPs pesticides, including malathion.63,64 Consequently, the biosensor designed could detect malaoxon concentrations as low as 0.001 pM, establishing its efficacy in detecting and quantifying minute levels of malaoxon in various samples.
To evaluate the reproducibility of the developed sensor, experiments were conducted on different days, in different runs, and using different batches to detect various malaoxon concentrations ranging from 0.001 pM to 1000 pM (Table S4†). The relative standard deviation (RSD%) was calculated, resulting in values of 0.099%, 0.70%, and 0.94%. These results demonstrate the satisfactory reproducibility of the developed sensing method. All experiments were carried out in triplicate (n = 3).
Finally, we observed that the synthesized nanocomposite (Ag-GO) had no significant variation in the FE intensity when treated with enzyme and substrate in the presence of 0.001 pM of malaoxon (Fig. S4†). Notably, the Ag-GO was preserved at room temperature for more than one month, indicating the nanohybrid exhibits excellent stability over a long period. All the above results revealed that the outstanding sensitivity, stability, and specificity make the AChE-ATCh-Ag-GO platform a perfect candidate for practical sample analysis.
3.5. Analytical applications
Bestowed with the exceptional analytical performance of the fabricated biosensor, it was further employed for recognizing malaoxon residues in actual samples. The malaoxon working concentrations were spiked to agricultural surplus water and to the 10 times diluted grape and carrot extract, which were then exposed to the detection system for malaoxon monitoring. As displayed in Table 2, acceptable recoveries of 100.2–99.6%, 100.4–98%, and 99.2–98% with low RSD% values were collected for agricultural surplus water, carrot, and grape extract, respectively. Similarly, the unspiked agricultural surplus water, carrot, and grape extract have interacted with the proposed system for malaoxon determination, wherein no decrease in FE intensity was observed. Moreover, good correlations were acquired between spiked and calculated malaoxon concentrations. These outcomes demonstrate the potential applicability of the detection platform for identifying malaoxon in practice.| Sample | Malaoxon concentrations (pM) | Recovery (%) | RSD (%) (n = 3) | |
|---|---|---|---|---|
| Spiked | Found | |||
| Agricultural surplus water | 1000 | 1002 | 100.2 | 0.5 |
| 10 | 9.9 | 99 | 0.4 | |
| 1 | 0.996 | 99.6 | 0.2 | |
| Carrot extract | 1000 | 1004 | 100.4 | 0.7 |
| 10 | 9.92 | 99.2 | 0.2 | |
| 1 | 0.98 | 98 | 0.1 | |
| Grape extract | 1000 | 992.4 | 99.2 | 1.7 |
| 10 | 9.74 | 97.4 | 1.6 | |
| 1 | 0.98 | 98 | 0.4 | |
4. Conclusion
In summary, we propose a rapid ‘mix and detect’ type of AChE-inhibition-based fluorescent biosensor for malaoxon determination using stable Ag-GO nanocomposite. The hydrolysis of the substrate ATCh facilitated by the enzyme AChE produces TCh (possesses a positive charge), which influences the citrate-coated AgNPs aggregation on the GO sheet. The AChE inhibition by malaoxon (an oxidative form of malathion) produces lesser yields of TCh, causing fewer or no AgNPs aggregate formation. Following this mechanism, the broad range of malaoxon concentrations were analyzed with the AChE-ATCh-Ag-GO system. The results showed exceptional linearity, LOD, and LOQ of 0.001 pM to 1000 pM, 0.9 fM, and 3 fM, respectively. The anti-influence capability of the biosensor was evaluated, wherein malaoxon (0.001 pM) showed higher inhibitory efficacy than other OPs pesticides (0.1 pM). The concentration of malaoxon in practical samples were also analyzed and the results display >98% of recoveries with extremely low RSD% values. Nonetheless, we observed the utilization of enzymes in biosensors has certain drawbacks, including their high cost, limited operational conditions, and short lifespan. The AChE immobilization on the stable matrix and the usage of nanozymes (enzymes like NPs) could address these challenges by preventing biomolecule diffusion and lowering sensor costs. Thus, we plan to investigate the potential of nanozymes and AChE immobilization in OPs analysis in the future, which could offer benefits such as mass production, low cost, and increased storage stability.Conflicts of interest
There are no conflicts to declare.References
- J. K. Bhardwaj, P. Saraf, P. Kumari, M. Mittal and V. Kumar, J. Biochem. Mol. Toxicol., 2018, 32, e22046 CrossRef PubMed.
- A. M. Badr, Environ. Sci. Pollut. Res., 2020, 27, 26036–26057 CrossRef CAS PubMed.
- V. De Luca, L. Mandrich and G. Manco, Life, 2023, 13, 490 CrossRef CAS PubMed.
- I. Omwenga, L. Kanja, P. Zomer, J. Louisse, I. M. Rietjens and H. Mol, Food Addit. Contam., Part B, 2021, 14, 48–58 CrossRef CAS PubMed.
- M. Hernández Torres, F. Egea González, M. Castro Cano, M. Moreno Frías and J. Martínez Vidal, J. Agric. Food Chem., 2002, 50, 1172–1177 CrossRef PubMed.
- J. Yan, B. Xiang, D. Wang, S. Tang, M. Teng, S. Yan, Z. Zhou and W. Zhu, J. Agric. Food Chem., 2019, 67, 1784–1794 CrossRef CAS PubMed.
- A. Derbalah, I. Khattab and M. Saad Allah, World J. Microbiol. Biotechnol., 2020, 36, 1–11 CrossRef PubMed.
- W. Meka and A. D. Dubiwak, EC Pharmacology and Toxicology, 2021, 9, 45–54 Search PubMed.
- A. V. Alex and A. Mukherjee, Microchem. J., 2021, 161, 105779 CrossRef.
- D.-M. Liu, B. Xu and C. Dong, TrAC, Trends Anal. Chem., 2021, 142, 116320 CrossRef CAS.
- D. Su, H. Li, X. Yan, Y. Lin and G. Lu, TrAC, Trends Anal. Chem., 2021, 134, 116126 CrossRef CAS.
- K. Nekoueian, M. Amiri, M. Sillanpää, F. Marken, R. Boukherroub and S. Szunerits, Chem. Soc. Rev., 2019, 48, 4281–4316 RSC.
- D. N. Kumar, S. Alex, R. S. Kumar, N. Chandrasekaran and A. Mukherjee, Colloids Surf., A, 2015, 485, 111–117 CrossRef CAS.
- M. I. Gaviria-Arroyave, J. B. Cano and G. A. Peñuela, Talanta Open, 2020, 2, 100006 CrossRef.
- F.-L. Mi, S.-J. Wu, W.-Q. Zhong and C.-Y. Huang, Phys. Chem. Chem. Phys., 2015, 17, 21243–21253 RSC.
- N. Ibrahim, N. D. Jamaluddin, L. L. Tan and N. Y. Mohd Yusof, Sensors, 2021, 21, 5114 CrossRef CAS PubMed.
- S. Huang, M. Liu and H. Li, New J. Chem., 2022, 46, 11759–11773 RSC.
- H. G. Zuo, H. Yang, J. X. Zhu, P. Guo, L. Shi, C. R. Zhan and Y. Ding, J. Anal. Chem., 2019, 74, 1039–1055 CrossRef.
- Y. Hua, Q. Zhou, P. Wang, Z. Zhou and D. Liu, Chirality, 2020, 32, 1053–1061 CrossRef CAS PubMed.
- W. Li, Y. Qi, C. Gao, Y. Liu and J. Duan, J. Chromatogr. B: Anal. Technol. Biomed. Life Sci., 2022, 1190, 123101 CrossRef CAS PubMed.
- A. Celebanska, J. Jedraszko, A. Lesniewski, E. Jubete and M. Opallo, Electroanalysis, 2018, 30, 2731–2737 CrossRef CAS.
- D. N. Kumar, A. Rajeshwari, S. A. Alex, N. Chandrasekaran and A. Mukherjee, New J. Chem., 2015, 39, 1172–1178 RSC.
- H. Xu, Q. Yang, F. Li, L. Tang, S. Gao and B. Jiang, R. Soc. Chem., 2013, 1–4 Search PubMed.
- T. Deosarkar, N. Chandrasekaran and A. Mukherjee, Anal. Chim. Acta, 2021, 1142, 73–83 CrossRef PubMed.
- S. Akram and M. Mushtaq, in Fruit Juices, Elsevier, 2018, pp. 363–389 Search PubMed.
- R. González-Rodríguez, R. Rial-Otero, B. Cancho-Grande, C. Gonzalez-Barreiro and J. Simal-Gándara, Crit. Rev. Food Sci. Nutr., 2011, 51, 99–114 CrossRef PubMed.
- A. Alkhouzaam, H. Qiblawey, M. Khraisheh, M. Atieh and M. Al-Ghouti, Ceram. Int., 2020, 46, 23997–24007 CrossRef CAS.
- M. Cobos, I. De-La-Pinta, G. Quindós, M. J. Fernández and M. D. Fernández, Nanomaterials, 2020, 10, 376 CrossRef CAS PubMed.
- X. Cao, C. Ma, J. Zhao, H. Guo, Y. Dai, Z. Wang and B. Xing, Sci. Total Environ., 2019, 679, 270–278 CrossRef CAS PubMed.
- P. Ranjan, S. Agrawal, A. Sinha, T. R. Rao, J. Balakrishnan and A. D. Thakur, Sci. Rep., 2018, 8, 12007 CrossRef PubMed.
- R. Al-Gaashani, A. Najjar, Y. Zakaria, S. Mansour and M. Atieh, Ceram. Int., 2019, 45, 14439–14448 CrossRef CAS.
- H. Kolya, T. Kuila, N. H. Kim and J. H. Lee, Composites, Part B, 2019, 173, 106924 CrossRef CAS.
- A. Rohaizad, S. Shahabuddin, M. M. Shahid, N. M. Rashid, Z. A. M. Hir, M. M. Ramly, K. Awang, C. W. Siong and Z. Aspanut, J. Environ. Chem. Eng., 2020, 8, 103955 CrossRef CAS.
- A. M. Şenol, Ö. Metin and Y. Onganer, Dyes Pigm., 2019, 162, 926–933 CrossRef.
- S. Gnanasekar, D. Balakrishnan, P. Seetharaman, P. Arivalagan, R. Chandrasekaran and S. Sivaperumal, ACS Appl. Nano Mater., 2020, 3, 4574–4585 CrossRef CAS.
- M. E. Khan, M. M. Khan and M. H. Cho, Nanoscale, 2018, 10, 9427–9440 RSC.
- M. Anandan, G. Poorani, P. Boomi, K. Varunkumar, K. Anand, A. A. Chuturgoon, M. Saravanan and H. G. Prabu, Process Biochem., 2019, 80, 80–88 CrossRef CAS.
- A. Joy, G. Unnikrishnan, M. Megha, M. Haris, J. Thomas, E. Kolanthai and S. Muthuswamy, J. Inorg. Organomet. Polym. Mater., 2022, 32, 912–930 CrossRef CAS.
- M. T. Yaraki, F. Hu, S. D. Rezaei, B. Liu and Y. N. Tan, Nanoscale Adv., 2020, 2, 2859–2869 RSC.
- S. Shankar and S. A. John, Sens. Actuators, B, 2015, 221, 1202–1208 CrossRef CAS.
- N. P. Dogantzis, G. K. Hodgson and S. Impellizzeri, Nanoscale Adv., 2020, 2, 1956–1966 RSC.
- J. R. Lakowicz, Anal. Biochem., 2005, 337, 171–194 CrossRef CAS PubMed.
- K. Aslan, Z. Leonenko, J. R. Lakowicz and C. D. Geddes, J. Fluoresc., 2005, 15, 643–654 CrossRef CAS PubMed.
- F. Jin, H. Li and D. Xu, Anal. Chim. Acta, 2019, 1077, 297–304 CrossRef CAS PubMed.
- K. Fan, X. Chen, X. Liu, Y. Liu, W. Lai, Y. Chen, X. Liu and X. Wang, Carbon, 2020, 165, 386–394 CrossRef CAS.
- Q. Mei, K. Zhang, G. Guan, B. Liu, S. Wang and Z. Zhang, Chem. Commun., 2010, 46, 7319–7321 RSC.
- H. R. Thomas, C. Vallés, R. J. Young, I. A. Kinloch, N. R. Wilson and J. P. Rourke, J. Mater. Chem. C, 2013, 1, 338–342 RSC.
- Y. Esmaeili, E. Bidram, A. Zarrabi, A. Amini and C. Cheng, Sci. Rep., 2020, 10, 1–13 CrossRef PubMed.
- X. Shi, W. Gu, W. Peng, B. Li, N. Chen, K. Zhao and Y. Xian, ACS Appl. Mater. Interfaces, 2014, 6, 2568–2575 CrossRef CAS PubMed.
- M. K. Barman and A. Patra, J. Photochem. Photobiol., C, 2018, 37, 1–22 CrossRef CAS.
- S. Saxena, T. A. Tyson, S. Shukla, E. Negusse, H. Chen and J. Bai, Appl. Phys. Lett., 2011, 99, 013104 CrossRef.
- W. Saeed, Z. Abbasi, S. Majeed, S. A. Shahzad, A. F. Khan and A. J. Shaikh, J. Appl. Phys., 2021, 129, 125302 CrossRef CAS.
- M. Stoytcheva, V. Gochev and Z. Velkova, Curr. Anal. Chem., 2016, 12, 37–42 CrossRef CAS.
- E. A. Songa and J. O. Okonkwo, Talanta, 2016, 155, 289–304 CrossRef CAS PubMed.
- D. N. Kumar, J. Roy, S. Alex, N. Chandrasekaran and A. Mukherjee, RSC Adv., 2016, 6, 21261–21270 RSC.
- G. L. Ellman, K. D. Courtney, V. Andres Jr and R. M. Featherstone, Biochem. Pharmacol., 1961, 7, 88–95 CrossRef CAS PubMed.
- S. Bilal, M. M. Hassan, M. F. ur Rehman, M. Nasir, A. J. Sami and A. Hayat, Food Chem., 2021, 346, 128894 CrossRef CAS PubMed.
- S. Tvorynska, J. Barek and B. Josypčuk, J. Electroanal. Chem., 2020, 860, 113883 CrossRef CAS.
- P. N. Minh, V.-T. Hoang, N. X. Dinh, O. Van Hoang, N. Van Cuong, D. T. B. Hop, T. Q. Tuan, N. T. Khi, T. Q. Huy and A.-T. Le, New J. Chem., 2020, 44, 7611–7620 RSC.
- W. H. Organization, Guidelines for drinking-water quality: incorporating the first and second addenda, World Health Organization, 2022 Search PubMed.
- D. Castilla-Fernández, D. Moreno-González, B. Gilbert-López, J. F. García-Reyes and A. Molina-Díaz, Food Chem., 2021, 365, 130486 CrossRef PubMed.
- W. Li, X. Yan, C. Gao, J. Duan and S. Beecham, Chem. Eng. J., 2020, 392, 123793 CrossRef CAS.
- J. Tigges, F. Worek, H. Thiermann and T. Wille, Arch. Toxicol., 2022, 96, 321–334 CrossRef CAS PubMed.
- L. Oudejans, A. Mysz, E. G. Snyder, B. Wyrzykowska-Ceradini, J. Nardin, D. Tabor, J. Starr, D. Stout II and P. Lemieux, J. Hazard. Mater., 2020, 397, 122743 CrossRef CAS PubMed.
- J.-E. Lee, S.-A. Kim, H.-J. Park, H. Mun and W.-B. Shim, Journal of Food Hygiene and Safety, 2021, 36, 1–8 CrossRef.
- J. Lachaux, C. Mairaville, M. B. Frej, H. Volland, S. Simon and K. P. Toralla, Journées plénières du GDR MicroNanoFluidique, 2023, 7, 88–90 Search PubMed.
- P. Tang, S. Eckstein, B. Ji, B. Pan and G. Sun, Chem. Eng. J., 2022, 450, 138183 CrossRef CAS.
- S. Moreira, R. Silva, D. F. Carrageta, M. G. Alves, V. Seco-Rovira, P. F. Oliveira and M. de Lourdes Pereira, Int. J. Mol. Sci., 2022, 23, 8206 CrossRef CAS PubMed.
Footnote |
| † Electronic supplementary information (ESI) available. See DOI: https://doi.org/10.1039/d3ra02253f |
| This journal is © The Royal Society of Chemistry 2023 |

