
 Open Access Article
 This Open Access Article is licensed under a Creative Commons Attribution-Non Commercial 3.0 Unported Licence
A new approach to study semi-coordination using two 2-methyl-5-nitroimidazole copper(II) complexes of biological interest as a model system†
Lucas G. Fachini a,
Gabriel B. Baptistellaa,
Kahoana Postala,
Francielli S. Santanaa,
Emanuel M. de Souzab,
Ronny R. Ribeiroa,
Giovana G. Nunesa and
Eduardo L. Sá*a
a,
Gabriel B. Baptistellaa,
Kahoana Postala,
Francielli S. Santanaa,
Emanuel M. de Souzab,
Ronny R. Ribeiroa,
Giovana G. Nunesa and
Eduardo L. Sá*a
aDepartamento de Química, UFPR, Curitiba, PR, Brazil. E-mail: edulsa@ufpr.br; Tel: +55 41 3361 3300
bDepartamento de Bioquímica e Biologia Molecular, UFPR, Curitiba, PR, Brazil
First published on 20th September 2023
Abstract
Two novel copper(II) complexes [Cu(2mni)2(H2O)2](NO3)2·2H2O (1) and [Cu(2mni)2(NO3)2] (2), where 2mni is 2-methyl-5-nitroimidazole, were prepared and characterized in the solid state using single-crystal and powder X-ray diffraction analyses, EPR, electronic and vibrational spectroscopies (FTIR and Raman), and thermogravimetric methods. Both products present an elongated distorted octahedral geometry with axial Cu–O bond lengths of 2.606(14) and 2.593(15) Å, indicating semi-coordination. Density functional theory (DFT) calculations at the B3LYP/LANL2DZ theory level were used to study the electronic properties of 1 and 2. The Independent Gradient Model (IGM) was employed to determine the Intrinsic Bond Strength Index (IBSI) of the semi-coordination and to plot δg isosurfaces for the electronic sharing between the metal center and ligands. A moderate to weak antibacterial activity against Escherichia coli cultures was found for 1 with a 50% growth inhibition (GI50) value of 0.25 mmol L−1. To the best of our knowledge, this is the first time that the semi-coordination analysis using IGM was carried out for a copper(II) complex with axial elongation, finding a good correlation between the bond length and the IBSI, and the study was extended for a series of analogous complexes described in the literature.
Introduction
Considerable attention has been paid to copper complexes, as they are potential candidates for several biomedical applications, including cancer therapy, treatment of microbial diseases, copper deficiency diseases, and neurodegenerative disorders.1 The efficacy and mechanism of copper's antimicrobial activity against microorganisms are widely explored.2 For instance, copper(II) chromone-derived complexes display promising antibacterial effects against Gram-positive and Gram-negative bacteria, like Staphylococcus aureus and Escherichia coli (E. coli).3Imidazole is a five-membered aromatic heterocycle ring presented in several natural products and synthetic molecules.4 Nitroimidazole is an imidazole derivative used as a therapeutic agent, particularly for protozoa and anaerobic microbial infections.4–6 From a bioinorganic chemistry perspective, nitroimidazole derivatives can be seen as promising ligands that provide bidentate N,O-donor sites for synthesizing transition metal complexes. In this sense, complexes of metronidazole with PtII, PdII, RhII, NiII, and CuII have been evaluated as hypoxic cytotoxins and radiosensitizers, for which the action is proposed to be related to the presence of the nitro group.7 Furthermore, complexes of silver(I) with nitroimidazole-based ligands have antibacterial and antifungal activity higher than the reference drugs.8
The study of semi-coordination in transition metal complexes is a relevant subject of research, given the impact it could have on various application areas.9,10 Therefore, determining the bond order between the central metal atom and its ligands is a difficult task, because semi-coordination bonds are characterized by their low covalent nature. Various computational methods, such as Density Functional Theory (DFT), Quantum Theory of Atoms in Molecules (QTAIM), and Natural Bond Order (NBO), have been employed to investigate electronic structures and to evaluate bond orders in semi-coordinated systems.10,11
A new approach, published in 2020, is the Intrinsic Bond Strength Index (IBSI)12 calculation based on the Independent Gradient Model (IGM)13 and its δg descriptor, used to evaluate bond strengths and electron sharing between atoms or fragments. This application of the IGM explores the topology of the electronic density gradient (∇p) between two molecular counterparts to locally quantify the electron sharing. This descriptor measures the interaction between the fragments without relying on calculating the electronic structures of the separated parts. The δg also affords the IBSI, which is a dimensionless measurement of the bond strength, directly related to the covalent interaction between the selected fragments. This model gives a comprehensive quantification of bond parameters with low dependence on theory level, making it possible to precisely compare bond strengths across a range of compounds with a relatively low computational cost. This approach has been employed in the lability study of cisplatin derivatives, aiming to rationalize the ligand effects on the kinetics of ligand exchange.14
Herein, the synthesis and characterization of two new copper(II) complexes with 2-methyl-5-nitroimidazole (2mni) ligand is reported. We have also carried out Density Functional Theory (DFT) calculations to describe the electronic structure of both complexes. The IGM model was applied to study the axial Cu–O bond and calculate the bond parameters IBSI and δg. To the best of our knowledge, it is the first time that IBSI was applied to describe the semi-coordination in copper(II) complexes; hence it was also compared with other analogous complexes structurally characterized by SC-XRD. Finally, moderate antibacterial activity towards Escherichia coli cultures was observed for 1.
Experimental
General
Ultrapure water (18.2 MΩ cm resistivity at 25 °C) was used in the syntheses and biological assays. The starting materials Cu(NO3)2·3H2O (99.9%) and 2-methyl-5-nitroimidazole (99.0%) were purchased from Aldrich and used without further purification. The ethanol (99.8%) from Êxodo was used as received.Instrumentation
Carbon, hydrogen, and nitrogen contents were determined by combustion analyzes on a PerkinElmer – CHN 2400 Elemental Analyzer; copper contents were obtained by Inductively Coupled Plasma-Atomic Emission Spectroscopy (ICP-OES) with a PerkinElmer Optima 8300 series system with axial and radial vision. Acid digestion was used to remove the organic moieties presented in the sample. The X-ray powder diffraction (PXRD) pattern was recorded at 40 kV and 30 mA on a Shimadzu 600 diffractometer equipped with a Cu-target tube (Cu-Kα, λ = 1.5418 Å), employing a 2θ range of 5–50°. The calculated diffractogram of both complexes was generated from the single-crystal crystallographic information file (CIF) using the Mercury 4.0 software.15 Infrared spectra (4000–400 cm−1) were measured from KBr pellets on a Bruker Vertex 70 spectrophotometer. Raman spectra were obtained with a Raman Confocal Witec alpha 300R microscope, which focuses the incident radiation on a 1 μm2 area. The spectra were recorded using He–Ne, 633.1 nm, laser excitation over the range of 0 to 2500 cm−1. The electronic spectra were registered from pulverized solid and aqueous solution at 2.0 mmol L−1 on a PerkinElmer Lambda 1050 UV-Vis-NIR spectrophotometer. EPR spectra on X-band (9.5 GHz) were recorded from pulverized solid at room temperature and 77 K, and in aqueous and LB medium solutions (5.0, 2.0 and 0.50 mmol L−1, respectively) at 77 K using Bruker EMX-Micro spectrometer. Spectra simulations were run with the EasySpin software.16 Thermogravimetric (TG, DTG) data were collected on a Netzsch STA449 F3 Jupiter analyzer equipped with a silicon carbide furnace and dinitrogen as a carrier gas. Samples (ca. 4.0 mg) were heated in aluminum pans from 25–800 °C at 10 °C min−1.Synthesis
Single-crystal X-ray diffraction analysis (SC-XRD) of 1 and 2
From a sample under oil, one suitable parallelepiped crystal of each compound, ca. 0.356 × 0.321 × 0.180 mm for 1 and ca. 0.129 × 0.105 × 0.074 mm for 2, was analyzed. The crystal was mounted on a Micro-mount/mesh and fixed in the cold nitrogen stream on a Bruker D8 Venture diffractometer, equipped with a Photon 100 CMOS detector, Mo-Kα radiation, and graphite monochromator. Intensity data were measured by thin-slice ω- and φ-scans. Data were processed using the APEX3 (ref. 17) program. Drawings were made with the Diamond 4.18 Crystal data and crystallographic details for complexes 1 and 2 are summarized in Table 1.| 1 | 2 | |
|---|---|---|
| a For 1: w = [σ2(Fo2) + (0.0400 × P)2 + 0.3056 × P]−1 where P = (Fo2 + 2Fc2)/3, for 2: w = [σ2(Fo2) + (0.0318 × P)2 + 0.3312 × P]−1 where P = (Fo2 + 2Fc2)/3. | ||
| Elemental formula | C8H18CuN8O14 | C8H10CuN8O10 |
| Crystal system, space group | Monoclinic, P21/c | Monoclinic, P21/n |
| Temperature/K | 201(2) | 296(2) |
| a/Å | 6.714(2) | 7.3995(9) |
| b/Å | 10.504(4) | 8.2828(12) |
| c/Å | 14.095(5) | 12.5949(18) |
| Unit cell angles/° | α = γ = 90 and β = 103.104(11) | α = γ = 90 and β = 94.276(5) |
| Volume/Å3 | 968.1(6) | 769.77(18) |
| Z | 2 | 2 |
| Density/g cm−3 | 1.763 | 1.906 |
| F(000) | 526 | 446 |
| Absorption coefficient/mm−1 | 1.218 | 1.497 |
| Crystal color, shape | Dark blue/parallelepiped | Dark blue/parallelepiped |
| Crystal size (mm) | 0.356 × 0.321 × 0.180 | 0.129 × 0.105 × 0.074 |
| θ range/° | 3.6 to 28.0 | 3.0 to 27.5 |
| Limiting indices | −8 ≤ h ≤ 8, −13 ≤ k ≤ 13, −18 ≤ l ≤ 18 | −9 ≤ h ≤ 9, −10 ≤ k ≤ 10, −16 ≤ l ≤ 16 |
| Completeness to theta = 25.2° | 99.6% | 100.0% |
| Absorption correction | Multi-scan | Multi-scan |
| Reflections collected | 46![[thin space (1/6-em)]](https://www.rsc.org/images/entities/char_2009.gif) 208 208 |
24278 |
| Unique data | 2336 [R(int) = 0.042] | 1773 [R(int) = 0.044] |
| Observed data [I > 2σ(I)] | 2080 | 1499 |
| Refinement | Full-matrix least-squares on F2 | Full-matrix least-squares on F2 |
| Data/restraints/parameters | 2336/0/178 | 1773/1/144 |
| Goodness-of-fit on F2 | 1.082 | 1.061 |
| R[I > 2σ(I), row [I > 2σ(I)]a | R1 = 0.024, wR2 = 0.067 | R1 = 0.024, wR2 = 0.059 |
| Extinction coefficient | n/a | n/a |
| Largest diff. peak and hole/e Å−3 | 0.40 and −0.34 | 0.28 and −0.30 |
| Location of largest difference peak | O(1N4) atom | On the N2–C2 bond |
For 1: the structure was determined by the direct methods routines in the SHELXT19 program and refined by full-matrix least-squares methods, on F2's, in SHELXL.20 The non-hydrogen atoms were refined with anisotropic thermal parameters. All hydrogen atoms were located in difference maps and were refined isotropically and freely.
For 2: the structure was determined by the direct methods routines in the SHELXS21 program and refined by full-matrix least-squares methods, on F2's, in SHELXL. The non-hydrogen atoms were refined with anisotropic thermal parameters. All hydrogen atoms were located in difference maps and were refined isotropically and freely (except that distance restraint was applied to H1A and H1B atoms bonded to C1 atom). Scattering factors for neutral atoms were taken from the ref. 22. Computer programs used in this analysis have been noted above and were run through WinGX.23
Effects of complex 1 on E. coli cultures: general
All solutions, flasks, and materials employed in the biological analysis, including ultrapure water, were autoclave sterilized. An UV-Vis Pharmacia LKB – Ultraspec III spectrophotometer was used to measure the optical density (OD) of the bacterial cultures at 595 nm (OD595).Effect of 1 and 2 on E. coli cultures: growth inhibition assay
The effect of the copper complexes in inhibiting Escherichia coli growth was evaluated using a protocol described by Missina et al.24 Briefly, nalidixic acid-resistant (NalR) E. coli DH5α cells were grown from a stock suspension kept in 50% glycerol at −20 °C in Luria agar (LA) plates with nalidixic acid at 10 μg mL−1 at 37 °C. Next, bacteria cultures were grown at 37 °C and 120 rpm in 10 mL of Luria–Bertani (LB) broth with nalidixic acid at 10 μg mL−1 until the culture reached an optical density of 1.0 at 595 nm (OD595). Cells were then collected by centrifugation (4900g for 10 min), resuspended, and incubated for 15 min at 37 °C in 1.0 mL of saline solution (0.90% NaCl), or 1.0 mL of solutions of copper(II) nitrate, 2-methyl-4(5)-nitroimidazole, product 1 or product 2 depending on the experiment. These samples were then transferred to 5.0 mL of LB medium, incubated at 37 °C and 120 rpm for 3 h using the OD595 measurements to assess the growth. The bacterial assays were performed in triplicate using three independent culture batches. The results are expressed as arithmetic averages, considering the mean ± standard deviation (SD) of the three independent experiments. Differences between multiple groups and the control were assessed by one-way ANOVA followed by the Tukey's multiple comparisons test. Statistical significance was set up as p < 0.05. Finally, GI50 values (50% growth inhibition) were calculated on the GraphPad Prism 7 software.25Computational details
The quantum chemistry calculations were carried out by Density Functional Theory (DFT) computational method, using the B3LYP functional26,27 and LANL2DZ basis set,28 employing Gaussian16 (ref. 29) software. Electronic transitions for both compounds were calculated using the Time Dependent Density Functional Theory (TDDFT) on geometries of 1 and 2 optimized employing the conductor-like polarizable continuum model (Tables S1 and S2†).30 The frontier orbitals were rendered using Chemcraft 1.8.31 Both the FTIR and Raman spectra of 1 and 2 were calculated for the crystallographic structure of the compounds, showing good agreement with the experimental results. The novel Independent Gradient Model (IGM), as described by Klein et al. (2020),12 and its δg descriptor, were employed to evaluate Intrinsic Bond Strength Index (IBSI) using the IGMPlot.32 IGM calculations were performed using the DFT stable and converged wavefunctions obtained at B3LYP/LANL2DZ level.Results and discussion
Synthesis
The cationic complex [Cu(2mni)2(H2O)2](NO3)2·2H2O (1) was prepared by the addition of an ethanolic solution of the pre-ligand 2-methyl-5-nitroimidazole (2mni) to an aqueous solution of the Cu(NO3)2·3H2O. Attempts to isolate any solid from the reaction using only water as solvent were unfruitful, even when the reaction was conducted under reflux. On the other hand, when the reaction was carried out in ethanol, a neutral complex of formula [Cu(2mni)2(NO3)2] (2) was isolated in good yield. The powder X-ray diffraction (PXRD) analysis revealed good correspondence between the predicted and experimental diffraction patterns of 1 and 2 (Fig. S1†), indicating the crystalline purity of compounds. Both complexes were stable under storage in air for at least three months, as stated by PXRD.Single-crystal X-ray diffraction analysis
Product 1 crystallizes in monoclinic space group P21/c. Its unit cell is constituted by one cation [Cu(2mni)2(H2O)2]2+, two nitrate anions, and two crystallization water molecules (Fig. 1a). Complex 2, in turn, is a neutral complex [Cu(2mni)2(NO3)2] that crystalizes in the monoclinic space group P21/n (Fig. 1b). Relevant molecular dimensions (bond lengths and angles) are summarized in Table 2. The complexes are isostructural and the copper(II) ion lies at the inversion center of a distorted centrosymmetric octahedral environment with the N,O-donor atoms of the 2mni ligands forming a five-membered chelate ring. In 1, the coordination sphere is completed by two water molecules [Cu–O(1w), 1.949(12) Å], which defines the equatorial plan with the N(2) atoms [Cu–N(2), 1.993(12) Å] from the 2mni ligands. For 2, the equatorial plan is also comprised by the N(2) atoms [Cu–N(2), 1.993(12) Å] from the 2mni ligands and the O(1N4) atoms from the nitrate coordinated [Cu–O(1N4), 1.994(12) Å].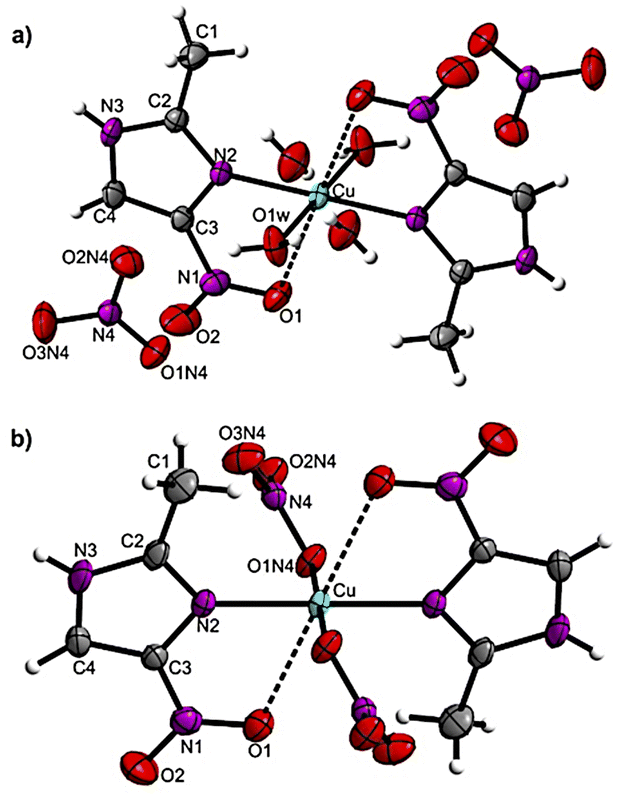 | ||
| Fig. 1 Ellipsoid probability representation of (a) [Cu(2mni)2(H2O)2](NO3)2(H2O)2 (1) and (b) [Cu(2mni)2(NO3)2] (2), with the atoms numbering scheme and thermal ellipsoids drawn at 50% probability. | ||
| [Cu(2mni)2(H2O)2](NO3)2·2H2O (1) | [Cu(2mni)2(NO3)2] (2) | ||
|---|---|---|---|
| a For 1: symmetry transformations used to generate equivalent atoms: (i) −x + 1, −y + 1, −z + 1. For 2: symmetry transformations used to generate equivalent atoms: (i) −x, −y + 1, −z + 1. | |||
| Bond lengths/Å | |||
| Cu–O(1) | 2.606(14) | Cu–O(1) | 2.593(15) |
| Cu–O(1w) | 1.949(12) | Cu–O(1N4) | 1.994(12) |
| Cu–N(2) | 1.993(12) | Cu–N(2) | 1.972(14) |
| O(1)–N(1) | 1.238(18) | O(1)–N(1) | 1.231(2) |
| O(2)–N(1) | 1.219(17) | O(2)–N(1) | 1.227(2) |
| C(3)–N(1) | 1.424(18) | C(3)–N(1) | 1.420(2) |
| N(4)–O(1N4) | 1.231(17) | N(4)–O(1N4) | 1.289(18) |
| N(4)–O(3N4) | 1.241(18) | N(4)–O(3N4) | 1.237(18) |
|
|||
| Angles/° | |||
| O(1)–Cu–O(1)i | 180.000(4) | O(1)–Cu–O(1)i | 180.0 |
| O(1W)–Cu–O(1w)i | 179.990(5) | O(1N4)–Cu–O(1N4)i | 180.0 |
| N(2)–Cu–N(2)i | 179.990(6) | N(2)–Cu–N(2)i | 180.0(7) |
| O(1)–Cu–O(1w) | 91.850(5) | O(1)–Cu–O(1N4) | 99.492(5) |
| O(1)–Cu–O(1w)i | 88.150(5) | O(1)–Cu–O(1N4)i | 80.508(5) |
| O(1)–Cu–N(2) | 69.917(4) | O(1)–Cu–N(2) | 70.911(5) |
| O(1)–Cu–N(2)i | 110.083(4) | O(1)–Cu–N(2)i | 109.089(5) |
In both products, the O(1) atoms of the 2mni ligands occupy the axial sites with weaker coordination interactions, resulting in longer Cu–O(1) bond lengths of 2.606(14) Å for 1 and 2.593(15) Å for 2, when compared to similar copper(II) complexes.33–38 The tetragonality parameter τ, which is the ratio between the mean equatorial bond length and the mean axial bond length, is 0.75 for 1 and 0.76 for 2 (Fig. S2†). The τ values are below 1.00 and this indicates an elongated octahedral geometry,39 which is characteristic of a Jahn–Teller distorted 3d9 metal ion. The τ values are smaller than those obtained for analogous compounds (Table S3†), ranging from 0.85 to 0.79, but are in accordance to what is reported for other copper(II) complexes with similar axial bond lengths.39
Compounds containing bidentate imidazole-derived ligands and water as co-ligands tend to exhibit elongated axial bonds with the oxygen atom of the bidentate ligand.33–38 The length of the axial bond is found to depend on the size of the chelate ring, with 5-membered rings resulting in longer bond lengths, exceeding 2.4 Å, while 6- or 7-membered rings generate shorter bond lengths (Table S3†).
In the crystal packing of 1 (Fig. 2a and Table S4†), a ten-membered ring is formed by strong O–H⋯O bonds [O(1w)–H(2w1)⋯O(2w); [O(2w)–H(2w2)⋯O(1N4); O(1w)–H(1w1)⋯O(2N4)] from the water molecules of the cation complex (O1w), the nitrate anions (O1N4 and O2N4), and the crystallization water molecules (O2w) (Fig. S3†). Three C–H⋯O and one N–H⋯O groups also link complex molecules by the hydrogen bonds: [C(1)–H(1C)⋯O(2)ii; C(4)–H(4)⋯O(1)iv; N(3)–H(1N3)⋯O(3N4)iii]. In contrast, the crystal packing of 2 (Fig. 2b and Table S5†) presents only one N–H⋯O bond between the hydrogen of the imidazole moiety and the nearby coordinated nitrate group N(3)–H(3N3)⋯O(3N4)iii].
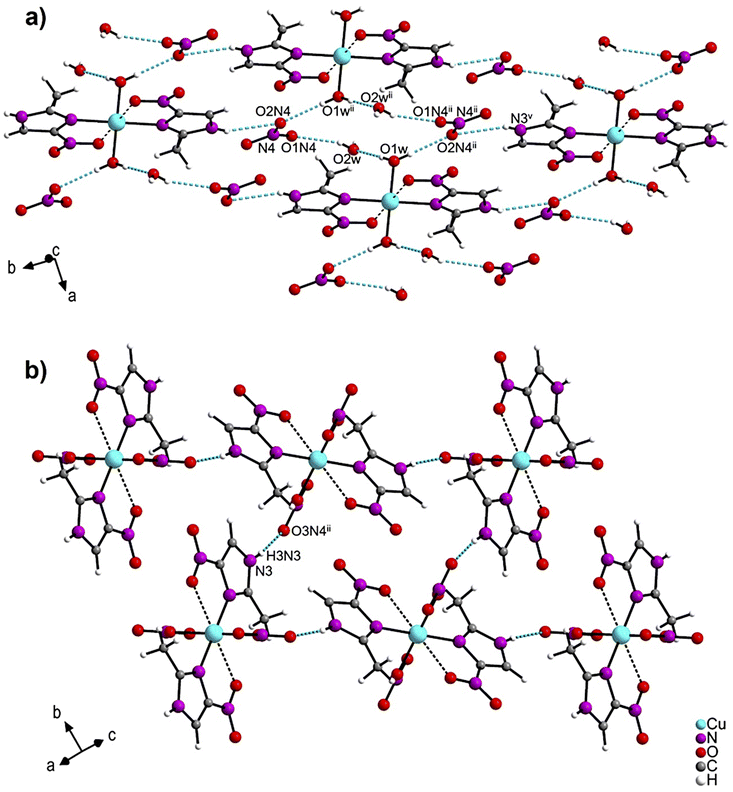 | ||
| Fig. 2 Crystal packing of (a) [Cu(2mni)2(H2O)2](NO3)2(H2O)2 (1) and (b) [Cu(2mni)2(NO3)2] (2). Hydrogen bonds are represented in blue. | ||
Hirshfeld surface calculation
Intermolecular interactions for 1 and 2 were further studied by Hirshfeld surfaces (HS) analysis40 (Fig. 3) and shape index (Fig. S4†), using the CrystalExplorer17.41 The red spots at the HS of 1, presented in function of dnorm, indicate the occurrence of O–H⋯O(N), C–H⋯O, and N–H⋯O(N) hydrogen bonds characterized by lower distance values than the sum of the van der Waals radii. For 2, the HS demonstrates the presence of hydrogen bonds only between the imidazole moiety and a coordinated nitrate group, N–H⋯O(N). The quantification of molecular interactions revealed that for both complexes the molecular packing is determined by O⋯H contacts (for 1: O⋯H (61%) and H⋯H (22%) and for 2: O⋯H (51%), O⋯H (12%), H⋯H and C⋯H, both with 10%) (Table S6†).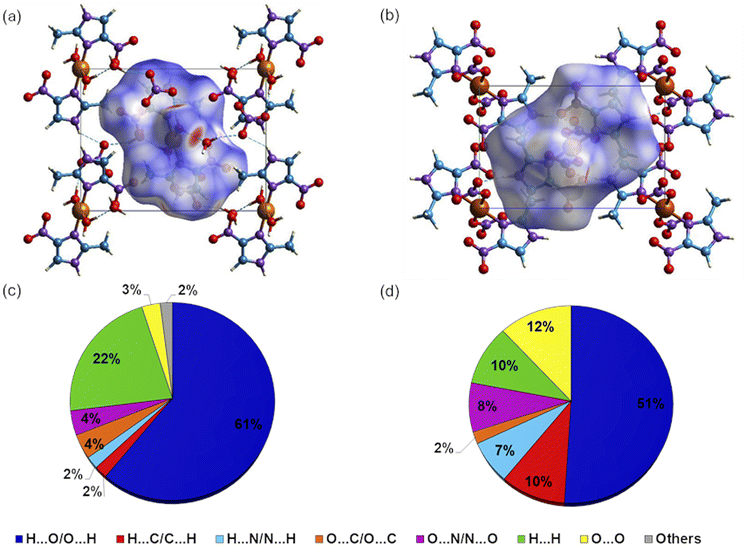 | ||
| Fig. 3 View of the Hirshfeld surface mapped over dnorm for one unit cell of product (a) 1 and (b) 2 in the range of −0.7385 a.u. (red) to +1.0608 a.u. (blue) and −0.5996 a.u. (red) to 1.3094 a.u. (blue), respectively. The interaction plots per percentage contribution of intermolecular contacts for 1 and 2 are presented in (c) and (d). | ||
DFT calculations: frontier orbitals and electronic spectroscopy
The DFT investigation allowed further analysis on the electronic structure of 1 and 2. The spin density difference map (Fig. 4) shows an unpaired spin localization on the dx2−y2 orbital of the copper(II) in both products, as expected for a d9 metal ion with a tetragonal Jahn–Teller elongation.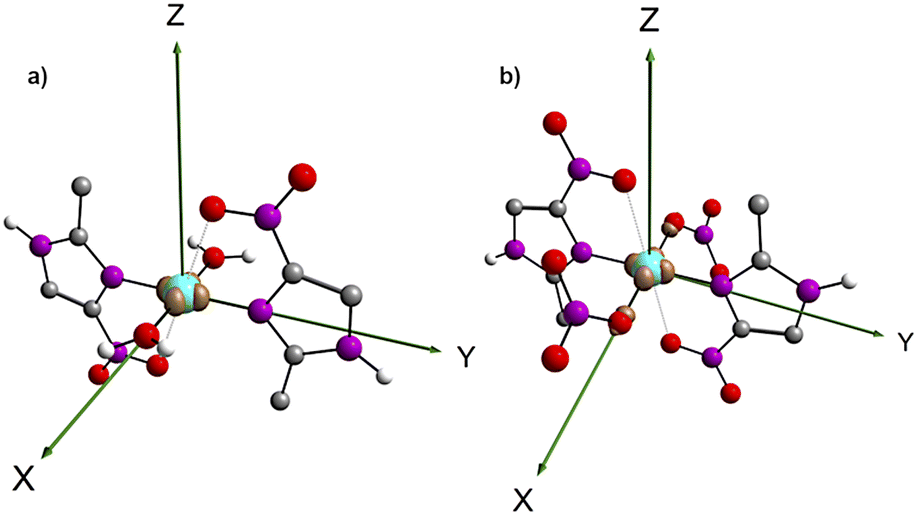 | ||
| Fig. 4 Spin density difference maps for (1) [Cu(2mni)2(H2O)2](NO3)2(H2O)2 (a) and (2) [Cu(2mni)2(NO3)2] (b). Carbon = grey, nitrogen = purple, oxygen = red, hydrogen = white. | ||
The solid-state UV-Vis spectra of 1 and 2 exhibit an intense band in the ultraviolet region, typical of internal π → π* transitions for 2mni ligands. The broad bands in the visible region were decomposed into five Gaussian sub bands (Fig. S5†), and were assigned to the LMCT (px(NO2) → dx2−y2) and d–d (dz2 → dx2−y2, dxz → dx2−y2, dxy → dx2−y2 and dyz → dx2−y2) transitions through TDDFT calculations (Table 3). These transitions suggest a distorted octahedral geometry for the copper(II) with the unpaired electron in the dx2−y2 orbital, while the dz2 orbital is stabilized due to a weak interaction with the ligand in the Z axis, in good agreement with the literature.42 Finally, the calculated transitions indicate the dx2−y2 > dz2 > dyz > dxy > dxz energetic orbital ordering. Selected frontier molecular orbitals involved in the UV-Vis absorptions are shown in Fig. 5 for 1 and in Fig. S6† for 2.
| Wavelength/nm | Energy/eV | Frontier orbitals (contribution/%) | Assignment of orbital distribution | |
|---|---|---|---|---|
| Compound 1 | 882 (904) | 1.4059 | SOMO−11 → SUMO (44.2) | dz2 → dx2−y2 |
| SOMO−2 → SUMO (34.5) | dz2 → dx2−y2 | |||
| 687 (749) | 1.8035 | SOMO−3 → SUMO (15.6) | px(NO2) → dx2−y2 | |
| SOMO−4 → SUMO (15.5) | pz(NO2) → dx2−y2 | |||
| 653 (661) | 1.8979 | SOMO−10 → SUMO (67.0) | dxz → dx2−y2 | |
| SOMO−19 → SUMO (27.3) | dxz → dx2−y2 | |||
| 593 (607) | 2.0905 | SOMO−21 → SUMO (45.0) | dxy → dx2−y2 | |
| SOMO → SUMO (30.4) | π(2-mni) → dx2−y2 | |||
| SOMO−8 → SUMO (16.1) | dxy → dx2−y2 | |||
| 559 (556) | 2.2200 | SOMO−16 → SUMO (82.2) | dyz → dx2−y2 | |
| Compound 2 | 708 (794) | 1.7518 | SOMO−10 → SUMO+2 (48.4) | dz2 → dx2−y2 |
| SOMO−20 → SUMO+2 (18.0) | dz2 → dx2−y2 | |||
| 687 (667) | 1.8042 | SOMO−13 → SUMO (24.7) |  |
|
| SOMO−13 → SUMO+1 (24.6) | 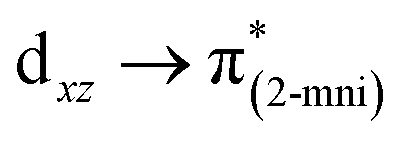 |
|||
| SOMO−14 → SUMO+1 (22.7) | 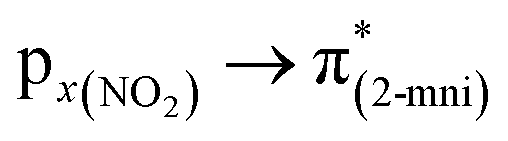 |
|||
| 635 (605) | 1.9527 | SOMO−4 → SUMO+2 (42.8) | dxy → dx2−y2 | |
| SOMO−25 → SUMO+2 (19.5) | dxz → dx2−y2 | |||
| 527 (550) | 2.3548 | SOMO−23 → SUMO+2 (25.4) | dyz → dx2−y2 | |
| SOMO−18 → SUMO+2 (17.0) | dxy → dx2−y2 | |||
| SOMO−25 → SUMO+2 (15.7) | dxy → dx2−y2 | |||
| 514 (513) | 2.4117 | SOMO−22 → SUMO+2 (47.4) | dxz → dx2−y2 | |
| SOMO−19 → SUMO+2 (18.0) | dz2 → dx2−y2 |
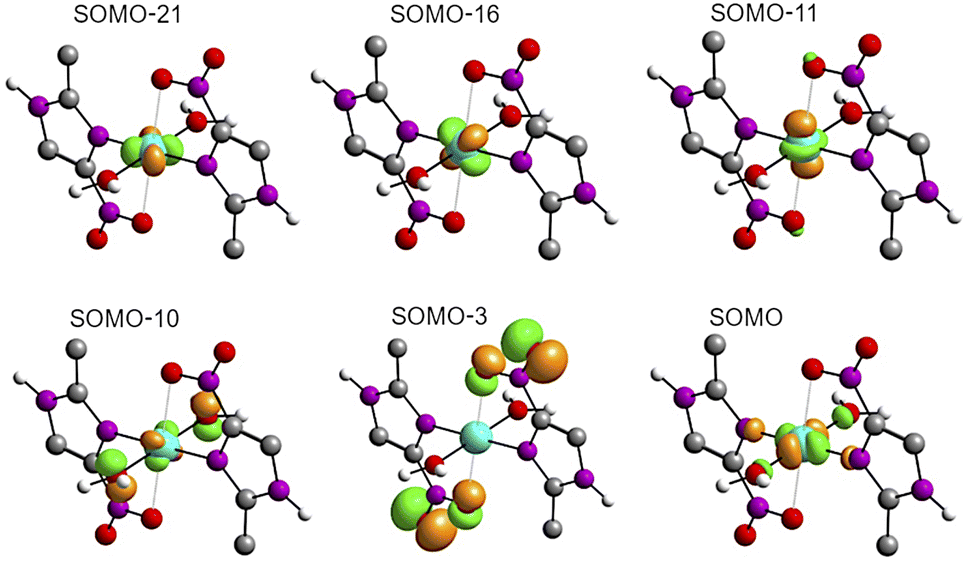 | ||
| Fig. 5 Representation of selected frontier molecular orbitals involved in the UV-Vis absorptions calculated for 1. SUMO and SOMO denotes the single unoccupied molecular orbital and the single occupied molecular orbital, respectively. | ||
IGM and IBSI analysis
Comparing Cu–Oaxial bond lengths in 1 and 2, ca. 2.6 Å, with those reported in the literature for analogous compounds (Table 4), it was found that the values are on the limit of a semi-coordination.42 The geometric parameters of the copper(II) centers in 1 and 2 raised uncertainty whether they were better described as distorted octahedral or square planes. Thus, a methodology to provide a numerical criterion to quantify the strength of a chemical bond would be useful. For this, the IGM allowed us to quantify the δg descriptor and generate isosurfaces of electronic sharing to evaluate the IBSI. In this way, IBSI values lesser than 0.15 indicate mostly non-covalent interactions, values ranging between 0.15 and 0.60 are characteristic of transition-metal ligand coordination and values between 0.60 and 4.00 are common for covalent bonds.12 DFT and IGM calculations were conducted using molecular geometries obtained from crystallographic data for 1, 2 and also for analogous hexacoordinated copper(II) complexes containing imidazole derivative ligands presenting elongation in the axial position.| Compound | Cu–Oaxial/Å | IBSI Cu–Oaxial | IBSI Cu–Oeq. | IBSI ratio | δg | Ref. |
|---|---|---|---|---|---|---|
| a Where: tdaH2 = 1,2,3-triazole-4,5-dicarboxylic acid; cpt = 1-(3,5-dinitro-1H-pyrazol-4-yl)-3-nitro-1H-1,2,4-triazol-5-amine; C2H3N6O2 = 1-methyl-5-nitriminotetrazole; emizco = ethyl-5-methyl-4-imidazolecarboxylate; atNO2EtCl = 1-(2-chloroethyl)-5-nitriminotetrazole, atNO2EtOH = 1-(2-hydroxyethyl)-5-nitriminotetrazole and ron = (1-methyl-5-nitro-1H-imidazole-2-yl)methylcarbamate.b This work. | ||||||
| 1 | 2.606 | 0.050 | 0.207 | 0.242 | 0.244 | b |
| 2 | 2.594 | 0.047 | 0.201 | 0.234 | 0.227 | b |
| (A) [Cu(emizco)2(H2O)2](NO3)2 | 2.519(2) | 0.059 | 0.178 | 0.331 | 0.270 | 33 |
| (B) [Cu(tdaH2)2(H2O)2]·2H2O | 2.490(2) | 0.067 | 0.203 | 0.330 | 0.299 | 34 |
| (C) [Cu(cpt)2(H2O)2](MeOH)2 | 2.463(2) | 0.063 | 0.179 | 0.352 | 0.276 | 35 |
| (D) [Cu(atNO2EtOH)2(H2O)2] | 2.405(2) | 0.073 | 0.181 | 0.403 | 0.304 | 36 |
| (E) [Cu(C2H3N6O2)2(H2O)2]·2H2O | 2.393(1) | 0.075 | 0.191 | 0.393 | 0.310 | 37 |
| (F) [Cu(atNO2EtCl)2(H2O)2]·2H2O | 2.367(1) | 0.079 | 0.185 | 0.427 | 0.319 | 36 |
| (G) [Cu(ron)2(H2O)2](NO3)2 | 2.336(3) | 0.084 | 0.181 | 0.464 | 0.331 | 38 |
| (H) [Cu(C2H3N6O2)2(H2O)2](MeOH)2 | 2.326(2) | 0.084 | 0.176 | 0.477 | 0.328 | 37 |
The IBSIs (Table 4) show an approximately linear correlation between their values and the Cu–Oaxial bond length (Fig. 6). Hence, this trend, relates greater bond lengths to smaller IBSI values, because the electronic sharing, δg, decreases with the atomic distance. The weakest covalent interactions in the series under study were obtained for 1 and 2, with IBSI values of 0.050 and 0.047, respectively.
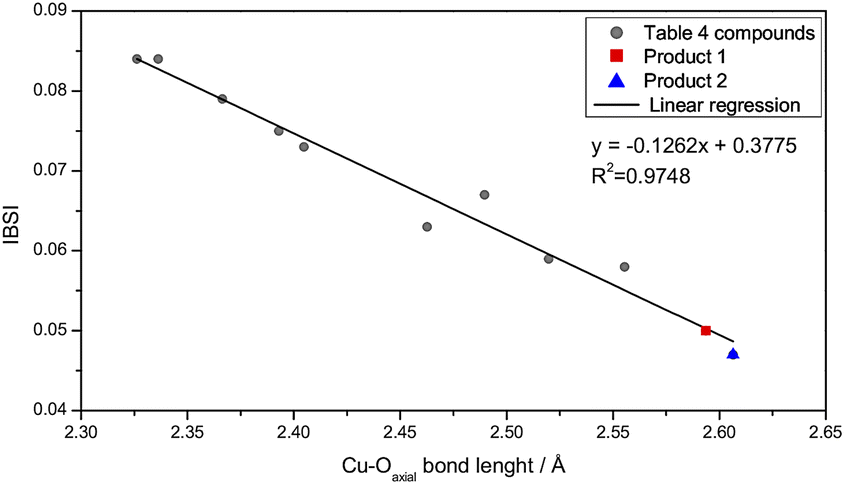 | ||
| Fig. 6 Plot of IBSI values for 1 (red), 2 (blue) and for compounds listed in Table 4 (gray) against the Cu–O axial bond distance. Linear fitted curve was traced in black. | ||
To evaluate the bond strength differences between the equatorial and axial coordination, the IBSI ratio between them was determined. The values obtained for 1 and 2, 0.242 and 0.234, respectively, revealed that the axial bonds have less than a quarter of the bond strength of the equatorial ones. Even in analogous complexes, the ratio values, varying from 0.311 for complex A to 0.477 for complex H (Table 4), indicate that there is a wide variation of the relative strength for Cu–Oaxial bonds.
The Laplacian of the electron density, which measures the curvature of the density distribution, is a powerful tool for characterizing electron density (ρ). The Laplacian can be decomposed into its principal components, which are the eigenvalues of the Hessian matrix. Among them, the second eigenvalue (λ2) of the Hessian matrix is particularly useful for determining the bonding nature in a moiety. Negative values of λ2 indicate regions of maximum ρ, which correspond to bonding interactions between selected atoms. In contrast, positive values of λ2 indicate regions of minimum electronic density, which imply non-bonding interactions.43
Aiming to characterize the interactions nature, the isosurfaces of the δg descriptor were constructed using a BGR (blue, green and red) color scheme ranging from −0.08 to +0.08 to represent values of sign(λ2)ρ. Compared to complexes A, F and H, 1 and 2 exhibit a relatively lower axial electronic sharing, as indicated by the volumes of the isosurfaces of δg (Fig. 7). Further analysis of the sign(λ2)ρ reveals the presence of weak covalent Cu–Oaxial interactions, in good agreement with the IBSI analysis, that suggests the existence of an axial semi-coordination.
 | ||
| Fig. 7 δg isosurfaces between the copper center and the ligands for (a) [Cu(2mni)2(H2O)2](NO3)2(H2O)2 (1) and (b) [Cu(2mni)2(NO3)2] (2). Carbon = grey, nitrogen = purple, oxygen = red, hydrogen = white. | ||
The IGM method was also used to decompose the electronic sharing between the copper center and the ligands into atomic contributions. For 1 and 2, the metal center contributed with approximately 35.4% of the shared electronic density, while the equatorial and axial ligands contribute with 8.5% and 3.7%, respectively. In summary, the axial ligands contribute with less than half of the electronic density shared by the equatorial ones, reinforcing the weak character of the axial bonds.
Vibrational analysis
The FTIR spectra of 1 and 2 show similar bands in the range of 1543 to 1477 cm−1 assigned to the imidazole ring skeleton (Fig. S7 and Table S7†). Further vibrations related to the νas(N–O) and νs(N–O) of the nitro group of the organic ligand are observed at 1587 and 1383 cm−1 for 1, and at 1595 and 1385 cm−1 for 2.44 The spectrum of 1, also exhibits a broad band above 3000 cm−1 from the ν(O–H) of the water molecules, and bands at 1383, 1034 and 715 cm−1 assigned to the νas(NO3), νs(NO3) and δ(NO3) vibration modes of the nitrate counter ions. Complex 2, in turn, shows typical bands of monodentate nitrates at 1246, 825 and 748 cm−1.45Both products presented very similar Raman spectra with bands characteristic of the nitroimidazole ligand (Fig. S8 and Table S8†), attributed to the ν(C–C)ring, ν(C![[double bond, length as m-dash]](https://www.rsc.org/images/entities/char_e001.gif) N)ring, and δ, β, and τ(CH)vibration modes between 1570 and 1030 cm−1. Bands in the range of 480–320 cm−1, are assigned to the ν(Cu–O) and ν(Cu–N). The calculated vibrational modes are in a good agreement with the experimental FTIR and Raman spectra, except the absence of bands related to the counter ion and the lattice water that are not included in the single molecule level calculations for 1.
N)ring, and δ, β, and τ(CH)vibration modes between 1570 and 1030 cm−1. Bands in the range of 480–320 cm−1, are assigned to the ν(Cu–O) and ν(Cu–N). The calculated vibrational modes are in a good agreement with the experimental FTIR and Raman spectra, except the absence of bands related to the counter ion and the lattice water that are not included in the single molecule level calculations for 1.
Thermogravimetric analysis
Product 1 thermogram (Fig. S9a†) shows at least three stages of weight loss. The first step, up to 130 °C, corresponds to the loss of two water molecules from the lattice and an O2 from the NO3+ decomposition (exp. 13.3% vs. calc. 13.2%).46 The second step, up to 230 °C (exp. 25.1% vs. calc. 24.9%), accounts for the loss of the two remaining water molecules and two NO2 molecules (calculated 24.9%). The additional mass loss, measured up to 710 °C (ca. 49.4%) corresponds to the decomposition of the 2mni ligands.For 2 (Fig. S9b†), there were two stages of weight loss. The first step, up to 190 °C (exp. 48.0% vs. calc. 46.4%), is associated to the loss of one 2mni, and one O2, followed by the remaining organic ligand and NO2 molecule loss up to 400 °C (exp. 41.4% vs. calc. 39.2%). Both the elemental analysis and the thermogravimetric analysis support the formulas used in the antibacterial assays, [Cu(2mni)2(H2O)2]·(NO3)2(H2O)2 (1) and [Cu(2mni)2(NO3)2] (2).
EPR analysis in aqueous solution, LB medium and solid state
The powder EPR spectra of copper(II) systems with S = 1/2 and I = 3/2 frequently show the characteristic four-line hyperfine structure with gz > gx,y > 2 for an axial symmetry with elongated z-axis.42 For 1 and 2, the powder EPR spectra at 77 K did not show a resolved hyperfine splitting (Fig. S10†) and the principal values of the g-tensor (gx ≠ gy ≠ gz in Table 5) points to a rhombic symmetry. The EPR spectra in aqueous solution at 5.0 mmol L−1 (Fig. 8) presented a broad line with gz > gy > gx for both complexes, indicating a dx2−y2 fundamental state character for the copper(II).| Product | Condition | g-Tensor | Hyperfine coupling constant (A)/MHz | Linewidth (ΔHpp)/mT | |||
|---|---|---|---|---|---|---|---|
| gx | gy | gz | Ax,y | Az | |||
| 1 | Solid at room temperature | 2.1828 | 2.1793 | 2.0684 | — | — | 7.48 |
| Solid at 77 K | 2.1859 | 2.1676 | 2.0665 | — | — | 6.47 | |
| H2O | 2.1028 | 2.1412 | 2.2097 | — | — | 16.6 | |
| LB | 2.0530 | 2.0530 | 2.2301 | 34.932 | 577.41 | 6.70 | |
| 2 | Solid at room temperature | 2.1828 | 2.1793 | 2.0686 | — | — | 7.60 |
| Solid at 77 K | 2.1966 | 2.1825 | 2.0670 | — | — | 7.80 | |
| H2O | 2.0876 | 2.1331 | 2.2092 | — | — | 17.8 | |
| LB | 2.0528 | 2.0528 | 2.2349 | 40.732 | 584.34 | 7.20 | |
 | ||
| Fig. 8 X-band EPR spectra at 77 K for in 5.0 mmol L−1 aqueous solution for (a) 1 and (c) 2; and in 0.50 mmol L−1 LB medium for (b) 1 and (d) 2. The experimental spectra are shown in black and the simulations run with EasySpin in red. | ||
The EPR spectra of 5.0 mmol L−1 aqueous solutions (77 K) were compared with those obtained from samples of 1 and 2 in LB culture medium at the highest concentration employed in the antibacterial assays (0.50 mmol L−1) (Fig. 8). The spectra from LB solutions revealed a distinct signal pattern, showing resolved hyperfine interactions observable through the splitting of gz into four lines. The profile changes might be associated to reactions between 1 and 2 and coordinating components of the medium. The weak half-field transitions, ca. 160 mT, suggest the formation of polynuclear species (please see the insert in Fig. 8b and d). Specifically for 2 other unknown copper(II) species were detected, as a broad line in the range of 200 to 250 mT.
Growth inhibition assay of E. coli cultures
Products 1, 2, 2-methyl-5-nitroimidazole, and copper(II) nitrate were screened for antibacterial activity against the Gram-negative E. coli cultures. The 2mni, showed to be nontoxic from 0.050 to 0.50 mmol L−1 (Fig. S11†). Complex 1 and copper nitrate presented concentration-dependent toxicity, while 2 was nontoxic to the cells in concentrations below 0.30 mmol L−1, being lethal to cells only at higher concentrations. The treatment of the cultures with 1 (Fig. 9) showed a moderated toxicity towards E. coli, giving a GI50 value of 0.25 mmol L−1 (Fig. S12†), being less potent than the reference drug ampicillin to the E. coli DH5α growth at similar conditions (GI50 of 1.00 mmol L−1).47 The activity of 1 was comparable to those reported for other copper(II) compounds with N,O-donor ligands (Table 6).48 It is of general agreement that the main mechanism of antibacterial activity of copper compounds is related to the generation of reactive oxygen species (ROS), which causes irreversible damage to cell membranes.2 Regarding other copper(II) complexes with biological relevant ligands,49 the activity of 1 was greater than those observed for the proligand and copper(II) nitrate (GI50 of 0.29 mmol L−1, see Fig. S13†), because complex 1 or other copper(II) species formed in LB medium might have a better interaction with the cell membrane. The poor activity of 2 in comparison to the other compounds listed in Table 6, was ascribed to the formation of the less soluble polynuclear species of copper(II), observed in EPR spectrum of the complex in LB medium. | ||
| Fig. 9 Growth inhibition assay in E. coli suspensions treated with 1 (red) and 2 (blue) in concentrations from 0.10 to 0.50 mmol L−1; data were obtained after three hours of incubation at 37 °C and 120 rpm in triplicates and are given as average values and standard deviations. The OD595 values for the controls were 0.735 ± 0.037 and 0.726 ± 0.018, respectively. ns = not statistically significant, * = 0.05 > p > 0.01, *** = 0.001 > p > 0.0001, **** = p < 0.0001. | ||
Conclusions
In summary, two novel copper(II) complexes with 2-methyl-5-imidazole (2mni) ligand [Cu(2mni)2(H2O)2](NO3)2·2H2O (1) and [Cu(2mni)2(NO3)2] (2) were synthesized, with water molecules or nitrate anions trans-positioned. As expected, UV-Vis spectra of 1 and 2, both experimentally and TDDFT obtained, showed characteristic d–d transitions attributed to the distorted octahedral geometry of copper(II) with an unpaired electron in the dx2−y2 orbital. The X-ray crystallography reveals Cu–Oax bond lengths longer than those classified as semi-coordinated in the literature. Hence, the Independent Gradient Model (IGM) and the Intrinsic Bond Strength Index (IBSI) were applied to add some knowledge to the axial semi-coordination, using 1, 2 and a number of selected analogous complexes as model systems. For 1 and 2, the axial bonds were found to have less than a quarter of the strength of the equatorial ones and the evaluation of δg descriptor revealed the presence of weak bonding interactions between the relevant atoms, suggesting the existence of a weak axial semi-coordination. The study also examined the EPR spectra of 1 and 2, which provided valuable insights into their structure and reactivity. While 1 was a moderate antibacterial agent, 2 showed to be non-toxic to E. coli cultures, maybe due to the formation of other unidentified species. These results underscore the importance of understanding the correlations between structural and electronic features, providing insights on the distorted octahedral complexes undergoing significant axial elongation.Author contributions
Lucas Gian Fachini: investigation (synthesis and DFT studies), Gabriel Barros Baptistella: investigation (synthesis and DFT studies), Kahoana Postal: synthesis and biological assays); Francielli S. Santana: crystallographic analysis; Emanuel M. de Souza: formal analysis of biological assays, Ronny R. Ribeiro, investigation (EPR analysis); Eduardo L. Sá: conceptualization and supervision (DFT studies); Giovana G. Nunes: conceptualization (synthesis and characterization).Conflicts of interest
The authors declare that they have no known competing financial interests or personal relationships that could have appeared to influence the work reported in this paper.Acknowledgements
This work was financially supported by Fundação Araucária (project number 20171010), Conselho Nacional de Desenvolvimento Científico e Tecnológico (CNPq-Processes: 406946/2021-3 and 309691/2021-4) and Universidade Federal do Paraná (UFPR) pesquisa/PRPPG/UFPR Edital 04/2020, Edital 06/2021 and 04/2023. Authors thank LAMAQ/UTFPR for the ICP-OES analyzes. E. L. S. is grateful to the Laboratório Central de Processamento de Alto Desempenho (LCPAD/UFPR) for providing access to computational infrastructure. Authors gratefully thank Dr Jaisa Fernandes Soares for discussions and helpful suggestions. G. B. B., L. G. F., F. S. S. and G. G. N. thank CNPq, CAPES-PrInt (Finance code 001) and pesquisa/PRPPG/UFPR for research grants and scholarships.Notes and references
- V. Oliveri, Coord. Chem. Rev., 2020, 422, 213474 CrossRef CAS
.
- I. Salah, I. P. Parkin and E. Allan, RSC Adv., 2021, 11, 18179–18186 RSC
- Z. H. Chohan, M. S. Iqbal, S. K. Aftab and A. Rauf, J. Enzyme Inhib. Med. Chem., 2012, 27, 223–231 CrossRef CAS PubMed
- R. Czarnomysy, D. Radomska, A. Muszyńska, J. M. Hermanowicz, I. Prokop, A. Bielawska and K. Bielawski, Molecules, 2020, 25, 2860 CrossRef CAS PubMed
- S. Patterson and S. Wyllie, Trends Parasitol., 2014, 30, 289–298 CrossRef CAS PubMed
- I. P. O'Shea, M. Shahed, B. Aguilera-Venegas and S. R. Wilkinson, Antimicrob. Agents Chemother., 2016, 60, 1137–1140 CrossRef PubMed
- N. Barba-Behrens, A. M. Mutio-Rico, P. Joseph-Nathan and R. Contreras, Polyhedron, 1991, 10, 1333–1341 CrossRef CAS
- R. Rowan, T. Tallon, A. M. Sheahan, R. Curran, M. McCann, K. Kavanagh, M. Devereux and V. McKee, Polyhedron, 2006, 25, 1771–1778 CrossRef CAS
- P. Sarma, P. Sharma, A. Frontera, M. Barcelo-Oliver, A. K. Verma, T. Barthakur and M. K. Bhattacharyya, Inorg. Chim. Acta, 2021, 525, 120461 CrossRef CAS
- L. Havlíček, R. Herchel, I. Nemec and P. Neugebauer, Polyhedron, 2022, 223, 115962 CrossRef
- F. Valach, R. Grobelny, T. Glowiak, J. Mrozinski, V. Lukeš and Z. Blahová, J. Coord. Chem., 2010, 63, 1645–1651 CrossRef CAS
- J. Klein, H. Khartabil, J.-C. Boisson, J. Contreras-García, J.-P. Piquemal and E. Hénon, J. Phys. Chem. A, 2020, 124, 1850–1860 CrossRef CAS PubMed
- C. Lefebvre, H. Khartabil, J. C. Boisson, J. Contreras-García, J. P. Piquemal and E. Hénon, ChemPhysChem, 2018, 19, 724–735 CrossRef CAS PubMed
- M. Ponce-Vargas, J. Klein and E. Hénon, Dalton Trans., 2020, 49, 12632–12642 RSC
- C. F. Macrae, I. Sovago, S. J. Cottrell, P. T. A. Galek, P. McCabe, E. Pidcock, M. Platings, G. P. Shields, J. S. Stevens, M. Towler and P. A. Wood, J. Appl. Crystallogr., 2020, 53, 226–235 CrossRef CAS PubMed
- S. Stoll and A. Schweiger, J. Magn. Reson., 2006, 178, 42–55 CrossRef CAS PubMed
- G. M. Sheldrick, APEX3, Bruker AXS: Madison, WI, 2015 Search PubMed
- H. Putz and K. Brandenburg, Diamond 4.6.8, Crystal Impact, Bonn, Germany, 2022 Search PubMed
- G. M. Sheldrick, Acta Crystallogr., Sect. A: Found. Adv., 2015, 71, 3–8 CrossRef PubMed
- G. M. Sheldrick, Acta Crystallogr., Sect. C: Struct. Chem., 2015, 71, 3–8 Search PubMed
- G. M. Sheldrick, in International Tables for Crystallography Volume F: Crystallography of biological macromolecules, ed. M. G. Rossmann, E. Arnold and D. M. Himmel, Wiley, Chichester, 2nd edn, 2012, 25.2.10.3.1, p. 735 Search PubMed
- D. C. Creagh and W. Mcauley, in International Tables for Crystallography Volume C: Mathematical, physical and chemical tables, ed. E. Prince, Wiley, Chichester, 3rd edn, 2012, vol. C, 4.3.2 p. 262 Search PubMed
- L. Farrugia, J. Appl. Crystallogr., 2012, 45, 849–854 CrossRef CAS
- J. M. Missina, B. Gavinho, K. Postal, F. S. Santana, G. Valdameri, E. M. de Souza, D. L. Hughes, M. I. Ramirez, J. F. Soares and G. G. Nunes, Inorg. Chem., 2018, 57, 11930–11941 CrossRef CAS PubMed
- GraphPad Prism version 7.0 for Windows, GraphPad Software, Boston, MA, 2018 Search PubMed
- A. D. Becke, J. Chem. Phys., 1993, 98, 5648–5652 CrossRef CAS
- P. J. Stephens, F. J. Devlin, C. F. Chabalowski and M. J. Frisch, J. Phys. Chem., 1994, 98, 11623–11627 CrossRef CAS
- P. J. Hay and W. R. Wadt, J. Chem. Phys., 1985, 82, 270–283 CrossRef CAS
- M. J. Frisch, G. W. Trucks, H. B. Schlegel, G. E. Scuseria, M. A. Robb, J. R. Cheeseman, G. Scalmani, V. Barone, G. A. Petersson, H. Nakatsuji, X. Li, M. Caricato, A. V. Marenich, J. Bloino, B. G. Janesko, R. Gomperts, B. Mennucci, H. P. Hratchian, J. V. Ortiz, A. F. Izmaylov, J. L. Sonnenberg, D. Williams-Young, F. Ding, F. Lipparini, F. Egidi, J. Goings, B. Peng, A. Petrone, T. Henderson, D. Ranasinghe, V. G. Zakrzewski, J. Gao, N. Rega, G. Zheng, W. Liang, M. Hada, M. Ehara, K. Toyota, R. Fukuda, J. Hasegawa, M. Ishida, T. Nakajima, Y. Honda, O. Kitao, H. Nakai, T. Vreven, K. Throssell, J. A. Montgomery Jr, J. E. Peralta, F. Ogliaro, M. J. Bearpark, J. J. Heyd, E. N. Brothers, K. N. Kudin, V. N. Staroverov, T. A. Keith, R. Kobayashi, J. Normand, K. Raghavachari, A. P. Rendell, J. C. Burant, S. S. Iyengar, J. Tomasi, M. Cossi, J. M. Millam, M. Klene, C. Adamo, R. Cammi, J. W. Ochterski, R. L. Martin, K. Morokuma, O. Farkas, J. B. Foresman and D. J. Fox, Gaussian16, Revision C.01, Gaussian, Inc., Wallingford CT, 2016 Search PubMed.
- V. Barone and M. Cossi, J. Phys. Chem. A, 1998, 102, 1995–2001 CrossRef CAS
- G. A. Zhurko, Chemcraft - graphical software for visualization of quantum chemistry computations, Version 1.8, build 654, 2023 Search PubMed.
- C. Lefebvre, J. Klein, H. Khartabil, J.-C. Boisson and E. Hénon, J. Comput. Chem., 2023, 44, 1750–1766 CrossRef CAS PubMed
- J. Montes-Ayala, C. Escartín-Guzmán, S. E. Castillo-Blum, E. O. Rodríguez-Hernández, S. Bernès, M. J. Rosales-Hoz and N. Barba-Behrens, J. Inorg. Biochem., 2005, 99, 1676–1684 CrossRef CAS PubMed
- J. R. Olson, M. Yamauchi and W. M. Butler, Inorg. Chim. Acta, 1985, 99, 121–128 CrossRef CAS
- C. Li, M. Zhang, Q. Chen, Y. Li, H. Gao, W. Fu and Z. Zhou, Dalton Trans., 2016, 45, 17956–17965 RSC
- J. Stierstorfer, K. R. Tarantik and T. M. Klapötke, Chem.–Eur. J., 2009, 15, 5775–5792 CrossRef CAS PubMed
- G. Geisberger, T. M. Klapötke and J. Stierstorfer, Eur. J. Inorg. Chem., 2007, 2007, 4743–4750 CrossRef
- P. García-Holley, N. Ortiz-Pastrana, R. A. Toscano, M. Flores-Álamo and N. Barba-Behrens, Polyhedron, 2016, 104, 127–137 CrossRef
- P. Stachová, M. Melník, M. Korabik, J. Mrozinski, M. Koman, T. Glowiak and D. Valigura, Inorg. Chim. Acta, 2007, 360, 1517–1522 CrossRef
- M. A. Spackman and D. Jayatilaka, CrystEngComm, 2009, 11, 19–32 RSC
- P. R. Spackman, M. J. Turner, J. J. McKinnon, S. K. Wolff, D. J. Grimwood, D. Jayatilaka and M. A. Spackman, J. Appl. Crystallogr., 2021, 54, 1006–1011 CrossRef CAS PubMed
- B. J. Hathaway and D. E. Billing, Coord. Chem. Rev., 1970, 5, 143–207 CrossRef CAS
- E. R. Johnson, S. Keinan, P. Mori-Sánchez, J. Contreras-García, A. J. Cohen and W. Yang, J. Am. Chem. Soc., 2010, 132, 6498–6506 CrossRef CAS PubMed
- L. Epishina, V. Slovetskii, V. Osipov, O. Lebedev, L. Khmel'nitskii, V. Sevost'yanova and T. Novikova, Chem. Heterocycl. Compd., 1967, 3, 570–575 CrossRef
- M. Y. Mihaylov, V. R. Zdravkova, E. Z. Ivanova, H. A. Aleksandrov, P. S. Petkov, G. N. Vayssilov and K. I. Hadjiivanov, J. Catal., 2021, 394, 245–258 CrossRef CAS
- S. Yuvaraj, L. Fan-Yuan, C. Tsong-Huei and Y. Chuin-Tih, J. Phys. Chem. B, 2003, 107, 1044–1047 CrossRef CAS
- R. Contreras, A. Flores-Parra, E. Mijangos, F. Téllez, H. López-Sandoval and N. Barba-Behrens, Coord. Chem. Rev., 2009, 253, 1979–1999 CrossRef CAS
- S. Mandal, R. Sadhukhan, U. Ghosh, S. Mandal, M. Saha, R. J. Butcher and N. C. Saha, J. Coord. Chem., 2016, 69, 1618–1634 CrossRef CAS
- A. Kostelidou, S. Kalogiannis, O.-A. Begou, F. Perdih, I. Turel and G. Psomas, Polyhedron, 2016, 119, 359–370 CrossRef CAS
Footnote |
| † Electronic supplementary information (ESI) available. CCDC 2248741 and 2248742. For ESI and crystallographic data in CIF or other electronic format see DOI: https://doi.org/10.1039/d3ra02130k |
| This journal is © The Royal Society of Chemistry 2023 |