
 Open Access Article
 This Open Access Article is licensed under a Creative Commons Attribution-Non Commercial 3.0 Unported Licence
A rationale for the rapid extraction of ultra-low-level uranyl ions in simulated bioassays regulated by Mn-dopants over magnetic nanoparticles†
P. Mandalbc,
P. D. Sawantb and
K. Bhattacharyya *ac
*ac
aChemistry Division, Bhabha Atomic Research Centre, Mumbai 40085, India. E-mail: kaustava@barc.gov.in; Fax: +91 22 2550 5151; Tel: +91 22 25593219
bRadiation Safety Systems Division, Bhabha Atomic Research Centre, Mumbai 40085, India
cHomi Bhabha National Institute, Mumbai 400094, India
First published on 24th May 2023
Abstract
Although the sorption of uranyl ions and other heavy metal ions over magnetic nanoparticles is well reported, the parameters governing the sorption process over the magnetic nanoparticles have not been clearly enumerated. However, to increase the efficiency of the sorption over the surface of these magnetic nanoparticles, it is essential to understand the different structural parameters that are involved in the sorption process. The sorption of uranyl ions and other competitive ions in simulated urine samples at different pH was effectively accomplished over magnetic nanoparticles of Fe3O4 (MNPs) and Mn-doped Fe3O4 (Mn-MNPs). The MNPs and Mn-MNPs were synthesized using an easily modified co-precipitation method and were thoroughly characterised using several techniques, such as XRD, HRTEM, SEM, zeta potential, and XPS. The substitutional doping of Mn (1 to 5 at%) in the Fe3O4 lattice (Mn-MNPs) showed better sorption ability as compared to that of MNPs. The sorption properties of these nanoparticles were mainly correlated with the different structural parameters to understand the roles of surface charge and different morphological parameters. The interaction centres over the surface of MNPs with the uranyl ions were designated and the effects of ionic interactions with uranyl ions for these sites were calculated. Extensive XPS, ab initio calculations and zeta potential studies have provided deep insights into the different aspects that play key roles in the sorption process. These materials showed one of the best Kd values (∼3 × 106 cm3) in a neutral medium with very low t1/2 values (∼0.9 min). The fast sorption kinetics (very low t1/2) makes them amongst the best sorption materials for uranyl ions and optimal for the quantification of ultra-low-level uranyl ions in simulated bioassays.
1. Introduction
The use of radionuclides has been greatly amplified due to the increasing demand for nuclear energy, application in therapeutic and diagnostic purposes, and research and industrial application of radioisotopes. However, this can increase the probability of exposure of workers to radiation both externally and internally. External exposure can be controlled by (a) reducing the exposure time, (b) increasing distance from the source, and (c) applying adequate shielding. However, none of the above protective measures help to reduce the internal dose, i.e., the Committed Effective Dose (CED). Hence, following internal contamination, the rapid determination of radionuclides is essential to decide on medical intervention, if required. Radionuclides emitting gamma rays or high-energy beta rays can be easily quantified by using in vivo monitoring techniques such as whole-body counting or organ-based counting (lung counting, thyroid counting, etc.). However, alpha-emitting and some beta-emitting radionuclides (e.g. 239Pu, Unat, 241Am, 210Po, 232Th, and 3H, 90Sr) cannot be determined using the above-mentioned techniques. Depending on the chemical nature (solubility class) and biokinetic behaviour of these radionuclides, biological samples (urine, faeces, tissue, nasal swab, etc.) of the exposed person are analysed for the estimation of radionuclide intake and assessment of CED.At present, the quantitative determination of alpha-emitting radionuclides from urine samples is labour-intensive and time-consuming.1 During normal situations, a large number of exposed individuals may need to be monitored for a short duration. Hence, novel approaches to detect, separate and estimate actinides from biological samples are being developed based on co-precipitation,2 liquid–liquid solvent extraction,3 ion-exchange resins,4,5 extraction chromatography5,6 and nanotechnologies.7–10 The extraction of actinides using a solvent extraction technique is time-consuming and also generates organic waste. The most popular method is the separation of actinides by using ion exchange and extraction chromatography resins such as TEVA, UTEVA, TRU, etc. However, the separation process is comparatively slower and laborious. New strategies take advantage of nanoparticles, i.e. materials with nanoscale dimensions, which show high sensitivities to heavy metals and actinides, enhanced adsorption and responsiveness to external stimuli, such as magnetic fields.11–14 In the present study, the sorption of uranium over nanomagnetic materials like Fe3O4 and Mn-doped Fe3O4 was undertaken.
The removal of the different heavy ions from the environment along with the organic pollutants is a necessity for maintaining the ecological balance and protection of the environment and human health. The removal of the different heavy metals from wastewater has been effectively done by using different carbon nanoparticles15–18 and by photocatalysis.19 Recently, the removal of heavy metals using magnetic nanoparticles has also garnered substantial attention. Magnetic micro-nanoparticles have attracted considerable attention in several fields, such as analytical chemistry, wastewater treatment, catalysis, biochemistry medicine, etc.20–26 Sorbents comprised of iron oxides like magnetite (Fe3O4) and maghemite (γ-Fe2O3),27–30 with different examples for other iron oxide phases, may be attached to different ligands or polymeric materials,31–35 and have been utilised for extracting the toxins mainly from wastewater. These materials are good contenders as the oxides are mostly non-toxic materials and they are easily separated by magnetic separation, which is fast and effective. One of the most important properties of magnetic nanoparticles (MNPs), which makes them suitable for use as compared to other materials, is their magnetic behaviour. Bare MNPs such as Fe3O4 are dispersible in water because of the repulsion between particles due to like-charges on the surface, their small size and they exhibit no magnetic properties in the absence of a magnetic field. However, under an external magnetic field, these MNPs tend to agglomerate because of magnetic dipole interactions. Since these nanoparticles have a high surface area, as well as good pore size, many metal ions and dyes can be sorbed on the surface and occupy pores or lattice sites of nanoparticles.36–40 A plethora of nanoparticles, magnetic and using different supports, have been utilised for the sorption of actinide materials like uranyl ions from the solution.41–43 Such incorporated/adsorbed NPs can be attracted towards the magnetic field and can be used for the removal of toxic materials from the environment as has been discussed for the separation of ultra-low level (ULL) uranyl ions present in urine following internal contamination. The idea is not only to adsorb the ULL-uranyl ions but also to separate them magnetically, with the rapid separation process making it tenable for the estimation procedure.
Mn-doped Fe3O4 has garnered a lot of attention lately due to the different credible properties of these doped magnetic materials. Precise control over the Mn dopant included in the iron oxide lattice should permit the tailoring of the sorbent reactivity towards the analytes of interest. These materials have been utilised lately for several purposes like the sorption of several cationic dyes,44 sorption of heavy metals like Hg,45 and CO adsorption with different dopant segregation.46 Similarly, functionalised Fe3O4 and Mn-doped Fe3O4 have been used for simultaneous dye and metal ion ultrasound-assisted adsorption.47 The Mn–Fe3O4 system dispersed over reduced graphene oxide has been utilised as a photo-Fenton agent under neutral pH to degrade certain dyes like Rhodamine-B with high efficiency.48 Warner et al. have shown a suitable method for the synthesis of Mn-doped Fe3O4 using commercial magnetite nanopowder where they have shown that the level of Mn dopant in the ferrite has a significant effect on the reactivity of the materials toward selected heavy metal analytes (e.g., Co, Ni, Cu, Zn, As, Ag, Cd, Hg, and Tl).49 Though there have been several reports, the exact parameters governing the sorption for the doped Fe3O4 systems have not been completely revealed. If the roles of the different structural parameters along with that of the solvent are known properly, it will be easier to tune the sorption properties for any MNPs.
Following accidental internal contamination (with uranium), the rapid determination of radionuclides is essential to decide the requisite medical intervention. Therefore, to separate the uranyl ions from the urine bioassays using magnetic separation, a very efficient sorbing material with very fast kinetics is needed. To achieve this goal, the sorption of uranium on nanomagnetic materials like Fe3O4 and Mn-doped Fe3O4 was initially undertaken. The effects of the pH on the doped Mn–Fe3O4 surface, as well as the effect of Mn-doping over Fe3O4 for the sorption of the uranyl ions, were studied. Also, the different structural parameters that directly regulate the process of sorption over these Mn-MNPs and MNPs along with the particular sites where they were sorbed were investigated using XPS, and a theoretical understanding was formulated to substantiate the sorption efficiencies of these materials. The MNPs and Mn-MNPs having very strong sorption properties (high Kd values) and simultaneously very fast kinetics for the process of sorption (low t1/2 values) can be very conveniently used for the separation of low-level uranyl ions from the different bioassays.
Conventional methods that are presently used for the bioassay sample analysis of ultra-low-level (ppb) actinide (U, Pu, Am etc.) detection involve acid digestion, co-precipitation, ion-exchange chromatographic separation, alpha source preparation and activity estimation using an alpha spectrometer. These processes take nearly 4–5 working days for single sample analysis. Thus, to develop a faster bioassay method, it is important to separate actinides with faster kinetics and with selective sorption over the substrate. The above MNPS and Mn-MNPs will effectively lead to a paradigm shift for the development of a faster estimation process, which includes selective sorption as the major focus.
2. Experimental methodologies
2.1 Synthesis of nano Fe3O4 (MNPs)
Nano Fe3O4 was synthesized via a modified co-precipitation route50,51 using FeCl3·6H2O as a precursor for Fe3+ and FeSO4·7H2O as a precursor for Fe2+ in stoichiometric ratios. Here, 100 mL of 0.1 M FeCl3·6H2O solution was taken in a 3-necked round bottom flask, and then 50 mL of 0.1 M FeSO4·7H2O were added. N2 gas was used to purge the solution, with stirring for 1 h, to remove the dissolved oxygen. Next, 100 mL NH4OH solution was added to the solution dropwise from a burette under an inert atmosphere. The mixture was stirred for 3 h at room temperature. The resulting black particles were washed several times with distilled water followed by acetone. The products were separated magnetically and dried at ∼60 °C for 5–6 h.2.2 Synthesis of Mn-doped Fe3O4 (Mn-MNPs)
The as-synthesized nano Fe3O4 was then doped with Mn to improve its sorption property. The Mn was doped in atom percentages, where a stoichiometric amount of FeSO4·7H2O was substituted by MnSO4·H2O (0.1 M) solution added to 0.1 M FeCl3·6H2O. Different stoichiometric amounts of MnSO4·H2O (0.1 M) were added so that the Mn-doped percentages were 1, 2, 3, 4 and 5 at% in the Fe3O4 lattice. The required amount of N2 gas was used to purge (Scheme 1) the solution, with stirring for 1 h, to remove the dissolved oxygen. Next, 200 mL NH4OH solution was added to the solution dropwise from a burette under an inert atmosphere. The mixture was stirred for 2.5 h. A black precipitate was obtained, which was washed several times with distilled water followed by acetone, as shown in Scheme 1. The black powder was separated magnetically and dried. The Mn-doping percentage ranged from 1 to 5 at% and these samples were labelled as Mn-1, Mn-2, Mn-3 Mn-4 and Mn-5, respectively, and are collectively denoted as Mn-MNPs. | ||
| Scheme 1 The synthesis of nano Fe3O4 and Mn-doped Fe3O4 samples. | ||
2.3 Characterization
Crystallographic phase analysis was carried out from powder X-ray diffraction (XRD) measurements using a Phillips Analytical Diffractometer with Ni-filtered Cu Kα radiation. The diffractograms were recorded in the 10–80° (2θ) region. The BET surface area, pore volume, and pore size distribution profiles of different samples were obtained from the physical adsorption of N2 at 77 K, using a Micromeritics ASAP 2020 analyser. About 100 mg of a sample was utilized for this purpose, which was degassed under vacuum (10−6 Torr) at 300 °C, before N2 adsorption. Raman spectra were obtained using a 632.8 nm line of a diode laser for excitation and the scattered light was analyzed using a 0.9 nm single-stage monochromator coupled with a CCD detector. Laser Raman spectra were taken on a HORIBA Jobin Yvon instrument. The particle size, structure parameters and morphology were investigated using a TEM (JEOL F2100) equipped with a LaB6 emitter, Thermo Noran Energy Dispersive X-S4 ray Spectroscopy (EDXS) system and a Gatan Model 666 Parallel Electron Energy Loss Spectrometer (PEELS) system. X-ray Photoelectron Spectroscopy (XPS) study was performed using a Thermo Fisher Scientific NEXSA instrument operating at 12 kV anode voltage with 6.50 mA filament current (1486.6 eV Al Kα dual anode source). The data was taken at a pass energy of 50 eV under vacuum at 9 × 10⁻⁸ mbar. As an internal reference for the absolute binding energy, the C 1s peak (284.5 eV) was used. All the deconvolutions are made by the CASA software with a Voigt-type peak having GL 75 to GL 30 without imparting any asymmetry. The baseline was made using the Shirley function. Zeta potential measurements were made at 25 °C using a quartz cuvette with a Malvern Zetasizer nanoseries, by phase analysis light scattering with an applied field strength of 2.5 × 10³ V m−1. The light source was a He–Ne laser (632.8 nm) operating at 4.0 mW. About 0.5 mg mL−1 of the sample was dispersed in 1 mL of water. The surface morphologies and particle size were studied using a Seron AIS 2100 Scanning electron microscope. The dc magnetization measurements were carried out using a Vibrating Sample Magnetometer (VSM, Cryogenic Ltd, UK), as a function of both temperature and magnetic field. Magnetization as a function of the magnetic field was recorded at ∼298 K (RT) over an applied magnetic field of +5 to −5 kOe for all samples. The elemental detection for the Mn-doped Fe3O4 samples along with the different competing ions of Na+, K+, Ca2+ and Mg2+ were done with the ICP-OES technique with a Thermo Fisher ICP-OES-iCAP-6500 instrument with a CID detector. A light-emitting diode (LED) fluorimeter (model: UA2, make: Quantalase Enterprises Pvt Ltd Indore, India) was used for the fluorescence measurement of uranium in an aqueous medium at the excitation and emission wavelengths of 405 and 516 nm, respectively.2.4 Computational details
Quantum chemical calculations were performed using density functional theory. Here, the Vienna ab initio simulation package (VASP)52 electronic structure code was used along with the projector augmented wave (PAW)53 package. The doped systems were constructed using 56 atoms with the Fe3O4 crystal structure as shown in Fig. 15. Geometry optimisation was carried out by relaxing both cell parameters and ionic positions under the framework of the generalized gradient approximation (GGA) using the Perdew–Burke–Ernzerhof (PBE) functional.54 Brillouin zone sampling was carried out using the Monkhorst and Pack scheme55 with a k-point mesh size of 3 × 3 × 3. Self-consistent iteration was continued until energy convergence reached 10−7 eV. The Ecut-off value was kept fixed at 500 eV throughout the calculation. The bulk calculation for the Fe3O4 was performed using the ICSD-029129, which matches the Fe3O4 bulk structure as shown in Fig. 1a. The surface calculation was made by cutting the (3 1 1) surface from bulk Fe3O4 with 112 atoms with O atoms facing the surface. The surface calculation for the Mn-doped Fe3O4 was made from the octahedral Mn-doped Fe3O4 (3 1 1) with 112 atoms. The surface calculations were with a k-point mesh size of 1 × 1 × 1. The calculations were done with a vacuum space of 20 Å over the surface and with a maximum cut-off potential of 500 eV. The convergence threshold was set to 10−5 eV for electronic optimisation and the force convergence was set to 0.02 eV Å−1 for structural optimisation. The interaction with the uranyl ion was done using a total of two electrons, less than the total valence electrons of uranyl and uranyl adsorbed over Mn, Fe (Oct), and Fe(tet) in the above surface. The interaction energy of the surface and the uranyl ions was calculated with K points K (1 1 1) along with the same vacuum region above the surface.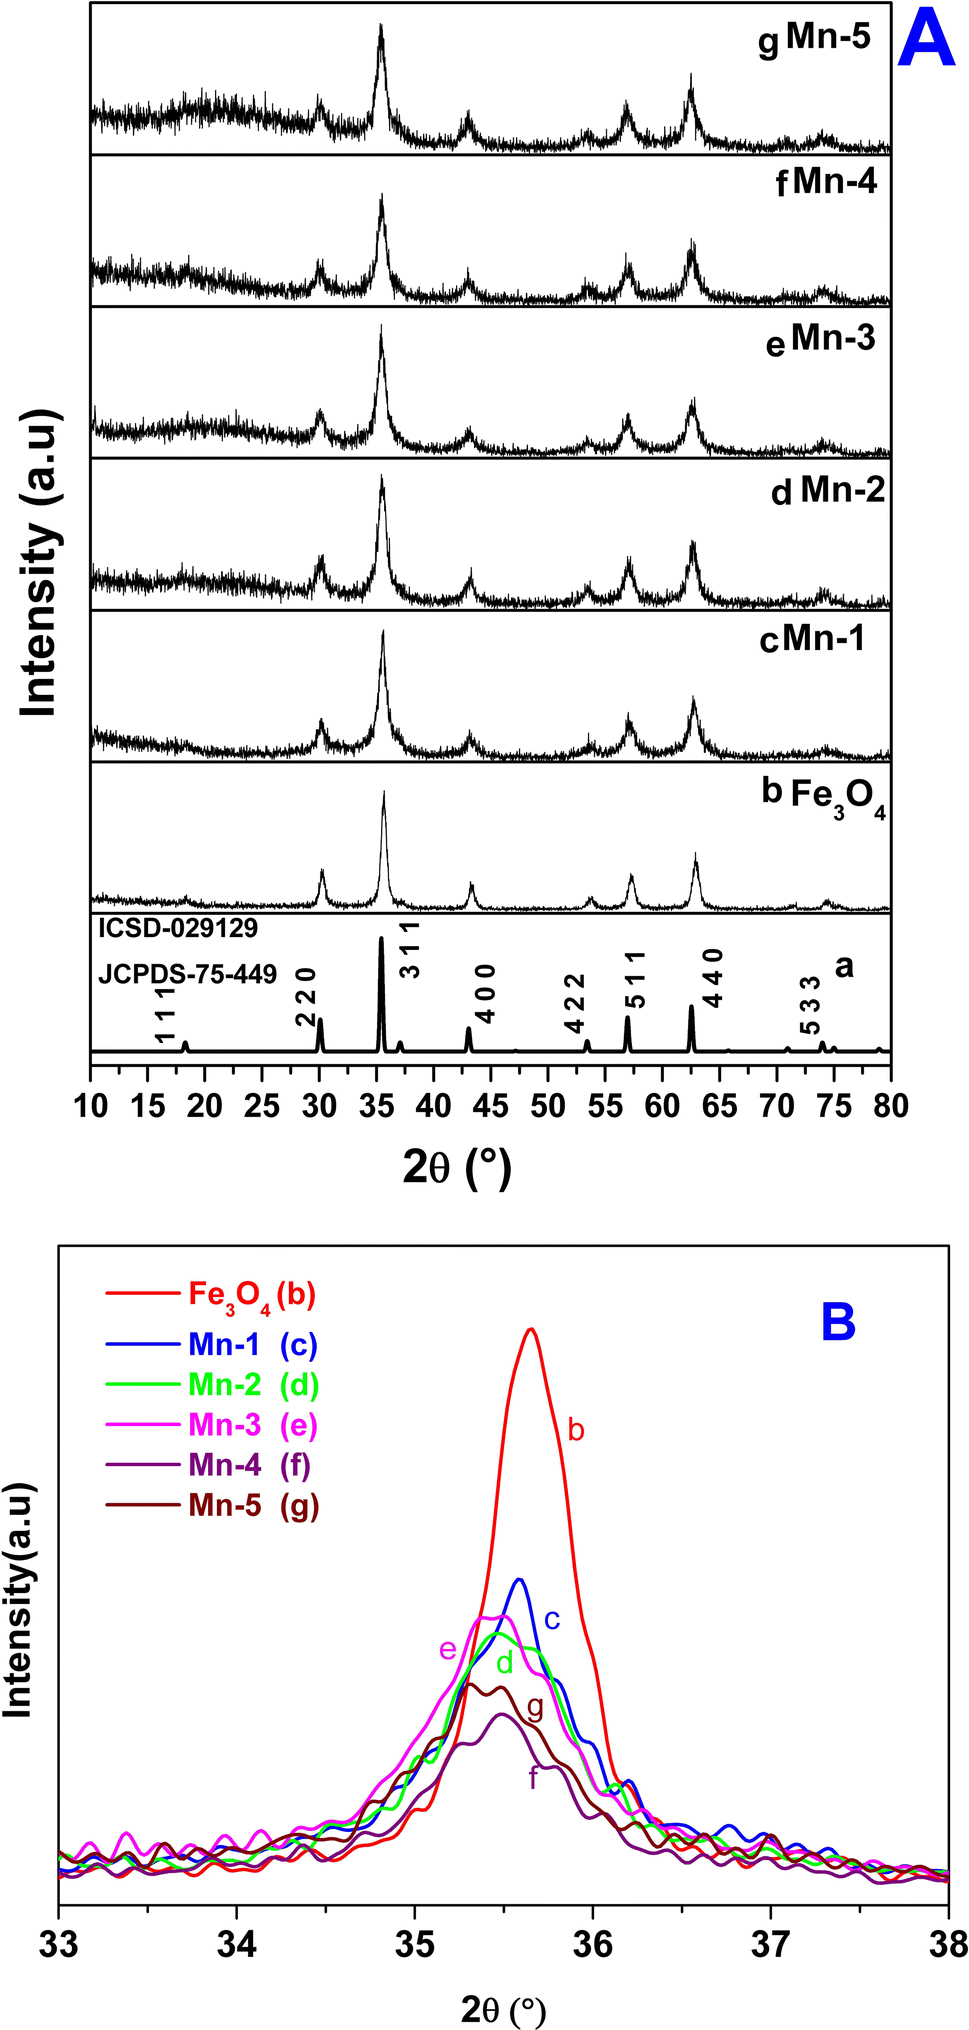 | ||
| Fig. 1 (A) X-ray diffraction data for the synthesized MNPs and Mn-MNPs: (a) Fe3O4 of ICSD-029129, JCPDS75-449; (b) nano Fe3O4; (c) Mn-1; (d) Mn-2; (e) Mn-3; (f) Mn-4; (g) Mn-5. (B) Plots of the only (3 1 1) planes for the above samples: (a) nano Fe3O4, (b) Mn-1, (c) Mn-2, (d) Mn-3, (e) Mn-4, (f) Mn-5. | ||
2.5 Sorption studies over magnetic nanoparticles
A known amount of U(nat.) standard (∼75 ppb) was spiked in a conical flask and then dried on a hot plate. Next, 2.5 mL conc. HNO3 was added and evaporated to dryness, then 5 mL of 0.1 M HNO3 was added and after 10 minutes, 45 mL of distilled water (D/W) was added to prepare 50 mL of known U(nat.) standard reference solution A. 2 mL fraction from solution A was analyzed using the LED fluorimeter for the initial concentration of U(nat.) present in the standard solution A. Next, ∼50 mg of magnetic nanosorbent (MNPs/Mn-MNPs) was added to the standard solution A with sonication. At different time intervals, 2 mL fractions of the supernatant solution were collected to determine the residual uranyl ion concentration. Before collection of the supernatant fraction, all samples were magnetically settled. These fractions were analyzed in a LED fluorimeter (1 mL sample solution + 5 mL sodium pyrophosphate buffer solution) to determine the U(nat.) concentration present in the respective aliquots after adsorption on the magnetic nanoparticles. An equivalent study was carried out at different pH (3, 7 & 10) for all the MNPs and Mn-MNPs samples. pH adjustment of the sample solutions was done using ammonium hydroxide solution.A 1.5 L stock aqueous solution, containing Na (1420 μg mL−1), K (814.7 μg mL−1), Ca (44.2 μg mL−1), and Mg (71 μg mL−1) ions, was prepared, mimicking the average concentration range of these ions present in the bioassay sample urine.56 A natural uranium standard (prepared in 3 M HNO3 medium; the concentration of uranyl ions in the standard solution was ∼9.4 μg mL−1) was spiked (1.5 mL) in the 100 mL stock solution.
To the 100 mL stock solution, ∼100 mg of magnetic nanosorbent was added with sonication. The concentrations of the different ions (Na+, K+, Mg2+ and Ca2+) present in the residual solution at different time intervals were studied with ICP-OES. The effects of competitive ions on the sorption over Fe3O4, Mn-2 and Mn-4 were studied at acidic and basic pH (pH = 4 & pH = 9, respectively).
To understand the kinetics of uranyl ion sorption over the different MNPs and Mn-MNPs, the data were mainly fitted with a sigmoidal curve in Origin 8.0. The fitting with the sigmoidal curve signified a 1st order reaction. The adj. R-square (signifying the statistics for the fitting of the curve) varied from 0.96047 to 0.99826, which signified a good fit.
3. Results and discussion
3.1 X-ray diffraction (XRD)
Fig. 1A shows the characteristic powder-XRD patterns for samples studied in the present investigation: bulk Fe3O4, nano Fe3O4 and the Mn-doped Fe3O4 (Mn-1, Mn-2, Mn-3, Mn-4 and Mn-5). The XRD pattern corresponding to nano-Fe3O4 (Fig. 1A(b)) matches with that of the bulk, cubic inverse spinel Fe3O4 phase (Fig. 1A(a)) (JCPDS 75-449; ICSD-029129). It has a space group of Fd![[3 with combining macron]](https://www.rsc.org/images/entities/char_0033_0304.gif) m S (227) and a cell volume of 580.09 Å3.
m S (227) and a cell volume of 580.09 Å3.
It was inferred that the synthesized nanomagnetic material is Fe3O4 in the cubic inverse spinel structure. The substitutional doping of Mn2+ in the Fe3O4 lattice showed certain distinctive features as outlined in Table 1. The XRD patterns of [Mn-1 to Mn-5] doped samples did not show any characteristic signature of Mn2O3, any other oxide of Mn, or even metallic Mn.
| Sample | BET surface areaa (m2 g−1) | Pore sizeb (Å) | Pore volume (cm3)c | Type of isotherm | Crystallite size (nm)d | Unit cell parameter (a = b = c)e (Å) | Unit cell volume (Å3) |
|---|---|---|---|---|---|---|---|
| a BET surface area from the linear portion of the BET plot in the relative pressure range of (P/P0) 0.05–0.30.b Average pore diameter estimated using the BJH desorption branch of the isotherm.c BJH desorption cumulative volume of pores between 17.000 Å and 3000.000 Å in diameter.d Crystallite size measured from the Scherrer equation.e Unit cell parameters for the MNPS and Mn-MNPs are calculated using the POWDERX software, where Fe3O4 matches the JCPDS file (#75-0449); ICSD (#029129) showing the Fdm (227) space group with the cubic unit cell structure of a = b = c = 8.31 Å, vol = 580.09 Å3 α = β = γ = 90. |
|||||||
| Fe3O4 | 89.03 | 60.52 | 0.19 | IV | 9.95 | 8.346(2) | 581.54(0.28) |
| Mn-1 | 153.03 | 60.71 | 0.26 | IV | 9.41 | 8.369(4) | 586.24(0.51) |
| Mn-2 | 168.54 | 80.80 | 0.30 | IV | 8.84 | 8.372(7) | 586.77(0.88) |
| Mn-4 | 171.04 | 50.70 | 0.24 | IV | 8.77 | 8.383(9) | 589.16(1.13) |
| Mn-5 | 129.14 | 56.47 | 0.26 | IV | 8.72 | 8.389(6) | 590.59(0.83) |
However, elemental analysis by energy-dispersive X-ray fluorescence (EDXRF) (Fig. S1) showed the presence of Mn in the Mn-doped Fe3O4 samples, which proved that Mn was substitutionally doped in the cubic Fe3O4 lattice. The oxidation state of the doped Mn will be probed later in the XPS section. The Mn-MNPs (Mn-1 to Mn-5) (Fig. 1A(c)–(g)) showed the same phase as that of nano-Fe3O4. Although all the XRD patterns (for the Mn-doped samples) showed a single-phase character, the XRD lines of the nano Fe3O4 and Mn-doped Fe3O4 samples exhibited significant broadening as compared to the parent nano Fe3O4 along with a slight shift in the 2θ value of the primary (3 1 1) plane as shown in the Fig. 1B, which showed strain due to the doping of Mn in the Fe3O4 lattice. The coherently diffracting domain sizes calculated using the Scherrer equation from the broadening of the FWHM of the (311) peak are shown in Table 1. The crystallite size of nano Fe3O4 was about 9.95 nm. The average crystallite size of the Mn-doped Fe3O4 [Mn-1 to Mn-5] materials was reduced as a function of the Mn2+ doped into the Fe3O4 lattice, and is also presented in Table 1. The crystallite size for Mn-1 is ∼9.41 nm and that of Mn-5 is ∼8.72 nm.
The ionic radius of Mn2+ is 83 pm (coordination number VI and high-spin state) and that of Fe2+ is 78 pm (coordination number VI and high-spin state).57 Similarly, the covalent character of the Mn2+–O bond will be lower as compared to that of the Fe2+–O bond, therefore, the bond length of Mn–O is expected to be greater as compared to that of Fe–O.58 The lattice parameters of the Mn-doped samples are included in Table 1. There is a substantial expansion in the Fe3O4 lattice parameters [a = b = c-axis (cubic) and the volume] as a function of the Mn2+ dopant concentration in the Fe3O4 lattice. Mostly, Mn2+ substitutes for the octahedral Fe2+ in the Fe3O4 lattice (as is shown in the subsequent sections) and, therefore, would cause an increase in the lattice parameters and volume of the lattice.
3.2 Raman spectroscopy
Fig. 2 shows the Raman spectra of the Mn-doped Fe3O4 samples including nano Fe3O4. Fe3O4 possesses an inverse spinel structure with a space group of Fdm with a typical AB2O4 structure [A–Fe3+ & B–Fe2+/Fe3+]. The point group for the above Fe3O4 lattice is in the static configuration D3d and if considered overall, it is octahedral (Oh). According to the factor group analysis, considering the Oh point group, there are 15 different vibrational modes of which 6 are Raman active, 6 are IR active, and 3 are photoacoustic modes.59
 | ||
| Fig. 2 Raman spectra of the synthesized MNPs and Mn-MNPs: (a) nano Fe3O4; (b) Mn-1; (c) Mn-2; (d) Mn-3; (e) Mn-4, and (f) Mn-5. | ||
Fig. 2a shows three Raman peaks for nano Fe3O4: 671 cm−1 (A1g), 510 cm−1 (T2g), and 350 cm−1 (Eg). The other peaks were not observed for the present system. Mn-1 and Mn-2 (Fig. 2b and c.) also possess the same set of peaks as Fe3O4. Two new peaks (275 and 217) cm−1 were observed for the Mn-3 and Mn-5 (Fig. 2d and f). These peaks are due to γ-Fe2O3, which is known to form under the thermal oxidative effect of the laser during Raman spectroscopy.60 No Raman peaks for the MnOx were observed. This proves that Mn is doped in the Fe3O4 lattice.61 With greater doping of Mn in the Fe3O4 lattice, Raman peaks of Fe3O4 were observed, which invariably indicated that Mn was doped in the Fe3O4 lattice and there were no other segregated phases of any MnOx in the Mn-doped Fe3O4 system.
The average pore size and total pore volume were also found to be almost similar for all the Mn-doped Fe3O4 samples (Table 1). Fig. 3 illustrates the typical nitrogen adsorption–desorption isotherms obtained for various Mn-doped Fe3O4 samples.
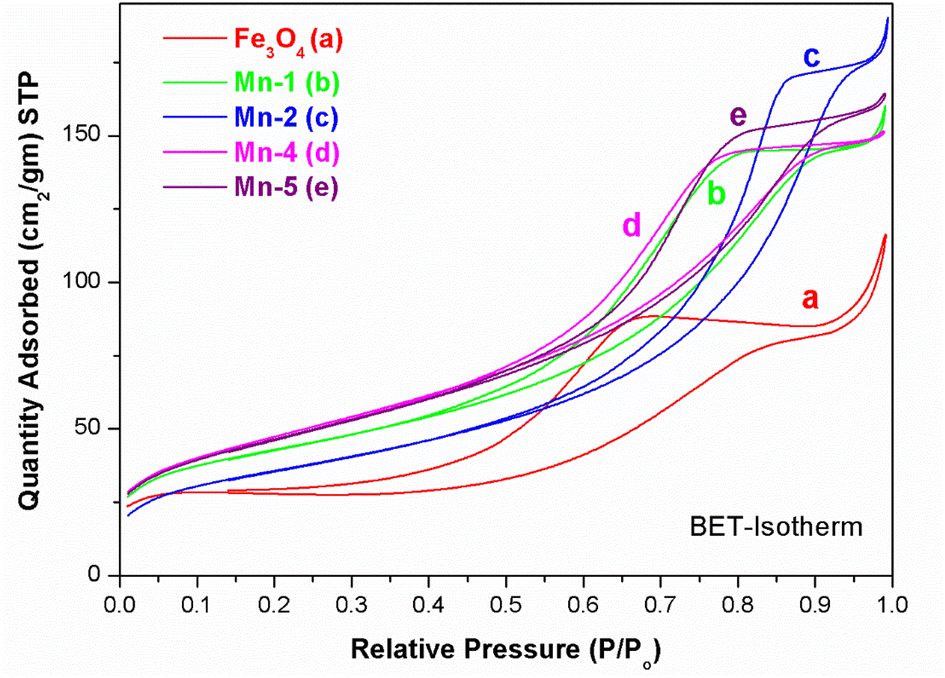 | ||
| Fig. 3 BET -isotherms for the different samples of MNPs and Mn-MNPs: (a) Fe3O4; (b) Mn-1; (c) Mn-2; (d) Mn-4 and (e) Mn-5. | ||
The type IV (IUPAC) hysteresis loop indicates the presence of mesoporous character in the sample. All the samples showed similar hystereses in their respective isotherm plots with inflection points in the P/P0 range of 0.45–0.7, suggesting mesoporosity in these samples as presented in Table 1. The inflection seen at P/P0 of ∼0.9 may be attributed to the macropores caused by particle–particle porosity.
In Table 1, the units are represented in their generic terms, however, the S.I units for the above are as follows: 1 Å = 10−10 m; 1 nm = 10−9 m; 1 cm3 = 10−3 m3 kg−1; 1 m2 g−1 = 10−3 m2 kg−1.
3.3 Electron microscopy studies
 | ||
| Fig. 4 (A) SEM images along with the EDS patterns of the synthesized (a) Fe3O4, (b) Mn-1, (c) Mn-4. (B) Elemental mapping of O, Fe, and Mn for Mn-4. | ||
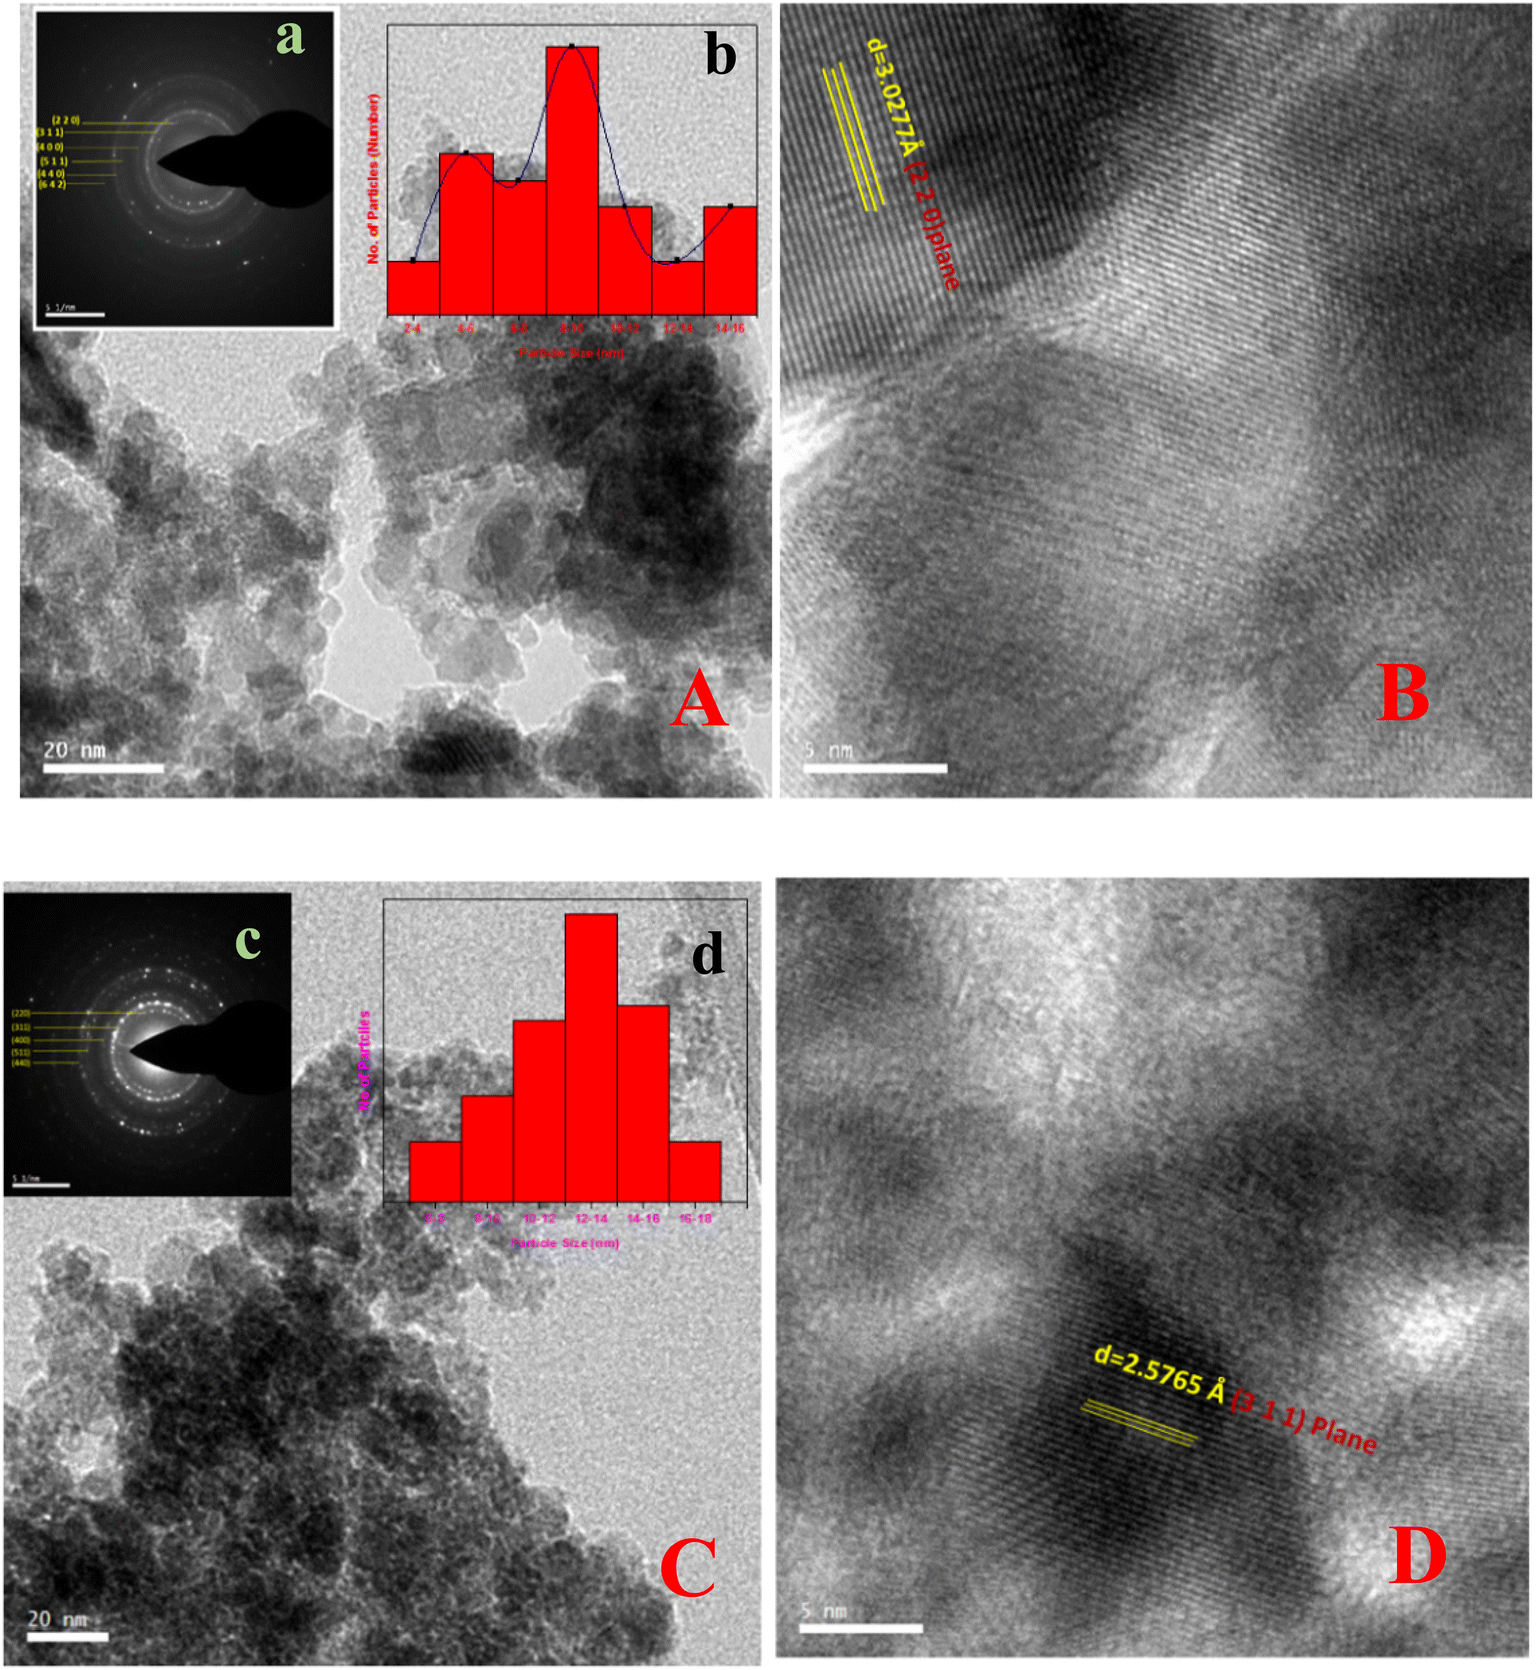 | ||
| Fig. 5 TEM and HRTEM images along with the required d-spacings of Fe3O4 and Mn-3 samples: (A) (a) TEM image along with the SAED pattern (inset) with the assigned crystallographic plane, and (b) the particle size distribution of Fe3O4 particles (inset). (B) The HRTEM image with d-spacing and the required plane for Fe3O4. (C) TEM images of Mn-doped Fe3O4 (Mn-3) along with the SAED pattern (inset) with the assigned crystallographic plane and particle size distribution of Mn-3 (inset). (D) HRTEM image with d-spacing and the required plane for Mn-3. | ||
3.4 Zeta potential
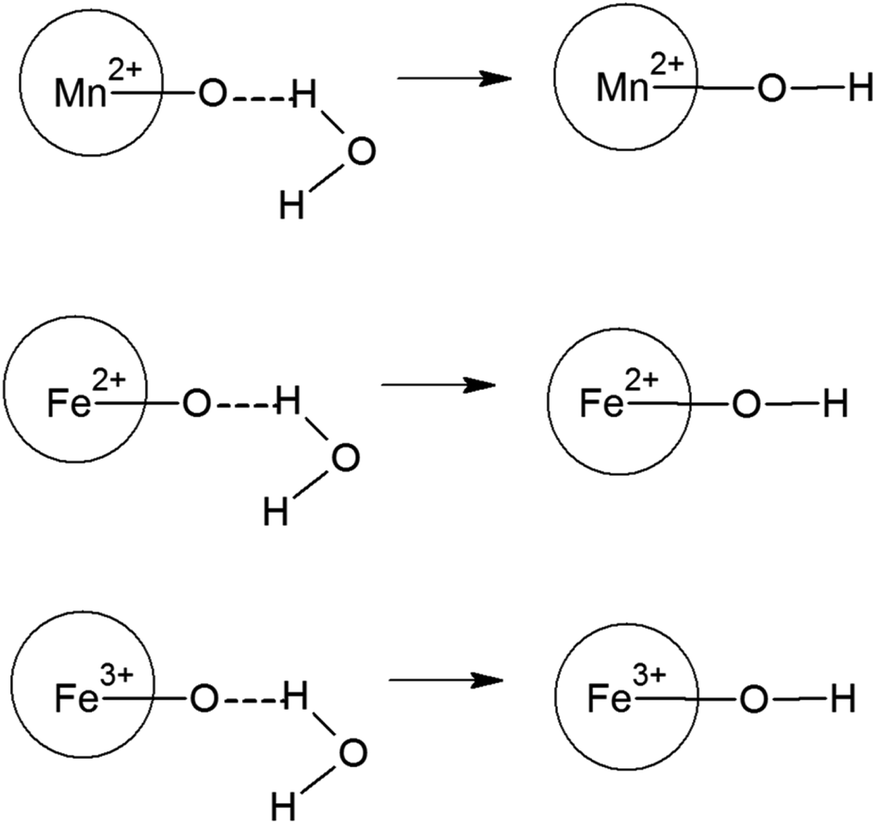
The zeta potential is majorly understood by the effective calculation of the surface potential of the formed double Helmholtz layer over the surface for the Fe3O4 and Mn-doped Fe3O4 materials. The variation of the surface potential is an important factor in deciding the sorption of the uranyl ion (UO22+), which is a charged cation, over the surface of the Fe3O4 and Mn-doped Fe3O4 surface. Therefore, Fig. 6 shows the plot of zeta potential at different pH as a function of Mn-doping in the Fe3O4 system. It was observed that at lower pH (pH-3), the Mn-2% doped sample possessed the maximum positive zeta potential as a function of Mn-doping. However, at neutral pH, it was observed that upon doping with Mn, the surface zeta potential became more positive as shown in Fig. 6b, where the Mn-1 sample had the maximum positive zeta potential. Schemes 2 and 3 portray the hydration of the Mn-doped Fe3O4 system followed by the formation of the double Helmholtz layer to obtain a positive zeta potential as a function of Mn-doping in a neutral medium or at pH ∼ 7. | ||
| Fig. 6 Plots of zeta potentials at different pH: (a) pH-3; (b) pH-7 and (c) pH-10 as a function of Mn-doping in the Fe3O4 lattice. The bar at each point represents the error bar from the average of three sets of data taken for the same pH. This error along with the instrumental error contains the error in the pH calculation as shown in the legends. (Note: The S.I unit of zeta potential is V; 1 mV = 10−3 V). | ||
 | ||
| Scheme 2 Formation of the outer hydration layer with Mn-doped Fe3O4. These schemes are mere representations and do not show the actual model. | ||
 | ||
| Scheme 3 Formation of double Helmholtz layer in the neutral medium. This scheme is a mere representation and do not show the actual model. | ||
The Mn-doped Fe3O4 would have mainly three types of cation, namely, Mn2+, Fe2+ and Fe3+ on its surface since M–O is present. As depicted in Scheme 2 this may be one of the many ways for the solvation of the Mn-doped Fe3O4. In this route, since M–O (M = Mn2+, Fe2+ and Fe3+) forms M–OH in the neutral medium, Mn2+ being the least electropositive among the three ions will attract less electron density from O in the described M–O bond and the O will therefore possess the maximum electron density [Mδ+–Oδ−⋯H–O–H]; therefore, the formation of the outer stable hydration layer will be greatest for the Mn2+. Clustering of the particles leads to an increase in particle size as observed in the TEM. The clustering of these particles accumulates more positive charge, leading to the formation of a higher positive surface charge and similarly higher zeta potential of Mn-doped Fe3O4 materials as observed in Fig. 6b.
As observed in Fig. 6a, in an acidic medium (pH = 3), the zeta potentials of the surfaces of all the Mn-doped Fe3O4 samples are mainly positive. It was also observed that an alteration in the zeta potential as a function of Mn-doping initially increased and had a maximum at the Mn-2 sample for Mn-doped Fe3O4. The formation of the double Helmholtz layer and its effect on the variation of the zeta potential in the acidic medium (i.e., low pH) are shown in Scheme 4. The lower pH will possess excess H+ ions, which will be adsorbed over the M–OH surface to form the A-type complex that will mainly have a surface with a positive charge, resulting in a positive surface charge. The Mn2+ will possess the least positive oxidation charge over it as compared to Fe2+ and Fe3+. Therefore Mn2+ will attract a lower positive charge density from the surface layer and thereby, the surface will be more positive for Mn-doping as observed in Fig. 6a.
 | ||
| Scheme 4 Formation of the surface layer for the zeta potential in different media with low pH (acidic) and high pH (basic) in the present system. | ||
The zeta potential for the Mn-doped Fe3O4 initially increased and thereafter, the zeta potential for the higher-doped Mn2+decreased as compared to Mn-1; this could mostly be due to the interparticle repulsion of the Mn2+ moieties that is bound to occur with an increase in the Mn2+ doping percentage in the Fe3O4 lattice.
Fig. 6c shows that the zeta potential for the Mn-doped Fe3O4 species is negative at a very high pH of ∼10. This could also be explained similarly by Scheme 4 as given above. In high pH media, there will be a high population of the OH− ion. These OH− ions will, in turn, extract an H+ ion to form a complex ion like B representing the double Helmholtz layer. Therefore, the surface charge for this surface layer will be negative, as was observed in the experiments. With Mn-doping, the Mn will attract lower electron density from the surface as compared to that of Fe2+ and Fe3+, thus making the surface charge of the Mn-doped Fe3O4 moieties more negative as compared to only Fe3O4. This is also observed in Fig. 6c where the Mn2+ doping further lowers the zeta potential.
3.5 XPS-studies
The XPS studies were conducted for the different Mn-doped Fe3O4 and nano Fe3O4 magnetic materials. Fig. 7A shows the Fe 2p XPS spectrum of the Mn-doped Fe3O4 along with that of nano Fe3O4. Fe 2p3/2 and Fe 2p1/2 are shown at 710.8 and 724.8 eV, respectively, as has been reported for the Fe3O4 system in previous reports.62,63 In Fe3O4, iron has two oxidation states, Fe2+ and Fe3+, with the former being octahedrally coordinated and the latter distributed over both octahedral and tetrahedral sites to produce the inverse spinel structure.64 These spectra were deconvoluted to understand the presence of the Fe2+ and Fe3+ present in the Fe3O4 system individually. Partially filled 3d levels result in the complex p–d mixing of the orbitals leading to the formation of the shake-up peaks,65–67 all of which contribute to the peak structure, leading to the formation of the satellite peak in Fe3O4. However, in previous reports, satellite peaks were absent for the Fe3O4 system.63–69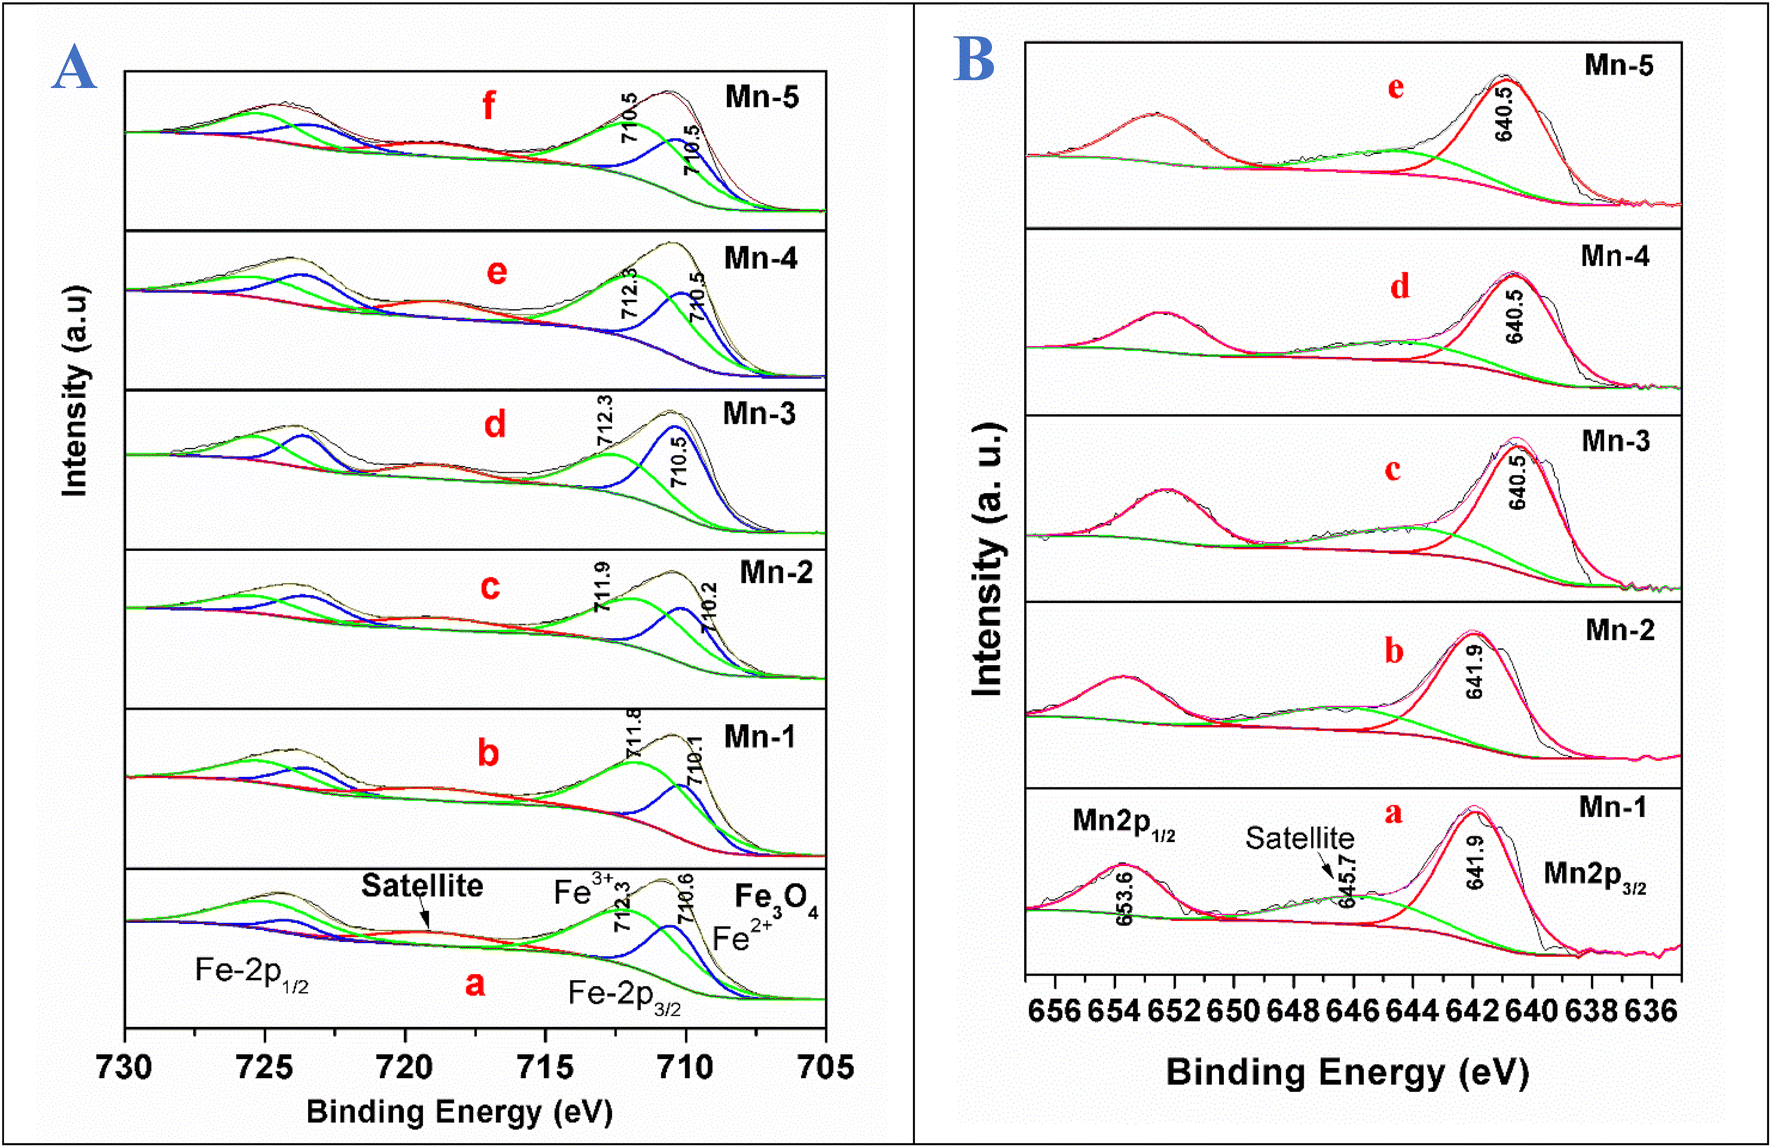 | ||
| Fig. 7 (A) XPS spectra showing the deconvoluted Fe 2p (2p3/2 and 2p1/2) peak for the samples: (a) nano Fe3O4; (b) Mn-1; (c) Mn-2; (d) Mn-3; (e) Mn-4; (f) Mn-5. (B) XPS spectra for the deconvoluted Mn 2p (2p3/2 and 2p1/2), and the different nano Mn-doped Fe3O4 systems: (a) Mn-1; (b) Mn-2; (c) Mn-3; (d) Mn-4; (e) Mn-5. Note: It is worth mentioning that although the S.I. unit for energy is the Joule (J), in XPS terms, the binding energy (B.E.) is always represented in eV only (1 eV = 1.6021 × 10⁻¹⁹ J). Therefore, in the entire text, B.E. is represented in eV units for brevity. | ||
For the Fe3O4 system synthesized by the co-precipitation method, we observed the presence of a satellite peak at 718.9 eV. The peak at 710.6 eV was attributed to Fe2+ and the peak at 712.3 eV is due to Fe3+, which is consistent with a previous report.67 However, since the source of the present XPS is non-monochromatic Al Kα, the further deconvolution of Fe3+ in the octahedral and tetrahedral states is not differentiable. With the substitutional doping of Mn in the Fe3O4 lattice, there was a very minor decrease in the binding energies of both Fe2+ and Fe3+ by 0.5 eV for Mn-1. In the other samples, the B.E decreased to 0.4 eV for Mn-2, and 0.1 eV for the rest of the samples (Mn-3 to Mn-5) as shown in Fig. 7A. This shows that the electronic interactions between that of Fe3+/Fe2+ and that of the Mn ion were negligible, which mostly points towards the fact that Mn is doped as Mn2+ mostly replaces the Fe2+ sites, which is confirmed in a later section regarding the XPS results for the Mn 2p for the Mn-doped Fe3O4 systems.
Fig. 7B shows the Mn 2p XPS data for the different Mn-doped Fe3O4 samples. For the Mn-1 sample, the Mn 2p XPS spectrum shows the Mn 2p3/2 and Mn 2p1/2 peaks, respectively, at 641.9 and 653.6 eV, suggesting the presence of only Mn2+ as was observed previously.70–72 Upon the deconvolution of these peaks, only one peak could be fitted, showing the absence of any other oxidation state of Mn in the doped Mn in the Fe3O4 lattice. A satellite peak at 645.7 eV mostly shows the overlap with the valence d-band for Mn;73,74 in a transition metal, the satellite main peak is a function of several atomic parameters, of which the core overlap with the valence band is prime. The change in electronic density around Mn for the Mn-1 and Mn-2 samples was less, as shown in Fig. 7B(a). However, after Mn-2, there was a decrease in the binding energy by 1.4 eV from Mn-3 to Mn-5, as shown in Fig. 7B(c–e). The doped Mn2+ is a d5 system, whereas the Fe2+ is a d6 system. Mn2+ mostly substitutes for the Fe2+ present in the octahedral positions of the Fe3O4. To fit the octahedral position, the Mn d5 system obtains more electron density to become stabilised in the octahedral sites only and not in other tetrahedral sites to form a disordered system. This is indirect evidence that shows that the Mn2+ mainly replaces the Fe2+-octahedral sites.75
Fig. 8 shows the O 1s XPS spectra for the different Mn-doped Fe3O4 samples. The nano Fe3O4 possesses O 1s binding energy (B.E) and a peak was observed at 529.8 eV, which can be deconvoluted into three peaks at 529.6, 530.3 and 531.9 eV, respectively (Fig. 8a). The B.E corresponding to the first peak (529.6 eV) represents the lattice –O attached to Fe2+; the second peak (530.3 eV) corresponds to the lattice –O attached to Fe3+ and the third peak (531.9 eV) corresponds to the surface –OH groups present over Fe3O4. The Mn-1 sample has an O 1s peak at 529.8 eV and can be deconvoluted into four peaks at 529.2, 529.9, 530.7, and 532.2 eV, respectively (Fig. 8b). The first three O 1s peaks represent lattice O-atoms where the first O (529.2 eV) is the one attached to Mn2+, the next 529.9 eV represents that for O– attached to Fe2+ and the third one to that of Fe3+. The last O 1s represents the surface –OH groups for Mn-1-doped Fe3O4. Similarly, for the other Mn-doped Fe3O4 samples, viz. Mn-2, Mn-3, Mn-4 and Mn-5, the respective O 1s spectra are given in Fig. 8(c–f). As a function of Mn-doping, for Mn-3 to Mn-5, the binding energy for the O-attached to Mn increased from 529.2 to 529.4 eV, showing that Mn2+ mainly draws electron density from the –O of the Mn–O bond, thereby maintaining the Mn–O bond length, the same as that of the Fe–O (Fe2+–O) octahedral bond length. However, the O 1s representing O(Fe2+–O) and O-(Fe3+–O) remained almost unaltered throughout the series. Therefore, it can be deduced that the Mn2+ substitutes for the Fe2+ sites in the Fe3O4 inverse spinel lattice.
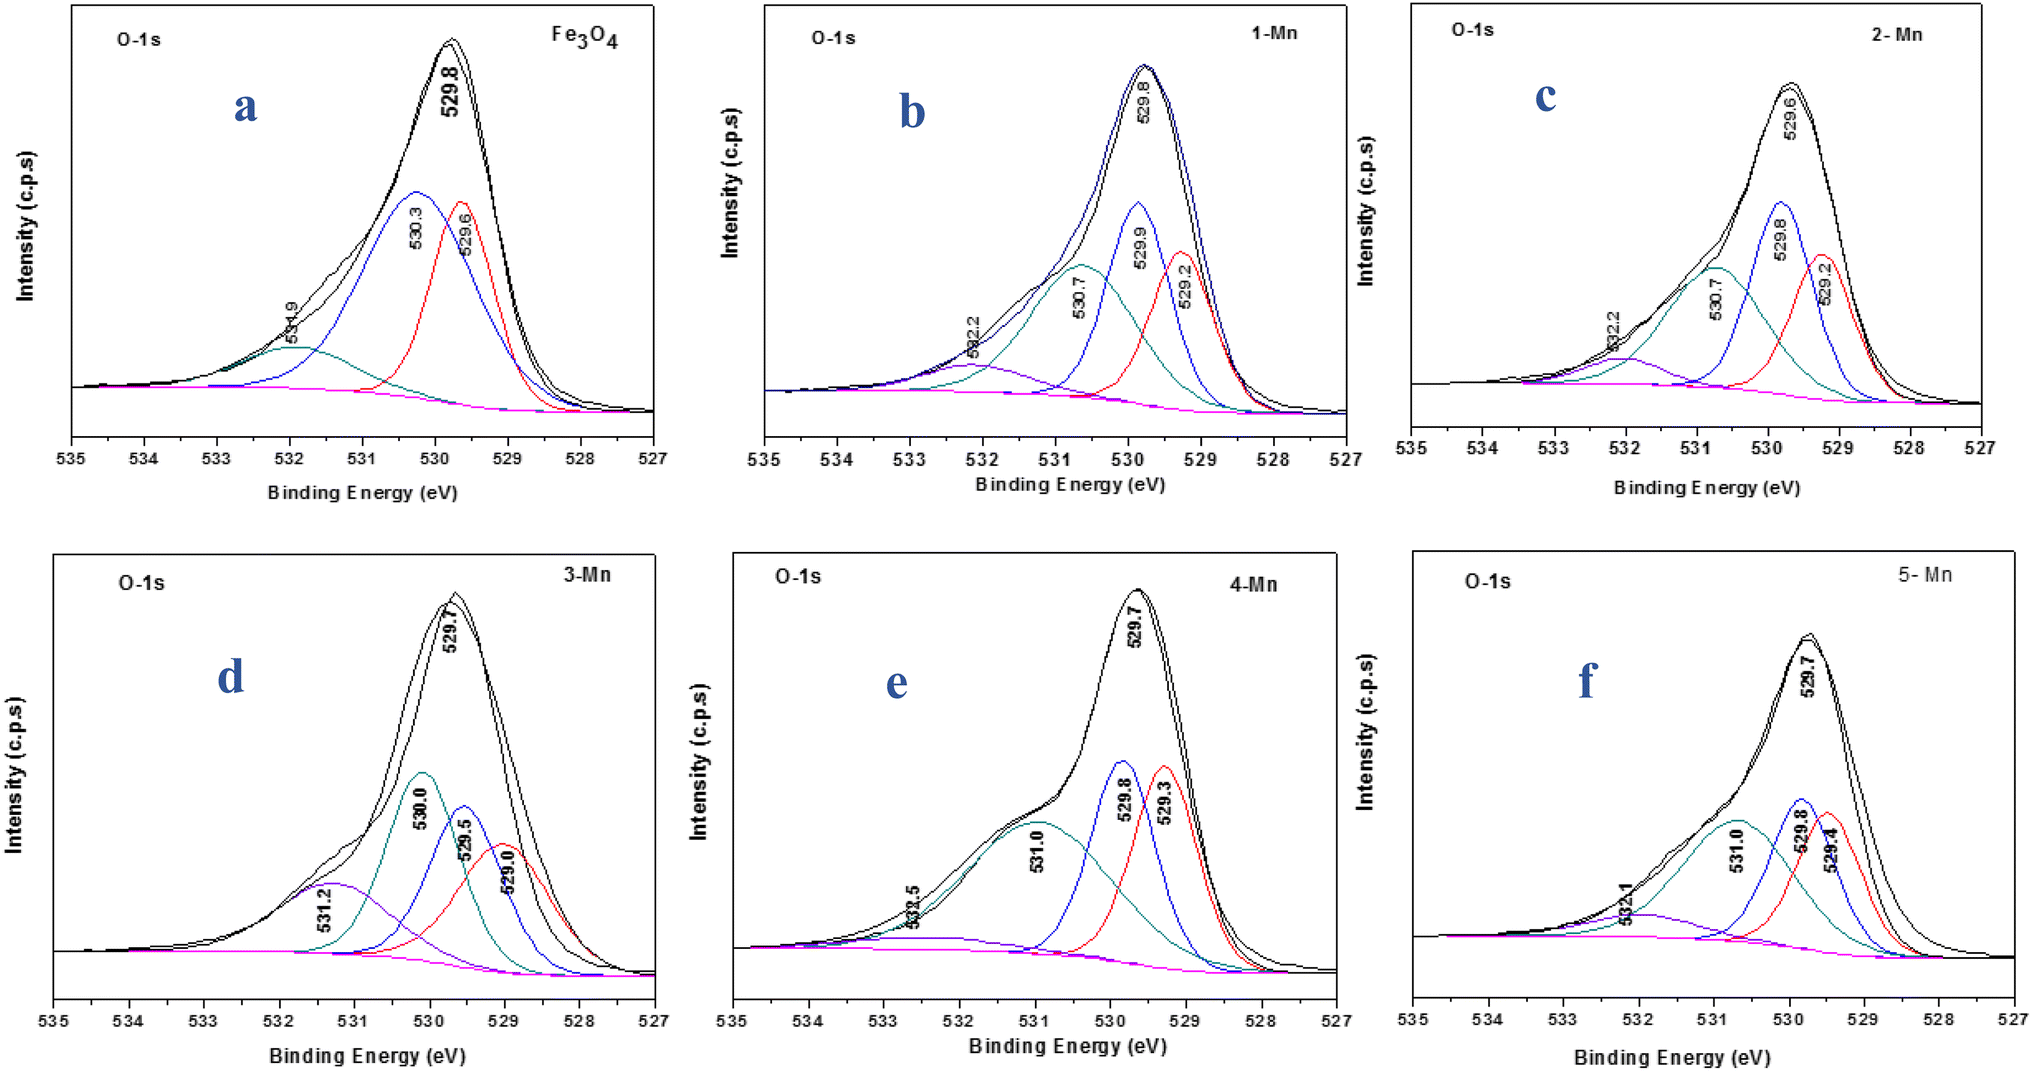 | ||
| Fig. 8 XPS spectra showing the deconvoluted O 1s peaks for the different samples of MNPs and Mn-MNPs: (a) nano Fe3O4; (b) Mn-1; (c) Mn-2; (d) Mn-3; (e) Mn-4; (f) Mn-5. | ||
Fig. 9A shows the comparison of XPS data for Fe3O4 and Mn-doped Fe3O4 after uranyl ion adsorption over their respective surfaces. In Fe3O4 there is a significant lowering of the binding energy (1.2 eV) of Fe2+ after the uranyl ion adsorption over the Fe3O4 surface. This has been shown in Fe 2p XPS data portrayed in Fig. 9A(a and b).
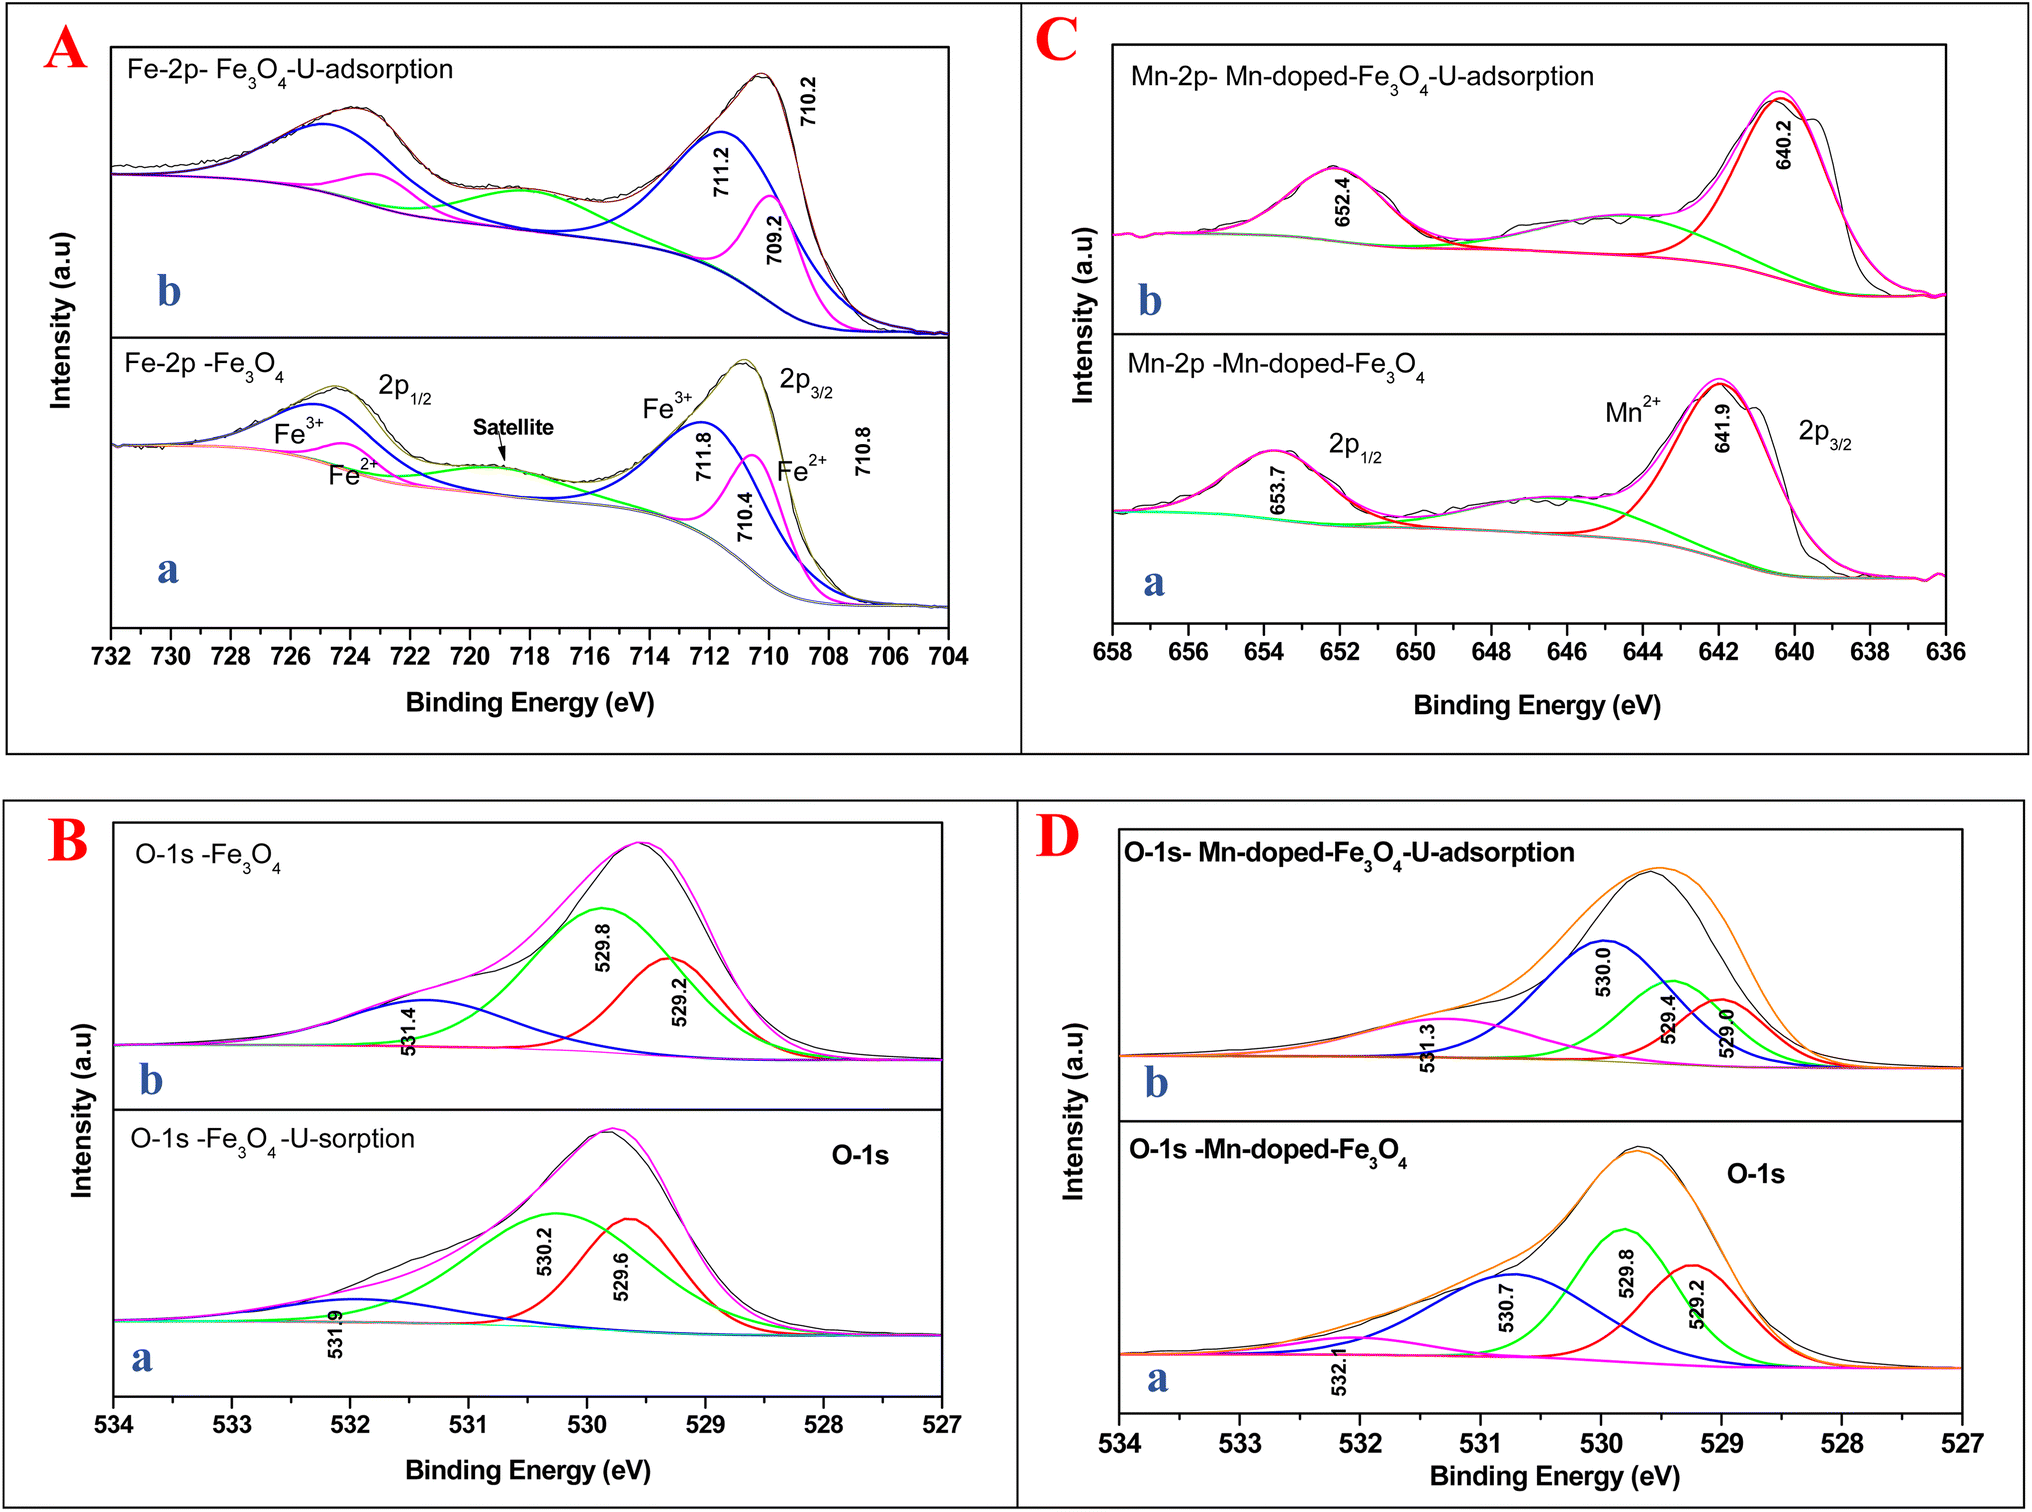 | ||
| Fig. 9 XPS spectra for the comparison of the process of sorption interaction: (A) Fe 2p for (a) Fe3O4 and (b) Fe3O4 after U sorption post-drying. (B) O 1s – (a) Fe3O4 and (b) Fe3O4 after U sorption post-drying. (C) Mn 2p for (a) Mn-2 and (b) Mn-2 after U adsorption and post-drying. (D) O 1s for (a) Mn-2 and (b) Mn-2 after U adsorption and post-drying. | ||
It is quite apparent that Fe3+ remained almost unaltered even after the uranyl adsorption (711.8 to 711.2 eV, respectively). This is a clear sign that the uranyl ion is adsorbed mostly over the Fe2+ ions in the surface of Fe3O4 as compared to the Fe3+ ions, as shown in Scheme 5. This is mainly because the uranyl ion (UO22+) is a cation with a charge of +2 and would have lower electronic repulsion with Fe2+ sites. Therefore, Fe2+ (d6 electrons) possesses more electron density as compared to Fe3+ (d5 electrons) in the Fe3O4 inverse spinel lattice. Upon adsorption, the electronic interaction is mostly with the O of uranyl ions and that of Fe2+ in Fe3O4. Thus, upon adsorption of the uranyl ion, a certain amount of electron density is shifted from O (uranyl ion) to Fe2+ (Fe3O4). Therefore, the post-adsorption Fe2+ possesses a lower binding energy as compared to the Fe2+ of the parent Fe3O4. However, in Fig. 9B, which shows the O 1s XPS spectra for Fe3O4 and Fe3O4 after the adsorption of uranyl ions, the shift in the binding energy is nominal (∼0.4 eV), which indicates that the O of Fe3O4 does not have substantial interactions with the U6+ of the uranyl ion as has been portrayed in Scheme 5. Therefore, in the Fe3O4 surface, the contribution of the Fe2+ ions will mainly affect the process of adsorption for the uranyl ions. Fig. 9C presents the XPS comparison data of Mn 2p for the Mn-2 sample, where it shows the effect of the uranyl ion adsorption over the Mn-doped Fe3O4 sample. There is a definite lowering in the binding energy for the Mn 2p (∼1.7 eV) where the Mn 2p shifts from 641.9 to 640.2 eV after the uranyl ion adsorption. This also points towards a definite interaction between the substituted Mn2+ ion in the Mn-doped Fe3O4 lattice and that of the uranyl ion. The interaction between the Fe2+ or Fe3+ present in the Mn-doped Fe3O4 is shown in Fig. S2,† where it is reflected that there was very little alteration in the binding energy of the Fe2+/Fe3+ after uranyl ion adsorption over the Mn-doped Fe3O4. Hence, it may be concluded that the uranyl ion mainly interacts with the Mn2+ ions of the Mn-doped Fe3O4 surface. This can also be understood from the similar explanation given above. The uranyl ion, being charged, will interact with the most electron-dense part of the surface, namely, the Mn2+ ions. This is reflected in Scheme 6. Fig. 9D presents a comparison of the O 1s XPS peaks for the same Mn-doped samples after the uranyl ion adsorption in the system. Similarly, the lowering of the binding energy for the O 1s system is negligible (∼−0.4 eV) and Scheme 6 shows that there is very little or negligible interaction between the U6+ of the uranyl ion and O in the Mn-doped Fe3O4 lattice surface.
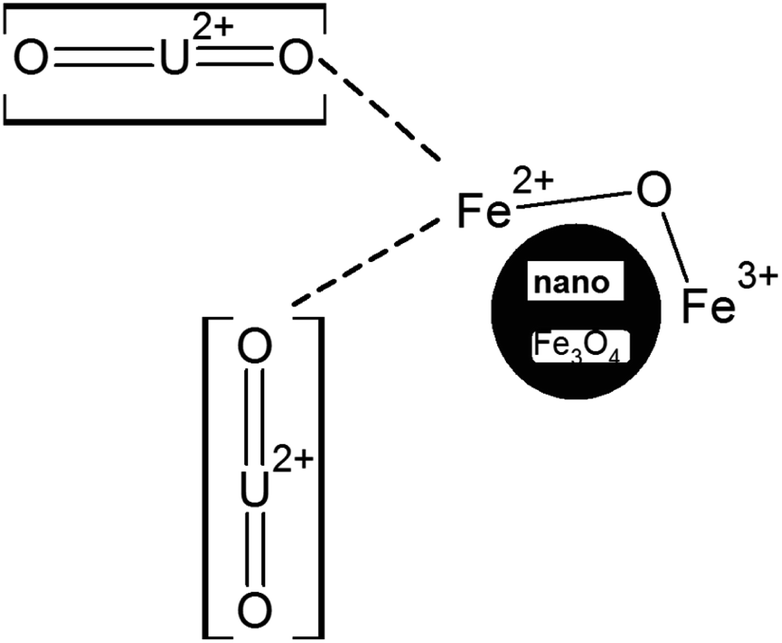 | ||
| Scheme 5 Representation of the binding of Fe2+ sites with the UO22+ ions in the synthesized Fe3O4 nanoparticles. The above schematic representation is not indicative of molecular-level bonding phenomena. | ||
 | ||
| Scheme 6 Representation of the binding of Mn2+ sites with the UO22+ ions in the synthesized Mn-doped Fe3O4 nanoparticles. The above schematic representation is not indicative of molecular-level bonding phenomena. | ||
3.6 Magnetic studies at room temperature
The VSM results for the magnetic study are shown in Fig. 10 for the different samples of MNPs and Mn-MNPs at room temperature only. The results show the magnetic moments for all the Mn-MNPs to be greater as compared to the Fe3O4 samples. | ||
| Fig. 10 Magnetization of the different Mn-doped samples over Fe3O4. | ||
The above room temperature VSM studies show the magnetic moments for the samples as 36.74, 42.44, 55.2, 44.4 and 45.8 emu g−1 [(S.I unit for magnetization is A m−1); 1 emu g−1 ≡ 5.17 × 10³ A m−1 for Fe3O4 & Mn-doped Fe3O4 samples; the dopant percentage is negligible so the density for all the materials can be considered the same as Fe3O4] for the samples Fe3O4, Mn-1, Mn-2, Mn-4 and Mn-5, respectively. The magnetic moment initially increased and at a greater concentration of the Mn-dopant in the Fe3O4 lattice, the magnetic moment decreased. It is quite evident from the XPS data that in Mn-doped Fe3O4, the Fe2+ sites are substituted by the Mn2+ ions. Mn2+ is a d5 system with a higher magnetic moment, whereas the Fe2+d6 system possesses a lower magnetic moment as compared to Mn2+. This phenomenon is manifested up to the Mn-2 sample where with a higher concentration of Mn2+ dopant, the magnetic moment increases as observed in Fig. 10. This can also be an alternate proof showing that for the Mn-doping in the Fe3O4 lattice, the Fe2+ sites are mainly substituted by the Mn2+ ions.
However, it has been observed by Warner et al.,49 that a higher concentration of Mn2+ doping (>5 wt%) resulted in lowering magnetic moments. This has been ascribed to the transition from magnetite to maghemite with its lower saturation magnetization (Ms), resulting in the distribution of Fe3+ ions on the tetrahedral and octahedral sites to a greater extent as compared to the Fe3O4 lattice. In addition, previous literature also shows a strong dependence of Ms on the particle size, which has similarly been stated earlier for the Mn-doped Fe3O4 systems. Here, these nanoparticles experience spin canting over the surface, thereby lowering their magnetic moment, which is probably true for these Mn-MNPs.76 Table 1 shows that as a function of Mn-doping, the crystallite decreases, which will further augment the spin canting term to a greater extent in the highly Mn-doped Fe3O4 systems.
3.7 Sorption studies for uranyl ions
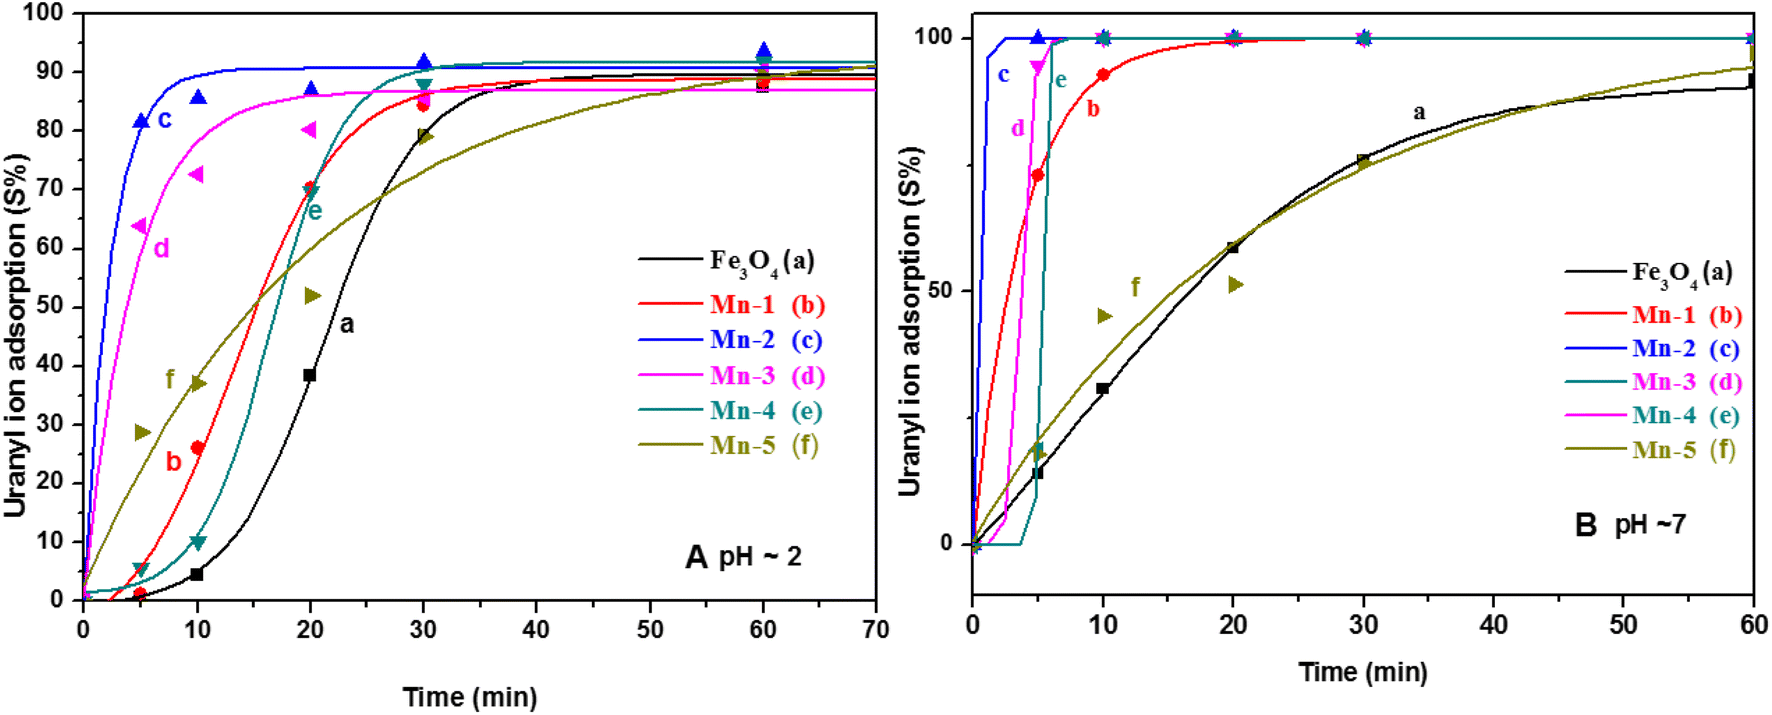 | ||
| Fig. 11 The adsorption of uranyl ions (S%) on different samples of MNPs and Mn-MNPs at (A) pH = 3 and (B) pH ∼ 7 for (a) nano Fe3O4; (b) Mn-1; (c) Mn-2; (d) Mn-3; (e) Mn-4; (f) Mn-5. | ||
Almost all the sorbents including the MNPs and the Mn-MNPs adsorbed nearly 100 percent of the uranyl ions within ∼60 minutes. Fig. 11 shows the good sigmoidal fitting of the sorption parameters, indicating that the sorption behaviors of all the sorbents followed first-order kinetics. Fig. 11A shows that the Mn-2 sample followed the fastest kinetics for sorption. To quantitatively describe the kinetics of the sorption, the t1/2 of the sorption rate was determined, where “t1/2” is calculated as the time in which 50 percent of the uranyl ions are adsorbed over the MNPs and the Mn-MNPs. This is taken as a kinetic factor to understand the efficiency of the kinetics of the different MNPs.
Adsorption is also represented by distribution coefficient (Kd) (eqn 1) values that were calculated from the analyzed post-contact solution and reference solution activity values using the following equation: (eqn 3)
 | (1) |
Sorption percentage (S%) (eqn 2) as in Fig. 11, plotted with time, can be defined as
 | (2) |
The t1/2 values and the Kd values for the sorption reactions over the MNPs and the Mn-MNPs are plotted in Fig. 12. With the lowest t1/2 and highest Kd for the sorption of uranyl ions over the Mn-2 sample (Fig. 12) in the acidic and neutral medium, Mn-2 is the best material among the MNPs and Mn-MNPs synthesized in this study for uranyl ion sorption. The t1/2 values at different pH for the sorption of uranyl ions over the surface of MNPs and Mn-MNPs are well reflected in Fig. 12A(a). Fig. 12A(b) shows the different Kd values for the uranyl ion adsorption by the MNPs and Mn-MNPs. The Kd value is the maximum for Mn-2 in the neutral medium (Fig. S3†) and is almost equal to 3.08 × 10⁶, which is one of the best for uranyl ion sorption.
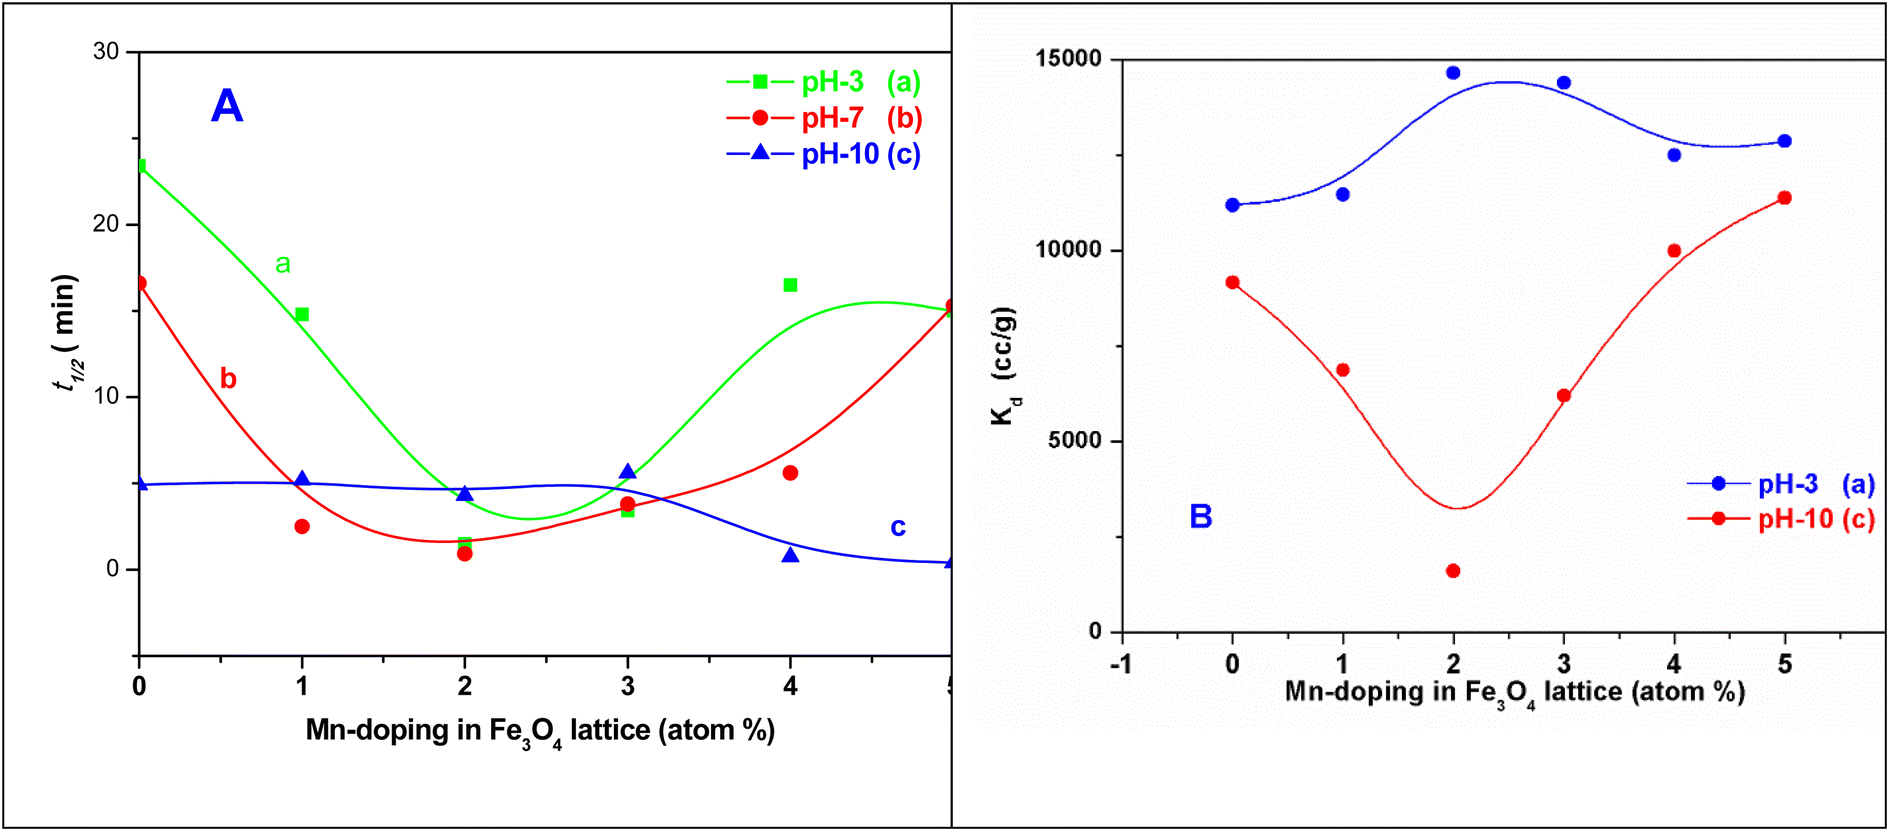 | ||
| Fig. 12 Plots of (A) t1/2 versus the Mn-doping in the Fe3O4 lattice in at% at (a) pH 3, (b) pH 7, and (c) pH 10 and (B) Kd versus the Mn-doping in the Fe3O4 lattice in at% at (a) pH 3 and (c) pH 10 Kd [Kd pH 7 in the ESI†]. Note: SI unit for Kd L kg−1 (1 cm3 = 10−3 L kg−1). | ||
Two structural factors play a decisive role in the adsorption of the uranyl ions over the surfaces of these magnetic materials. Initially, from the XPS results described above, the generic model presented in Scheme 6 shows that in the Mn-doped Fe3O4 system, the uranyl ions are primarily adsorbed over the Mn2+ sites. Also, there are no defect sites over the surface of the Mn-doped Fe3O4 sorbing materials, which could play an ionic role in the sorption of the positively charged uranyl ions over the Mn-MNPs surfaces. The XPS studies showed that there were more effective interactions of the sorption over Mn2+ as compared to the Fe2+ ions. Therefore, in the Mn-doped Fe3O4 system, the uranyl ions mainly interact with the Mn2+ system and are adsorbed over these sites.
The probability of sorption of the uranyl ions over the surface of the Mn-MNPs increases with an increase in at% of Mn2+ in the system. As the sorption of the doubly charged cation occurs over the surface, the surface charge of the sorbent will also play a strong role in the ionic factors for the surface. However, the surface charge as observed from the zeta potential data shows that it varies as a function of pH and thereby, will play different roles in different solvents. At an acidic pH, the surface charge was observed as positive and has been explained earlier in Section 3.4 in Scheme 4. The positive surface charge will mainly repel the positively charged sorbent over the surface. The positive surface charge for the Mn-MNPs samples initially decreases and is the lowest for Mn-2. Therefore, for Mn-2 the repulsion will be the least, making it the best sorbent for the uranyl ions at acidic pH. However, as a function of the Mn-doping, the surface charge (zeta potential) becomes more positive as a function of Mn-doping. This will be a detrimental factor for the sorption of the cations over these surfaces as is observed in Fig. 12. This is explained in Scheme 7.
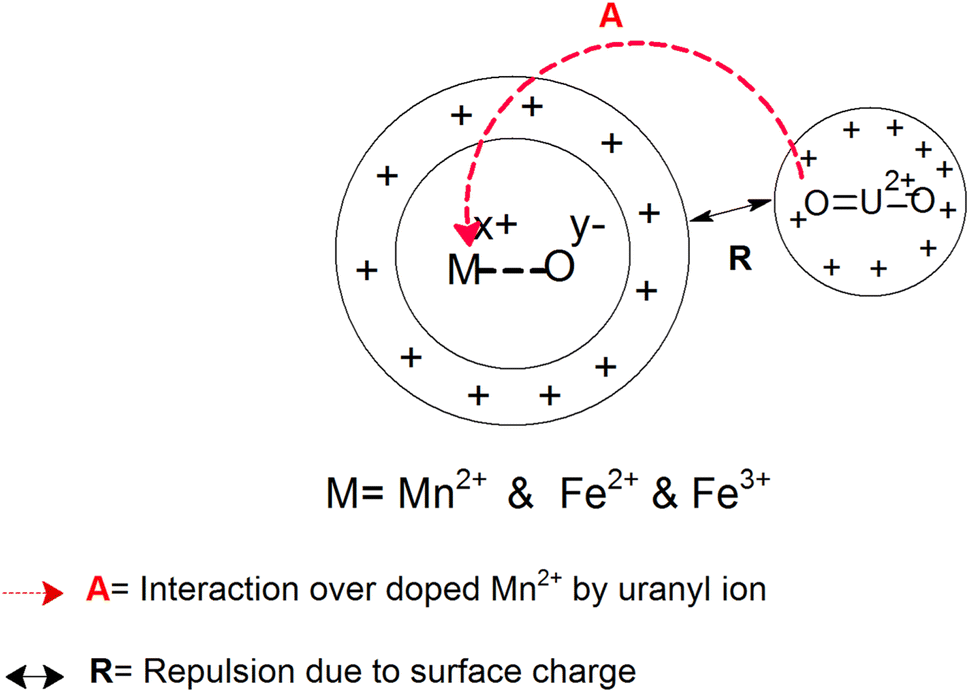 | ||
| Scheme 7 Ionic interactions for the sorption of uranyl ions over Mn-MNPs at low and neutral pH. | ||
 | ||
| Fig. 13 The adsorption of uranyl ions (S%) on different samples of MNPs and Mn-MNPs in basic medium (pH = 10) for (a) nano Fe3O4; (b) Mn-1; (c) Mn-2; (d) Mn-3; (e) Mn-4; (f) Mn-5. | ||
Therefore, the sorption of the uranyl ions can be understood from the model presented in Scheme 8. The interactions of the Mn2+ ions as a function of doping in the Fe3O4 surface with the uranyl ion will also be similar because they are in acidic or neutral media. However, because the surface zeta potential becomes negative and the uranyl ions in the basic medium also possess a negative charge, the repulsion between these becomes stronger. Similarly, the overall radii for the uranyl ion complexes will be larger in a basic medium as compared to that in an acidic or neutral medium. This will also result in further steric/ionic repulsion between the intermolecular uranyl ions, which will cause a further lowering of the adsorption kinetics in the basic medium.
 | ||
| Scheme 8 Ionic interactions for the sorption of uranyl ions over Mn-MNPs at basic pH. | ||
3.8 Sorption studies for competitive ions
Since the study is about the sorption of uranyl ions from urine, studies of the sorption of certain inorganic ions generally present in urine along with uranyl ions were performed under simulative conditions. The ions studied were Na+, K+, Ca2+ and Mg2+. As was observed in an earlier section, Fe3O4 and the pH of the medium play strong roles in altering the sorption properties of these ions and, therefore, they were studied at acidic pH (∼pH 4) and basic pH (∼pH 9). The sorption of the ions is portrayed in Fig. 14 for three different MNPs and Mn-MNPs surfaces, viz. Fe3O4, Mn-2, and Mn-4, respectively.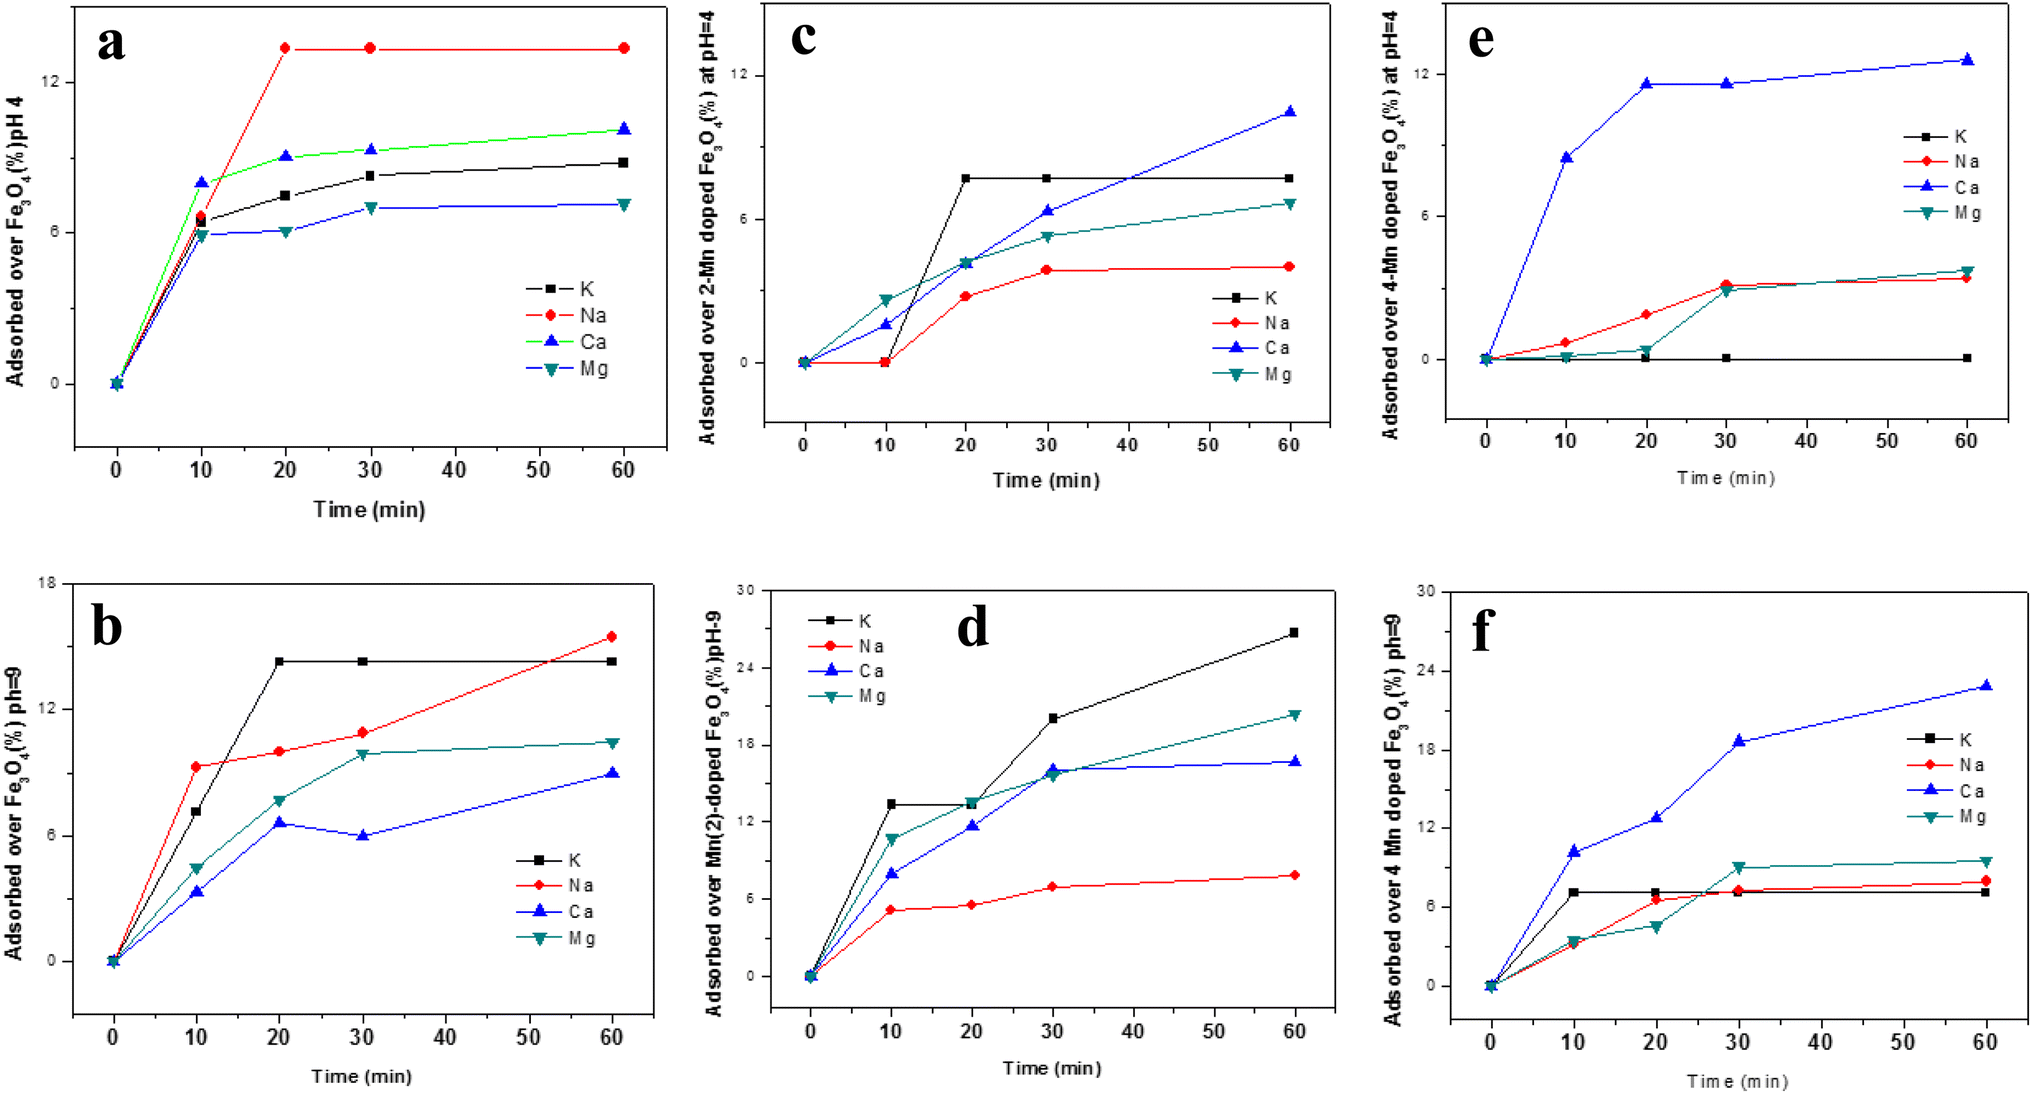 | ||
| Fig. 14 The sorption of different ions (Na+, K+, Ca2+, Mg2+) over MNPs and Mn-MNPS surfaces: (a) nano Fe3O4 at pH 4; (b) nano Fe3O4 at pH 9; (c) Mn-2 at pH 4; (d) Mn-2 at pH 9; (e) Mn-4 at pH 4; (f) Mn 4 at pH-9. | ||
The effects of the sorption of these competing ions in the nano Fe3O4 surface in either medium (pH ∼ 4 & pH ∼ 9) are negligible. At an acidic pH in the Mn-2 system, the sorption of these ions was found to be negligible but at basic pH, K+, Ca+ and Mg2+ ions were adsorbed to the extent of ∼25%. Competing ions like K+, Ca+ and Mg2+ would presumably interact directly with either the Fe2+ in Fe3O4 or Mn2+ in Mn-doped Fe3O4 as observed in Schemes 5 and 6. Therefore, the interaction would be lower as compared to that of the uranyl ions because there, the Mn2+/Fe2+ interacts with the O of the uranyl ion whereas, here, it has direct interaction with either the solvated or the bare ions with positive charges, leading to less interaction, which explains the lower sorption of all these competing ions over these MNPs and Mn-MNPs surfaces. However, the surface charge also plays a significant role in the process of adsorption, which again can be explained by the previous model as proposed in Schemes 7 and 8. The Mn-2 system has a positive zeta potential at acidic pH and a negative zeta potential at basic pH. Therefore, there will be further repulsion for these competing ions at acidic pH, which will make the sorption negligible. However, in basic pH, since the surface is mostly negatively charged, there will be some attraction between these competing ions and the surface, leading to better sorption of the competing ions as shown in Fig. 14d. Similarly, for the Mn-4 system, the sorption is negligible at acidic pH (Fig. 14e) and there is considerable sorption of Ca2+ at basic pH, which can also be explained as above. As shown by Table 1, there was not much alteration of the textural properties of the MNPs and the Mn-MNPs to substantially modify the sorption efficiency.
3.9 Ab initio calculations
 | (3) |
Mn was doped in the tetrahedral and octahedral sites of the Fe3O4 as shown in Fig. 15. Table S5† shows a comparison of the different lattice parameters of the Fe3O4 and Mn-doped Fe3O4 with the experimental results. Although the values for the ab initio calculations are not the same as the experimental values obtained from the Powderx software, the difference is not very great. Also, for the Mn-doped Fe3O4 (octahedral structural isomer) the trends in the lattice parameters and the cell volume are the same as compared to the experimental value. The magnetic moment, though not calculated rigorously, also increases with Mn-doping as observed in Fig. 10 and is consistent with the experimental result. The geometrical isomer with octahedral substitution is the more stable isomer and the Octahedral Site Stabilization Energy per atom (OSSE) = −[2.64340 − 2.56320] eV = 0.08 eV, which reflects the fact that the doped Mn will preferably substitute for the Fe at the octahedral site as compared to that of the tetrahedral site. The relative charge that has been obtained from the XPS studies here shows that the Mn possesses a +2 charge as compared to a +3 charge. Therefore, it can be said that the Mn2+ will mainly substitute for the Fe2+ octahedral sites, which is reflected in the isosurface charge density.
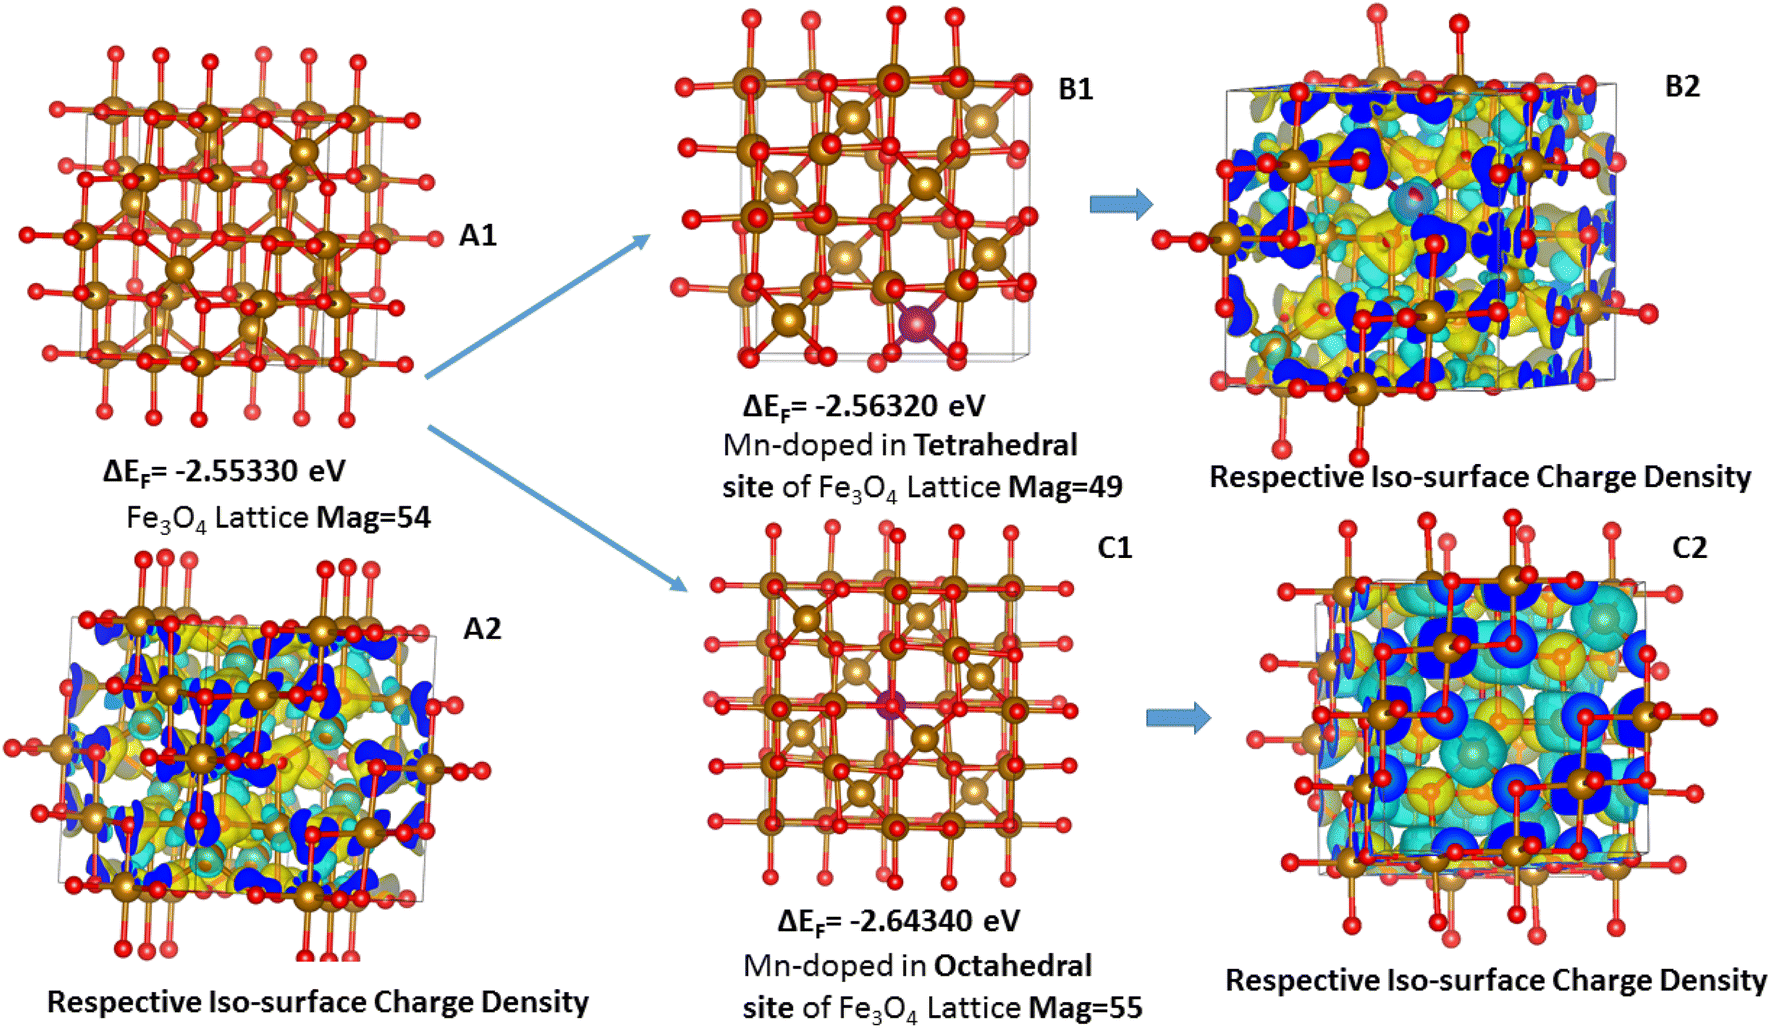 | ||
| Fig. 15 Geometrical isomers for the doping of Mn in the Fe3O4 lattice: (A1) Fe3O4 lattice, (B1) Mn substituting the tetrahedral Fe-site; (C1) Mn-substituting the octahedral Fe-site; (A2), (B2) and (C2) represent the charge density iso-surface plots of the A1, B1 and C1, respectively (eqn 3). | ||
The charge density potential iso-surfaces (Fig. 15) of Fe3O4 show that the two types of Fe in Fe tetrahedral sites and the Fe-octahedral sites have different depleted electron densities over the Fe atoms and electron accumulated densities over the O-atoms. The depleted electron density over the octahedral site (Fig. 15(C2)) is less as compared to that of the tetrahedral site (Fig. 15(B2)), which mostly shows that the Fe2+ is present at octahedral sites and Fe3+ is present at tetrahedral sites. The Mn-doping over the octahedral site shows that the Mn also possesses a similar electron-depleted density to the Fe octahedral site and, therefore, substitutes the Fe2+ sites as explained earlier from the XPS results. Therefore, the octahedral Mn-doped Fe3O4 is the stable isomer (Table 2), which correlates with all the experimental parameters.
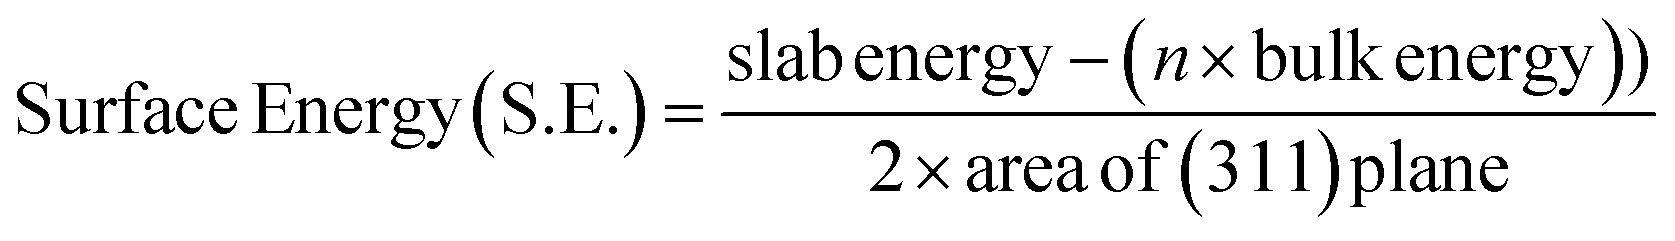
| Lattice system | Unit cell parameter a (Å) | Area of (3 1 1) surface (Å2) | Slab energy (3 1 1) (eV) | Bulk energy (K-333) (eV) | Surface energy (eV Å−2) |
|---|---|---|---|---|---|
| Fe3O4 | 8.43036 | 8.88638 | −814.74718 | −422.86294 | 1.743043 |
| Mn-doped (Oct) Fe3O4 | 8.43887 | 8.89524 | −824.80301 | −426.99253 | 1.640318 |
A (3 1 1) surface was cut both from Fe3O4 bulk and Mn-doped (Oct) Fe3O4 with 112 atoms and O on the final surface and was two monolayers thick. The (3 1 1) plane was taken because it is the major plane present in the XRD plots (Fig. 1b and c) as reported previously.78 The surface created from the (3 1 1) plane was drawn in the form of a 2-layer slab model. Therefore, there were two layers of Fe3O4 (Fig. 16(A1)) and Mn-doped Fe3O4 (Fig. 16(B1)) with a total of 112 atoms.
 | (4) |
 | ||
| Fig. 16 (A1) Fe3O4 – (3 1 1) surface – 112 atoms with O in the top layer of the surface. (B1) Mn-doped Fe3O4 – (3 1 1) surface with 112 atoms with O in the top layer of the surface. Charge density iso-surface plot for the (3 1 1)-surface for (A2) Fe3O4 and (B2) Mn-doped Fe3O4. | ||
The adsorption over the Mn-doped Fe3O4 surface is greater as compared to that of the Fe3O4 surface because the former is more stable, which also corroborates our experimental results and the XPS results. The charge density iso-surface plots for the (3 1 1) surfaces (Fig. 16(A2) and (B2)) for both Fe3O4 and Mn-doped Fe3O4 show that Mn is present as Mn2+ and replaces Fe2+. Also, there is dispersed electron density over Fe and Mn along with that over O-atoms on the surface, which helps them to adsorb different molecules, including [UO2]2+.
| EInt. = Eχ-UO22+ − Eslab − EUO22+ | (5) |
 | ||
| Fig. 17 Electronic interactions between [UO2]2+ and the (3 1 1) Mn-doped Fe3O4 surface, where the surface metal ion is present as (A) the Mn-octahedral site; the (3 1 1) Fe3O4 surface where the surface metal ion is present as (B) the Fe-octahedral site; (C) Fe-tetrahedral site. | ||
The interaction energy (eqn 5) as a measure of interactions between different sites of the Mn-doped Fe3O4 (3 1 1) is reflected in Table 3. The uranyl ion is shown in Fig. S4† and the energy for the optimisation of UO2 and [UO2]2+ ion is shown in Table S6.†
| Mn-doped Fe3O4-(311) surface sites | Mn-octahedral (eV) | Fe-octahedral (eV) | Fe-tetrahedral (eV) |
|---|---|---|---|
| [UO2]2+ interaction energy | −17.048144 | −16.29179 | −16.269136 |
Table 3 shows the interactions of the UO2-ion with different sites of the Mn-doped Fe3O4 (3 1 1) surface. The interaction with Mn (mostly Mn2+) as indicated earlier, and also from the XPS studies in the experimental section, is the least. The results, therefore, corroborate the previous XPS results, which are shown in Scheme 6. However, it is worth mentioning that the surface as calculated with the ab initio technique is the surface with a vacuum above it and not ending in –H or –OH as will happen in the solvated state. However, in the solvated state, if it is considered that the solvation energy will be generically constant for the different sites for a particular surface and a particular ion, then it will be mainly governed by the interactions between the UO2-ions and the particular sites present over the surface as calculated herein. Therefore, both experimentally and theoretically, it is quite clear that the UO2 -ions will be mainly adsorbed over the Mn2+ sites in the Mn-doped Fe3O4 surface, which is governed mainly by two factors. (1) Surface energy: Mn-doped Fe3O4 (3 1 1) < Fe3O4 (3 1 1). (2) Interaction energy with UO2-ion: Mn-interaction < Fe-interaction. As observed earlier, at the neutral pH (Fig. 12) the Kd value (Fig. S3†) initially increases from Fe3O4 to Mn-doped Fe3O4 and with higher concentrations of Mn-doping, it decreases after Mn-2. Both factors favour the Mn-doped Fe3O4 surface as compared to that of the Fe3O4 surface as indicated by experiment and ab initio calculations. However, for more Mn-doping, the interaction energy will play the dominant role in the surface energy. Regarding the interaction energy, the two factors (the slab energy of the Mn-doped Fe3O4 and the energy of the UO2-ions) will be constant, and only the number of uranyl ion components will vary. However, the first term of eqn (4) will vary with different numbers of Mn-doped sites and will be the governing factor in explaining the t1/2 or the Kd. Also, for different pH, the solvation has to be considered to explain this model completely.
The agglomeration/aggregation of charged particles and their interaction in liquid media is usually described by the DLVO (Derjaguin, Landau, Verwey, Overbeek) theory. This theory takes into account both van der Waals attraction and the electrostatic repulsion (double layer force).79 Here, the electrostatic repulsion in the DLVO theory is due to the formation of a double layer. Here, the calculations were performed by taking into account the electrostatic interactions between Mn and different Fe sites over the Mn-doped Fe3O4 surface, considering that the solvation is the same for a particular surface and a particular ion at a given pH.
4. Conclusion
The sorption of uranyl ions over magnetic nanoparticles has garnered significant scientific attention due to its simplicity; however, clarification was needed regarding the exact sites of adsorption and the effective structural role played by the surface.(a) This manuscript shows a simple, scalable route for synthesizing magnetic (Fe3O4) and doped magnetic nanoparticles (Mn-doped Fe3O4) for the sorption of uranyl ions. To the best of our understanding, these synthesized materials possess one of the best Kd (∼3 × 106 cm3) values as compared to those reported in the literature for the different resins that are commercially used specifically for uranyl ions (e.g., MnO2 in polystyrene sulphonic acid resin ∼106.1 or D-634 108 cm3);80 however, the t1/2 is perhaps the best with a value of 0.9 min. The stability of these MNP and Mn-MNPs in the entire pH range is also appreciable as compared to the literature.
(b) Mn2+ is substituted for the Fe2+ sites in the Fe3O4 lattice and as a result, the magnetic moment initially increases and then decreases. The alteration and the effect in sorption for the textural properties are minimal and mainly result from the ionic interactions between the surface ions of the MNPs and the Mn-MNPs.
(c) In Fe3O4, the main interaction for the sorption of the uranyl ions is with the Fe2+ ions present in the Fe3O4 surface. Likewise, in Mn-MNPs, the results from the interactions of the uranyl ions with the substituted Mn2+ ions on the surface of Mn-MNPs are considerably lower as compared to the Fe sites in the Mn-MNPs.
(d) The surface energy and surface charge also play major roles in the alteration of the sorption properties of the nanoparticles. The ionic interactions between Mn2+, Fe2+ and Fe3+ mainly form the basis for ionic repulsion, which interacts with the solvated cation, thus directly affecting the sorption rate of the same. Taking the solvation parameter as a constant, it was proved that the surface energy of Mn-doped Fe3O4 was lower as compared to the Fe3O4 surface. Similarly, the interaction energy of uranyl ions with Mn2+ was lower as compared to Fe2+ and Fe3+ surface centres. The interplay of these two factors along with the surface charge is best optimised in neutral pH and plays different roles in the different pH ranges.
(e) This, in all probability, makes the Mn-2 sample the most optimised sample in the neutral pH regime. The acidic medium, though better as compared to the basic medium, is not as effective as the neutral medium.
The above understanding paves a new way for doping different ions into the Fe3O4 surface to further enhance the sorption efficacy. The present materials can be utilised for the removal of low-level uranyl ions from the different bioassays to develop a new methodology for the quantitative estimation of uranyl ions in urine bioassays.
Author's contribution
Prakash Mandal has performed the synthesis and characterisation for the MNPs and the Mn-MNPs and also has conducted all the sorption experiments and have plotted all the Figures and required Schematics. P. D. Sawant was consulted for the technical advice for sorption of uranyl ions in the bioassays and provided required support for conducting the experiments and giving suggestion during writing the manuscript. K. Bhattacharyya has conceptualised the present idea; completed the ab initio calculations and written the complete manuscript and has guided throughout this project.Conflicts of interest
The authors declare no conflict of interest in the present manuscript.Acknowledgements
The authors would like to acknowledge Dr K. C. Barik ChD, Bhabha Atomic Research Centre (BARC) for his help in zeta potential experiments, Dr P. Jha, TPD, BARC for his help in Raman experiments; Shri. Asheessh Kumar ChD, BARC for his help in SEM and EDS studies, Dr K. Swain ACD, BARC or his help in ICP-OES and EDXRF studies, Dr M. Mukadam SSPD, BARC for taking VSM data; Dr N. Kumar MSD, BARC for taking HRTEM data and Dr Venkat Krishnan, IIT Mandi for his help in taking XPS data. There were no financial grants involved for the work related to this manuscript.References
- P. Thakur and A. L. Ward, An Overview of Analytical Methods for in vitro Bioassay of Actinides, J. Health Phys., 2019, 116, 694–714 CrossRef CAS PubMed.
- M. Ristic, S. Degetto, T. Ast and C. Cantallupi, Sample preparation for the determination of 241Am in sediments utilizing γ-spectroscopy, J. Environ. Radioact., 2002, 59, 179–189 CrossRef CAS PubMed.
- J. P. Shukla, A. Kumar and R. K. Singh, Liquid–Liquid Extraction of Plutonium (IV) by Dicyclohexano-18-crown-6 from Aqueous-Organic Solutions, Radiochim. Acta, 1993, 60, 103–107 CrossRef CAS.
- V. Santhanakrishnan, K. R. Sreedevi, S. Rajaram and P. M. Ravi, Radioanalytical determination of plutonium and americium using ion exchange and extraction chromatography technique in urine, J. Rad. Prot. Environ., 2011, 34, 157–158 CrossRef.
- S. H. Lee, J. L. Rosa, J. Gastaud and P. P. Povinec, The development of sequential separation methods for the analysis of actinides in sediments and biological materials using anion-exchange resins and extraction chromatography, J. Radioanal. Nucl. Chem., 2005, 263, 419–425 CrossRef CAS.
- J. J. L. Rosa, W. Burnett, S. H. Lee, I. Levy, J. Gastaud and P. P. Povinec, Separation of actinides, cesium and strontium from marine samples using extraction chromatography and sorbents, J. Radioanal. Nucl. Chem., 2001, 248, 765–770 CrossRef.
- C. Su, Environmental implications and applications of engineered nanoscale magnetite and its hybrid nanocomposites: A review of recent literature, J. Hazard. Mater., 2017, 322, 48–84 CrossRef CAS PubMed.
- J. V. Carolan, K. A. Jolliffe and T. L. Hanley, Selective Sorption of Actinides by Titania Nanoparticles Covalently Functionalized with Simple Organic Ligands, ACS Appl. Mater. Interfaces, 2013, 5, 11984–11994 CrossRef PubMed.
- S. Ojha, S. Chappa, A. M. Mhatre, K. K. Singh, V. Chavan and A. K. Pandey, Actinides selective extractants coated magnetite nanoparticles for analytical applications, J. Radioanal. Nucl. Chem., 2017, 312, 675–683 CrossRef CAS.
- C. Falaise, C. Volkringer, R. Giovine, B. Prelot, M. Huve and T. Loiseau, Capture of actinides (Th4+, [UO2]2+) and surrogating lanthanide (Nd3+) in porous metal–organic framework MIL-100(Al) from water: selectivity and imaging of embedded nanoparticles, Dalton Trans., 2017, 46, 12010–12014 RSC.
- H. J. Kim, H. Choi, A. K. Sharma, W. G. Hong, K. Shin, H. Song, H. Y. Kim and Y. J. Hong, Recyclable aqueous metal adsorbent: Synthesis and Cu(II) sorption characteristics of ternary nanocomposites of Fe3O4 nano particles@graphene –poly-N-phenylglycine nanofibers, J. Hazard. Mater., 2021, 401, 123283 CrossRef CAS PubMed.
- S. Lv, M. Li, X. Wu, X. Zhang, Y. Hua, L. Bi, Q. Fang and T. Cai, A non-polluting method for rapidly purifying uranium-containing wastewater and efficiently recovering uranium through electrochemical mineralization and oxidative roasting, J. Hazard. Mater., 2021, 416, 125885 CrossRef CAS PubMed.
- R. Das, C. D. Vecitis, A. Schulze, B. Cao, A. F. Ismail, X. Lu, J. Chen and S. Ramakrishna, Recent advances in nanomaterials for water protection and monitoring, Chem. Soc. Rev., 2017, 46, 6946–7020 RSC.
- P. K. Jain, X. Huang, I. H. El-Sayed and M. A. El-Sayed, Noble Metals on the Nanoscale: Optical and Photothermal Properties and Some Applications in Imaging, Sensing, Biology, and Medicine, Acc. Chem. Res., 2008, 41, 1578–1586 CrossRef CAS PubMed.
- Z. Liu, Q. Ling, Y. Cai, L. Xu, J. Su, K. Yu, X. Wu, J. Xu, B. Hu and X. Wang, Synthesis of carbon-based nanomaterials and their application in pollution management, Nanoscale Adv., 2022, 4, 1246–1262 RSC.
- Z. Liu, Z. Xu, L. Xu, F. Buyong, T. C. Chay, Z. Li, Y. Cai, B. Hu, Y. Zhu and X. Wang, Modified biochar: Synthesis and Mechanism for Removal of Environmental Heavy Metals, Carbon Resour., 2022, 1, 8 CrossRef.
- Y. Fei and Y. H. Hu, Design, synthesis, and performance of adsorbents for heavy metal removal from wastewater: a review, J. Mater. Chem. A, 2022, 10, 1047 RSC.
- S. Wadhawan, A. Jain, J. Nayyar and S. K. Mehta, Role of nanomaterials as adsorbents in heavy metal ion removal from waste water: A review, J. Water Process. Eng., 2020, 33(1–17), 101038 CrossRef.
- Y. Zhang, S. Zhang, H. Sun, Z. Wang, F. Gao, J. Zhang, Z. Liu, M. Tang, X. Tan and X. Wang, Visible-light-driven photoextraction of uranyl by O-doped hexagonal-cubic CdS phase heterojunction, J. Environ. Chem. Eng., 2022, 10, 108781 CrossRef CAS.
- P. Singhal, S. K. Jha, S. P. Pandey and S. Neogy, Rapid extraction of uranium from sea water using Fe3O4 and humic acid coated Fe3O4 nanoparticles, J. Hazard. Mater., 2017, 335, 152–161 CrossRef CAS PubMed.
- P. Singhal, S. K. Jha, B. G. Vats and H. N. Ghosh, Electron-Transfer-Mediated Uranium Detection Using Quasi-Type II Core–Shell Quantum Dots: Insight into Mechanistic Pathways, Langmuir, 2017, 33, 8114–8122 CrossRef CAS PubMed.
- K. Aguilar-Arteaga, J. A. Rodriguez and E. Barrado, Magnetic solids in analytical chemistry: A review, Anal. Chim. Acta, 2010, 674, 157–165 CrossRef CAS PubMed.
- P. Majewski and B. Thierry, Functionalized Magnetite Nanoparticles—Synthesis, Properties, and Bioapplications, Crit. Rev. Solid State Mater. Sci., 2007, 32, 203–215 CrossRef CAS.
- M. Hua, S. Zhang, B. Pan, W. Zhang, L. Lv and Q. Zhang, Heavy metal removal from water/wastewater by nanosized metal oxides: A review, J. Hazard. Mater., 2012, 211–212, 317–331 CrossRef CAS PubMed.
- T. K. Indira and P. K. Lakshmi, Magnetic Nanoparticles – A Review, J. Pharm. Sci. Nanotechnol., 2010, 3, 1035–1042 CAS.
- Y. Wang, H. Li, L. Guo, Q. Jiang and F. A Liu, cobalt-doped iron oxide nanozyme as a highly active peroxidase for renal tumor catalytic therapy, RSC Adv., 2019, 9, 18815–18822 RSC.
- F. Li, J. Jin, Z. Shen, H. Ji, M. Yang and Y. Yin, Removal and recovery of phosphate and fluoride from water with reusable mesoporous Fe3O4@mSiO2@mLDH composites as sorbents, J. Hazard. Mater., 2020, 388, 121734 CrossRef CAS PubMed.
- R. Fan, H. Min, X. Hong, Q. Yi, W. Liu, Q. Zhang and Z. Luo, Plant tannin immobilized Fe3O4@SiO2 microspheres: A novel and green magnetic bio-sorbent with superior adsorption capacities for gold and palladium, J. Hazard. Mater., 2019, 364, 780–790 CrossRef CAS PubMed.
- Z. Qi, T. P. Joshi, R. Liu, H. Liu and J. Qu, Synthesis of Ce(III)-doped Fe3O4 magnetic particles for efficient removal of antimony from aqueous solution, J. Hazard. Mater., 2017, 329, 193–204 CrossRef CAS PubMed.
- C. Ding, W. Cheng, Y. Sun and X. Wang, Novel fungus-Fe3O4 bio-nanocomposites as high performance adsorbents for the removal of radionuclides, J. Hazard. Mater., 2015, 295, 127–137 CrossRef CAS PubMed.
- K. Valizadeh, A. Bateni, N. Sojoodi, M. R. Ataabadi, A. H. Behroozi, A. Maleki and Z. You, Magnetized inulin by Fe3O4 as a bio-nano adsorbent for treating water contaminated with methyl orange and crystal violet dyes, Sci. Rep., 2022, 12, 22034 CrossRef CAS PubMed.
- R. D. Rutledge, C. L. Warner, J. W. Pittman, R. S. Addleman, M. Engelhard, W. Chouyyok and M. G. Warner, Thiolene induced diphosphonic acid functionalization of superparamagnetic iron oxide nanoparticles, Langmuir, 2010, 26, 12285–12292 CrossRef CAS PubMed.
- S. Shin and J. Jang, Thiol containing polymer encapsulated magnetic nanoparticles as reusable and efficiently separable adsorbent for heavy metal ions, Chem. Commun., 2007, 41, 4230–4232 RSC.
- W. Yantasee, C. L. Warner, T. Sangvanich, R. S. Addleman, T. G. Carter, R. J. Wiacek, G. E. Fryxell, C. Timchalk and M. G. Warner, Removal of heavy metals from aqueous systems with thiol functionalized superparamagnetic nanoparticles, J. Environ. Sci. Technol., 2007, 41, 5114–5119 CrossRef CAS PubMed.
- X. Liu, Q. Hu, Z. Fang, X. Zhang and B. Zhang, Magnetic Chitosan Nanocomposites: A Useful Recyclable Tool for Heavy Metal Ion Removal, Langmuir, 2009, 25, 3–8 CrossRef CAS PubMed.
- N. Kobylinska, L. Puzyrnaya and G. Pshinko, Magnetic nanocomposites based on Zn, Al-LDH intercalated with citric and EDTA groups for the removal of U(VI) from environmental and wastewater: synergistic effect and adsorption mechanism study, RSC Adv., 2022, 12, 32156–32172 RSC.
- P. Deng, Z. Wang, Z. Pan, S. Zhang and G. Rong, Adsorption behaviours of Congo red onto Fe2O3/Fe3O4 heterogeneous nanoparticles prepared via an alcohol-assisted combustion process, Mater. Res. Express., 2021, 8, 045019 CrossRef CAS.
- S. Shaker, S. Zafarian, C. S. Chakra and K. V. Rao, Preparation and characterization of magnetite nano particles by Sol-Gel method for water treatment, Int. J. Innov. Res., 2013, 2, 2969–2973 Search PubMed.
- X. Dai and K. T. Sheila, An emergency bioassay method for actinides in urine, J. Health Phys., 2011, 101, 144–147 CrossRef CAS PubMed.
- C. Yang, Y. Pang, Y. Han, X. Zhan, H. Wang, J. Liu, R. Gao, H. Liu and H. Shi, Removal of trace concentration Sb (V) in textile wastewater by Mn-doped Fe3O4: The mechanisms of Mn affect adsorption performance, Microporous Mesoporous Mater., 2022, 343, 112150 CrossRef CAS.
- A. Biedrzycka, E. Skwarek, D. Osypiuk and B. Cristóvao, Synthesis of Hydroxyapatite/Iron Oxide Composite and Comparison of Selected Structural, Surface, and Electrochemical Properties, Materials, 2022, 15(1–18), 1139 CrossRef CAS PubMed.
- E. Skwarek, A. Gładysz-Płaska, J. B. Choromańska and E. Broda, Adsorption of uranium ions on nano-hydroxyapatite and modified by Ca and Ag ions, Adsorption, 2019, 25, 639–647 CrossRef CAS.
- E. Broda, A. Gładysz-Płaska, E. Skwarek and V. V. Payentko, Structural properties and adsorption of uranyl ions on the nanocomposite hydroxyapatite/white clay, Appl. Nanosci., 2022, 12, 1101–1111 CrossRef CAS.
- A. Asfaram, M. Ghaedi, S. Hajati, A. Goudarzi and E. A. Dil, Screening and optimization of highly effective ultrasound-assisted simultaneous adsorption of cationic dyes onto Mn-doped Fe3O4-nanoparticle-loaded activated carbon, Ultrason. Sonochem., 2017, 34, 1–12 CrossRef CAS PubMed.
- J. Chen, W. Zhu, X. Chang, D. Ding, T. Zhan, C. Zhou, H. Wu, H. Yang and L. Sun, DFT insights to mercury species mechanism on pure and Mn doped Fe3O4 (111) surfaces, Appl. Surf. Sci., 2020, 514, 145876 CrossRef CAS.
- Z. Fu, B. Yang, Y. Zhang, N. Zhang and Z. Yang, Dopant segregation and CO adsorption on doped Fe3O4 (111) surfaces: A first-principle study, J. Catal., 2018, 364, 291–296 CrossRef CAS.
- A. Asfaram, M. Ghaedi, A. Goudarzi and M. Rajabi, Response surface methodology approach for optimization of simultaneous dye and metal ion ultrasound-assisted adsorption onto Mn doped Fe3O4-NPs loaded on AC: kinetic and isothermal studies, Dalton Trans., 2015, 44, 14707–14723 RSC.
- Z. Chen, Y. Zheng, Y. Liu, W. Zhang, Y. Wang, X. Guo, X. Tang, Y. Zhang, Z. Wang and T. Zhang, Magnetic Mn-Doped Fe3O4 hollow Microsphere/RGO heterogeneous Photo-Fenton Catalyst for high efficiency degradation of organic pollutant at neutral pH, Mater. Chem. Phys., 2019, 238, 121893 CrossRef CAS.
- C. L. Warner, W. Chouyyok, K. E. Mackie, D. Neiner, L. V. Saraf, T. C. Droubay, M. G. Warner and R. S. Addleman, Manganese doping of magnetic iron oxide nanoparticles: tailoring surface reactivity for a regenerable heavy metal sorbent, Langmuir, 2012, 28, 3931–3937 CrossRef CAS PubMed.
- J. Liu, Z. Zhao and G. Jiang, Coating Fe3O4 magnetic nanoparticles with humic acid for high efficient removal of heavy metals in water, J. Environ. Sci. Technol., 2008, 42, 6949–6954 CrossRef CAS PubMed.
- R. Ghosh, L. Pradhan, Y. P. Devi, S. S. Meena, R. Tewari, A. Kumar, S. Sharma, N. S. Gajbhiye, R. K. Vatsa, B. N. Pandey and R. S. Ningthoujam, Induction heating studies of Fe3O4 magnetic nanoparticles capped with oleic acid and polyethylene glycol for hyperthermia, J. Mater. Chem., 2011, 21, 13388 RSC.
- G. Kresse and D. Joubert, From Ultrasoft Pseudopotentials to the Projector Augmented-Wave Method, Phys. Rev. B: Condens. Matter Mater. Phys., 1999, 59, 1758–1775 CrossRef CAS.
- P. E. Blöchl, Projector Augmented-Wave Method, Phys. Rev. B: Condens. Matter Mater. Phys., 1994, 50, 17953–17979 CrossRef PubMed.
- J. P. Perdew, J. A. Chevary, S. H. Vosko, K. A. Jackson, M. R. Pederson, D. J. Singh and C. Fiolhais, Atoms, Molecules, Solids, and Surfaces: Applications of The Generalized Gradient Approximation for Exchange and Correlation, Phys. Rev. B: Condens. Matter Mater. Phys., 1992, 46, 6671–6687 CrossRef CAS PubMed.
- H. J. Monkhorst and J. D. Pack, Special Points for Brillouin-Zone Integrations, Phys. Rev. B: Condens. Matter Mater. Phys., 1976, 13, 5188 CrossRef.
- N. Sarigul, F. Korkmaz and İ. Kurultak, A New Artificial Urine Protocol to Better Imitate Human Urine, Sci. Rep., 2019, 9, 20159 CrossRef CAS PubMed.
- R. Kayestha, Sumati and K. Hajela, ESR studies on the effect of ionic radii on displacement of Mn2+ bound to a soluble β-galactoside binding hepatic lectin, FEBS Lett., 1995, 368, 285–288 CrossRef CAS PubMed.
- O. C. Gagné and F. C. Hawthorne, Bond-Length Distributions for Ions Bonded to Oxygen: Results for the Transition Metals and Quantification of the Factors Underlying Bond-Length Variation in Inorganic Solids, Int. Union Crystallogr., 2020, 7, 581–629 CrossRef PubMed.
- O. N. Shebanova and P. Lazor, Raman spectroscopic study of magnetite (FeFe2O4): a new assignment for the vibrational spectrum, J. Solid State Chem., 2003, 174, 424–430 CrossRef CAS.
- O. N. Shebanova and P. Lazor, Raman study of magnetite (Fe3O4): laser-induced thermal effects and oxidation, J. Raman Spectrosc., 2003, 34, 845–852 CrossRef CAS.
- E. Widjaja and J. T. Sampanthar, The detection of laser-induced structural change of MnO2 using in situ Raman spectroscopy combined with self-modelling curve resolution technique, Anal. Chim. Acta, 2007, 585, 241–245 CrossRef CAS PubMed.
- S. Majumder, M. Sardar, B. Satpati, S. Kumar and S. Banerjee, Magnetization Enhancement of Fe3O4 by Attaching onto Graphene Oxide: An Interfacial Effect, J. Phys. Chem. C, 2018, 122, 21356–21365 CrossRef CAS.
- T. Yamashita and P. Hayes, Analysis of XPS spectra of Fe2+ and Fe3+ ions in oxide materials, Appl. Surf. Sci., 2008, 254, 2441–2449 CrossRef CAS.
- D. Wilson and M. A. Langell, XPS analysis of oleylamine/oleic acid capped Fe3O4 nanoparticles as a function of temperature, Appl. Surf. Sci., 2014, 303, 6–13 CrossRef CAS.
- M. C. Biesinger, B. P. Payne, A. P. Grosvenor, L. W. M. Lau, A. R. Gerson and R. S. C. Smart, Resolving surface chemical states in XPS analysis of first row transition metals, oxides and hydroxides, Appl. Surf. Sci., 2011, 257, 2717–2730 CrossRef CAS.
- R. P. Gupta and S. K. Sen, Calculation of multiplet structure of core p-vacancy Levels. II, Phys. Rev. B: Condens. Matter Mater. Phys., 1975, 12, 15–19 CrossRef CAS.
- S. Poulin, R. França, L. M. Bélanger and E. Sacher, Confirmation of X-ray Photoelectron Spectroscopy Peak Attributions of Nanoparticulate Iron Oxides, Using Symmetric Peak Component Line Shapes, J. Phys. Chem. C, 2010, 114, 10711–10718 CrossRef CAS.
- D. D. Hawn and B. M. DeKoven, Deconvolution as a correction for photoelectron inelastic energy losses in the core level XPS spectra of iron oxides, Surf. Interface Anal., 1987, 10, 63–74 CrossRef CAS.
- M. Muhler, R. Schlögl and G. Ertl, The nature of the iron oxide-based catalyst for dehydrogenation of ethylbenzene to styrene 2. Surface chemistry of the active phase, J. Catal., 1992, 138, 413–444 CrossRef CAS.
- Q. An, Y. Miao, B. Zhao, Z. Li and S. Zhu, An alkali modified biochar for enhancing Mn2+ adsorption: Performance and chemical mechanism, Mater. Chem. Phys., 2020, 248, 122895 CrossRef CAS.
- L. Thakur, R. Kumar and R. Kumar, Structural and optical studies of Mn2+ substituted CdO nano-particles, J. Appl. Phys., 2021, 127, 1–9 Search PubMed.
- H. W. Nesbitt and D. Banerjee, Interpretation of XPS Mn(2p) spectra of Mn oxyhydroxides and constraints on the mechanism of MnO2 precipitation, Am. Mineral., 1998, 83, 305–315 CrossRef CAS.
- K. Hämäläinen, C.-C. Kao, J. B. Hastings, D. P. Siddons, L. E. Berman, V. Stojanoff and S. P. Cramer, Spin-dependent x-ray absorption of MnO and MnF2, Phys. Rev. B: Condens. Matter Mater. Phys., 1992, 46, 14274 CrossRef PubMed.
- S. P. Jeng, R. J. Lad and V. E. Henrich, Satellite structure in the photoemission spectra of MnO(100), Phys. Rev. B: Condens. Matter Mater. Phys., 1991, 43, 11971 CrossRef CAS PubMed.
- J. Dhumala, S. S. Bandgara, M. Phadatareb and G. S. Shahanea, Superparamagnetic Fe-Mn ferrite nanoparticles for magnetic fluid hyperthermia, Int. J. Res. Anal. Rev., 2019, 6, 1058–1067 Search PubMed.
- J. Li, H. Yuan, G. Li, Y. Liu and J. Leng, Cation distribution dependence of magnetic properties of sol–gel prepared MnFe2O4 spinel ferrite nanoparticles, J. Magn. Magn. Mater., 2010, 322, 3396–3400 CrossRef CAS.
- S. J. Markich, Uranium Speciation and Bioavailability in Aquatic Systems: An Overview, Sci. World J., 2002, 2, 707–729 CrossRef CAS PubMed.
- P. J. Lin, C. H. Yeh and J. C. Jiang, Theoretical insight into hydroxyl production via H2O2 decomposition over the Fe3O4 (311) surface, RSC Adv., 2021, 11, 36257–36264 RSC.
- P. Singhal, V. Pulhani, S. M. Ali and R. S. Ningthoujam, Sorption of different metal ions on magnetic nanoparticles and their effect on nanoparticles settlement, Environ. Nanotechnol. Monit. Manag., 2019, 11, 100202 Search PubMed.
- E. Rosenberg, G. Pinson and R. Tsosie, Uranium Remediation by Ion Exchange and Sorption Methods: A Critical Review, Johns. Matthey Technol. Rev., 2016, 60, 59–77 CrossRef.
Footnote |
| † Electronic supplementary information (ESI) available: Fig. S1: ED-XRF data for the different Mn-doped Fe3O4 system; (a) undoped Fe3O4; (b) Mn-1 (c) Mn-2 (d) Mn-3 (e) Mn-4 (f) Mn-5, Table S1: atomic weight percentage of elements as calculated from EDS data, Fig. S2: XPS spectra for Fe 2p for comparison of the process of sorption interaction; (a) Mn-2 before uranyl sorption and (b) Mn-2 after uranyl sorption post drying, Fig. S3: Plot for Kd versus the Mn-doping (at%) in the Fe3O4 lattice at neutral medium (pH-7). Table S2: SAED calculation for Fe3O4 system. Table S3: SAED calculation for Mn dopped Fe3O4 system (Mn-3). Table S4: optimisation of the K-points for the bulk calculation of Fe3O4. Table S5: comparison of cell parameters for Fe3O4 and Mn-doped Fe3O4 system. Fig. S4: optimised structures for (A) UO2 and (B) UO2-ion. Table S6: energy and bond length for calculated UO2 and [UO2]2+ ion system. (B) Calculation of interaction energy of [UO2]2+ ion with the Mn-doped Fe3O4 (3 1 1) surface. Fig. S5: speciation of uranyl ion at different pH (concentration of UO22+ = 1 nM and NO3− = 3 M) as suggested in the Experimental section. The Figure is made by the Medusa Hydra-software plot. See DOI: https://doi.org/10.1039/d3ra01957h |
| This journal is © The Royal Society of Chemistry 2023 |