 Open Access Article
Creative Commons Attribution 3.0 Unported Licence
Adsorption of the non-steroidal anti-inflammatory drug (ibuprofen) onto biochar and magnetic biochar prepared from chrysanthemum waste of the beverage industry
Yuvarat Ngernyen *a,
Decha Petsrib,
Kamonchanok Sribanthaob,
Krittiya Kongpennitb,
Palita Pinijnamb,
Rinrada Pedsakulb and
Andrew J. Hunt
 c
c
aBiomass & Bioenergy Research Laboratory, Department of Chemical Engineering, Faculty of Engineering, Khon Kaen University, Khon Kaen, 40002, Thailand. E-mail: nyuvarat@kku.ac.th
bLahan Sai Ratchadaphisek School, Lahansai District, Buriram 31170, Thailand
cMaterials Chemistry Research Center, Department of Chemistry, Center of Excellence for Innovation in Chemistry, Faculty of Science, Khon Kaen University, Khon Kaen, 40002, Thailand
First published on 15th May 2023
Abstract
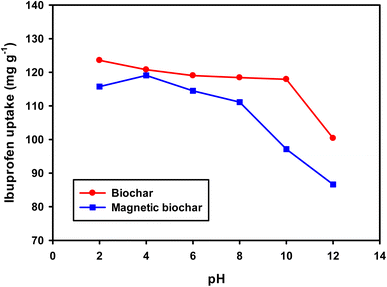
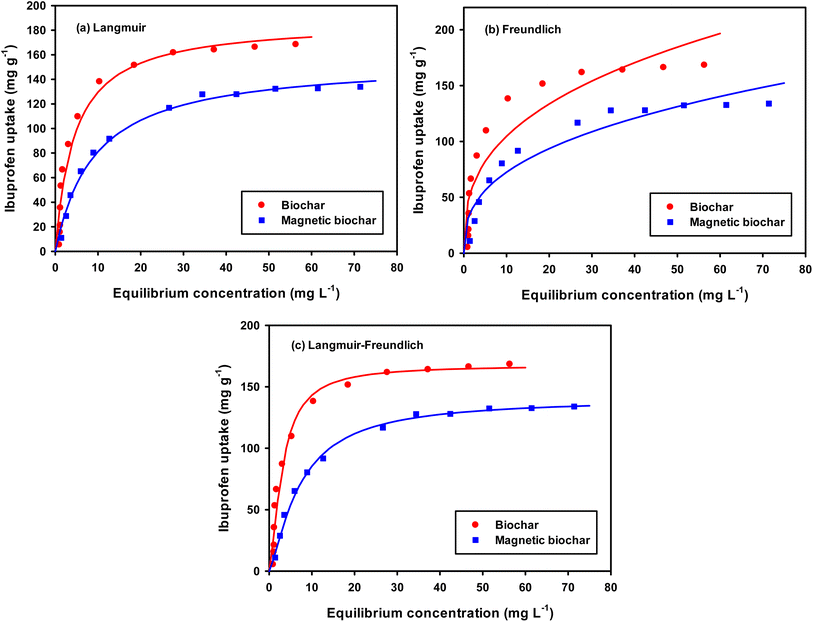
Biochar and magnetic biochar prepared from chrysanthemum waste of the beverage industry are effective adsorbents for the removal of the non-steroidal anti-inflammatory drug, ibuprofen (IBP), from aqueous systems. The development of magnetic biochar using iron chloride, overcame poor separation characteristics from the liquid phase of the powdered biochar after adsorption. Characterisation of biochars was achieved through Fourier transform infrared spectroscopy (FTIR), thermogravimetric analysis (TGA), N2 adsorption/desorption porosimetry, scanning electron microscopy (SEM), electron dispersive X-ray analysis (EDX), X-ray photoelectron spectroscopy (XPS), vibrating sample magnetometer (VSM), moisture and ash content, bulk density, pH and zero-point charge (pHpzc). The specific surface area of non-magnetic and magnetic biochars was 220 and 194 m2 g−1, respectively. Adsorption of ibuprofen was optimised with respect to contact time (5–180 min), solution pH (2–12) and initial drug concentration (5–100 mg L−1), with equilibrium being reached in 1 hour, and the maximum ibuprofen removal occurred at pH 2 and 4 for biochar and magnetic biochars, respectively. Investigation of the adsorption kinetics was achieved through application of the pseudo-first order, pseudo-second order, Elovich and intra-particle diffusion models. Adsorption equilibrium was evaluated using Langmuir, Freundlich and Langmuir–Freundlich isotherm models. The adsorption kinetics and isotherms for both biochars are well described by pseudo-second order kinetic and Langmuir–Freundlich isotherm models, respectively, with the maximum adsorption capacity of biochar and magnetic biochar being 167 and 140 mg g−1, respectively. Chrysanthemum derived non-magnetic and magnetic biochars exhibited significant potential as sustainable adsorbents toward the removal of emerging pharmaceutical pollutants such as ibuprofen from aqueous solution.
1 Introduction
Biochar is a carbonaceous material produced by pyrolysis of biomass in an inert atmosphere or under hydrothermal carbonisation conditions.1,2 The type of biomass, production method and conditions all affect the final properties of biochar.2 Biochar has received significant attention in applications such as adsorbents and also in soil amendment, both of which aid in mitigating global warming.3 Typically, biochar has been observed to have a lower adsorption capacity compared to activated carbon. For example, the maximum removal of phenol from aqueous solution with biochar and activated carbon was 55% and 95%, respectively.4 Manfrin et al. developed biochar and activated carbon from cigarette waste and applied them to the adsorption of Pb2+. The maximum adsorption capacity was 71.42 mg g−1 for activated carbon, while biochar was observed to be significantly lower, only enabling a recovery of 23.69 mg g−1.5 Mahmuda et al. also found that activated carbon from pineapple waste had higher adsorption capacity of methylene blue than biochar.6 Although activated carbons have proven to be more efficient as adsorbents than biochars, due to their having higher surface area and porosity, the production of activated carbon is complicated, requires additional synthetic processes, and activating agents, thus adding appreciable costs in comparison to biochar production. It has been demonstrated that the application of activating agent adds the greatest cost to the resulting activated carbons.7 Therefore, the development of low-cost biochar adsorbents from industrial by-products is still warranted and importantly aids in valorising waste streams.Non-steroidal anti-inflammatory drugs (NSAIDs) such as ibuprofen (IBP), are an effective over the counter pain reliever and is the world's third most consumable drug.8 The release of IBP from industry or through human excretion can pose a serious problem to aquatic life and water treatment.9 Therefore, the wastewater needs to be treated for the protection of human health and environmental safety. Numerous studies have investigated IBP removal by using activated carbons from a variety of biomass sources such as biological sludge from beverage wastewater treatment,10 Dillenia indica peels,11 Lemna minor,12 coconut shell,13 and cork waste.14 In addition, multiwall carbon nanotube,15 mesoporous carbon CMK-3,16 carbide derived carbon (CDC),17 zeolite-rich composite,18 sediment,19 polymeric resin,20 or polyacrylonitrile grafted palm seed powder,21 were also used as adsorbent for remove IBP from solution. However, biochars and modified biochars can be used as adsorbents for this application. For example, Salem and Yakoot used rice straw-based biochar to study adsorption kinetics and mechanism of IBP removal.22 Du et al. investigated IBP removal by Alternanthera philoxeroides-based biochar and found that biochar with surface area of 858 m2 g−1 had maximum adsorption capacity of 172 mg g−1.23 Recently, Patel et al. developed walnut shell activated biochar using H3PO4 immersion and the resulting biochar with surface area of 686 m2 g−1 showed maximum adsorption capacity of 69.7 mg g−1.24 Moreover, biochars such as two wood-waste biochars,25 coffee bean husk biochar,25 biochar derived from mung bean husk,26 date seeds,27 and biochar from sugarcane bagasse,28 have been modified/synthesised with either steam or H3PO4 to yield activated biochar that also demonstrate some significant promise. This demonstrates that a variety of biomass feedstocks can be used for the production of carbonaceous materials including biochar for the removal of emerging organic pollutants from aqueous waste streams. However, bio-based industrial wastes are low value and can contribute to waste disposal problems. Chrysanthemum is the world's second most economically important floricultural crop, following rose.29 It is a popular ingredient in many types of beverages and offers several health benefits, but significant waste residues are produced during the extraction and beverage production process. After boiled with water, all parts of chrysanthemum remain as solid low value waste stream. Utilisation of such wastes to produce low-cost biochar with high adsorption capacities would be advantageous, it would also aid in promoting industrial symbiosis and developing a circular bio-based economy. However, powdered biochar adsorbents are challenging to remove from the solution may hinder the large-scale application of these materials in water treatment, as such any development of new biochar adsorbents should aim to overcome such disadvantages.
An effective strategy to solve this problem is to introduce ferromagnetic elements into the biochar matrix, thereby creating a magnetic biochar with easily for separation. The most common method utilised to prepare magnetic biochars is the “impregnation–pyrolysis” process, where biomass is impregnating with iron ions and is then subjected to pyrolysis, thus yielding a magnetic biochar. Other synthetic methods for magnetic biochar production include co-precipitation, reductive co-deposition, hydrothermal carbonisation, ball-milling (solvent-free mechanical mixing of biochar and iron oxides), direct pyrolysis of biomass/metal salts (also called the molten salt method), cross-linking of biochar and iron oxides and microwave-assisted pyrolysis.30 The impregnation–pyrolysis method has become a popular process due to its simplicity, easy of control, and stable combination of magnetic particles and biochar.31 Magnetic biochars have been used to remove heavy metals (Cr(VI),32 As(V),33 Cd(II),34 Pb(II)34), dyes (methylene blue,35 methyl orange36), nutrient (phosphorus37), organic compounds (phenol,38 pentachlorophenol39) and other contaminants (nitrate,40 fluoride40), whereas there is a limit research has focussed on their use as adsorbents for IBP removal.41
Herein, this work demonstrates the first reported synthesis of biochar and magnetic biochar by impregnation–pyrolysis method from chrysanthemum waste and its application in IBP removal. The biochars are characterised by Fourier transform infrared spectroscopy (FTIR), thermogravimetric analysis (TGA), Brunauer–Emmett–Teller (BET) surface area and porosity, scanning electron microscopy (SEM), electron dispersive X-ray analysis (EDX), X-ray photoelectron spectroscopy (XPS), X-ray diffraction (XRD) and their physico-chemical properties including moisture content, ash content, bulk density, pH and pH at the point of zero charge (pHpzc) are also investigated. The effects of contact time, pH and initial concentration on IBP removal were studied, as too were the application of adsorption isotherm and kinetic models.
2 Materials and methods
2.1 Biochar production
The chrysanthemum wastes (Fig. 1(a)) were obtained from ICHITAN Group Public Company Limited. The material was milled by food processor and sieved with standard sieve of mesh no. 100 (150 μm) and no. 60 (250 μm) to obtained chrysanthemum powder (Fig. 1(b)). 20 g of chrysanthemum powder was pyrolyzed at 800 °C for 90 min under a 200 mL min−1 flow of nitrogen. The resulting chrysanthemum biochar was obtained and named CB (Fig. 1(c)).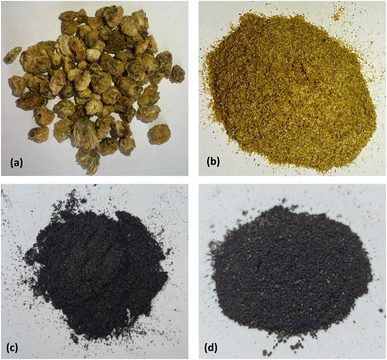 | ||
| Fig. 1 Chrysanthemum wastes and chrysanthemum-based biochars (a) original form, (b) after milled and sieved, (c) non-magnetic and (d) magnetic. | ||
The magnetic biochar was synthesized as follow: 20 g of chrysanthemum powder was stirred in ferric chloride solution (10 g FeCl3·6H2O and 150 mL distilled water) for 12 hours. Subsequently, the mixture was dried at 105 °C for 24 hours in an oven. The dried sample was pyrolyzed under the identical conditions to the biochar, the resultant chrysanthemum magnetic biochar was named CMB (Fig. 1(d)). The yield of CB and CMB were calculated based on the final mass of biochar divided by the original mass of raw material.
2.2 Biochar characterisation
Fourier transform infrared (FTIR) analysis of raw material and the resulting biochars was achieved using an ALPHA II (Bruker) with spectral range from 500 to 4000 cm−1. The spectra of chrysanthemum were analysed using ATR mode, while biochars particles were mixed with KBr to form a KBR disc. FTIR spectra with a resolution of 4 cm−1 was collected over an average of 32 scans.Thermogravimetric analysis (TGA) of samples were performed using Shimadzu DTG-60H with a heating rate of 10 °C min−1 under nitrogen atmosphere at a constant flow rate of 50 mL min−1 and heating from room temperature to 950 °C.
The pore characteristics were analysed using a gas adsorption apparatus (ASAP 2460, Micromeritics). The Brunauer–Emmett–Teller (BET) equation was used to calculate surface area. The total pore volume was estimated from a single point of N2 adsorbed at a relative pressure (P/Po) of about 0.99. The micropore volume was deduced using Dubinin–Radushkevich (DR) methods. The average pore diameter and pore size distribution were determined with the Barrett–Joyner–Halenda (BJH) method applied to the desorption branch of adsorption–desorption isotherm.
The surface morphology of biochars was analysed using scanning electron microscopy (SEM) and electron dispersive X-ray analysis (EDX) (FEI, Helios NanoLab G3 CX). The surface composition, element content and chemical state of the elements in the samples were analysed by X-ray photoelectron spectroscopy (XPS) (PHI 5000 Versa Probe II, Ulvac-PHI Inc). A D8 ADVANCE X-ray diffractometer (Bruker) was also used. For magnetic properties measurement, the samples were investigated using a vibrating sample magnetometer (VSM) (VersaLab) at room temperature.
Moisture content of biochar is determined according to ASTM D2867-70 (Standard Test Methods for Moisture in Activated Carbon) by weighing before and after heating at 150 °C for 3 h in an oven. For determination of ash content, the ASTM D2866-11 (Standard Test Method for Total Ash Content of Activated Carbon) was applied. Typically, 1 g of biochar was placed in a crucible and heated at 650 °C for 1 h in a muffle furnace. Percent ash was calculated by weight of remaining solid divided by weight of original sample, then, multiple by 100. Bulk density was determined follow the procedure described by Yakout et al.42 The biochar was added to a 10 mL graduated cylinder and tapped constantly until no change in volume was observed. The bulk density was calculated from weight of sample divided by the volume of packed sample. The pH of each biochar sample was measured by refluxing the sample in 100 mL of deionized water. Biochar 1 g was added to refluxing water for 5 h, after which additional 100 mL of deionized water was added and left to cool to room temperature. The pH of the mixed biochar and water slurry was then recorded by pH meter (ST3100-F, OHAUS). The pHpzc was measured by pH drift method. The determination of pHpzc was conducted by adjusting pH of 50 mL 0.01 mol L−1 NaCl solution to a value between 2 and 12. The biochar 0.15 g was added and the final pH was measured after 48 h under agitation. The pHpzc of biochar is the point when initial pH equal to final pH.
2.3 Drug adsorption
The IBP solution was prepared from distilled water containing 10% vol methanol (99.9%, RCI Labscan) to increase the solubility of IBP. The kinetics were studied at room temperature by adding 0.01 g of biochar in an Erlenmeyer flask containing 50 mL of 30 mg L−1 IBP solution for different durations, between 5–180 min. The IBP concentrations were subsequently determined by UV-visible spectrometry (Analytik Jena AG) at 222 nm. The IBP uptake or qt (mg g−1) was calculated from equation:where Co is the initial IBP concentration (mg L−1), Ct is the IBP concentration at time t (mg L−1), V is the IBP solution volume (L) and m is the weight of biochar (g).
The pH variation studies were performed at room temperature and constant equilibrium time obtained from kinetics experiment. The IBP solution (30 mg L−1) was prepared in different pH ranges between 2–12, using 0.1 M HCl and NaOH. The isotherms of IBP adsorption on both biochars were studied at room temperature and optimum pH from previous experiment. The amount of biochar of 0.01 g, was introduced in 50 mL IBP solutions of varying concentrations between 5–100 mg L−1 using equilibrium time from kinetics experiment.
3 Results and discussion
3.1 Characterisation of chrysanthemum and biochars
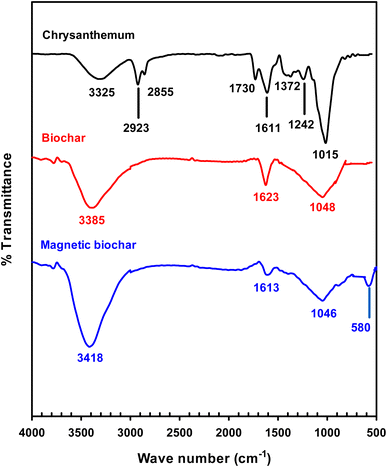
FTIR spectrum of raw material, original biochar and magnetic biochar are shown in Fig. 2. The spectrum shows broad band at 3000–3500 cm−1 in all samples due to the presence of O–H groups.43 For chrysanthemum, bands at 2923 and 2855 cm−1 characteristic of aliphatic C–H stretching, which supported by the presence of band at 1372 cm−1, assigned to aliphatic C–H folding.44 The absorption bands at 1730 and 1242 cm−1 corresponding to the stretching of carbonyl C![[double bond, length as m-dash]](https://www.rsc.org/images/entities/char_e001.gif) O and the stretching deformation of C–O and phenolic O–H groups, respectively.44 These bands are observed to decrease in intensity or even disappear following pyrolysis and formation of the biochar and magnetic biochar. This is due to extensive dehydration and decarboxylation reactions that take place during the degradation of the original materials by the pyrolysis process. The bands at 1611, 1623 and 1613 cm−1 for all samples reflected the presence of C
O and the stretching deformation of C–O and phenolic O–H groups, respectively.44 These bands are observed to decrease in intensity or even disappear following pyrolysis and formation of the biochar and magnetic biochar. This is due to extensive dehydration and decarboxylation reactions that take place during the degradation of the original materials by the pyrolysis process. The bands at 1611, 1623 and 1613 cm−1 for all samples reflected the presence of C![[double bond, length as m-dash]](https://www.rsc.org/images/entities/char_e001.gif) O functional group on surfaces.44 The peaks at 1015 cm−1 of chrysanthemum shifted to 1048 and 1046 cm−1 for biochar and magnetic biochar represents C–OH bond stretching.45 The peak at 580 cm−1 is assigned to Fe–O of iron oxides.46 Therefore, confirming the production of iron oxides onto the magnetic biochar.
O functional group on surfaces.44 The peaks at 1015 cm−1 of chrysanthemum shifted to 1048 and 1046 cm−1 for biochar and magnetic biochar represents C–OH bond stretching.45 The peak at 580 cm−1 is assigned to Fe–O of iron oxides.46 Therefore, confirming the production of iron oxides onto the magnetic biochar.
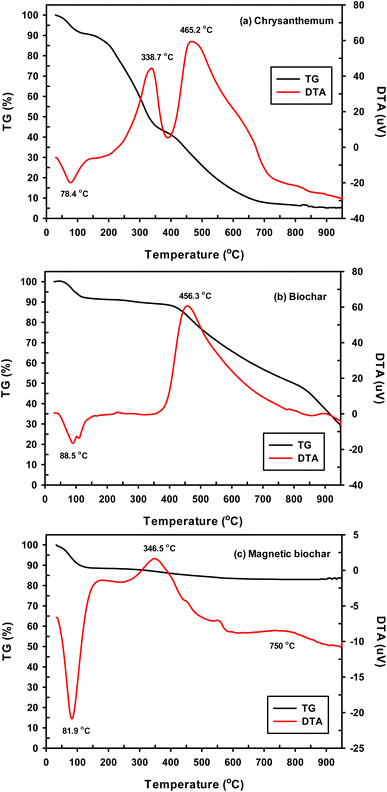
Fig. 3 shows the thermogravimetry (TG) and differential thermal analysis (DTA) curves for the chrysanthemum and two biochars. Three significant peaks can be observed in the DTA curve of chrysanthemum (Fig. 3(a)): a first endothermic peak at 78.4 °C corresponding to the removal of water and light volatile components at temperature lower than 120 °C,47 a second exothermic peak at 338.7 °C referred to degradation of hemicellulose,47 and a third exothermic peak at 465.2 °C ascribed to lignin and cellulose decomposition.47 The second peak was not observed for the biochar (Fig. 3(b)), indicated that the hemicellulose had been degraded during pyrolysis process. For magnetic biochar (Fig. 3(c)), the mass losses at around 750 °C could be explained by the reduction of magnetite Fe3+ to Fe2+ by the biochar following the reactions (1) and (2).47 This agrees with the observation of Fe–O bond from FTIR technique.
| CnHnO → C + volatiles (COx, H2O, organics) | (1) |
| Fe3O4 + nC → 3FeO + nCOx | (2) |
According to TG results, mass loss in the region up to 100 °C was due to the removal of adsorbed free water, corresponding to about 10% of the total mass in all samples. The mass loss from the TGA of chrysanthemum plateaued at 700 °C, therefore it was anticipated that pyrolysis at 800 °C would result in complete biochar formation. TGA results also demonstrated that the magnetic biochar exhibited better thermal stability than the original biochar. This is due to the activation effect during pyrolysis observed by adding the FeCl3 to the biomass.
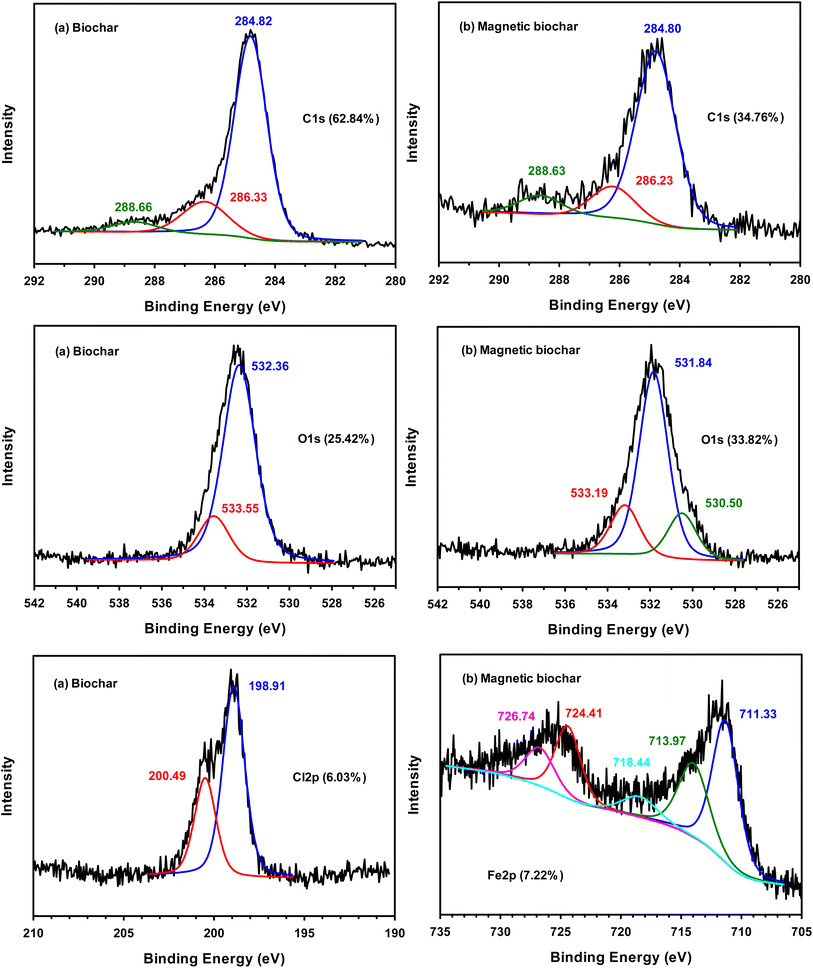
The XPS spectra of biochar determined the surface elemental composition to be comprised of C 1s (62.84), O 1s (25.42%), Cl 2p (6.03%), S 2p (3.69%) and Ca 2p (2.02%). S and Ca present in biochar likely comes from the raw biomass material. This is supported by EDX analysis of raw material which revealed that chrysanthemum contained mainly C (70.30%) and O (26.42%) and small amount of S (0.09%) and Ca (0.28%). For magnetic biochar, spectra included C 1s (34.76), O 1s (33.82%), Cl 2p (12.75%), Fe 2p (7.22%), K 2p (4.51%), P 2p (3.09%), Si 2p (2.13%) and Ca 2p (1.72%). These results clearly indicated that after treatment with FeCl3, Fe appear in magnetic biochar char, while Cl increased from 6.03% of biochar to 12.75% of magnetic biochar. Fig. 4 shows the individual XPS spectra of C, O, Cl and Fe obtained from both biochars. The main peak at 284.8 eV in the carbon spectra of both biochars is assigned to sp3 carbon of C–C, while more limited sp2 carbon of C![[double bond, length as m-dash]](https://www.rsc.org/images/entities/char_e001.gif) C is observed at 284.5 eV. Signals in the XPS at 286.3 and 288.6 eV are related to C
C is observed at 284.5 eV. Signals in the XPS at 286.3 and 288.6 eV are related to C![[double bond, length as m-dash]](https://www.rsc.org/images/entities/char_e001.gif) O and O–C
O and O–C![[double bond, length as m-dash]](https://www.rsc.org/images/entities/char_e001.gif) O, respectively.44 The O 1s spectra of biochar can be deconvoluted to two components: –C
O, respectively.44 The O 1s spectra of biochar can be deconvoluted to two components: –C![[double bond, length as m-dash]](https://www.rsc.org/images/entities/char_e001.gif) O group at 532.3 eV and C–OH or C–O–C groups at 533.5 eV.48 In O 1s spectrum of magnetic biochar, at 531.8 eV represented the Fe–O–C bond, which suggested a strong interaction between Fe3O4 and biochar.49 The peak at 530.5 eV is lattice oxygen in metal oxides (O2−).50 The peak at 533.2 eV was interpreted as C–O.49 The XPS spectrum of Cl 2p of biochar can be deconvoluted into two peaks at binding energies of 198.9 and 200.4 eV. The signal at 200.4 eV was attributed to Cl–C bonds,51 while the 198.9 eV peak is assigned to alkali chloride.52 For the Fe 2p of magnetic biochar, the peak at 711.3 eV represents Fe3+ in Fe3O4.49 Cao et al. reported that a peak at 718.4 eV was ascribed to a Fe 2p3/2 satellite peak and peak at 724.4 eV attributed to Fe 2p1/2 of γ-Fe2O3.53 Finally, the peaks with a binding energy of 713.9 and 726.7 eV corresponded to Fe4+.54
O group at 532.3 eV and C–OH or C–O–C groups at 533.5 eV.48 In O 1s spectrum of magnetic biochar, at 531.8 eV represented the Fe–O–C bond, which suggested a strong interaction between Fe3O4 and biochar.49 The peak at 530.5 eV is lattice oxygen in metal oxides (O2−).50 The peak at 533.2 eV was interpreted as C–O.49 The XPS spectrum of Cl 2p of biochar can be deconvoluted into two peaks at binding energies of 198.9 and 200.4 eV. The signal at 200.4 eV was attributed to Cl–C bonds,51 while the 198.9 eV peak is assigned to alkali chloride.52 For the Fe 2p of magnetic biochar, the peak at 711.3 eV represents Fe3+ in Fe3O4.49 Cao et al. reported that a peak at 718.4 eV was ascribed to a Fe 2p3/2 satellite peak and peak at 724.4 eV attributed to Fe 2p1/2 of γ-Fe2O3.53 Finally, the peaks with a binding energy of 713.9 and 726.7 eV corresponded to Fe4+.54
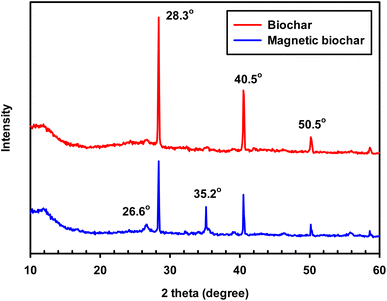
XRD analysis was used to evaluate the degree to which the samples were crystalline or amorphous. When a substance is crystalline, well-defined peaks can be observed, whereas non-crystalline or amorphous materials exhibit broad peaks.55 XRD patterns of the chrysanthemum biochar and the magnetic biochar (Fig. 5) both indicate the presence of crystalline inorganic minerals such as SiO2 (quartz, 2θ = 26.6°), KCl (sylvite, 2θ = 28.3° and 40.5°) and CaCO3 (calcite, 2θ = 50.5°).55 The presence of these inorganic minerals in the magnetic biochar could also aid to promote the IBP adsorption. Hillerström et al.56 and Wang et al.57 demonstrated that it was possible to utilise mesoporous SiO2, and CaCO3 microparticle to adsorbed IBP, respectively. The XRD peak of magnetic biochar at 35.2° indicate the presence of magnetic FeO·Fe2O3 crystallite.58 For the biochar, a broad signal is observed between a 2θ of 20–30° corresponding to amorphous carbon. However, a more pronounced signal at a 2θ of 26.6° can be observed in the magnetic biochar corresponding to the development of a graphitic structure and C![[double bond, length as m-dash]](https://www.rsc.org/images/entities/char_e001.gif) C in the biochar. This demonstrates that the addition of ferric chloride (FeCl3) during the pyrolysis process leads to the formation of a magnetic biochar.
C in the biochar. This demonstrates that the addition of ferric chloride (FeCl3) during the pyrolysis process leads to the formation of a magnetic biochar.
Surface area and pore size distribution of the material plays a significant role in adsorption. BET surface area analysis is based on the monolayer adsorption of nitrogen gas on the surface of the adsorbent, while the pore size is calculated based on pore filling pressures.59 Fig. 6 shows the nitrogen adsorption–desorption isotherms and the pore size distribution curves of the biochar and magnetic biochar.
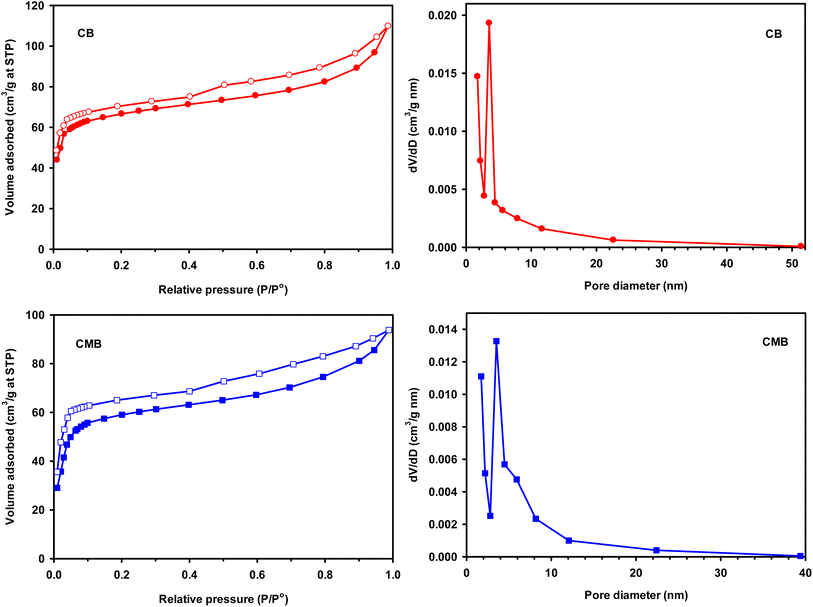 | ||
| Fig. 6 N2 adsorption–desorption isotherms and BJH pore size distribution curves of biochar (CB) and magnetic biochar (CMB). | ||
Both cases illustrate Type IV adsorption isotherms, showing a hysteresis loop, clearly demonstrating the presence of mesoporosity. The hysteresis loops of biochars were Type H4, which showed the existence of micro–mesoporous composite structure. The desorption branch step down as compared to adsorption branch due to cavitation induced evaporation (the liquid trapped in the pores desorbs through the spontaneous nucleation of a gas bubble). The lower limit of hysteresis loop depends on shape of the micropores or mesopores. Such adsorption–desorption curve indicates that micropores are initially filled, then multilayer type of physisorption and capillary condensation takes place.59,60 Using the BJH method and the desorption branch of the nitrogen isotherm, the pore size distribution was calculated, which was predominately less than 10 nm in size, with an average pore diameter for CB and CMB of 3.09 and 2.99, respectively (Fig. 6 and Table 1). This also supports the presence of mesoporosity.
| Adsorbent | SBET (m2 g−1) | Vmicro (cm3 g−1) | Vmeso (cm3 g−1) | Vtotal (cm3 g−1) | Davg (nm) |
|---|---|---|---|---|---|
| CB | 220 | 0.116 (68%) | 0.054 (32%) | 0.170 | 3.09 |
| CMB | 194 | 0.114 (79%) | 0.031 (21%) | 0.145 | 2.99 |
BET surface area of CB (220 m2 g−1) was higher compared to CMB (194 m2 g−1). This indicated that the introduction FeCl3 on the biochar surface did not enable the formation of greater porosity and additional surface area for adsorption, but in fact the Fe particles may have blocked the pores of the biochar. This was supported by the low pore volumes observed for CMB as compared to that of CB, which changed from 0.170 to 0.145 cm3 g−1. Xu et al. suggested that the Fe particles on the surface of biochar were overlapped and piled up with each other, resulting in the reduction of the pore volume and decreasing the specific surface area.43 The decrease in pore diameter also supported the theory that Fe particles were present within the porous structure.
In addition, chrysanthemum biochar prepared from this work had higher or comparable surface area that other biochars reported in literature, for example medium density fibreboard powder residue (2.3 m2 g−1),37 banana (4.7 m2 g−1),61 cassava (13.2 m2 g−1),61 swine manure (3.4–63 m2 g−1),62 rice straw (63–76 m2 g−1),22 industrial kraft lignin (111 m2 g−1),63 and spent mushroom (16–290 m2 g−1).64 However, differences in textual properties of resulting biochars may also be due to the preparation conditions, such as pyrolysis temperature, pyrolysis time or the additional steps of using activation gas like steam. Moreover, the European Biochar Certificate standard (EBC) states that the biochar should have the surface area larger than 150 m2 g−1.65 Therefore, chrysanthemum waste from the beverage industrial is a suitable feedstock for biochar production.
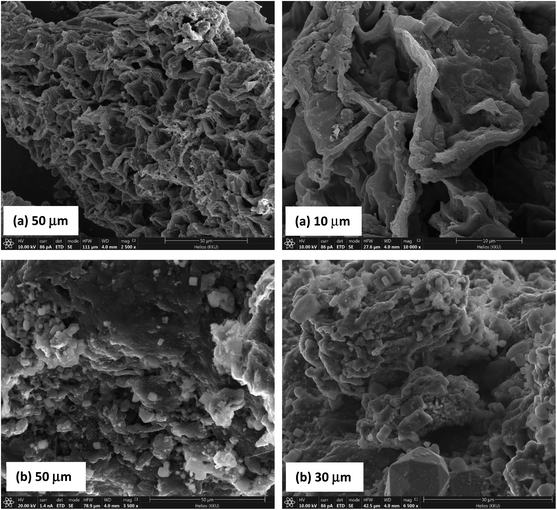
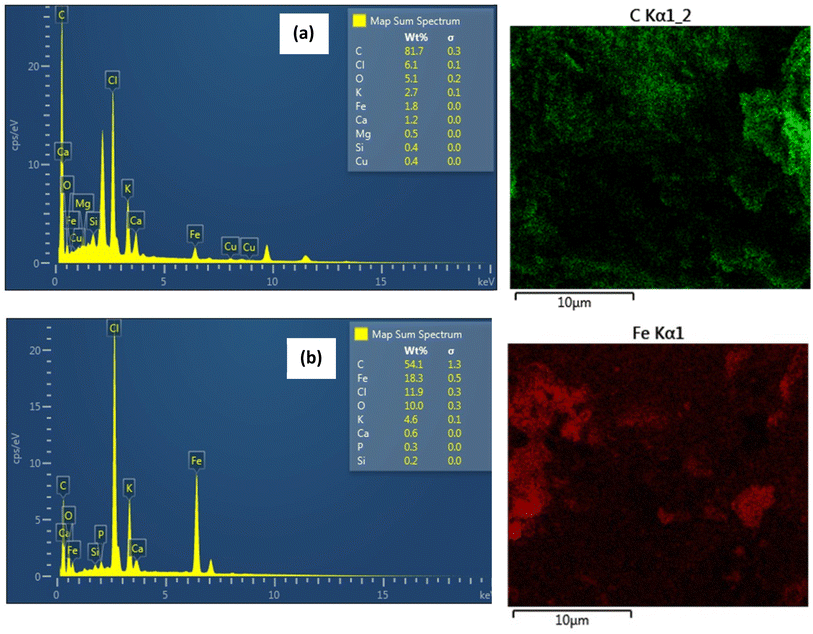
The surface morphology of biochar and magnetic biochar as observed by SEM can be seen in Fig. 7. The surface of both samples demonstrates a significant number of cavities, indicating highly porous structure with large surface area and pore volume. EDX results indicate that the surface of biochar is predominately composed of C (81.7 wt%) (Fig. 8(a)). After introducing ferric chloride (FeCl3) into the biochar, C decreased to 54.1 wt% and Fe appear about 18.3 wt% (Fig. 8(b)). The amount of Cl present in the magnetic biochar (11.9 wt%) is significantly higher than non-magnetic biochar (6.1 wt%) due to the ferric chloride. These results are in good agreement with XPS observations. Some inorganic elements such as K, Ca, Mg, Si and P were present in both biochars and likely to originate from the raw material.
The magnetic properties of both biochars at room temperature is shown in Fig. 9. From the curve, the magnetization of the chrysanthemum magnetic biochar is higher compared to the pure one which due to the introduce of ferric chloride. The small value of magnetization for original biochar also in agree with EDX result (Fe 1.8 wt%). To test the magnetic separability of biochars from solution, a magnet was put near the container. As displayed in Fig. 9, CMB stick on the surface of container near the magnet, whereas no any happen with CB although it had small magnetization. This demonstrates the magnetic sensitivity of CMB than CB, displaying a potential advantage for the separation, recovery and reuse of adsorbent as well as catalyst.
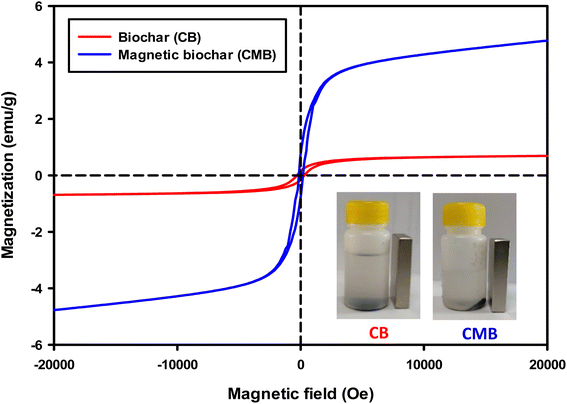 | ||
| Fig. 9 Magnetic hysteresis curve of biochar and magnetic biochar and image of IBP solutions after attracting by magnet. | ||
The yield of biochar and magnetic biochar were 32.5 and 40.5 wt%, respectively (Table 2). Similar results were reported for other biomass-based biochar such as palm oil mill residues (26.3–32.1 wt%),66 human manure (30.6–51.9 wt%),67 rice husk (35–55 wt%),68 and water hyacinth (35.9–62.2 wt%).69 A weight loss between 60–68% were observed at high pyrolysis temperature (800 °C) was attributed to a greater release of volatile matter. Moreover, the magnetic biochar had higher yields than non-magnetic biochar. This observation is consistent with the work of Tu et al.70 The moisture content of the biochars decreased from 10.68 for the original biomass to 9.12 and 9.15 wt% for biochar and magnetic biochar, respectively. This is in agreement with the work of Tsai et al.,62 Liu et al.,67 Shariff et al.71 and Łapczyńska-Kordon et al.72 The ash content of the biochar increased from 12.50 to 18.26 wt% when compared with the feedstock, this is due to the mineral content of ash, which remains in biochar after the pyrolysis process, while organic matter is lost. Moreover, the surface loaded iron oxide significantly increased the ash content.
| Properties | Chrysanthemum | Biochar | Magnetic biochar |
|---|---|---|---|
| Yield (wt%) | — | 32.5 | 40.5 |
| Moisture content (wt%) | 10.68 | 9.12 | 9.15 |
| Ash content (wt%) | 12.50 | 18.26 | 29.39 |
| Bulk density (g cm−3) | 0.25 | 0.23 | 0.26 |
| pH | — | 3.08 | 4.09 |
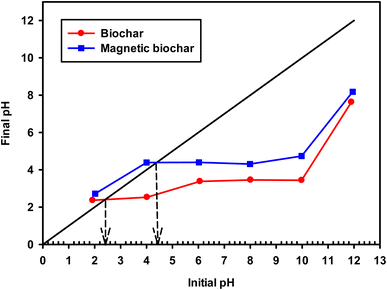
| pHpzc | — | 2.40 | 4.40 |
The experimental results of the bulk density of chrysanthemum and biochars indicate that the biochars had lower bulk density than raw material (Table 2). This may be related to the pyrolysis process causes a release of volatiles and subsequently causes development of porosity. Moreover, the magnetic biochar shows higher bulk density than that of original biochar, due to the presence of iron in the structure. However, the bulk density of chrysanthemum biochars are lower when compared to other biochars reported in the literature, for example water hyacinth (0.29–0.35 g cm−3),69 cauliflower leaves (0.37 g cm−3),73 orange peel (0.46 g cm−3),73 or pea pod (0.65 g cm−3).73
The pH and pHpzc of the adsorbent directly impact the adsorption process and the biochars obtained in this study had acidic character (pH 3.08 and 4.09 for non-magnetic and magnetic biochar, respectively). This may be due to the presence of carboxylic acid and hydroxy functional groups.74 The pHpzc is defined as the pH in which the surface charge density of the adsorbent is zero. Therefore, when the pH of the solution containing the adsorbate is lower than pHpzc, the adsorbent surface has a predominantly positively charged and as such it is favourable to adsorb negatively charged species. In solutions with pH values above pHpzc, the net surface charge is negative and it is likely to adsorb positively charged species. pHpzc was 2.40 and 4.40 (Fig. 10 and Table 2) for biochar and magnetic biochar, respectively.
3.2 Adsorption experiments
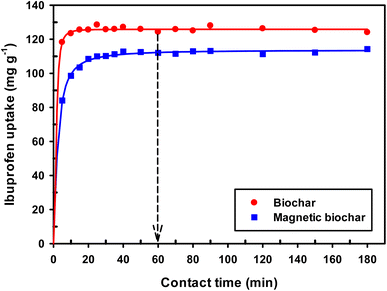 | ||
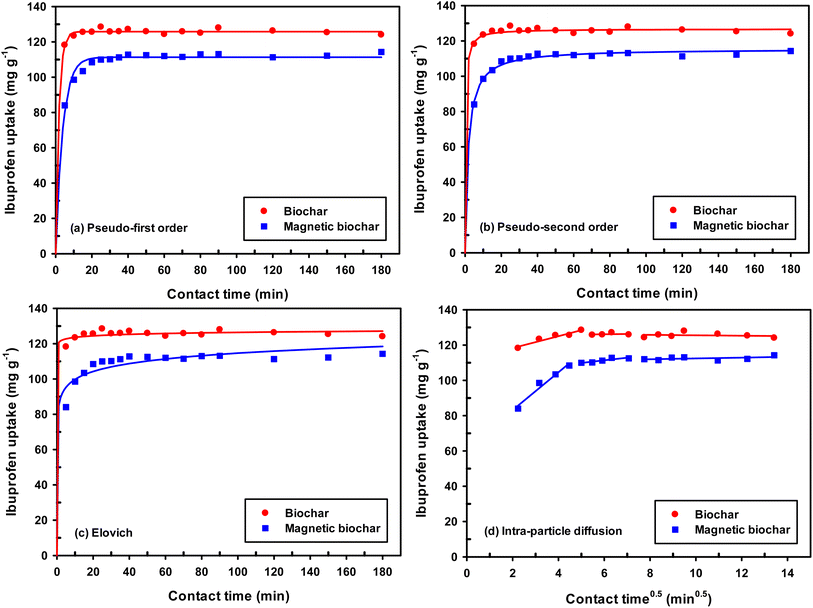
| Fig. 11 Effect of contact time on adsorption of IBP (room temperature; Co = 30 mg L−1; dosage 0.01 g/50 mL). | ||
The experimental data was further analysed with various kinetic models including the pseudo-first order, pseudo-second order, Elovich and intra-particle diffusion kinetic models. Because of the dependence on only one axis, the linear form was unsuitable for kinetic modelling.75 A significant number of literature reports have indicated that the non-linear forms of kinetic models are best suited to explain the adsorption study as compared to linear forms.76,77 Therefore, the non-linear form of the models was applied for all experiments.
The origin forms of Lagergren's pseudo-first order equation and Ho's pseudo-second order equation are generally expressed as (respectively):78
| qt = qe(1 − e−k1t) |
where qt and qe are the adsorption capacity (mg g−1) at any time t (min) and at equilibrium, respectively. The k1 and k2 are the pseudo-first order rate constant (min−1) and the pseudo-second order rate constant (g mg−1 min−1), respectively.
The important factors of the pseudo-second order model are initial rate constant (h) and half-life time (t1/2), which is the time needed to adsorb 50% of the amount of adsorbate that will be adsorbed at equilibrium. It can be calculated by the following equations:
| h = k2qe2 |
The Elovich equation is:
To compare the applicability of model equations and fitting them to the data, the correlation coefficient (R2), chi-square test (χ2) and the sum of the square of the errors (SSE) was calculated from:78
| SSE = ∑(qexp − qmodel)2 |
For the best fit of kinetic model to be achieved in any adsorption study, three conditions should be satisfied: (1) the value of adsorption uptake from experiment (qe,exp) should reasonably match the value from model calculation, (2) the values of R2 should close to 1 and (3) the values of χ2 and SSE should be minimum.
From the values of R2, χ2 and SEE (Table 3), it was found that the pseudo-first order model match the experimental adsorption data of IBP on biochar, while pseudo-second order model demonstrated a better fit for magnetic biochar. Furthermore, the calculated adsorption values (qe) from the pseudo-first order model (125.79 mg g−1) and pseudo-second order model (115.57 mg g−1) were closely resemble the experimental adsorption capacity (qe,exp) for biochar and magnetic biochar, respectively. The constants k1 and k2 obtained from CB are higher than CMB indicating that the adsorption kinetics of biochar are quicker than that of magnetic biochar. Moreover, the initial adsorption rate (h) is 6.25 times faster in biochar compared to magnetic biochar. It was also found that the half-life period of CB is 0.303 min, while it is 1.730 min for CMB, thereby confirming the affinity of IBP to adsorb to the biochars and confirmed that biochar can adsorbed IBP faster than magnetic biochar. The Elovich model is consistent with the kinetic experimental data, R2 equal to 0.996 and 0.976 for CB and CMB, respectively. The Elovich parameters (α) showed high adsorption initial rate of IBP for both biochars. Importantly, the fast adsorption of IBP is one of the most attractive advantage of the new biochars produced in this study.
| Kinetic model | Parameter | Biochar | Magnetic biochar |
|---|---|---|---|
| — | qe,exp (mg g−1) | 124.05 | 114.26 |
| Pseudo-first order | qe (mg g−1) | 125.79 | 111.31 |
| k1 (min−1) | 0.555 | 0.255 | |
| R2 | 0.998 | 0.992 | |
| χ2 | 0.189 | 0.862 | |
| SSE | 23.719 | 88.196 | |
| Pseudo-second order | qe (mg g−1) | 126.74 | 115.57 |
| k2 (g mg−1 min−1) | 0.026 | 0.005 | |
| h (mg g−1 min−1) | 417.639 | 66.782 | |
| t1/2 (min) | 0.303 | 1.730 | |
| R2 | 0.998 | 0.997 | |
| χ2 | 0.250 | 0.286 | |
| SSE | 31.321 | 30.835 | |
| Elovich | α (mg g−1 min−1) | 6.005 × 1042 | 3.363 × 10⁶ |
| β (g mg−1) | 0.814 | 0.155 | |
| R2 | 0.996 | 0.976 | |
| χ2 | 0.487 | 2.667 | |
| SSE | 60.757 | 274.965 | |
| Intra-particle diffusion | Stage I | ||
| kid (mg g−1 min−1/2) | 3.373 | 10.74 | |
| C (mg g−1) | 111.57 | 61.74 | |
| R2 | 0.929 | 0.962 | |
| Stage II | |||
| kid (mg g−1 min−1/2) | 0.180 | 1.473 | |
| C (mg g−1) | 125.03 | 102.55 | |
| R2 | 0.938 | 0.981 | |
| Stage III | |||
| kid (mg g−1 min−1/2) | 0.119 | 0.234 | |
| C (mg g−1) | 126.74 | 110.10 | |
| R2 | 0.935 | 0.925 | |
For better insight on the rate-limiting step, external transport (film diffusion) or intra-particle diffusion, the intra-particle diffusion model was fitted to the experimental results. This model is described as follows:
| qt = kidt0.5 + C |
| qe = KFCe1/n |
where qe is the amount of IBP adsorbed at equilibrium (mg g−1); Ce is the equilibrium concentration of IBP in aqueous solution (mg L−1); qm is the maximum adsorption capacity (mg g−1); KL (L mg−1), KF ((mg g−1)(L mg−1)1/n) and KLF ((L mg−1)1/n) are the Langmuir, Freundlich and Langmuir–Freundlich constants, respectively; 1/n is the dimensionless parameter for Freundlich model related to adsorption intensity, which indicates the magnitude of the adsorption driving force or surface heterogeneity. Adsorption is favourable when 1/n < 1, unfavourable when 1/n > 1, linear when 1/n = 1 and irreversible when 1/n = 0.80
Moreover, the separation factor (RL) which determines the nature of the isotherm shape is an important feature of the Langmuir model. This dimensionless parameter is given by:
Fitting of the experimental data to the isotherm models are shown in Fig. 14 and parameters as well as error functions are presented in Table 4. The highest value of R2 and lowest values of χ2 and SSE for both biochars was through the application of the Langmuir–Freundlich model on the experimental data. This indicated that two distinct adsorption mechanisms can occur: homogeneously with monolayer formation following the Langmuir model and also heterogeneously with multilayer adsorption corresponding to Freundlich model. The maximum adsorption capacities (qm) were 167.51 and 140.50 mg g−1 for non-magnetic and magnetic biochars, respectively. The calculated RL values for adsorption of IBP are also presented in Table 4. It is observed that RL values for both biochars are between 0 and 1, indicated favourable adsorption. These findings are in good agreement with the 1/n value obtained from Freundlich model (<1), which also suggested that adsorption was favourable.
| Model | Parameter | Biochar | Magnetic biochar |
|---|---|---|---|
| Langmuir | qm (mg g−1) | 187.46 | 155.70 |
| KL (L mg−1) | 0.224 | 0.109 | |
| RL | 0.043–0.309 | 0.084–0.648 | |
| R2 | 0.956 | 0.988 | |
| χ2 | 51.775 | 6.259 | |
| SSE | 2076.217 | 206.378 | |
| Freundlich | KF ((mg g−1)(L mg−1)1/n) | 46.509 | 31.072 |
| 1/n | 0.352 | 0.368 | |
| R2 | 0.844 | 0.904 | |
| χ2 | 109.784 | 31.856 | |
| SSE | 7129.363 | 1823.383 | |
| Langmuir–Freundlich | qm (mg g−1) | 167.51 | 140.50 |
| KLF (L mg−1)1/n | 0.184 | 0.072 | |
| 1/n | 1.504 | 1.331 | |
| R2 | 0.975 | 0.997 | |
| χ2 | 37.442 | 2.350 | |
| SSE | 1295.884 | 98.631 |
To validity the adsorbent properties of both biochars derived from chrysanthemum waste, their adsorption capacities must be compared with other adsorbents reported in literature. Table 5 shows the values of maximum adsorption capacity, surface area of adsorbent, time to reach equilibrium and optimum pH for the adsorption of the present study compared with other biochar materials reported in the literature. It is evident that adsorption capacity of chrysanthemum biochar and magnetic biochar which is higher than a significant number of other biochar materials reported in the literature. Moreover, the adsorption process for the biochars from this current study are both rapid and simple compared to the methods employed for many other adsorbents. The optimum pH values for adsorption agree with previously published research. However, the effect of adsorption temperature should be performed in future work to study free energy, enthalpy change and entropy change. Moreover, the competitive adsorption between IBP and ions in actual water bodies such as Ca, Mg or Na should also be studied in future.
| Adsorbent | Surface area (m2 g−1) | Time for equilibrium (min) | pH of solution | Adsorption capacity (mg g−1) | Reference |
|---|---|---|---|---|---|
| Chrysanthemum biochar (CB) | 220 | 60 | 2 | 167 | This current study |
| Chrysanthemum magnetic biochar (CMB) | 194 | 60 | 4 | 140 | This current study |
| Magnetite/multiwall carbon nanotube functionalized with hydrazine | 187 | 15 | 4 | 12 | 15 |
| Steam activated sugarcane bagasse biochar | — | 360 | 2 | 12 | 28 |
| H3PO4 activated sugarcane bagasse biochar | — | 360 | 2 | 14 | 28 |
| Steam activated mung bean husk biochar | — | 120 | 2 | 60 | 26 |
| Activated walnut shell biochar | 686 | 1440 | 4 | 70 | 24 |
| Chemically modified N-biochar from Parthenium hysterophorus | — | 120 | 4 | 90 | 81 |
| Carbon nitride (C3N4)/soot composite | 60 | 1440 | — | 149 | 82 |
| Rice straw biochar | 76 | 40 | — | 170 | 22 |
| Alternanthera philoxeroides-based biochar | 858 | — | — | 172 | 23 |
4 Conclusions
For the first time, biochar production using chrysanthemum waste from the beverage industrial was investigated and applied to the removal of IBP from aqueous solutions. Magnetic biochar was also produced with ferric chloride (FeCl3). FTIR, TGA, XPS, XRD, EDX and VSM analysis confirmed incorporation of iron leading to a magnetic biochar. The obtained biochar and magnetic biochar had BET surface area of 220 and 194 m2 g−1, respectively. The adsorption process parameters were investigated using the batch mode experiments. The results from kinetic studies executed non-linear pseudo-second order kinetic model as the best-fitted model for both biochars. Adsorption results demonstrated that the IBP removal by both biochars are highly dependent on the pH of the solution, with maximum adsorption capacities at pH 2. Langmuir–Freundlich isotherm model fitted well with the experimental data of the adsorption process, with maximum uptake capacities of 167 and 140 mg g−1 for biochar and magnetic biochars, respectively. Although magnetic biochar had a lower surface area and adsorption capacity of IBP than the non-magnetic biochar, however an advantage is that it can be easily separated from solution. Results revealed that the chrysanthemum biochars are efficient adsorbent and could possibly be used for the remediation of pharmaceutical drugs from wastewater. The reduction of voluminous bio-based industrial waste to produce a value-added biochar through pyrolysis provides possible ways to management and efficient utilise this waste.Author contributions
Y. N. designed the conception, wrote the manuscript, made calculation, plots all figures, and discussed the results; D. P., K. S., K. K., P. P. and R. P. performed the experiments; A. J. H. performed SEM-EDX experiments, corrected English language and discussed the results.Conflicts of interest
There are no conflicts to declare.Acknowledgements
This research was funded by the Fundamental Fund (FF) of Khon Kaen University under the project “Valorisation of industrial food wastes for the development of sustainable products towards a bio-based circular economy”. The authors acknowledge Synchrotron Light Research Institute (Public Organization) for XPS analysis and Assoc. Prof. Dr Supree Pinitsoontorn, Department of Physics, Faculty of Science, Khon Kaen University for performing VSM analysis. Andrew Hunt would like to acknowledge the funding by National Research Council of Thailand (NRCT) (grant number: N42A650240). The Center of Excellence for Innovation in Chemistry (PERCH-CIC), Ministry of Higher Education, Science, Research and Innovation is also gratefully acknowledged.References
- S. Suwanree, J. T. N. Knijnenburg, P. Kasemsiri, W. Kraithong, P. Chindaprasirt and K. Jetsrisuparb, Biomass Bioenergy, 2022, 156, 106304 CrossRef CAS
.
- O. Tomin and M. R. Yazdani, J. Porous Mater., 2022, 29, 849–859 CrossRef CAS
.
- Y. Dai, N. Zhang, C. Xing, Q. Cui and Q. Sun, Chemosphere, 2019, 223, 12–27 CrossRef CAS PubMed
.
- M. Elbidi, A. He was, R. Asar and M. A. M. Salleh, BioResources, 2021, 16, 6781–6790 CAS
.
- J. Manfrin, A. C. Gonçalves Jr, D. Schwantes, E. Conradi Jr, J. Zimmermann and G. L. Ziemer, J. Environ. Chem. Eng., 2021, 9, 104980 CrossRef CAS
.
- K. N. Mahmuda, T. H. Wen and Z. A. Zakaria, Environ. Toxicol. Manage., 2021, 1, 30–36 CrossRef
.
- S. Sangon, A. J. Hunt, T. M. Attard, P. Mengchang, Y. Ngernyen and N. Supanchaiyamat, J. Cleaner Prod., 2018, 172, 1128–1139 CrossRef CAS
.
- R. Davarnejad, B. Soofi, F. Farghadani and R. Behfar, Environ. Technol. Innovation, 2018, 11, 308–320 CrossRef
.
- K. Jedynak, B. Szczepanik, N. Rędzia, P. Słomkiewicz, A. Kolbus and P. Rogala, Water, 2019, 11, 1099 CrossRef CAS
.
- A. F. M. Streit, G. C. Collazzo, S. P. Druzian, R. S. Verdi, E. L. Foletto, L. F. S. Oliveira and G. L. Dotto, Chemosphere, 2021, 262, 128322 CrossRef CAS PubMed
.
- F. Fadzail, M. Hasan and Z. Mokhtar, IOP Conf. Ser.: Earth Environ. Sci., 2021, 646, 012031 CrossRef
.
- D. Balarak, Z. Taheri, M. J. Shim, S.-M. Lee and C. Jeon, Desalin. Water Treat., 2021, 215, 183–193 CrossRef CAS
.
- A. O. Arinkoola, S. O. Alagbe, I. O. Akinwole, A. I. Ogundiran, L. O. Ajayi, O. O. Agbede and O. O. Ogunleye, Environ. Res. Eng. Manage., 2022, 78, 28–37 CrossRef
.
- A. S. Mestre, J. Pires, J. M. F. Nogueira and A. P. Carvalho, Carbon, 2007, 45, 1979–1988 CrossRef CAS
.
- G. Hanbali, S. Jodeh, O. Hamed, R. Bol, B. Khalaf, A. Qdemat and S. Samhan, Materials, 2020, 13, 3329 CrossRef CAS
.
- M. Ulfa, P. Krismayana and D. Prasetyoko, IOP Conf. Ser.: Mater. Sci. Eng., 2019, 509, 012072 CAS
.
- I. W. Almanassra, V. Kochkodan, G. Ponnusamy, G. Mckay, M. A. Atieh and T. Al-Ansari, J. Environ. Health Sci. Eng., 2020, 18, 1375–1390 CrossRef CAS PubMed
.
- D. Smiljanić, B. de Gennaro, A. Daković, B. Galzerano, C. Germinario, F. Izzo, G. E. Rottinghaus and A. Langella, J. Environ. Manage., 2021, 286, 112168 CrossRef
.
- S. Oh, W. S. Shin and H. T. Kim, Environ. Sci. Pollut. Res., 2016, 23, 22882–22889 CrossRef CAS
.
- R. N. Coimbra, C. Escapa and M. Otero, Polymers, 2018, 10, 958 CrossRef
.
- Y. Jaafar, I. M. Inuwa and Z. Ladan, Sci. World J., 2020, 15, 145–148 Search PubMed
.
- N. A. Salem and S. M. Yakoot, Int. J. Pharmacol., 2016, 12, 729–736 CAS
.
- Y.-d. Du, X.-q. Zhang, L. Shu, Y. Feng, C. Lv, H.-q. Liu, F. Xu, Q. Wang, C.-c. Zhao and Q. Kong, Environ. Sci. Pollut. Res., 2021, 28, 40568–40586 CrossRef CAS
.
- M. Patel, A. K. Chaubey, C. U. Pittman Jr and D. Mohan, Environ. Sci.: Adv., 2022, 1, 530–545 Search PubMed
.
- T. V. Limbergen, I. H. Roegiers, R. Bonné, F. Mare, T. Haeldermans, B. Joos, O. Nouwen, J. V. Manca, J. Vangronsveld and S. Thijs, Front. Environ. Sci., 2022, 10, 814267 CrossRef
.
- S. Mondal, K. Bobde, K. Aikat and G. Halder, J. Environ. Manage., 2016, 182, 581–594 CrossRef CAS PubMed
.
- P. Chakraborty, S. D. Singh, I. Gorai, D. Singh, W.-U. Rahman and G. Halder, J. Water Process Eng., 2020, 33, 101022 CrossRef
.
- P. Chakraborty, S. Show, S. Banerjee and G. Halder, J. Environ. Chem. Eng., 2018, 6, 5287–5300 CrossRef CAS
.
- M. H. Shahrajabian, W. Sun, P. Zandi and Q. Cheng, Appl. Ecol. Environ. Res., 2019, 17, 13355–13369 Search PubMed
.
- Y. Yi, Z. Huang, B. Lu, J. Xian, P. E. Tsang, W. Cheng, J. Fang and Z. Fang, Bioresour. Technol., 2020, 298, 122468 CrossRef CAS
.
- M. Li, C. Dong, C. Guo and L. Yu, Processes, 2022, 10, 2720 CrossRef CAS
.
- Y. Han, X. Cao, X. Ouyang, S. P. Sohi and J. Chen, Chemosphere, 2016, 145, 336–341 CrossRef CAS PubMed
.
- M. Zhang, B. Gao, S. Varnoosfaderani, A. Hebard, Y. Yao and M. Inyang, Bioresour. Technol., 2013, 130, 457–462 CrossRef CAS PubMed
.
- D. Mohan, H. Kumar, A. Sarswat, M. Alexandre-Franco and C. U. Pittman Jr, Chem. Eng. J., 2014, 236, 513–528 CrossRef CAS
.
- Y. Mu, H. Du, W. He and H. Ma, Diamond Relat. Mater., 2022, 121, 108795 CrossRef CAS
.
- J. Wang, W. Chen, M. Zhang, R. Zhou, J. Li, W. Zhao and L. Wang, Environ. Monit. Assess., 2021, 193, 179 CrossRef CAS PubMed
.
- T. C. F. Silva, L. Vergütz, A. A. Pacheco, L. F. Melo, N. S. Renato and L. C. A. Melo, An. Acad. Bras. Cienc., 2020, 92, e20190440 CrossRef CAS
.
- M. N. Hairuddin, N. M. Mubarak, M. Khalid, E. C. Abdullah, R. Walvekar and R. R. Karri, Environ. Sci. Pollut. Res., 2019, 26, 35183–35197 CrossRef CAS PubMed
.
- P. Devi and A. K. Saroha, Bioresour. Technol., 2014, 169, 525–531 CrossRef CAS PubMed
.
- N. B. Dewage, A. S. Liyanage, C. U. Pittman Jr, D. Mohan and T. Mlsna, Bioresour. Technol., 2018, 263, 258–265 CrossRef
.
- T. Ai, X. Jiang, Z. Zhong, D. Li and S. Dai, Adsorpt. Sci. Technol., 2020, 38, 304–321 CrossRef CAS
.
- S. M. Yakout, A. A. M. Daifullah, S. A. El-Reefy and H. F. Ali, Desalin. Water Treat., 2013, 53, 718–726 CrossRef
.
- J. Xu, Q. Ma, W. Feng, X. Zhang, Q. Lin, C. You and X. Wang, RSC Adv., 2022, 12, 24439 RSC
.
- S. U. Din, A. Azeez, Z. Abdin, S. Haq, M. Hafeez, M. Imran, S. Hussain and S. S. Alarfaji, J. Inorg. Organomet. Polym. Mater., 2021, 31, 415–425 CrossRef CAS
.
- T. T. S. Matos, J. Schultz, M. Y. Khan, E. F. Zanoelo, A. S. Mangrich, B. R. Araújo, S. Navickiene and L. P. C. Romão, J. Braz. Chem. Soc., 2017, 28, 1975–1987 CAS
.
- P. Rai, R. K. Gautam, S. Banerjee, V. Rawat and M. C. Chattoapadhyaya, J. Environ. Chem. Eng., 2015, 3, 2281–2291 CrossRef CAS
.
- M. Zhang, Y. Liu, T. Li, W. Xu, B. Zheng, X. Tan, H. Wang, Y. Guo, F. Guo and S. Wang, RSC Adv., 2015, 5, 46955 RSC
.
- P. Wang, F. Ding, Z. Huang, Z. Fu, P. Zhao and S. Men, Environ. Technol. Innovation, 2021, 23, 101699 CrossRef CAS
.
- S. Luo, J. Qin, Y. Wu and F. Feng, R. Soc. Open Sci., 2021, 9, 210805 CrossRef PubMed
.
- J. Yang, Y. Zhao, S. Ma, B. Zhu, J. Zhang and C. Zheng, Environ. Sci. Technol., 2016, 50, 12040–12047 CrossRef CAS PubMed
.
- H. Geng, S. Li, Y. Pan, Y. Yang, J. Zheng and H. Gu, RSC Adv., 2015, 5, 52993 RSC
.
- W. Izydorczyk and J. Izydorczyk, Sensors, 2021, 21, 5741 CrossRef CAS PubMed
.
- X. Cao, Y. Huang, C. Tang, J. Wang, D. Jonson and Y. Fang, J. Environ. Sci., 2020, 88, 81–89 CrossRef CAS PubMed
.
- X. Jian, S. Li, Y. Feng, X. Chen, R. Kuang, B. Li and Y. Sun, ACS Omega, 2020, 5, 31234–31243 CrossRef CAS PubMed
.
- E. A. Sackey, Y. Song, Y. Yu and H. Zhuang, PLoS One, 2021, 16, e0254637 CrossRef CAS PubMed
.
- A. Hillerström, M. Andersson, J. Samuelsson and J. van Stam, Colloid Interface Sci. Commun., 2015, 3, 5–8 CrossRef
.
- C. Wang, C. He, Z. Tong, X. Liu, B. Ren and F. Zeng, Int. J. Pharm., 2006, 308, 160–167 CrossRef CAS PubMed
.
- Y. Ma, Q. Wang, X. Sun and X. Wang, Biomass Convers. Biorefin., 2015, 5, 339–346 CrossRef CAS
.
- S. Korde, S. Tandekar and R. M. Jugade, J. Environ. Chem. Eng., 2020, 8, 104360 CrossRef CAS
.
- J. J. Alvear-Daza, A. Cánneva, J. A. Donadelli, M. Manrique-Holguín, J. A. Rengifo-Herrera and L. R. Pizzio, Biomass Convers. Biorefin., 2022 DOI:10.1007/s13399-021-02227-w
.
- H. Deng, Y. F. Li, S. Q. Tao, A. Y. Li, Q. Y. Li and L. N. Hu, Environ. Eng. Res., 2022, 27, 200575 CrossRef
.
- W.-T. Tsai, S.-C. Liu, H.-R. Chen, Y.-M. Chang and Y.-L. Tsai, Chemosphere, 2012, 89, 198–203 CrossRef CAS PubMed
.
- Y. Hu, M. Ling and X. Li, BioResources, 2021, 16, 6363–6377 CAS
.
- Z. Lou, Y. Sun, S. Bian, S. A. Baig, B. Hu and X. Xu, Chemosphere, 2017, 169, 23–31 CrossRef CAS PubMed
.
- A. Sedmihradská, M. Pohořelý, P. Jevič, S. Skoblia, Z. Beňo, J. Farták, B. Čech and M. Hartman, Res. Agric. Eng., 2020, 66, 8–17 CrossRef
.
- A. Promraksa and N. Rakmak, Heliyon, 2020, 6, e04019 CrossRef PubMed
.
- X. Liu, Z. Li, Y. Zhang, R. Feng and I. B. Mahmood, Waste Manage., 2014, 34, 1619–1626 CrossRef CAS PubMed
.
- I. M. Nwajiaku, J. S. Olanrewaju, K. Sato, T. Tokunari, S. Kitano and T. Masunaga, Int. J. Recycl. Org. Waste Agric., 2018, 7, 269–276 CrossRef
.
- J. Cornette, C. Clementson and D. Fredericks, Int. J. Agric. For., 2018, 8, 4–9 Search PubMed
.
- Y. Tu, Z. Peng, P. Xu, H. Lin, X. Wu, L. Yang and J. Huang, BioResources, 2017, 12, 1077–1089 CAS
.
- A. Shariff, N. S. M. Aziz and N. Abdullah, J. Phys. Sci., 2014, 25, 97–112 CAS
.
- B. Łapczyńska-Kordon, Z. Ślipek, K. Słomka-Polonis, J. Styks, T. Hebda and S. Francik, Materials, 2022, 15, 2615 CrossRef PubMed
.
- G. S. Mary, P. Sugumaran, S. Niveditha, B. Ramalakshmi, P. Ravichandran and S. Seshadri, Int. J. Recycl. Org. Waste Agric., 2016, 5, 43–53 CrossRef
.
- S. Chellappan, V. Nair, V. Sajith and K. Aparna, Chin. J. Chem. Eng., 2018, 26, 2654–2663 CrossRef CAS
.
- W. A. H. Altowayti, N. Othman, A. Al-Gheethi, N. H. b. M. Dzahir, S. M. Asharuddin, A. F. Alshalif, I. M. Nasser, H. A. Tajarudin and F. A. H. AL-Towayti, Molecules, 2021, 26, 6176 CrossRef CAS PubMed
.
- Markandeya, S. P. Shukla and G. C. Kisku, Res. J. Environ. Toxicol., 2015, 9, 320–331 CrossRef CAS
.
- K. V. Kumar, J. Hazard. Mater., 2006, B137, 1538–1544 CrossRef PubMed
.
- L. Guo, G. Li, J. Liu, Y. Meng and G. Xing, J. Dispersion Sci. Technol., 2012, 33, 403–409 CrossRef CAS
.
- H. Guedidi, L. Reinert, Y. Soneda, N. Bellakhal and L. Duclaux, Arabian J. Chem., 2017, 10, S3584–S3594 CrossRef CAS
.
- R. Mudzielwana, M. W. Gitari and P. Ndungu, Heliyon, 2019, 5, e02756 CrossRef PubMed
.
- S. Mondal, K. Aikat and G. Halder, Ecol. Eng., 2016, 92, 158–172 CrossRef
.
- R. Liao, M. Li, W. Li, X. Lin, D. Liu and L. Wang, J. Mater. Sci., 2018, 53, 5929–5941 CrossRef CAS
.
| This journal is © The Royal Society of Chemistry 2023 |


