DOI:
10.1039/D3RA01776A
(Paper)
RSC Adv., 2023,
13, 16602-16609
Ag2NCN anchored on Ti3C2Tx MXene as a Schottky heterojunction: enhanced visible light photocatalytic efficiency of rhodamine B degradation†
Received
18th March 2023
, Accepted 19th May 2023
First published on 9th June 2023
Abstract
The quick charge recombination of light-generated electrons and holes severely restricts the photocatalytic applications of single semiconductors. Here, a straightforward electrostatically driven self-assembly technique was used to construct an Ag2NCN/Ti3C2Tx Schottky heterojunction, which was then used to degrade Rhodamine B (RhB) in the illumination of visible light. The findings from the experiments revealed that as a cocatalyst, Ti3C2Tx significantly suppresses the recombination rate and broadens visible absorptivity to improve Ag2NCN photocatalytic efficiency. The optimized Ag2NCN/Ti3C2Tx (AT2) composite exhibited an outstanding photocatalytic rate in 96 min, with the highest RhB degradation rate (k = 0.029 min−1), which was around fifteen times that of pure Ag2NCN (k = 0.002 min−1). Furthermore, the trapping-agent experiment showed photogenerated superoxide radicals and holes were the principal active agents inside the photodegradation of RhB. Compared with Ag-based semiconductors, the composite exhibited outstanding photostability, highlighting its excellent potential for application in visible-light photocatalysis.
Introduction
Nowadays, the kinds and amounts of chemicals entering water bodies through various routes have drastically increased as a result of the quick development of modern industry. Additionally, organic effluent includes a number of toxic contaminants that are challenging to degrade. Among them, RhB is highly refractory to degradation and is easily accumulated; as a result, the environment and public health are seriously threatened by RhB contamination.1,2 The main techniques employed for RhB removal include adsorption, reverse osmosis membrane filtration, and advanced oxidation processes.3–5 Notably, photocatalysis has attracted considerable attention as a solution to the environmental issues caused by organic pollutants, such as dyes, antibiotics, and persistent organic compounds.6–9 It is an eco-friendly and highly efficient technology for dealing with organic pollutant wastewater, owing to its easy operation, lower energy consumption, and minimal secondary pollution,10 and it could be an efficient strategy for RhB removal. To date, a number of semiconductor photocatalysts for environmental cleanup have been developed, including TiO2, Ag3PO4, and g-C3N4.11–13 Although these photocatalysts exhibit remarkable performance in photocatalytic reactions, it is still challenging to apply them. This is because solo catalytic photoinduced carrier recombination is relatively fast. In addition, photocatalysts have a low specific surface area, weak photostability, short light absorption range, and limited active sites.14 Hence, highly efficient and stable photocatalysts are required. Structure improvement and composition improvement are two essential methods used for enhancing photocatalyst performance,15,16 where the creation of heterojunction interfaces by joining various semiconductors is one of the most efficient ways to separate or utilize charges and increase active sites.17
According to theory, silver cyanamide (Ag2NCN) has a strong photocatalytic activity and an excellent visible-light response due to its substantial nitrogen components and naturally occurring conductive carbon (C-sp2) content. The bandgap for Ag2NCN is smaller compared to the silver-oxide instance. Due to the strong dispersion influence of the energy band, it may simultaneously increase electron mobility, decrease electron–hole recombination, and improve photocatalytic conversion efficiency.18–20 Nevertheless, the application of Ag2NCN as a photocatalyst is restricted due to the rapid recombination of photoinduced carriers, low light absorption, and photocatalytic instability caused by the self-photoreduction of Ag+.21
Constructing a semiconductor heterojunction is considered one of the most effective strategies for solving the aforementioned problems.22,23 MXene (Ti3C2Tx), a novel 2D transition-metal carbide nanosheet, is similar to graphene.24 Ti3C2Tx has recently attracted significant attention as a cocatalyst in the field of photocatalysis. This is due to its huge surface area, which includes plenty of uncovered active sites. Meanwhile, the efficient migration of charge carriers on its surface forms a close connection with other semi-conductors to construct the heterojunction.25 In addition, Ti3C2Tx has been confirmed to occupy a suitable Fermi-level (EF) position to construct the Schottky heterojunction at the interface of composites.26 For example, Cai et al. prepared Ag3PO4/Ti3C2, which displayed noticeably improved photocatalytic degradation activity and stability for organic pollutants in comparison to Ag3PO4.27 This renders it an effective cocatalyst to depress the recombination of photoproduced carries, thereby improving its photocatalytic performance.28
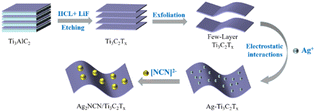
Here, the Schottky heterojunction between the interfaces of Ag2NCN and Ti3C2Tx was constructed by electrostatically driving the self-assembly to prepare Ag2NCN/Ti3C2Tx composites. As compared to pure Ag2NCN, these composites demonstrated very effective photocatalytic performance as well as stability for the degradation of RhB. The optimized Ag2NCN/Ti3C2Tx (AT2) composite demonstrated an extraordinary photocatalytic rate in 96 min, with the greatest RhB degradation efficiencies of 98.8%. A large special surface area, prominent metallic conductivity, and favorable EF position of the 2D Ti3C2Tx played a key role in the enhancement of photocatalysis. These advantages render Ti3C2Tx an excellent cocatalyst to construct a Schottky heterojunction, which can efficiently depress the recombination of carries and widen the light absorption during the photodegradation, resulting in Ag2NCN/Ti3C2Tx nanocomposites with improved efficacy and stability.
Experimental
Synthesis of Ag2NCN
In a typical synthesis,29 0.85 g (5 mmol) of AgNO3 was first dissolved in 20 mL of deionized water in a conventional synthesis. Following that, 125 mL of NH3·H2O (1.5 M) aqueous solution was swiftly added to make a clear solution while magnetic stirring was performed. The translucent solution became golden yellow after 5 mL of an aqueous solution containing 0.21 g (5 mmol) of cyanamide (H2NCN) was added dropwise. Subsequently, the precipitate was rinsed three times with deionized water and centrifuged at 3500 rpm for 5 minutes. The resulting product was dried in a vacuum (60 °C) overnight and designated as AT0 for short.
Synthesis of Ti3C2Tx pseudo-solution
Ti3C2Tx was fabricated by etching Ti3AlC2. LiF (3.2 g) was mixed with 40 mL of hydrochloric acid (9 M) to make the etching solution. To begin, 1.0 g of Ti3AlC2 was gently added to 20 mL of etching solution and then held at 40 °C for 48 hours with constant stirring. The product was washed with hydrochloric and deionized water until the pH reached a value greater than 6. The power was then diffused in 100 mL of deionized water and delaminated for 1 hour under N2 flow using ice bath sonication. The product was then centrifuged for 1 hour at 3500 rpm, and the supernatant was collected. The concentration of Ti3C2Tx pseudo-solution was calculated by filtering a portion of the supernatant and weighing the dried film mass. Finally, the colloidal solution of Ti3C2Tx was diluted to obtain a concentration of 10 mg mL−1.30
Synthesis of Ag2NCN/Ti3C2Tx nanocomposites
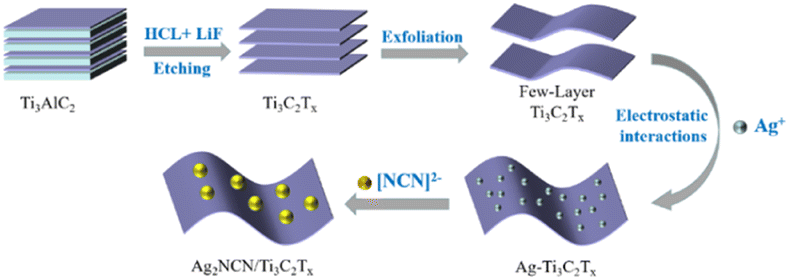
Ag2NCN/Ti3C2Tx was prepared through an electrostatically driven self-assembly process. Firstly, 0.85 g (5 mmol) of AgNO3 was dissolved in 20 mL of deionized water. Subsequently, 125 mL of NH3·H2O (1.5 M) aqueous solution was quickly added to form a transparent solution under magnetic stirring. A certain amount of Ti3C2Tx colloid (0.5 mL, 1 mL, 2 mL, and 3 mL) was then dropwise added into the above transparent solution and stirred at room temperature for 20 min. After 5 mL of an aqueous solution containing 0.21 g (5 mmol) of cyanamide (H2NCN) was added dropwise with stirring for 30 min, and the precipitate obtained was dried in an oven at 60 °C to obtain Ag2NCN/Ti3C2Tx (AT0.5, AT1, AT2, and AT3 for short). The detailed synthetic procedure for the preparation of Ag2NCN/Ti3C2Tx composites was shown in Scheme 1.
 |
| | Scheme 1 Schematics illustration for the preparation of Ag2NCN/Ti3C2Tx. | |
Material characterizations
X-ray powder diffraction (XRD, Bruker D8 advance) was used to analyze the crystal structures of the samples, with Cu K radiation (λ = 0.15328 nm) as the radiation source and a scanning rate of 5° per min ranging from 5 to 90°. Transmittance electron microscopy was used to examine the surface morphology of the samples (TEM, FEI Tecnai G2 F20). X-ray photoelectron spectroscopy was used to determine the elemental makeup of the produced materials (XPS, Thermo Scientific K-Alpha). The light absorption was measured using diffuse ultraviolet-visible reflectance (UV-vis DRS, Hitachi U-3900). Photoluminescence (PL) study was performed on the performance of photogenerated carrier transfer using a transient fluorescence spectrophotometer (Hitachi F-7000) with an excitation wavelength of 325 nm, scanning speed of 240 nm min−1, and PMT voltage of 650 V.
Photoelectrochemical experiments were carried out using a CHI660E electrochemical analyzer, which was utilized to record the electrochemical response using a typical three-electrode setup (A working electrode, an Ag/AgCl reference electrode, and a Pt wire counter electrode). The AT0 and AT2 were coated on fluorine-doped tin oxide (FTO) conductive glass and naturally dried during the transient photocurrent measurement. The light source was a 300 W xenon lamp with a bias voltage of 0.5 V. Additionally, as the electrode solution, Na2SO4 (0.5 M) solution was employed.
Photocatalytic performance tests
The photocatalytic activity of the catalysts as prepared was evaluated through experiments involving the photocatalytic degradation of RhB under visible light exposure. The light source used was a 300 W Xe lamp with a cut-off filter (λ > 420 nm). To reach an adsorption–desorption balance, photocatalysts (100 mg) were distributed in 200 mL of RhB (20 mg L−1) reaction solution, which was stirred in a lightless environment for 30 minutes. At regular intervals, 3 mL of the suspension was collected and centrifuged (8000 rpm, 10 min) to separate the catalysts for further analysis. A UV-vis spectrophotometer was used to measure the concentration of Rhodamine B (MAPADA, UV-1800PC).
To assess the photocatalytic stability of the AT2 nanocomposite, cycle photocatalytic studies were carried out using the aforementioned procedures. The catalyst was gathered after every cycle of the photocatalytic procedure, cleaned with deionized water, and then re-dispersed into a new RhB solution for the following cycle. Trapping agent studies were used to investigate the photocatalytic mechanism. Except that a small quantity of scavenger is introduced to the reaction system, the experimental procedure is quite identical to the photodegradation experiment.
Results and discussion
Characterization of structures
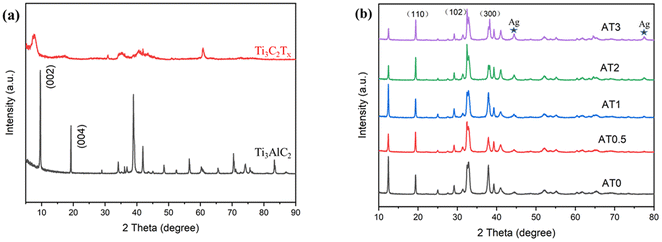
The crystal structures of as-fabricated Ag2NCN, Ti3C2Tx, and Ag2NCN/Ti3C2Tx were initially examined using XRD. According to Fig. 1a, after the etching treatment by LiF and hydrochloric acid, the peak at 39.2° (104) in the Ti3AlC2 pattern disappeared. The (002) and (004) diffraction peaks at 9.6° and 19.3°, respectively, in the XRD pattern of Ti3C2Tx shifted to a lower angle, indicating that the Al layer in Ti3AlC2 was removed and that Ti3AlC2 was mostly converted into Ti3C2Tx.31 When H2NCN solution was dropped into a solution containing silver ammonia solution and a little quantity of Ti3C2Tx, diffraction peaks were observed for Ag2NCN (Fig. 1b). According to Jia et al., the characteristic 2θ peaks of 19°, 32°, and 37.9° can be indexed to the (110), (102), and (300) crystal planes, respectively (JCPDS 70-5232).19 This proved that pure Ag2NCN could be synthesized and that the structure of Ag2NCN was unaltered by the synthetic procedure. It is worth noting that a trace quantity of metallic Ag emerged in the XRD pattern of Ag2NCN/Ti3C2Tx, which might be owing to Ag self-reduction in Ti3C2Tx MXene solution produced by low-valence Ti.32,33 According to reports in the literature,34 Ag's surface plasmon resonance effect boosts the photoelectric field close to the metal particles and creates resonance absorption in the ultraviolet-visible region, particularly in the visible region. This can increase the noble metal's electron energy density and boost the photocatalytic activity. Due to the low Ti3C2Tx concentration in the Ag2NCN/Ti3C2Tx composition, the characteristic peaks of Ti3C2Tx were unable to be found in the XRD patterns.
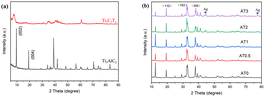 |
| | Fig. 1 (a) XRD patterns of Ti3AlC2 and Ti3C2Tx, (b) XRD patterns of Ag2NCN and Ag2NCN/Ti3C2Tx hybrids. | |
Morphology analysis
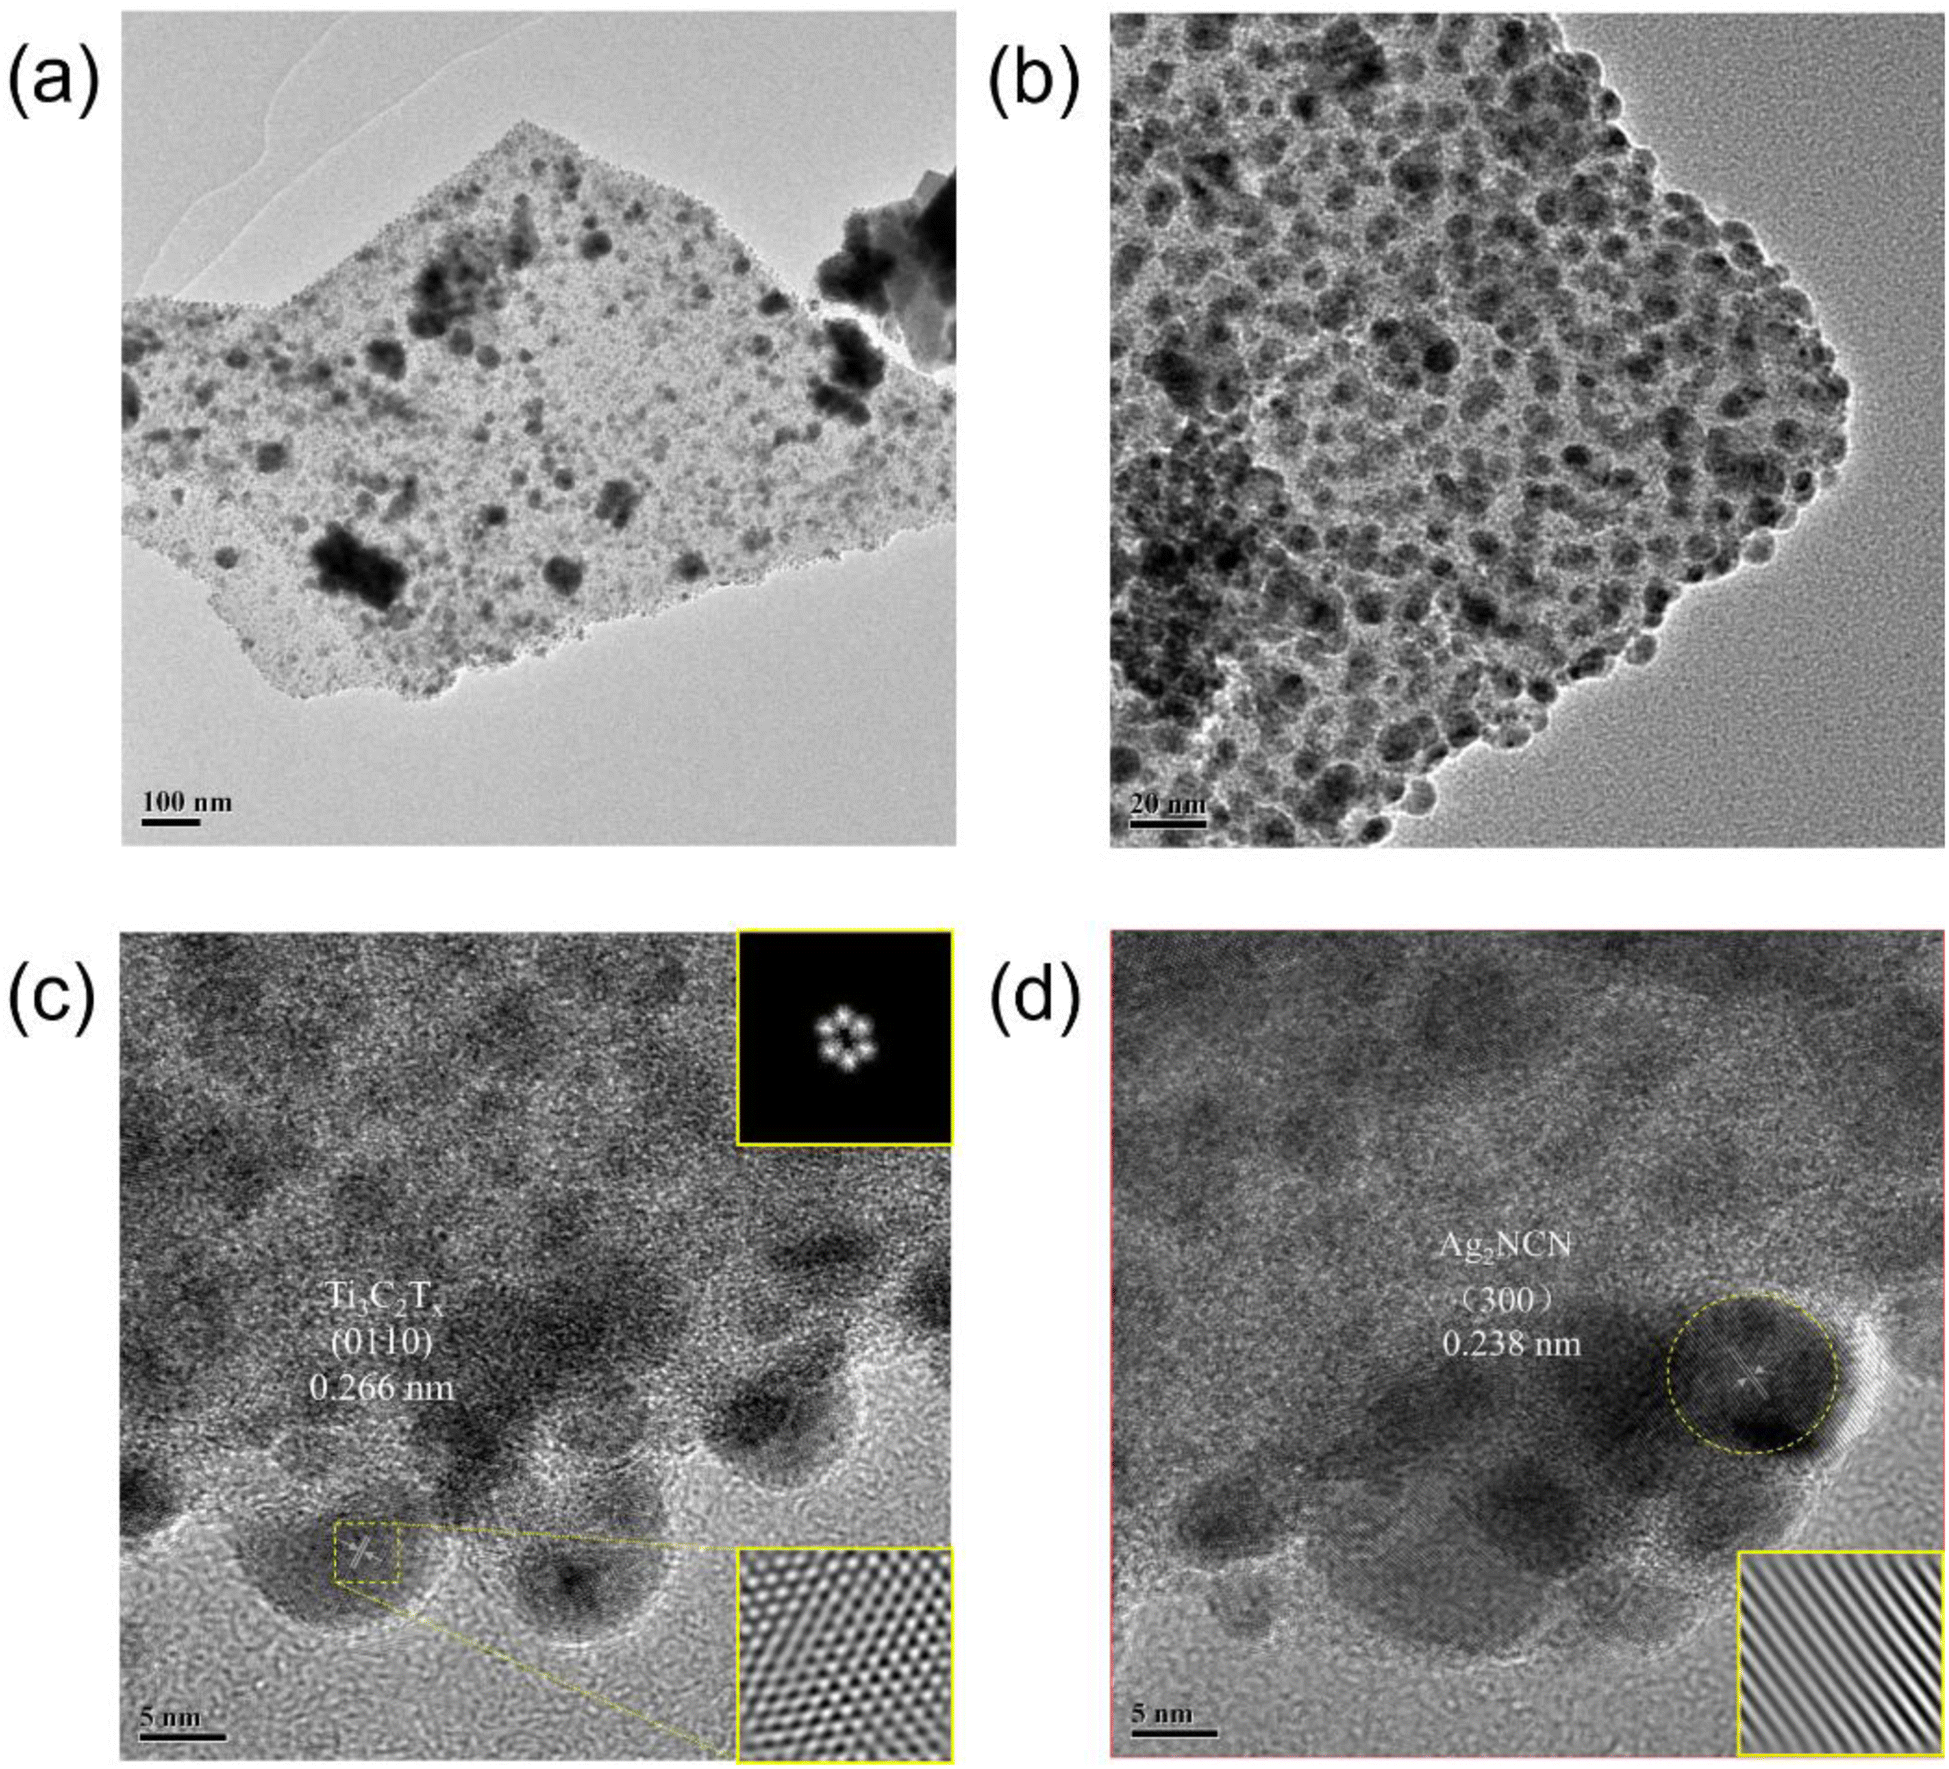
The microstructure of the AT2 photocatalyst was investigated using transmission electron microscopy (TEM). It demonstrated the existence of Ti3C2Tx. According to Fig. 2a, large lamellar Ti3C2Tx sheets and Ag2NCN nanoparticles were observed in the AT2 composite. Fig. 2b shows that the Ag2NCN nanoparticles were assembled on the surface of Ti3C2Tx, indicating the intimate coupling between Ti3C2Tx and Ag2NCN. Moreover, the electrostatically induced self-assembly of Ag+ and negative charge Ti3C2Tx resulted in a very uniform dot-like nanostructure in Ag2NCN. Notably, the inclusion of Ti3C2Tx resulted in a modest reduction in the diameters of the Ag2NCN particles in the AT2 composite when compared to the diameters of pure Ag2NCN particles (0.1–1.6 μm). The findings suggested that Ti3C2Tx could effectively control the shape and size of Ag2NCN particles, which facilitated the photocatalytic process.27 The (0110) and (300) crystal planes of Ti3C2Tx and Ag2NCN were represented by the lattice fringes with spacings of 0.266 and 0.238 nm (Fig. 2c and d).35 The TEM results showed that ultrathin, few-layered 2D Ti3C2Tx was synthesized with Ag2NCN with a large area and high quality.
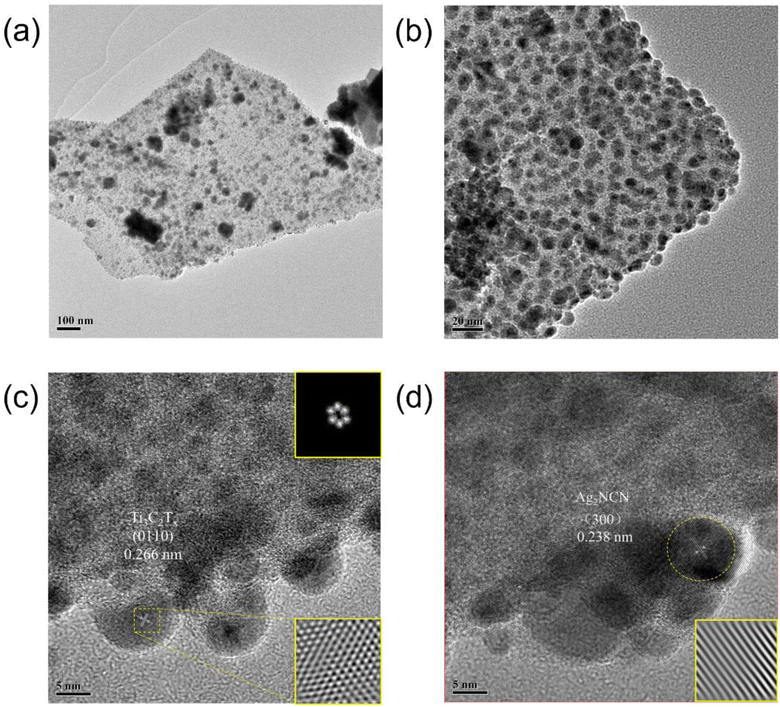 |
| | Fig. 2 (a and b) TEM images of AT2, (c and d) high-resolution TEM (HRTEM) images of AT2 composite. | |
XPS analysis
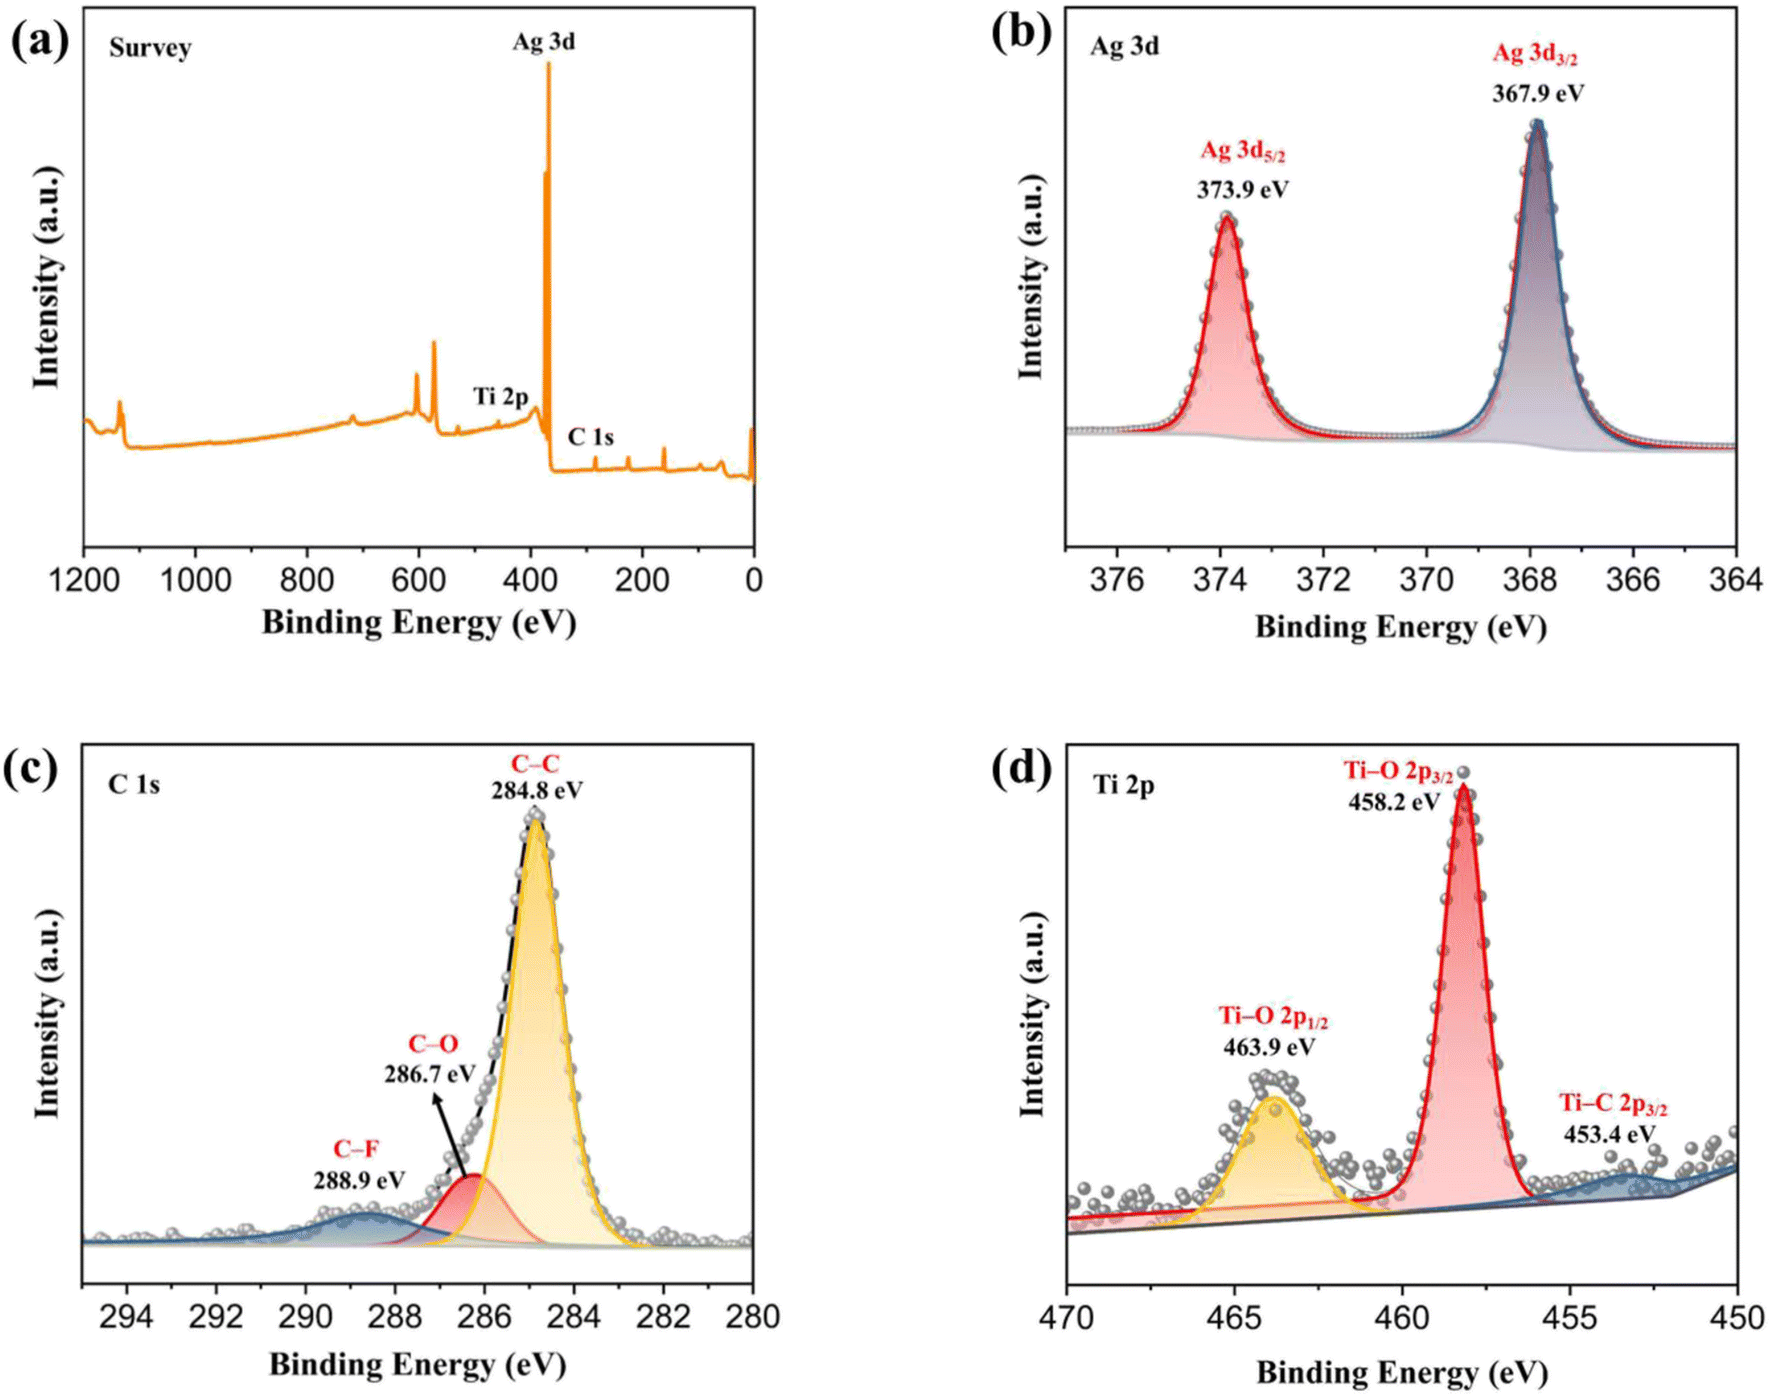
The XPS analysis of AT2 is shown in Fig. 3. Fig. 3a shows Ti, Ag, O, and C in AT2, related to the presence of Ag2NCN and Ti3C2Tx. As shown in Fig. 3b, two characteristic peaks at 373.9 and 367.9 eV were ascribed to the Ag 3d5/2 and Ag 3d3/2 of Ag2NCN,36 respectively. Three peaks at 288.9, 286.7, and 284.8 eV were observed in the C 1s pattern (Fig. 3c), ascribable to the C–F, C–O, and C–C bonds.37 The Ti 2p spectra of AT2 included three peaks (Fig. 3d), and the binding energies at 453.4, 458.2, and 463.9 eV corresponded to the Ti–C 2p3/2, Ti–O 2p3/2, and Ti–O 2p1/2, respectively.38 The peak of the C–Ti bond (281.3 eV) was not observed in the C 1s spectra. The distinctive peaks of Ti–C mostly vanished in the Ti 2p spectra, suggesting that several low-valence Ti bonds were broken during the synthesis of AT2.27 The coexistence of Ag2NCN and Ti3C2Tx in the AT2 composite was verified by the XPS findings, which correspond to the previous part of the TEM analysis.
 |
| | Fig. 3 (a) XPS survey spectrum of AT2 composite; (b–d) High-resolution XPS spectra of Ag 3d, Ti 2p and C 1s of AT2 composite. | |
Photocatalytic performance
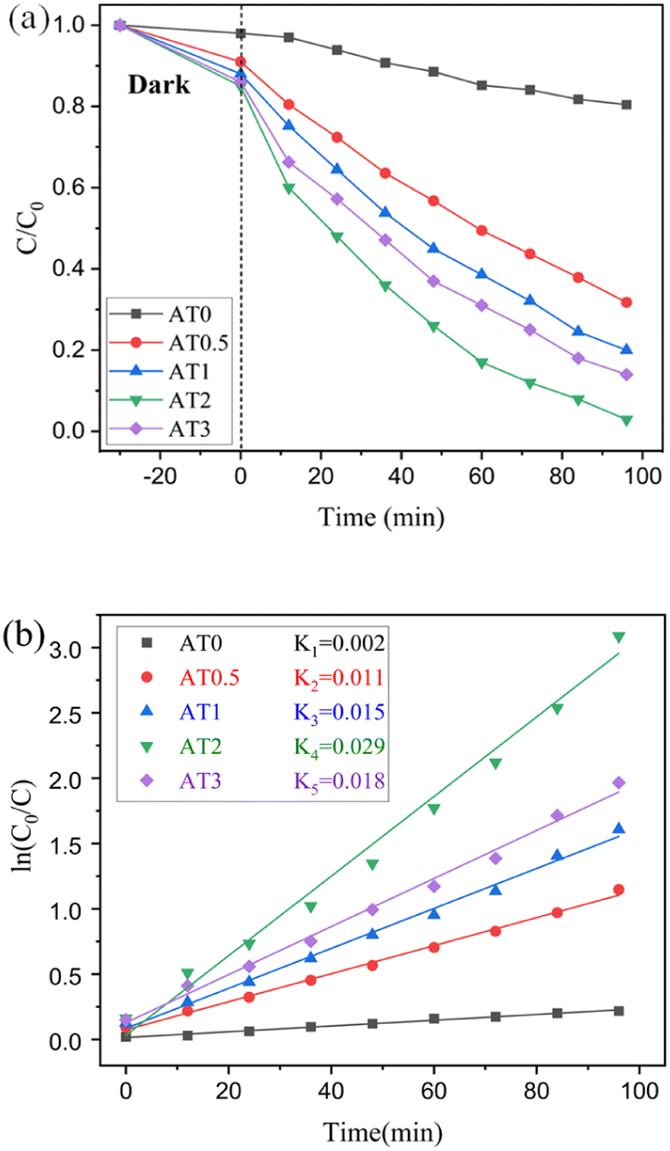
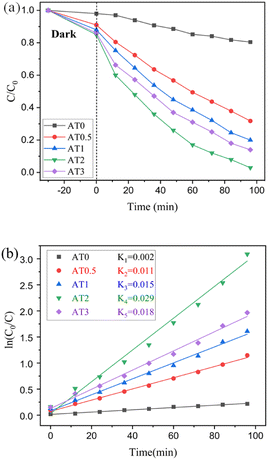
Ag2NCN/Ti3C2Tx composites of various weight proportions were tested for their photocatalytic capabilities using RhB degradation under visible light. According to Fig. 4a, the Ag2NCN/Ti3C2Tx nanocomposites own better adsorb ability during the adsorption–desorption process than pure Ag2NCN and nanocomposites outperformed pure Ag2NCN in terms of photocatalytic activity. Ti3C2Tx did not exhibit photoactivity because of its metallic properties.39 Among the catalysts with various weight ratios of Ti3C2Tx, AT2 exhibited the best photocatalytic activity; its removal rate reached 98.8% in 96 min, nearly two times that of pure Ag2NCN (45.6%). However, with an increase in the Ti3C2Tx content from 2 to 3 mL, a decreased photocatalytic performance was recorded. On the one hand, excess Ti3C2Tx decreased the Ag2NCN content, leading to insufficient photogenerated carriers.40 On the other hand, the large weight concentration of Ti3C2Tx may have occluded visible light to diminish Ag2NCN light absorption and light intensity via the reaction solution, decreasing photocatalytic performance.41 The RhB photodegradation over Ag2NCN/Ti3C2Tx with different Ti3C2Tx weight ratios is shown in Fig. 4b and is matched with a pseudo-first-order kinetics model. For RhB, AT2 demonstrated the highest photocatalytic efficiency in relation to other catalysts.
 |
| | Fig. 4 (a) The degradation rate of dyes with different catalysts; (b) plots of ln(C0/C) against reaction time. | |
The initial pH value is an important element in Fenton or Fenton-like reactions, hence the rate of RhB elimination was examined at various pH values (ranging from 3.0 to 5.0 to 6.9 to 9.0 to 11.0). According to Fig. S1(a),† the removal rate of RhB fell from 99.1% to 76.3% in 100 minutes, with the baseline pH increasing from 3.0 to 11.0. Because the pH of the solution changes, the surface charge of Ag2NCN/Ti3C2Tx changes, affecting the rate of RhB removal. The impact of the Ag2NCN/Ti3C2Tx dose (0.2, 0.3, 0.4, 0.5, 0.6 g L−1) on the removal rate was examined. The elimination rate of RhB increased with increasing catalyst dose in 96 min, as shown in Fig. S1(b).† The increase of 0.5 g L−1 of Ag2NCN/Ti3C2Tx (AT2) results in the greatest removal rate (95.6%) compared to other dosages, suggesting that increasing the catalyst dosage might give more active sites for RhB adsorption. Fig. S1(c) and (d)† are UV-vis spectra of RhB concentration changed with time and the degradation kinetics, under the condition of RhB = 20 mg L−1 200 mL, Ag2NCN/Ti3C2Tx (AT2) = 0.5 g L−1, pH = 3.0. As the reaction time changes, 99.2% RhB was removed from the solution within 60 min, this reaction belongs to the first order reaction kinetics.
The recyclable stability of a catalyst is critical in assessing its photocatalyst efficacy. A stability test was performed for the AT2 catalyst (Fig. 5). The photodegradation rate of RhB in AT2 reduced significantly (5%) during the second photocatalytic cycle, as illustrated in Fig. 5a. Nevertheless, during the following four cycles, AT2 did not show a decline in the photodegradation efficiency of RhB, showing that the AT2 composite catalyst exhibited high reusability. The XRD pattern of AT2 prior to and after the experiment is shown in Fig. 5b. The results from the FT-IR spectra and the XRD patterns were in agreement (Fig. S2†). The AT2 sample's distinctive peaks didn't seem to have changed much. After five photocatalytic cycles, no changes were observed in the structure of AT2, indicating that the composite catalyst was stable in the photocatalytic degradation reaction. It is usually believed that Ag-based semiconductors are prone to corrosion under light irradiation; however, the photocorrosion of Ag2NCN was effectively avoided by introducing 2D Ti3C2Tx.42
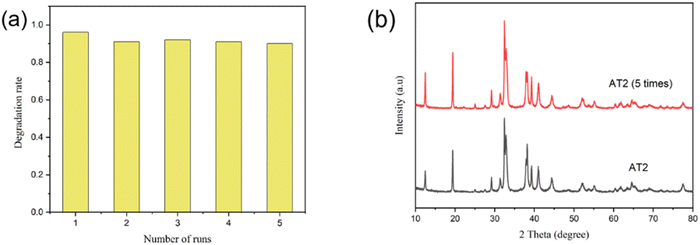 |
| | Fig. 5 (a) Cycling utilization of AT2 in the photocatalytic degradation of RhB and (b) XRD patterns of the AT2 after cycling five times. | |
Photoelectrochemical characteristics
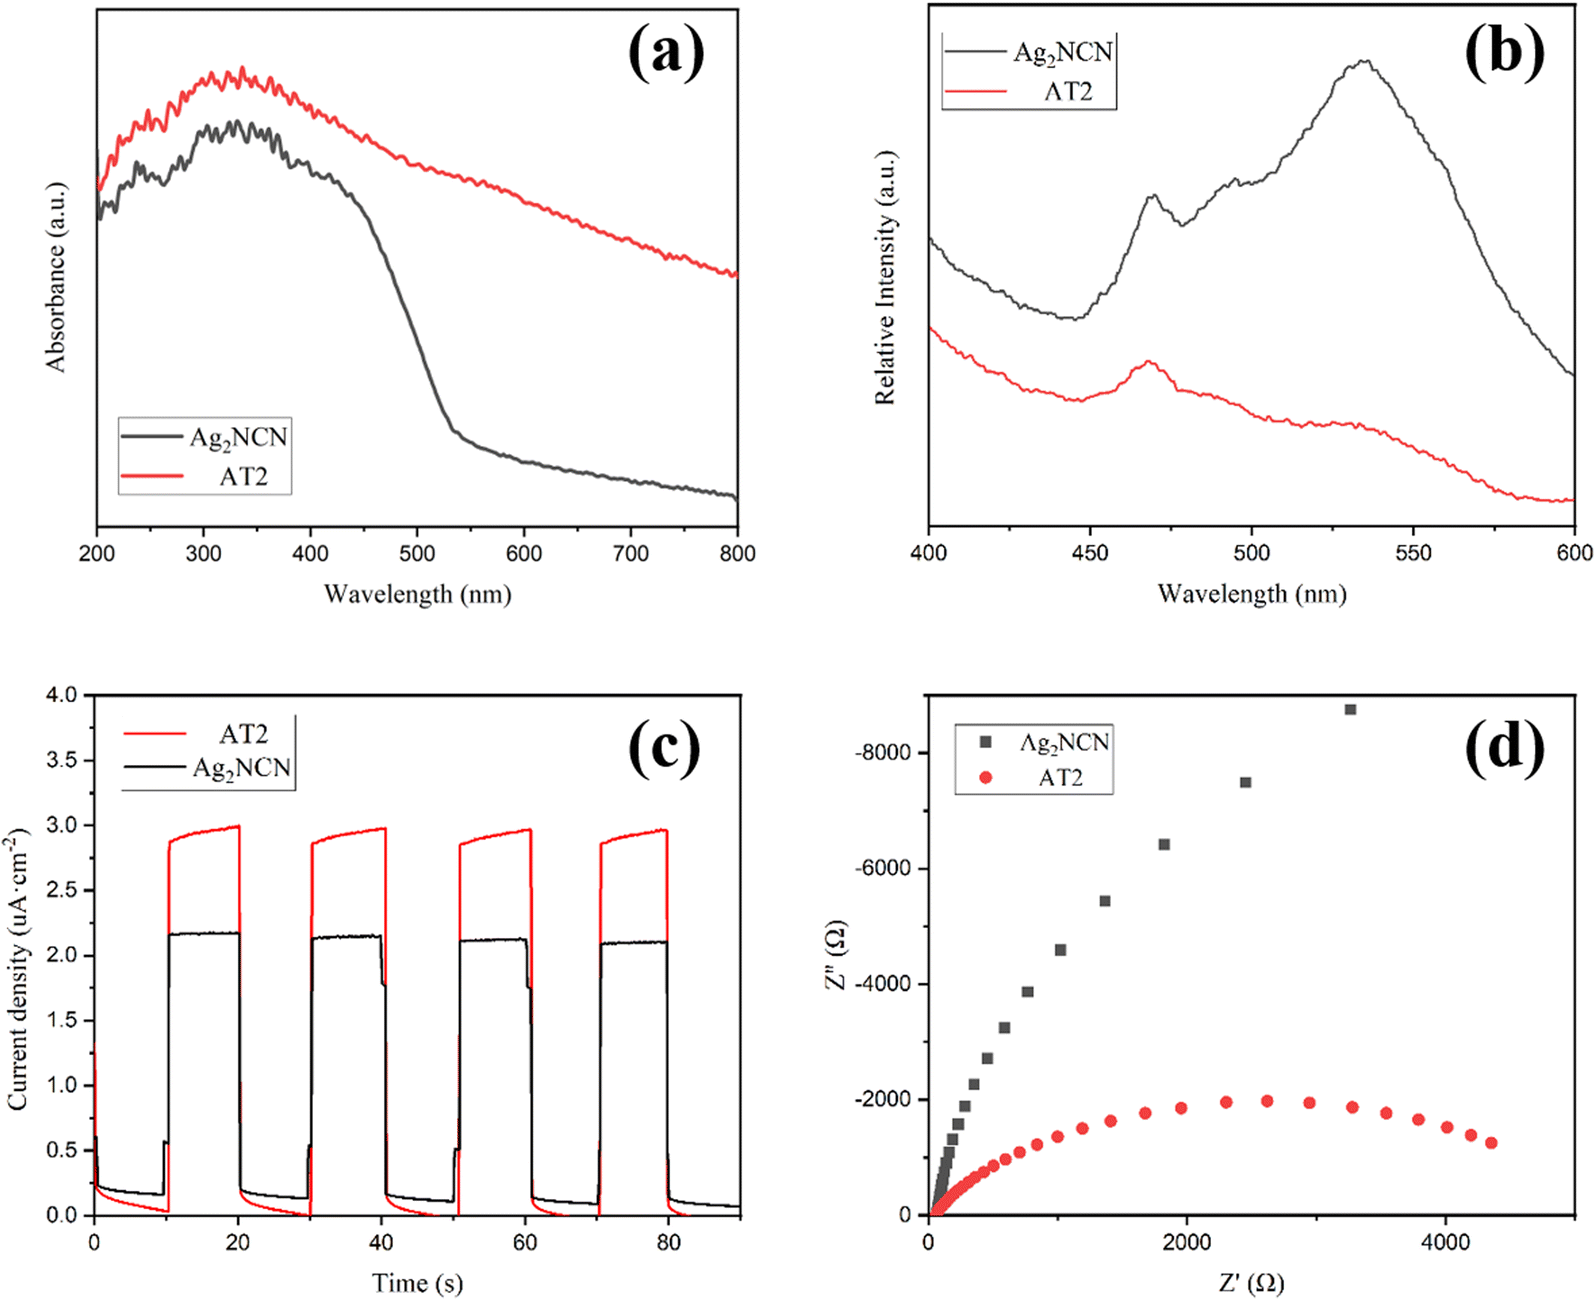
To examine the light absorption properties, Fig. 6a shows the UV-vis absorption spectra for Ag2NCN and AT2. These two samples showed impressive absorption in the scope about 400 nm or less. The absorbance of AT2 photocatalyst increased noticeably between 400 and 800 nm, compared with that of pure Ag2NCN, indicating that Ti3C2Tx successfully coupled with Ag2NCN. Additionally, photoluminescence emission spectra were used to assess electron and hole coupling (Fig. 6b). The emission peak of AT2 intensity was lower compared to pure Ag2NCN, demonstrating that an addition of Ti3C2Tx reduced the recombination of photogenerated carriers. In order to understand the charge transport process, the transient photocurrent response was investigated. The photocurrent density curves of the Ag2NCN and AT2 composite exposed to visible light (light on/off cycles: 10 s) are displayed in Fig. 6c. Similar and reproducible photocurrent responses were observed for pure Ag2NCN and AT2, demonstrating that the photocurrent was reversible. Compared to a single Ag2NCN, the AT2 composite had a greater photocurrent density. The slightly higher photocurrent density clearly demonstrated that Ag2NCN combined with Ti3C2Tx efficiently boosted the production and segregation of charge carriers. Also, the results of electrochemical impedance spectroscopy (EIS) showed how quickly photogenerated carriers transferred. As seen in Fig. 6d, the AT2 composite's semicircle diameter was smaller than that of a single pure Ag2NCN, indicating that the AT2 carriers had a lower charge transfer resistance and a faster transfer rate. With Ti3C2Tx present, the charge transfer resistance was reduced, improving visible light absorption and resulting in a high separation efficiency of photogenerated carriers.43 As a result, AT2 performed better in terms of RhB degradation.
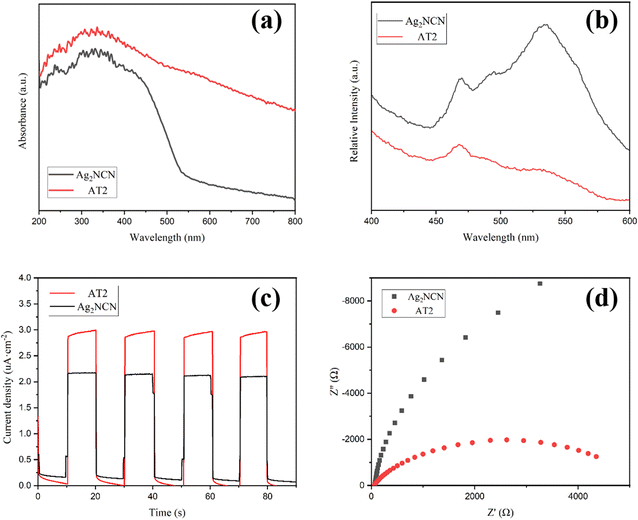 |
| | Fig. 6 (a) UV-vis absorption spectra, (b) photoluminescence (PL) emission spectra for pure Ag2NCN and AT2, (c) transient photocurrent responses, (d) electrochemical impedance spectroscopy (EIS) of pure Ag2NCN and AT2. | |
Analysis of the photocatalytic mechanism
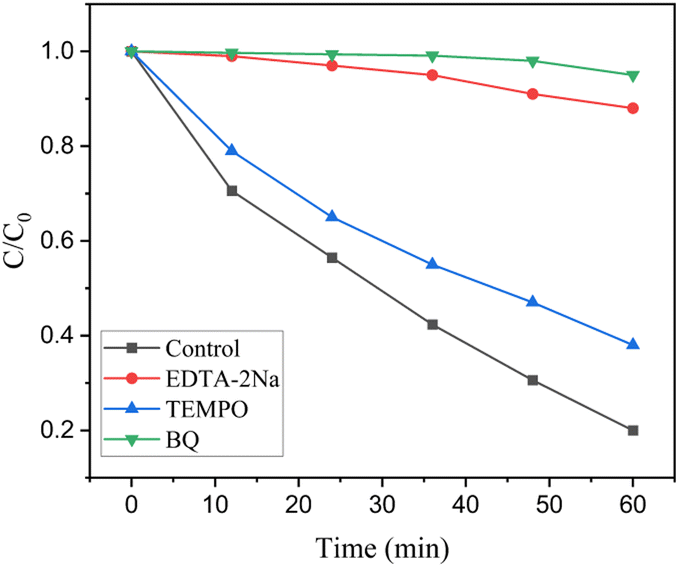
Scavengers were utilized to study the photocatalytic reaction process of the AT2 hybrid. According to Fig. 7, during the photocatalytic degradation, disodium ethylenediaminetetraacetic acid (EDTA-2Na), 2,2,6,6-tetramethyl-1-piperidinyloxy (TEMPO), and benzoquinone (BQ) were selected as capture agents for h+, ˙OH, and ˙O2−, respectively.19,44,45 After the addition of BQ, the rate of RhB degradation drastically reduced, suggesting that ˙O2− was essential to the photocatalytic reaction. After adding EDTA-2Na, a reduction in the rate of RhB degradation was seen, indicating h+ was also an important active species. Adding TEMPO had no significant impact on the photocatalytic activity. These findings revealed that ˙O2− and h+ were essential for RhB degradation, but ˙OH had no effect on the process.
 |
| | Fig. 7 Photocatalytic performance with scavengers. | |
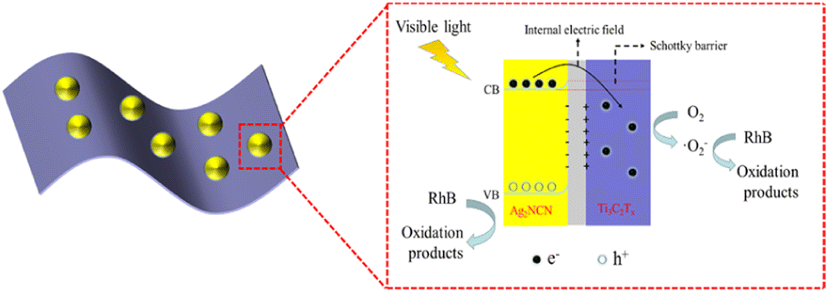
Scheme 2 illustrates a probable photocatalytic reaction mechanism. When exposed to visible light, the light-generated electron of the Ag2NCN nanoparticles was transported from the VB to the CB (0.12 eV).19 The EF of Ti3C2Tx was approximately −0.36 eV (vs. a typical hydrogen electrode) prior to contact.46 After contact, owing to the different work functions between Ti3C2Tx and Ag2NCN, the electrons in Ti3C2Tx migrated to Ag2NCN, which had a higher EF than that of Ti3C2Tx. As a consequence, the surface of Ag2NCN would acquire a negative charge, whereas Ti3C2Tx would accumulate a positive charge. The electrostatic force is generated internally at the junction of Ag2NCN and Ti3C2Tx.47 By successfully balancing the two EFs, it could be possible to reduce the recombination of photogenerated carries and considerably boost the rate at which photoinduced carries are involved in the photocatalytic activity.48 A Schottky junction was also created at the interface after contact with Ti3C2Tx caused the CB and VB of Ag2NCN to flex upward. The generating electrons precluded diffusion return to Ag2NCN because the Schottky barrier was present.49 According to the above analysis, the main possible reactions for the degradation of RhB were shown as the following equations.
| | |
Ag2NCN/Ti3C2Tx + hv → Ag2NCN(h+ + e−)/Ti3C2Tx
| (1) |
| | |
Ag2NCN(e−) → Ti3C2Tx(e−)
| (2) |
| | |
Ti3C2Tx(e−) + O2 → Ti3C2Tx + ˙O−2
| (3) |
| | |
RhB + ˙O−2 + Ag2NCN(h+) → CO2 + H2O + degradation products
| (4) |
 |
| | Scheme 2 Schematic photocatalytic reaction mechanism of Ag2NCN/Ti3C2Tx nanocomposite. | |
Conclusions
In summary, Ag2NCN/Ti3C2Tx was constructed by an electrostatically driven self-assembly process and used as the photocatalyst in the degradation of RhB. As compared to pure Ag2NCN, the AT2 composites exhibited improved photocatalytic effectiveness due to the synergistic effect of Ag2NCN and Ti3C2Tx. A superb degradation rate of RhB was achieved for the AT2 composite, which was two times that of pure Ag2NCN. The AT2 catalyst demonstrated superb photocatalytic stability. The superior visible light absorption and Schottky junction, which promoted charge transport and decreased the combination of carriers due to the close contact between Ag2NCN and Ti3C2Tx, are responsible for the improved photocatalytic performance. This work stimulates new ideas for creating sophisticated and effective heterostructure photocatalysts that possess outstanding photocatalytic stability and performance for pollutants removal using Ag-based semiconductors and 2D MXenes materials.
Conflicts of interest
There are no conflicts to declare.
Acknowledgements
This work was supported by National Natural Science Foundation of China [Grant No. 41807350]; the Liaoning Province Education Administration [LQ2019017, LJ2020008, LQ2020023, and LQ2020027]; and Program for Liaoning Innovative Research Team in University [LT2020016].
Notes and references
- W. Cheng, Y. Wang, S. Ge, X. Ding, Z. Cui and Q. Shao, Adv. Compos. Hybrid Mater., 2021, 4, 150–161 CrossRef CAS
 .
. - S. Balasurya, M. K. Okla, A. Mohebaldin, A. A. Al-Ghamdi, M. A. Abdel-Maksoud, B. Almunqedhi, H. AbdElgawad, A. M. Thomas, L. L. Raju and S. S. Khan, J. Environ. Manage., 2022, 308, 114614 CrossRef CAS PubMed .
- C. Berberidou, S. Avlonitis and I. Poulios, Desalination, 2009, 249, 1099–1106 CrossRef CAS .
- L. Huang, X. Huang, J. Yan, Y. Liu, H. Jiang, H. Zhang, J. Tang and Q. Liu, J. Hazard. Mater., 2023, 442, 130024 CrossRef CAS PubMed .
- K. Sharma, D. Vaya, G. Prasad and P. K. Surolia, Int. J. Environ. Sci. Technol., 2022, 20, 4615–4634 CrossRef .
- B. Shao, X. Liu, Z. Liu, G. Zeng, Q. Liang, C. Liang, Y. Cheng, W. Zhang, Y. Liu and S. Gong, Chem. Eng. J., 2019, 368, 730–745 CrossRef CAS .
- Y. Liu, M. Cheng, Z. Liu, G. Zeng, H. Zhong, M. Chen, C. Zhou, W. Xiong, B. Shao and B. Song, Chemosphere, 2019, 236, 124387 CrossRef CAS PubMed .
- S. Zhao, C. Chen, J. Ding, S. Yang, Y. Zang and N. Ren, Front. Environ. Sci. Eng., 2021, 16, 36 CrossRef .
- H. Yu, H. Jiang, S. Zhang, X. Feng, S. Yin and W. Zhao, Processes, 2023, 11 Search PubMed .
- N. Boonprakob, N. Wetchakun, S. Phanichphant, D. Waxler, P. Sherrell, A. Nattestad, J. Chen and B. Inceesungvorn, J. Colloid Interface Sci., 2014, 417, 402–409 CrossRef CAS PubMed .
- D. Yu, Y. Zhang, F. Wang and J. Dai, RSC Adv., 2021, 11, 2307–2314 RSC .
- L. Ma, H. Han, L. Pan, M. Tahir, L. Wang, X. Zhang and J.-J. Zou, RSC Adv., 2016, 6, 63984–63990 RSC .
- P. Li, W. Zhang, Y. Zhang, Y. Sun and F. Dong, RSC Adv., 2016, 6, 96334–96338 RSC .
- X. Wang, F. Liang, C. Huang, Y. Li and B. Chen, Catal. Sci. Technol., 2016, 6, 6551–6560 RSC .
- X. Liu, X. Duan, W. Wei, S. Wang and B.-J. Ni, Green Chem., 2019, 21, 4266–4289 RSC .
- R. Zheng, Z. Wang, C. Zhang, B. Chen, H. San and H. Yu, Composites, Part B, 2021, 222 Search PubMed .
- Y. Ding, Y. Cao, D. Chen, J. Li, H. Wu, Y. Meng, J. Huang, J. Yuan, Y. Su, J. Wang and H. Li, Chem. Eng. J., 2023, 452 CAS .
- Y. Li, C. Cao, Q. Zhang, Y. Lu, Y. Zhao, Q. Li, X. Li and T. Huang, RSC Adv., 2021, 11, 10235–10242 RSC .
- B. Jia, W. Zhao, L. Fan, G. Yin, Y. Cheng and F. Huang, Catal. Sci. Technol., 2018, 8, 1447–1453 RSC .
- W. Zhao, J. Pan and F. Huang, Chem. Commun., 2018, 54, 1575–1578 RSC .
- C. Li, S. Yu, Y. Wang, J. Han, H. Dong and G. Chen, J. Taiwan Inst. Chem. Eng., 2018, 87, 272–280 CrossRef CAS .
- C. Jin, S. Rao, J. Xie, Z. Sun, J. Gao, Y. Li, B. Li, S. Liu, L. Liu, Q. Liu and J. Yang, Chem. Eng. J., 2022, 447 Search PubMed .
- C. Yang, Q. Tan, Q. Li, J. Zhou, J. Fan, B. Li, J. Sun and K. Lv, Appl. Catal., B, 2020, 268 Search PubMed .
- A. Shahzad, K. Rasool, W. Miran, M. Nawaz, J. Jang, K. A. Mahmoud and D. S. Lee, ACS Sustainable Chem. Eng., 2017, 5, 11481–11488 CrossRef CAS .
- M. Tahir and B. Tahir, Chem. Eng. J., 2020, 400 Search PubMed .
- L.-f. Hong, R.-t. Guo, Y. Yuan, X.-y. Ji, Z.-s. Li, Z.-d. Lin and W.-g. Pan, Mater. Today Energy, 2020, 18 Search PubMed .
- T. Cai, L. L. Wang, Y. T. Liu, S. Q. Zhang, W. Y. Dong, H. Chen, X. Y. Yi, J. L. Yuan, X. N. Xia, C. B. Liu and S. L. Luo, Appl. Catal., B, 2018, 239, 545–554 CrossRef CAS .
- Q. Zhong, Y. Li and G. Zhang, Chem. Eng. J., 2021, 409 CAS .
- X. Meng, P. Yao, Y. Xu, H. Meng and X. Zhang, RSC Adv., 2016, 6, 61920–61926 RSC .
- X. Xie, N. Zhang, Z.-R. Tang, M. Anpo and Y.-J. Xu, Appl. Catal., B, 2018, 237, 43–49 CrossRef CAS .
- Z. Zhuge, X. Liu, T. Chen, Y. Gong, C. Li, L. Niu, S. Xu, X. Xu, Z. A. Alothman, C. Q. Sun, J. G. Shapter and Y. Yamauchi, Chem. Eng. J., 2021, 421 Search PubMed .
- Z. Zhang, H. Li, G. Zou, C. Fernandez, B. Liu, Q. Zhang, J. Hu and Q. Peng, ACS Sustainable Chem. Eng., 2016, 4, 6763–6771 CrossRef CAS .
- G. Zou, Z. Zhang, J. Guo, B. Liu, Q. Zhang, C. Fernandez and Q. Peng, ACS Appl. Mater. Interfaces, 2016, 8, 22280–22286 CrossRef CAS PubMed .
- M. Zayats, S. P. Pogorelova, A. B. Kharitonov, O. Lioubashevski, E. Katz and I. Willner, Chem.–Eur. J., 2003, 9, 6108–6114 CrossRef CAS PubMed .
- B. Cao, S. Wan, Y. Wang, H. Guo, M. Ou and Q. Zhong, J. Colloid Interface Sci., 2022, 605, 311–319 CrossRef CAS PubMed .
- P. Xu, J. Yang, Y. Chen, Y. Li, X. Jia and H. Song, Mater. Des., 2019, 183 CAS .
- S. Cao, B. Shen, T. Tong, J. Fu and J. Yu, Adv. Funct. Mater., 2018, 28, 1800136 CrossRef .
- W. Yuan, L. Cheng, Y. Zhang, H. Wu, S. Lv, L. Chai, X. Guo and L. Zheng, Adv. Mater. Interfaces, 2017, 4, 20 Search PubMed .
- K. Rajavel, S. Shen, T. Ke and D. Lin, 2d Materials, 2019, 6, 3 CrossRef .
- X. Chen, Y. Guo, R. Bian, Y. Ji, X. Wang, X. Zhang, H. Cui and J. Tian, J. Colloid Interface Sci., 2022, 613, 644–651 CrossRef CAS PubMed .
- H. Wang, P. Hu, J. Zhou, B. Maarten, J. Roeffaers, B. Weng, Y. Wang and H. Ji, J. Mater. Chem. A, 2021, 19984–19993, 10.1039/d1ta03573h .
- T. Cai, L. Wang, Y. Liu, S. Zhang, W. Dong, H. Chen, X. Yi, J. Yuan, X. Xia, C. Liu and S. Luo, Appl. Catal., B, 2018, 239, 545–554 CrossRef CAS .
- J.-X. Yang, W.-B. Yu, C.-F. Li, W.-D. Dong, L.-Q. Jiang, N. Zhou, Z.-P. Zhuang, J. Liu, Z.-Y. Hu, H. Zhao, Y. Li, L. Chen, J. Hu and B.-L. Su, Chem. Eng. J., 2021, 420 Search PubMed .
- W. Li, F. Wang, Y. Shi and L. Yu, Chin. Chem. Lett., 2023, 34, 1 Search PubMed .
- Y. Li, J. Wang, H. Yao, L. Dang and Z. Li, J. Mol. Catal. A: Chem., 2011, 334, 116–122 CrossRef CAS .
- B. Shao, Z. Liu, G. Zeng, Y. Liu, Q. Liang, Q. He, T. Wu, Y. Pan, J. Huang, Z. Peng, S. Luo, C. Liang, X. Liu, S. Tong and J. Liang, Appl. Catal., B, 2021, 286 Search PubMed .
- Y. Liu, Y. H. Li, X. Li, Q. Zhang, H. Yu, X. Peng and F. Peng, ACS Nano, 2020, 14, 14181–14189 CrossRef CAS PubMed .
- Y. Chen, T. Shi, P. Liu, X. Ma, L. Shui, C. Shang, Z. Chen, X. Wang, K. Kempa and G. Zhou, J. Mater. Chem. A, 2018, 6, 19167–19175 RSC .
- B. Li, S. Liu, C. Lai, G. Zeng, M. Zhang, M. Zhou, D. Huang, L. Qin, X. Liu, Z. Li, N. An, F. Xu, H. Yi, Y. Zhang and L. Chen, Appl. Catal., B, 2020, 266 Search PubMed .
Footnote |
| † Electronic supplementary information (ESI) available: XRD, TEM, FT-IR, XPS, UV-vis spectra, PL emission spectra and EIS. See DOI: https://doi.org/10.1039/d3ra01776a |
|
| This journal is © The Royal Society of Chemistry 2023 |
Click here to see how this site uses Cookies. View our privacy policy here. 
 Open Access Article
 This Open Access Article is licensed under a Creative Commons Attribution-Non Commercial 3.0 Unported Licence
 *a and
Shuhua Yao*a
*a and
Shuhua Yao*a