 Open Access Article
Adsorption of air pollutants onto silver and gold atomic clusters: DFT and PNO-LCCSD-F12 calculations†
Mohsen Doust Mohammadia,
Nikolaos Patsalidisb,
Somnath Bhowmick a,
Vagelis A Harmandarisbcd and
George Biskos*ae
aClimate and Atmosphere Research Centre, The Cyprus Institute, Nicosia 2121, Cyprus. E-mail: g.biskos@cyi.ac.cy
bComputation-based Science and Technology Research Centre, The Cyprus Institute, Nicosia 2121, Cyprus
cInstitute of Applied and Computational Mathematics (IACM), Foundation for Research and Technology Hellas, (FORTH), IACM/FORTH, GR-71110 Heraklion, Crete, Greece
dDepartment of Mathematics and Applied Mathematics, University of Crete, GR-71409, Heraklion, Crete, Greece
eFaculty of Civil Engineering and Geosciences, Delft University of Technology, Delft 2628 CN, The Netherlands. E-mail: g.biskos@tudelft.nl
First published on 14th June 2023
Abstract
We provide a comprehensive investigation of intermolecular interactions between atmospheric gaseous pollutants, including CH4, CO, CO2, NO, NO2, SO2, as well as H2O and Agn (n = 1–22) or Aun (n = 1–20) atomic clusters. The optimized geometries of all the systems investigated in our study were determined using density functional theory (DFT) with M06-2X functional and SDD basis set. The PNO-LCCSD-F12/SDD method was used for more accurate single-point energy calculations. Compared to their isolated states, the structures of the Agn and Aun clusters undergo severe deformations upon adsorption of the gaseous species, which become more significant as the size of the clusters decreases. Considering that, in addition to adsorption energy, we have determined the interaction and deformation energy of all the systems. All our calculations consistently show that among the gaseous species examined, SO2 and NO2 exhibit a higher preference for adsorption on both types of clusters, with a slightly higher preference for the Ag clusters compared to the Au clusters, with the SO2/Ag16 system exhibiting the lowest adsorption energy. The type of intermolecular interactions was investigated through wave function analyses, including natural bond orbital (NBO) and quantum theory of atoms in molecules (QTAIM), showing that NO2 and SO2 are chemisorbed on the Agn and Aun atomic clusters, whereas the other gas molecules exhibit a much weaker interaction with them. The reported data can be used as input parameters for molecular dynamics simulations to study the selectivity of atomic clusters towards specific gases under ambient conditions, as well as to design materials that take advantage of the studied intermolecular interactions.
1. Introduction
Gaseous pollutants in ambient air are associated with adverse effects on human health and climate.1,2 It is therefore highly important to design and build effective materials that can be used for removing them from the atmospheric environment, in catalysts for converting them to less harmful species, or in gas sensors for determining their concentration. In all cases, such materials can benefit from atomic clusters that can enhance the adsorption of the target gas and/or promote specific catalytic reactions.3,4Identifying the most appropriate clusters to use in such materials requires a detailed investigation of their interaction with the gaseous species from an experimental or theoretical point of view.5
Despite their high potential in a wide range of applications, atomic clusters of transition metals have been less investigated compared to other nanomaterial building blocks, including nanotubes, nanosheets, and fullerene-based nanocages. Computational studies aiming to understand the interactions of such nanomaterial building blocks with air pollutants are already reported in the literature, (see for example, ref. 6–11), whereas extensive experiments designed to probe their interaction with gaseous species at different environmental conditions have also been carried out.12–14 Atomic clusters of transition metals exhibit properties that can significantly differ from those of their larger nanoparticle and bulk-material counterparts. Zn atomic clusters, for example, can switch from conductors to semiconductors as their size decreases, having energy band gaps that can vary depending on the number of atoms they consist of.15 In a similar manner, Mn-based atomic clusters, which in bulk is an anti-ferromagnetic material, can exhibit a strong ferromagnetic behaviour.16 Such property transitions provide a strong motivation for further investigating the properties of atomic metal clusters and understanding the fundamental mechanisms involved.
The size of the atomic clusters defines their electronic structure and stability, and consequently, the type and strength of the interactions with gaseous molecules, narrowing their suitability for different applications based on the number of atoms they contain.17,18 To further explore the suitability of atomic clusters for specific applications, including in gas absorbers, catalysts and sensors, one needs to carry out molecular dynamics simulations using force fields that require optimized input parameters such as accurate estimations of the adsorption energies.19 Going a step further, one can also use this type of simulations to design cluster-containing materials and optimize their performance depending on the needs of the applications. For instance, using clusters on which gaseous species can chemisorb would be ideal for materials used to remove air pollutants from ambient air, but could be problematic for gas sensors as they can cause longer recovery times. Using clusters on which the gas molecules can be physiosorbed would be more appropriate for gas sensors and less appropriate for absorbers.
Silver clusters have physical and chemical properties that change drastically depending on the number of atoms they consist of.20,21 Some theoretical studies for determining the geometrical structure of metallic Ag clusters are available in the literature. For example, Dixon et al.22 have carried out a relatively detailed study on silver clusters of less than 100 atoms and reported the energy content of each species. Using Density Functional Theory (DFT), McKee et al.23 studied the stability of silver clusters comprised of up to 22 atoms and reported that Ag16, Ag18, and Ag20 are much more stable in terms of their dissociation energies. Moreover, Tiago et al.24 were able to study silver clusters of up to 8 atoms with high accuracy, whereas Shao,25 using a less precise method compared to DFT, optimized the geometry of silver clusters containing up to 160 atoms.
Gold atomic clusters have also been of high interest.26,27 The relativistic effects of gold atoms attribute to their clusters and nanoparticles unique properties, manifested through the higher resistance to oxidation and the accessibility to higher oxidation states compared to silver atoms.28 Due to the quantum confinement effect, clusters of a few gold atoms have been shown to exhibit properties that deviate from those of their larger nanoparticle counterparts, finding applications in optoelectronics and catalysis.29,30 Motivated by these properties, Schwerdtfeger et al. performed detailed work on gold atomic cluster structures from 2 to 20 atoms.27 Using artificial intelligence algorithms, Wu et al. have also been able to provide structures for gold clusters up to 38 atoms.31
Although studies aiming to determine the mechanical, chemical, and electrical properties, among others, of gold and silver clusters has been relatively extensive, it is still not fully known how different gaseous species can adsorb onto their surface. This is partly because the calculations that are required are rather time-consuming, allowing the study of only small systems. For example, Zhou et al.32 have studied the interaction of carbon monoxide (CO) with silver clusters Agn (n = 1–7) and found that Ag3 was the most favorable species among others to adsorb CO, having an adsorption energy of 0.87 eV. The same group has also investigated the reactions of silver clusters with chlorine molecules and shown that the adsorption of chlorine on the most stable cluster (in terms of energy) cannot always lead to the most stable gas/cluster system.33 In another attempt, Reber et al. focused on the interaction of diatomic oxygen molecule with the Ag15+ cluster and tried to relate the cause of the wide energy gap after the oxygen adsorption process to the deformation of the structure, which is caused by the splitting of the subshells.34 A structural study between the clusters and the CO gas molecule has been studied by Huang et al.,35 showing that Au17− tends to maintain its structural geometry after the adsorption process, exhibiting little deformation. The ability of gold atomic cluster Au20, Ag20, and Ag8Au12 bimetallic clusters to interact with pyridine has been investigated by Seuret-Hernández,36 who were able to use these clusters to create materials for surface-enhanced Raman spectroscopy.
A number of parameters should be considered when investigating the interaction of atomic clusters with gaseous species. Determining these interactions requires overcoming certain challenges. First, it is important to know the structure of the clusters and how this varies with increasing the number of atoms they consist of. Because they do not follow a certain symmetry, many structural isomers can be considered for atomic clusters, thus making identification of the optimal geometries a rather tedious task. Secondly, the sampling of gas molecules around the clusters can be challenging because it is not possible to consider the relative preference for a specific area of the cluster concerning the interaction with the gas molecule. Due to the asymmetry of the clusters and the number of possible configurations resulting from the interaction between the gas molecules and the clusters, an smart model must be designed by artificial intelligence, as discussed further below in this work. A third challenge is related to the flexibility of the atomic clusters, which causes noticeable changes in their structure when subjected to external fields inducing those induced by nearby molecules. For example, when a gas molecule like SO2 moves towards a silver cluster and adsorbs on its surface, the structure of the cluster can change drastically, as discussed below. As a result, the cluster is deformed, requiring the deformation energy to be considered for determining their properties and, consequently, their behavior in different environments.
In this work, we have carried out comprehensive calculations to study the interactions of silver and gold atomic clusters with the most common atmospheric gaseous pollutants, including CO, CO2, NO, NO2, SO2, and CH4, as well as H2O. After determining the structure of the isolated clusters, we calculated the interaction energy between the two species of the gas/cluster systems using DFT at the M06-2X/SDD level of theory. The geometric structures obtained from the optimization process through the DFT calculations have been used to perform single-point energy analysis. In addition, the PNO-LCCSD-F12/SDD method was used to study the energy of gas/cluster systems (up to 12 silver and Au atoms). In order to understand the type of interactions between silver and gold atoms in metal clusters and gas atoms, we carried out wave function analyses, including the natural bond orbital (NBO) and quantum theory of atoms in molecules (QTAIM).
2. Computational details
To solve the Schrödinger equation within the Born–Oppenheimer approximation, the total number of electrons in the studied system is the most important parameter. Considering that the systems studied in this work can contain up to more than 1500 electrons, it is practically impossible to carry out simulations with any of the post-Hartree–Fock methods such as the full configuration interaction (CI),37 the multireference configuration interaction (MRCI),38,39 or even the complete-active-space self-consistent-field (CASSCF),40 among others. DFT methods, on the other hand, are cost-effective in terms of computational power without compromising accuracy.The electronic structure calculations reported in this work have been performed at the DFT level using the M06-2X functional.41,42 We should note here that for heavy atoms, including transition metals such as gold and silver, the contribution of the kinetic energy becomes significant,43 and thus a functional that can capture the contribution arising from kinetic energy terms accurately should be chosen. M06-2X is a hybrid functional with 54% Hartree–Fock exchange that can cover non-covalent interactions. This makes it a suitable option among those available for the studied system, having the ability to capture the contribution of kinetic energy, as shown by benchmarking studies.44 To correct the error related to the dispersion, posterior corrections containing various damping functions such as the Petersson–Frisch dispersion (PFD),45 the Grimme's dispersion with the original D3 damping function (GD3),46 and the Grimme's D3 dispersion with Becke–Johnson damping function (GD3BJ),47 among others, are usually applied to the functionals manually. M06-2X42 is a high nonlocality functional with double the amount of nonlocal exchange that is able to take into account the dispersion energy to an optimal extent. This is because M06-2X is a flexible functional that, in addition to considering the contribution of the medium–range interactions, can include the asymptotic behavior such as dispersion corrections.41
Although choosing a basis for the DFT calculations is another challenge, it is possible to narrow down the range of choices by considering the size of the studied systems and their chemistry. Choosing a very large basis set to provide a suitable integration space, one should also consider the hardware used for the calculations. In this study, we employed the Stuttgart RSC 1997 (SDD) RECP basis set48,49 for two reasons. First, for a direct comparison with the results on atomic silver clusters obtained by McKee et al.,23 and second, because this basis set is one of the best-recommended options for computations considering transition metals, as shown by Martin et al.50
Following the geometry optimization carried out using the M06-2X/SDD functional, we performed single-point energy computations at the PNO-LCCSD-F12/SDD level51 on the M06-2X optimized geometries for the clusters containing up to 12 atoms. Gaussian 16 (ref. 52) was used for the DFT calculations, whereas Molpro53 was employed for the CCSD computations. In order to determine the possible initial configurations of the gas molecules and the atomic clusters, we used the ABCluster software54,55 that employs the artificial bee colony algorithm.56 Semi-empirical computations were carried out using the xtb software57 developed by Grimme and co-workers. The Multiwfn code58 developed by Lu et al. was also used to perform wave function analyses.
All global minimum structures we determined in this study were further confirmed by the absence of imaginary harmonic frequencies in any normal modes through DFT calculations. The global minimum structures of the gas/cluster systems are given in Tables S1 and S2† in the first supplement (; ESI-1†). The zero-point energy (ZPE) corrected gas adsorption energy on the metal cluster (Eads) is calculated as:
| Eads(ZPEC) = Egas/cls(ZPEC) − Ecls(ZPEC) − Egas(ZPEC) | (1) |
| Eads = Eint + Edef | (2) |
The interaction energy, Eint, describes the direct specific gas–cluster interaction, defined as:
| Eint = Egas/cls − (Ecls + Egas) | (3) |
The deformation energy, Edef, describes the energy related to the deformed cluster with respect to its isolated state and is defined as:
| Edef = Eclsdef + Egasdef = (Ecic − Ecls) + (Egic − Egas) | (4) |
3. Results and discussion
3.1. Geometry optimization
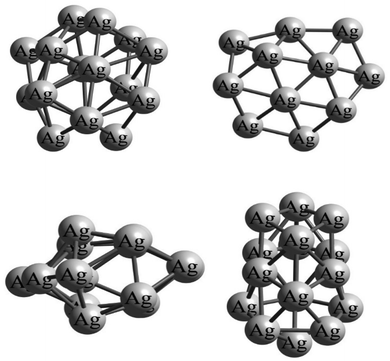
All the isolated structures of the silver Agn (n = 1–22) and gold Aun (n = 1–20) clusters have been extracted from the studies of McKee et al.23 and Nguyen et al.,59 respectively. Since atomic clusters of gold and silver do not often have a symmetrical shape, the gas–cluster interaction Potential Energy Surface (PES) is rather complex, exhibiting a large number of possible adsorption sites on the surface of the clusters. Indeed, due to the asymmetry of cluster structures, the number of positions on their surface where the gas molecule can adsorb (i.e., adsorption sites) can be extremely high. As an example, Fig. 1 shows the asymmetric structure of the Ag16 cluster at different orientations. It is clear from the considerable differences in these orientations that a gas molecule approaching the cluster from specific directions can yield different intermolecular interactions. As a result, it is challenging to identify the global minimum structures for the gas/cluster systems as several different initial configurations of the gas molecules for a specific cluster must be considered in the geometry optimization calculations.A standard and simplified way to obtain reasonable initial structures of gas/cluster systems is by constraining the center-of-mass distance between two species (here a gas molecule and an atomic cluster) and then optimizing the geometry with respect to the other degrees of freedom; e.g. bond lengths, as well as atomic (bending) and dihedral angles. This approach results in a large number of potential configurations that must be optimized. Here, we initially consider 5000 configurations of the two species relative to each other using the ABCluster software. To be more specific, the center-of-mass of the atomic cluster is fixed at the center of the coordinate system, and the gas molecule is placed at different distances and with different angles around it to determine the optimized geometry of the gas/cluster system using the bee colony algorithm.
Once this is achieved, we determine the structure having the minimum energy using the Universal Force Field (UFF).60 We should note here that many of these 5000 configurations are equal (with an accuracy of a third decimal digit of Hartree) in terms of the total energy (i.e., isostates), allowing us to reduce the number of configurations for further calculations by using one representative for each isostates. Following this process, only a couple of hundred configurations remain in terms of total energy. In turn, we used the PM7 method,61 implemented by the xtb software, which reduces the number of selected configurations between 30 and 50. These configurations are then introduced to the Gaussian 16 software for DFT calculations using the M06-2X functional and the SDD basis set.
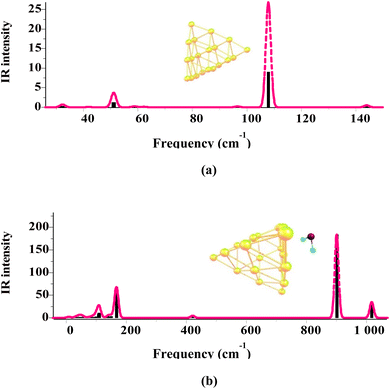
The above-mentioned procedure has been followed for all Agn and Aun clusters and each of the gas/cluster systems considered in this work. The XYZ coordinates of all geometric structures optimized by the DFT method are included in Tables S1 and S2 in ESI-2.† All structures obtained by the geometry optimization calculations are further evaluated for harmonic vibrational frequencies to confirm that they have no imaginary frequencies and, thus, all correspond to local minima. As an example, Fig. 2 shows the vibrational frequencies related to the structures of the Au20 cluster and the SO2/Au20 system. The frequencies of all the gas/cluster systems investigated here are provided in Tables S1 and S2 in ESI-3.† Frequency calculations are also important as they provide corrections to the zero-point energy, leading to more accurate adsorption energies (cf. eqn (1)).
3.2. Energies of the gas/cluster systems
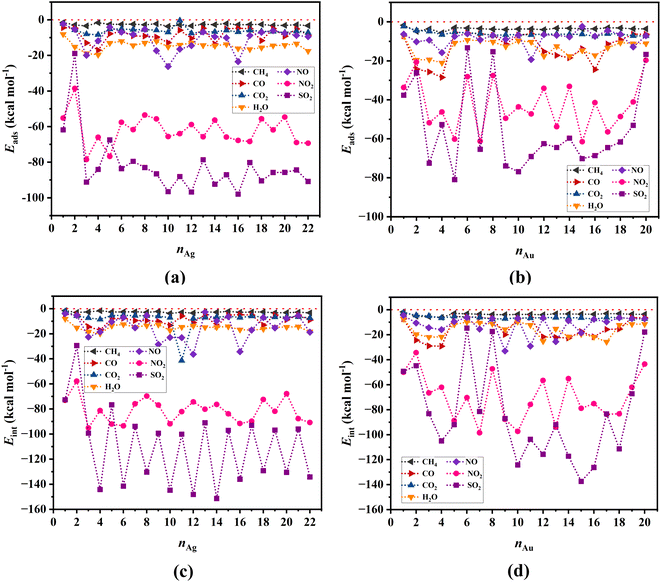
Metal clusters, due to their high flexibility, undergo considerable structural changes when different gas molecules approach them, with the resulting deformations having significant effects on the adsorption energy (as captured by eqn (2)–(4)). Fig. 3a and b show respectively the adsorption energies of all the gases investigated in our study onto Ag and Au clusters, respectively. Evidently, among all the gases we studied, NO2 and SO2 exhibit the highest adsorption preference toward both types of clusters, with a slightly higher preference towards the Ag clusters. In contrast, all the other gases, i.e., CH4, CO, CO2, NO, and H2O, show a rather weak interaction with both the Ag and Au clusters.The variability of adsorption energies observed in the results may originate from the relative stabilities of singlet and doublet spin states of the clusters, which alternates with the number of atoms that the clusters contain. The interaction energy results for SO2 illustrate this phenomenon well, as shown in Fig. 3c and d for Ag and Au clusters, respectively.
Single point energy calculations using the PNO-LCCSD-F12/SDD level of theory have also been performed on the geometric structures optimized by the DFT calculations. We should point out here that due to the substantial computational cost, we have restricted these calculations to Ag and Au clusters containing up to 12 atoms. Fig. 4 shows the variability of adsorption energies with the number of atoms in the cluster, indicating that the PNO-LCCSD-F12 calculations follow a similar trend to those determined by the DFT. One of the differences that can be observed between the PNO-LCCSD-F12 and the DFT predictions is that the adsorption energy values predicted by the former are slightly smaller, which is expected because the dispersion forces can be calculated more accurately. The numerical values of adsorption and interaction energies are provided in Tables S1–S6 in ESI-1.† Furthermore, the values obtained from thermochemical calculations for all systems are listed in Tables S7 and S8 in ESI-1.†
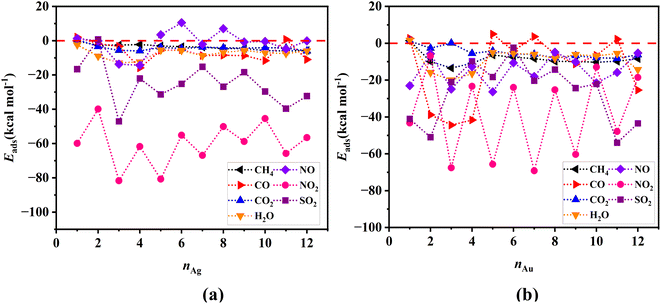 | ||
| Fig. 4 Adsorption energies for (a) gas/Agn, and (b) gas/Aun systems determined at the PNO-LCCSD-F12/SDD level of theory. The horizontal red-dotted line represents the zero-value energies. | ||
3.3. Electronic structures and reactivity
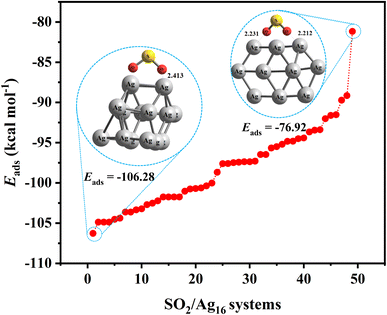
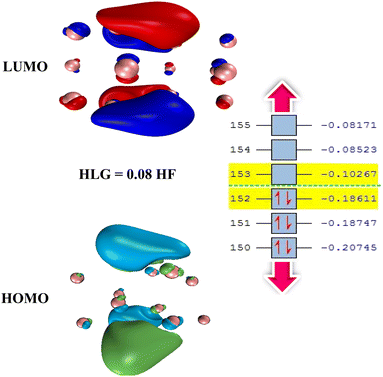
One way to reduce the number of optimization calculations of gas/cluster system structures is to determine the reactivity of both the gas molecules and the cluster. For example, by determining the most reactive part of the cluster, to the degree this is possible, the gas molecule can be brought closer to the cluster at that site, thus avoiding examining all other adsorption sites around the cluster.62 There are many different analyses to predict reactive sites on a molecule, such as electrostatic potential,63 atomic charges,64,65 frontier molecular orbital (FMO) theory, Fukui function,66 dual descriptor method,67 etc. The Conceptual Density Functional Theory (CDFT) framework, introduced by Parr and developed by others,66,68 can also be used to predict reactivity and provide useful information about the electronic structure of gas molecules and clusters.In general, the higher the contribution of the Highest Occupied Molecule Orbitals (HOMO), the better the site for electrophilic attack. On the other hand, the higher the contribution of the Lowest Unoccupied Molecular Orbital (LUMO), the better the site for nucleophilic attack. Having the distribution of electrons based on these two types of orbitals can therefore help to identify reactive sites and place gas molecules within their vicinity, treating the rest of the regions as less important. To illustrate that, Fig. 5 shows the adsorption energy values for 50 possible configurations of the SO2 molecule onto the Ag16 cluster (also shown in Table S9 in ESI-1†). Given that all energies are negative and relatively close to each other, it is clear that all possible configurations need to be considered to provide a detailed study of the complex gas/cluster phase space. Such a detailed investigation could be used for future studies concerning, for example, the development of advanced classical force fields that are capable of accurately describing the interaction of gasses with metal clusters via machine-learning algorithms.19 Fig. 6 shows the HOMO and LUMO orbitals for SO2/Ag16 systems having the largest adsorption energy (configuration No. 1 in Fig. 5). Evidently, for this case if the SO2 molecule approaches the cluster from the side of HOMO orbitals, stronger adsorption energy is obtained. If the approach is from any other side of the cluster, the interaction would be weaker.
Fig. 7 shows the percentage of HOMO–LUMO energy gap (HLG) changes of the gas/cluster systems, determined as ΔHLG = (HLGs − HLGis)/HLGis × 100, where HLGs and HLGis, are respectively the gap values of the system and the isolated cluster for Ag and Au, respectively. The data shown in this figure are also provided in Tables S10 and S11 (ESI-1).† Although there are some irregularities in the trends, overall the energy gap decreases significantly with increasing the number of silver and gold atoms in the clusters. This is a general feature that is observed for all systems. It should also be noted that the HOMO–LUMO energy gap of the clusters in the isolated state change drastically when they interact with the gases. In the cases of NO, NO2, and SO2, the HLG changes are large, whereas, for CH4, CO, and CO2, they are considerably small. The values of other indicators, including chemical potential (μ), chemical hardness (η), and electrophilicity index (ω), are also listed in Tables S10 and S11 (ESI-1).† The numerical values of the electrophilicity index obtained from our calculations for gases CH4, CO, CO2, H2O, NO, NO2, and SO2 are 0.3206, 1.1661, 1.5062, 0.4627, 2.4185, 2.1288, 4.1246 eV, respectively. Since the ω is a measure of energy stabilization of acquiring additional electronic charge, in other words, electron affinity, higher ω values will indicate a better electron acceptor. Based on the ω values of the gases, it is evident that SO2 could act as an electron acceptor, while the other gas molecules could either act as an electron acceptor or donor, depending on the nature of the metallic cluster. This can explain that SO2 has the highest preference to adsorb on the Ag and Au clusters because it can efficiently accept electronic charges from the metallic clusters.
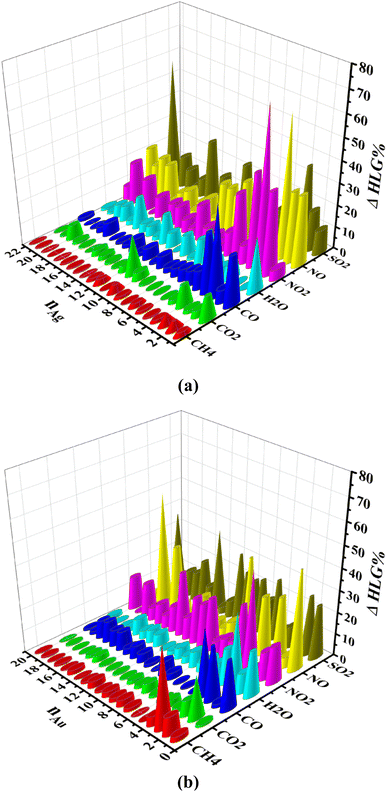 | ||
| Fig. 7 HOMO–LUMO gap changes (ΔHLG%) for (a) the gas/Agn (n = 1–22) and (b) the gas/Aun (n = 1–20) systems, determined by computations performed at the M06-2X/SDD level of theory. | ||
Comparing the HLG of the adsorbent (i.e., the atomic clusters) before and after the adsorption process is an important step for understanding their behavior and, consequently, how they can be employed in different nanomaterials. Sensing nanomaterials, for example, rely on surface interactions with the target gases, inducing a change in their properties (e.g., electrical or optical) that can be probed and used to indicate gas detection and/or evaluation of their concentration. Considering the significant changes in the energy gap of the clusters, especially upon the adsorption of NO2 and SO2 onto their surface, one can conclude that silver metal clusters can be used as an excellent adsorbent to identify these gases. Strong adsorption, however, can indicate slow desorption, which may now be ideal when designing materials for sensors as that leads to long recovery times. Fine-tuning the size of the clusters that will provide strong enough adsorption sites of gaseous species, thus increasing their selectivity, yet weak enough to easily desorb so that the sensing materials can recover their pristine properties fast is a task that needs further investigation and optimization using the calculations provided in this work.
3.4. NBO analysis
The natural bond orbital (NBO) analysis, developed by Weinhold et al.,69 is a model that can provide information on the electron distribution within the intermolecular bonds between atomic species and insights into the feasibility of charge transfer in the studied systems. NBO analysis provides adequate knowledge of the bonding orbital type, occupancy level, and also the nature of interactions present in the valence space between the virtual and occupied Lewis orbitals.70,71 We should note here that a loss of electron occupancy from localized filled Lewis NBO into an empty anti-bonding non-Lewis orbital occurs as a result of the intermolecular interaction,72 which is particularly important to determine for systems like the ones investigated here.The results of natural charges and natural electron configuration for all gas/Ag16 systems are reported in Table S12 in ESI-1.† Considering the high number of systems investigated in this work, here we limit the NBO analysis to only the Ag16 cluster, which appears to have the highest adsorption energy compared to the others. Another reason for using the Ag16 cluster is that it is almost halfway in the size range of the studied structures and has very favorable adsorption energy and stability. From the data obtained from NBO computations, it is possible to examine the charge transfer between gas atoms and silver cluster atoms during the adsorption process. From the valence shell electron configurations of gases in the isolated state and after the interaction with the silver cluster, it is obvious that there is a significant difference in the distribution of electrons for NO, NO2, and SO2. This difference is most significant for the SO2, where p-orbitals of both O and S atoms gain electrons originating from the silver clusters. The valence electron configuration for oxygen atoms is 2s (1.90) 2p (4.78), and for sulfur is 3s (1.70) 3p (2.87) 4s (0.03) 4p (0.02) in the isolated SO2 gas molecule. However, after interaction with the Ag16 cluster, these configurations change to 2s (1.85) 2p (5.27) 3p (0.01) for oxygen, and 3s (1.73) 3p (3.52) 4p (0.02) for sulfur. These results show that the electron cloud around the overlying gases is significantly altered during adsorption, and one can use these changes to the advantage of designing a suitable material for different applications.
3.5. QTAIM analysis
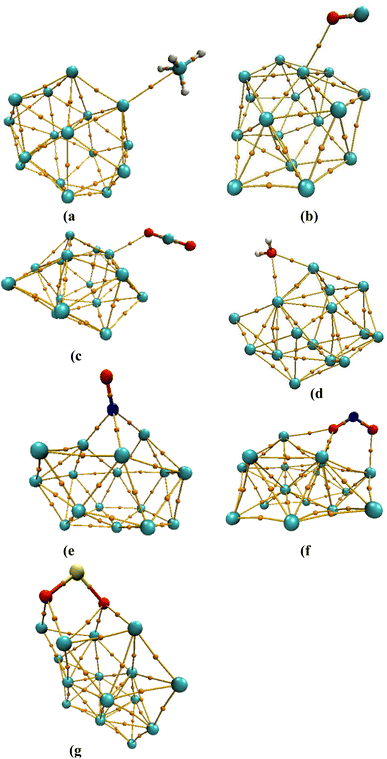
We should note here that one should use all the criteria described above with caution as they may not always give an accurate interpretation. Regarding the electron density energy, it is typically assumed that if the obtained value is negative, the bond is denoted as covalent, whereas if it is positive, they are denoted as non-covalent. Our calculations suggest that despite our analysis implies non-covalent interactions, in some cases, negative values of H(r) are observed.73 This indicates that this criterion is not always accurate for the systems studied here.Moreover, the ratio of the potential electron density over the Lagrangian kinetic energy, V(r)/G(r), can be used as a criterion to identify the type of atom/atom interactions.73 If the obtained value is less than zero, the type of interaction is closed-shell interaction (V(r)/G(r) < 0),74 whereas if the value is greater than 1 but less than 2, it indicates intermediate interactions (1 < V(r)/G(r) < 2). Last, if V(r)/G(r) > 2, the interaction is of covalent bond type. During the QTAIM analysis, it has been determined that the intermolecular interactions between each of the gases we investigated and Ag16 are through closed-shell interactions, and a strong covalent bond cannot be established between them (Fig. 8).
Another parameter to establish the nature of the interaction is the bond ellipticity, ε = [(λ1(r)/λ2(r)) − 1].75 The higher the deviation of the value of bond ellipticity from zero, the more asymmetric the electron density distribution in the plane perpendicular to the bond is at the bond critical point. This quantity does not show the strength of the bond but provides information on the curvature of the electron density at the desired bond critical point relative to the plane perpendicular to the bond. Another quantity known as the eta index, η = |λ1(r)|/λ3(r), can also be used to provide information on the closed-shell nature of the bond. If the numerical value of this quantity is less than unity, the type of interaction is that of a closed shell, and if it is greater than unity, it is a covalent bond.76 For the systems studied here, the eta index also confirms our previous findings, i.e., for all the studied gases and their interaction with cluster Ag16, the values obtained are all less than unity, suggesting the presence of core–shell interactions (Table 1).
| System | Bond | ρ(r) | ∇2 ρ(r) | G(r) | V(r) | H(r) | V(r)/G(r) | λ1 | λ2 | λ3 | ε | η |
|---|---|---|---|---|---|---|---|---|---|---|---|---|
| CH4/Ag16 | C⋯Ag | 0.0123 | 0.0432 | 0.0103 | −0.0097 | 0.0005 | −0.9472 | 0.0552 | −0.0064 | −0.0056 | 0.1421 | 0.1163 |
| CO/Ag16 | O⋯Ag | 0.0167 | 0.0834 | 0.0185 | −0.0161 | 0.0024 | −0.8725 | 0.1115 | −0.0140 | −0.0141 | 0.0077 | 0.1265 |
| CO2/Ag16 | O⋯Ag | 0.0199 | 0.0931 | 0.0216 | −0.0199 | 0.0017 | −0.9221 | −0.0168 | 0.1277 | −0.0178 | 0.0571 | 0.1393 |
| H2O/Ag16 | O⋯Ag | 0.0322 | 0.1630 | 0.0398 | −0.0389 | 0.0009 | −0.9764 | 0.2251 | −0.0294 | −0.0326 | 0.1079 | 0.1449 |
| O⋯Ag | 0.0207 | 0.0885 | 0.0211 | −0.0201 | 0.0010 | −0.9520 | −0.0156 | 0.1217 | −0.0176 | 0.1303 | 0.1448 | |
| NO/Ag16 | N⋯Ag | 0.0399 | 0.1593 | 0.0429 | −0.0459 | −0.0031 | −1.0713 | −0.0357 | −0.0383 | 0.2333 | 0.0707 | 0.1640 |
| N⋯Ag | 0.0502 | 0.2149 | 0.0589 | −0.0642 | −0.0052 | −1.0884 | 0.3162 | −0.0493 | −0.0519 | 0.0536 | 0.1642 | |
| N⋯Ag | 0.0431 | 0.1708 | 0.0467 | −0.0506 | −0.0040 | −1.0852 | −0.0428 | 0.2534 | −0.0398 | 0.0764 | 0.1691 | |
| NO2/Ag16 | O⋯Ag | 0.0343 | 0.1668 | 0.0413 | −0.0408 | 0.0004 | −0.9891 | −0.0334 | −0.0312 | 0.2314 | 0.0700 | 0.1442 |
| O⋯Ag | 0.0446 | 0.2283 | 0.0575 | −0.0578 | −0.0004 | −1.0066 | −0.0492 | −0.0467 | 0.3242 | 0.0515 | 0.1516 | |
| O⋯Ag | 0.0151 | 0.0635 | 0.0144 | −0.0129 | 0.0015 | −0.8987 | 0.0815 | −0.0092 | −0.0088 | 0.0517 | 0.1132 | |
| O⋯Ag | 0.0342 | 0.1642 | 0.0407 | −0.0403 | 0.0004 | −0.9909 | −0.0331 | −0.0306 | 0.2279 | 0.0799 | 0.1452 | |
| SO2/Ag16 | O⋯Ag | 0.0626 | 0.3224 | 0.0859 | −0.0912 | −0.0053 | −1.0615 | −0.0685 | 0.4634 | −0.0726 | 0.0591 | 0.1566 |
| O⋯Ag | 0.0607 | 0.3148 | 0.0832 | −0.0878 | −0.0046 | −1.0547 | −0.0693 | 0.4501 | −0.0661 | 0.0484 | 0.1539 | |
| O⋯Ag | 0.0575 | 0.2953 | 0.0777 | −0.0816 | −0.0039 | −1.0503 | 0.4214 | −0.0648 | −0.0613 | 0.0576 | 0.1538 | |
| O⋯Ag | 0.0147 | 0.0470 | 0.0115 | −0.0113 | 0.0002 | −0.9828 | −0.0086 | −0.0045 | 0.0601 | 0.9299 | 0.1433 | |
| O⋯Ag | 0.0601 | 0.3152 | 0.0832 | −0.0876 | −0.0044 | −1.0526 | −0.0688 | 0.4495 | −0.0655 | 0.0498 | 0.1530 |
4. Conclusion
The DFT method at the M06-2X/SDD level of theory was used to determine the energy of surface adsorption of common air pollutants, including CH4, CO, CO2, NO, NO2, and SO2, as well as H2O onto the surface of silver Agn (n = 1–22) and gold Aun (n = 1–20) atomic metal clusters. The PNO-LCCSD-F12/SDD level of theory was also applied to the structures obtained from the DFT optimization process to more accurately determine the adsorption energies for a cluster containing up to 12 atoms. Our results show that the adsorption energies determined by the two methods are in good qualitative agreement. The calculated adsorption energies indicate that among the different gases, NO2 and SO2 strongly interact with both silver and gold clusters and that the range of their adsorption energy is near to the single covalent bond, suggesting the gases chemisorb on the cluster.Among the different clusters studied, Ag16 exhibits the strongest interaction with the aforementioned gases, and therefore this cluster was chosen for further wave function analyses. The HOMO–LUMO energy gap analysis shows that the energy gap of the isolated clusters decreases with increasing the number of atoms they consist of. The significant difference in the energy gap of gas/clusters systems in comparison to the isolated clusters resulting from the adsorption of the gases is considerable and can, in principle, enable desired properties in the materials they can be employed in depending on the application. The results of wave function analyses such as NBO and QTAIM suggest that the interaction of two gases, NO2 and SO2, with cluster Ag16 is very strong, making it ideal for enhancing adsorption-based selectivity in materials designed for specific applications.
Conflicts of interest
The authors declare no conflicts of interest.Acknowledgements
The authors acknowledge the financial support of the Republic of Cyprus through the Research and Innovation Foundation projects NANO2LAB (INFRASTRUCTURES/1216/0070), DIVINE (PRE_SEED/0719(B)/0298) and ML-NANOCAT (CODEVELOP-GT/0322/0093). This research was also supported by the EMME-CARE project which has received funding from the European Union’s Horizon 2020 Research and Innovation Program, under Grant Agreement No. 856612, as well as matching co-funding by the Government of the Republic of Cyprus. N. P. and V. H. acknowledge funding from the European Union's Horizon 2020 research and innovation program SimEA (Grant Agreement No. 810660). The authors thank the AMD EPYC High-Performance Computing Facility of The Cyprus Institute for its computational resources.References
- Z. Xu, W. Wang, Q. Liu, Z. Li, L. Lei, L. Ren, F. Deng, X. Guo and S. Wu, Environ. Pollut., 2022, 292, 118336 CrossRef CAS PubMed.
- A. Fitriyah, D. A. Nikolenko, W. K. Abdelbasset, M. S. Maashi, A. T. Jalil, G. Yasin, M. M. Abdulkadhm, G. Samieva, H. A. Lafta and A. M. Abed, Chemosphere, 2022, 301, 134698 CrossRef CAS PubMed.
- X. Hou, J. Wang, B. Mousavi, N. Klomkliang and S. Chaemchuen, Dalton Trans., 2022, 51, 8133–8159 RSC.
- X. Zhang, J. Maddock, T. M. Nenoff, M. A. Denecke, S. Yang and M. Schröder, Chem. Soc. Rev., 2022, 3243–3262 RSC.
- N. Isaac, I. Pikaar and G. Biskos, Microchim. Acta, 2022, 189, 196 CrossRef CAS PubMed.
- M. Doust Mohammadi, H. Y. Abdullah, S. Bhowmick and G. Biskos, Silicon, 2022, 1–10 Search PubMed.
- M. D. Mohammadi, F. Abbas, H. Louis, G. E. Mathias and T. O. Unimuke, Comput. Theor. Chem., 2022, 113826 CrossRef CAS.
- M. D. Mohammadi, H. Y. Abdullah, S. Bhowmick and G. Biskos, Comput. Theor. Chem., 2021, 1198, 113168 CrossRef CAS.
- M. D. Mohammadi, H. Y. Abdullah, S. Bhowmick and G. Biskos, Can. J. Chem., 2021, 99, 733–741 CrossRef CAS.
- M. D. Mohammadi, H. Y. Abdullah, G. Biskos and S. Bhowmick, Bull. Mater. Sci., 2021, 44, 1–11 CrossRef.
- M. D. Mohammadi, H. Y. Abdullah, G. Biskos and S. Bhowmick, C. R. Chim., 2021, 24, 291–304 CrossRef.
- P. Solomon, P. H. Leiderman, J. Mendelson and D. Wexler, Am. J. Psychiatry, 1957, 114, 357–363 CrossRef CAS PubMed.
- H. Liu, F. Wang, K. Hu, T. Li and Y. Yan, Appl. Surf. Sci., 2022, 590, 153122 CrossRef CAS.
- A. M. Eyvaraghi, E. Mohammadi, N. Manavizadeh, E. Nadimi, L. Ma'mani, F. Broumand and M. A. Zeidabadi, Thin Solid Films, 2022, 741, 139014 CrossRef CAS.
- J. Wang, G. Wang and J. Zhao, Phys. Rev. A, 2003, 68, 013201 CrossRef.
- M. Manoli, R. D. Johnstone, S. Parsons, M. Murrie, M. Affronte, M. Evangelisti and E. K. Brechin, Angew. Chem., Int. Ed., 2007, 46, 4456–4460 CrossRef CAS PubMed.
- M. F. Fellah, Fuel Process. Technol., 2016, 144, 191–196 CrossRef CAS.
- J. Chen, Q. Zhou, L. Jia, X. Cui and W. Zeng, Appl. Surf. Sci., 2022, 597, 153693 CrossRef CAS.
- N. Patsalidis, G. Papamokos, G. Floudas and V. Harmandaris, J. Phys. Chem. C, 2022, 126, 16792–16803 CrossRef CAS.
- M. Harb, F. Rabilloud, D. Simon, A. Rydlo, S. Lecoultre, F. Conus, V. Rodrigues and C. Félix, J. Chem. Phys., 2008, 129, 194108 CrossRef CAS PubMed.
- K. Duanmu and D. G. Truhlar, J. Phys. Chem. C, 2015, 119, 9617–9626 CrossRef CAS.
- M. Chen, J. E. Dyer, K. Li and D. A. Dixon, J. Phys. Chem. A, 2013, 117, 8298–8313 CrossRef CAS PubMed.
- M. L. McKee and A. Samokhvalov, J. Phys. Chem. A, 2017, 121, 5018–5028 CrossRef CAS PubMed.
- M. L. Tiago, J. C. Idrobo, S. Öğüt, J. Jellinek and J. R. Chelikowsky, Phys. Rev. B: Condens. Matter Mater. Phys., 2009, 79, 155419 CrossRef.
- X. Yang, W. Cai and X. Shao, J. Phys. Chem. A, 2007, 111, 5048–5056 CrossRef CAS PubMed.
- S. Bulusu and X. C. Zeng, J. Chem. Phys., 2006, 125, 154303 CrossRef PubMed.
- B. Assadollahzadeh and P. Schwerdtfeger, J. Chem. Phys., 2009, 131, 064306 CrossRef PubMed.
- P. Schwerdtfeger, Heteroat. Chem., 2002, 13, 578–584 CrossRef CAS.
- Z. Sadowski, Silver Nanopart., 2010, 22, 257–277 Search PubMed.
- W. Qin, J. Lohrman and S. Ren, Angew. Chem., 2014, 126, 7444–7447 CrossRef.
- X. Wu, S. Chen, Y. Sun and Y. Chen, Comput. Theor. Chem., 2012, 1002, 43–48 CrossRef CAS.
- J. Zhou, Z.-H. Li, W.-N. Wang and K.-N. Fan, J. Phys. Chem. A, 2006, 110, 7167–7172 CrossRef CAS PubMed.
- S. Zhao, Z.-H. Li, W.-N. Wang and K.-N. Fan, J. Chem. Phys., 2005, 122, 144701 CrossRef PubMed.
- A. C. Reber, G. U. Gamboa and S. N. Khanna, 2013.
- W. Huang, S. Bulusu, R. Pal, X. C. Zeng and L.-S. Wang, J. Chem. Phys., 2009, 131, 234305 CrossRef PubMed.
- H. Y. Seuret-Hernández, A. Gamboa-Suaréz and C. Morera-Boado, J. Mol. Graphics Modell., 2022, 115, 108234 CrossRef PubMed.
- I. G. Ross, Trans. Faraday Soc., 1952, 48, 973–991 RSC.
- Z. Shuai, D. Beljonne and J. Brédas, J. Chem. Phys., 1992, 97, 1132–1137 CrossRef CAS.
- R. J. Buenker, S. D. Peyerimhoff and W. Butscher, Mol. Phys., 1978, 35, 771–791 CrossRef CAS.
- B. O. Roos, P. R. Taylor and P. E. Sigbahn, Chem. Phys., 1980, 48, 157–173 CrossRef CAS.
- M. Walker, A. J. Harvey, A. Sen and C. E. Dessent, J. Phys. Chem. A, 2013, 117, 12590–12600 CrossRef CAS PubMed.
- Y. Zhao and D. G. Truhlar, Theor. Chem. Acc., 2008, 120, 215–241 Search PubMed.
- J. P. Perdew, Phys. Lett. A, 1992, 165, 79–82 CrossRef CAS.
- E. G. Hohenstein, S. T. Chill and C. D. Sherrill, J. Chem. Theory Comput., 2008, 4, 1996–2000 CrossRef CAS PubMed.
- S. Grimme, J. Antony, S. Ehrlich and H. Krieg, J. Chem. Phys., 2010, 132, 154104 CrossRef PubMed.
- S. Ehrlich, J. Moellmann, W. Reckien, T. Bredow and S. Grimme, ChemPhysChem, 2011, 12, 3414–3420 CrossRef CAS PubMed.
- S. Grimme, S. Ehrlich and L. Goerigk, J. Comput. Chem., 2011, 32, 1456–1465 CrossRef CAS PubMed.
- M. Dolg, U. Wedig, H. Stoll and H. Preuss, J. Chem. Phys., 1987, 86, 866–872 CrossRef CAS.
- D. Andrae, U. Haeussermann, M. Dolg, H. Stoll and H. Preuss, Theor. Chim. Acta, 1990, 77, 123–141 CrossRef CAS.
- L. E. Roy, P. J. Hay and R. L. Martin, J. Chem. Theory Comput., 2008, 4, 1029–1031 CrossRef CAS PubMed.
- Q. Ma, M. Schwilk, C. Köppl and H.-J. Werner, J. Chem. Theory Comput., 2017, 13, 4871–4896 CrossRef CAS PubMed.
- M. J. Frisch, G. W. Trucks, H. B. Schlegel, G. E. Scuseria, M. A. Robb, J. R. Cheeseman, G. Scalmani, V. Barone, G. A. Petersson, H. Nakatsuji, X. Li, M. Caricato, A. V. Marenich, J. Bloino, B. G. Janesko, R. Gomperts, B. Mennucci, H. P. Hratchian, J. V. Ortiz, A. F. Izmaylov, J. L. Sonnenberg, D. Williams-Young, F. Ding, F. Lipparini, F. Egidi, J. Goings, B. Peng, A. Petrone, T. Henderson, D. Ranasinghe, V. G. Zakrzewski, J. Gao, N. Rega, G. Zheng, W. Liang, M. Hada, M. Ehara, K. Toyota, R. Fukuda, J. Hasegawa, M. Ishida, T. Nakajima, Y. Honda, O. Kitao, H. Nakai, T. Vreven, K. Throssell, J. A. Montgomery Jr, J. E. Peralta, F. Ogliaro, M. J. Bearpark, J. J. Heyd, E. N. Brothers, K. N. Kudin, V. N. Staroverov, T. A. Keith, R. Kobayashi, J. Normand, K. Raghavachari, A. P. Rendell, J. C. Burant, S. S. Iyengar, J. Tomasi, M. Cossi, J. M. Millam, M. Klene, C. Adamo, R. Cammi, J. W. Ochterski, R. L. Martin, K. Morokuma, O. Farkas, J. B. Foresman and D. J. Fox, Gaussian 16, Revision C.01, Gaussian Inc., Wallingford CT, 2016 Search PubMed.
- H.-J. Werner, P. J. Knowles, F. R. Manby, J. A. Black, K. Doll, A. Heßelmann, D. Kats, A. Köhn, T. Korona and D. A. Kreplin, J. Chem. Phys., 2020, 152, 144107 CrossRef CAS PubMed.
- J. Zhang and M. Dolg, Phys. Chem. Chem. Phys., 2015, 17, 24173–24181 RSC.
- J. Zhang and M. Dolg, Phys. Chem. Chem. Phys., 2016, 18, 3003–3010 RSC.
- D. Karaboga, Scholarpedia, 2010, 5, 6915 CrossRef.
- C. Bannwarth, E. Caldeweyher, S. Ehlert, A. Hansen, P. Pracht, J. Seibert, S. Spicher and S. Grimme, Wiley Interdiscip. Rev.: Comput. Mol. Sci., 2021, 11, e1493 CAS.
- T. Lu and F. Chen, J. Comput. Chem., 2012, 33, 580–592 CrossRef CAS PubMed.
- P. V. Nhat, N. T. Si, J. Leszczynski and M. T. Nguyen, Chem. Phys., 2017, 493, 140–148 CrossRef CAS.
- A. K. Rappé, C. J. Casewit, K. Colwell, W. A. Goddard III and W. M. Skiff, J. Am. Chem. Soc., 1992, 114, 10024–10035 CrossRef.
- C. Bannwarth, S. Ehlert and S. Grimme, J. Chem. Theory Comput., 2019, 15, 1652–1671 CrossRef CAS PubMed.
- T. Lu and Q. Chen, Conceptual Density Functional Theory: Towards a New Chemical Reactivity Theory, 2022, vol. 2, pp. 631–647 Search PubMed.
- R. Fu, T. Lu and F.-W. Chen, Acta Phys.-Chim. Sin., 2014, 30, 628–639 CAS.
- S. Liu, C. Rong and T. Lu, J. Phys. Chem. A, 2014, 118, 3698–3704 CrossRef CAS PubMed.
- B. Wang, C. Rong, P. K. Chattaraj and S. Liu, Theor. Chem. Acc., 2019, 138, 1–9 Search PubMed.
- R. G. Parr and W. Yang, J. Am. Chem. Soc., 1984, 106, 4049–4050 CrossRef CAS.
- C. Morell, A. Grand and A. Toro-Labbé, J. Phys. Chem. A, 2005, 109, 205–212 CrossRef CAS PubMed.
- M. Levy, J. P. Perdew and V. Sahni, Phys. Rev. A, 1984, 30, 2745 CrossRef.
- E. D. Glendening, C. R. Landis and F. Weinhold, Wiley Interdiscip. Rev.: Comput. Mol. Sci., 2012, 2, 1–42 CAS.
- W. Emori, G. J. Ogunwale, H. Louis, E. C. Agwamba, K. Wei, T. O. Unimuke, C. Cheng, E. U. Ejiofor, F. C. Asogwa and A. S. Adeyinka, Spectroscopic (UV-vis, FT-IR, FT-Raman, and NMR) analysis, structural benchmarking, molecular properties, and the in-silico cerebral anti-ischemic activity of 2 amino-6-ethoxybenzothiazole, J. Mol. Struct., 2022, 133318 CrossRef CAS.
- U. J. Undiandeye, H. Louis, T. E. Gber, T. C. Egemonye, E. C. Agwamba, I. A. Undiandeye, A. S. Adeyinka and B. I. Ita, J. Indian Chem. Soc., 2022, 100500 CrossRef CAS.
- A. D. Udoikono, H. Louis, E. A. Eno, E. C. Agwamba, T. O. Unimuke, A. T. Igbalagh, H. O. Edet, J. O. Odey and A. S. Adeyinka, J. Photochem. Photobiol., 2022, 10, 100116 CrossRef.
- E. Espinosa, I. Alkorta, J. Elguero and E. Molins, J. Chem. Phys., 2002, 117, 5529–5542 CrossRef CAS.
- P. Pyykkö, Chem. Rev., 1997, 97, 597–636 CrossRef PubMed.
- R. Bader, T. Slee, D. Cremer and E. Kraka, J. Am. Chem. Soc., 1983, 105, 5061–5068 CrossRef CAS.
- N. J. M. Amezaga, S. C. Pamies, N. M. Peruchena and G. L. Sosa, J. Phys. Chem. A, 2010, 114, 552–562 CrossRef PubMed.
Footnote |
| † Electronic supplementary information (ESI) available. See DOI: https://doi.org/10.1039/d3ra01717f |
| This journal is © The Royal Society of Chemistry 2023 |

