 Open Access Article
Creative Commons Attribution 3.0 Unported Licence
A CaCuSi4O10/GCE electrochemical sensor for detection of norfloxacin in pharmaceutical formulations†
Gregarious Muungani and
Werner E. van Zyl
 *
*
School of Chemistry and Physics, University of KwaZulu-Natal, Westville Campus, Durban, 4000, South Africa. E-mail: vanzylw@ukzn.ac.za; Tel: +27 31 260 3199
First published on 25th April 2023
Abstract
This study reports on a calcium copper tetrasilicate (CaCuSi4O10)/glassy carbon electrode (GCE) electrochemical sensor developed for rapid sensing and quantification of an antibacterial drug, norfloxacin, using both cyclic voltammetry and differential pulse voltammetry. The sensor was fabricated by modifying a glassy carbon electrode with the CaCuSi4O10. Electrochemical impedance spectroscopy was performed and the Nyquist plot showed that the CaCuSi4O10/GCE had a lower charge transfer resistance of 22.1 Ω cm2 compared to the GCE with a charge transfer resistance of 43.5 Ω cm2. Differential pulse voltammetry showed that the optimum pH for the electrochemical detection of norfloxacin in potassium phosphate buffer solution (PBS) electrolyte was pH 4.5 and an irreversible oxidative peak was found at 1.067 V. Two linear ranges were established at 0.01 to 0.55 μM and 0.55 μM to 82.1 μM, and the limit of detection was ca. 0.0046 μM. We further demonstrated that the electrochemical oxidation was controlled by both diffusion and adsorption processes. The sensor was investigated in the presence of interferents and was found to be selective toward norfloxacin. The pharmaceutical drug analysis was done to establish method reliability and a significantly low standard deviation of 2.3% was achieved. The results suggest that the sensor can be applied in the detection of norfloxacin.
1 Introduction
Norfloxacin (NFX), 1-ethyl-6-fluoro-1,4-dihydro-4-oxo-7-(1-piperazinyl)-3-quinolone carboxylic acid, is a synthetic fluoroquinolone1 that is active against Gram-positive and Gram-negative bacteria and is widely used to treat both urinary and respiratory tract infections.2,3 The drug is used to treat both human and veterinary infections and it acts by inhibiting the synthesis of bacterial DNA gyrase and bacterial chromosome replication.4 The widespread usage of norfloxacin coupled with the need for clinical and pharmacological studies necessitated the development of sensitive and rapid analytical methods for its quantitative determination.Following the use of norfloxacin, its presence was found in municipal wastewater treatment plants, hospital wastewater, surface, and ground waters at nano and micro levels.5 However, the accumulation of norfloxacin in water results in antibiotic-resistant bacteria, it also has the potential to disrupt the endocrine of aquatic organisms, and reduces the formation of colonies in Scenedesmus quadricauda; thus, becomes vulnerable to zooplankton grazers.6 Furthermore, norfloxacin presence in the environment inhibits the growth of denitrifying bacteria and the activity of its enzymes.7 Hence, there is a need to monitor the presence of norfloxacin in the environment so that appropriate countermeasures aimed at minimising its pollution into the environment can be implemented.
Methods such as liquid chromatography-tandem mass spectrometry (LC-MS),8 fluorescence-spectrophotometry,9 electro-chemiluminescence,10 capillary electrophoresis,11 high-performance liquid chromatography (HPLC)12 and spectrofluorimetry13 were used to analyse for the presence of norfloxacin. However, some of these methods are time-consuming and require laborious sample pre-treatment, large organic solvent consumption, expensive equipment, and advanced technical expertise. In this study, electrochemical techniques were used for the detection of norfloxacin in pharmaceutical formulation. The advantages of electrochemical methods include being simple to operate, relatively cost-effective and sensitive, having a rapid response speed; thus, offering real-time detection.14 This method aims to provide both good sensitivity and a wide linear range in the determination of norfloxacin.
Herein we report on the use of a CaCuSi4O10 modified glassy carbon electrode (CaCuSi4O10/GCE) for electrochemical sensing of norfloxacin. CaCuSi4O10 is a layered clay mineral, a phyllosilicate that naturally exists,15 it is abundant, and can also be synthesized. A phyllosilicate is a layered silicate16 that has a structure made up of ions (or atoms), which are arranged in sets of parallel planes bonded together to form layers.17 The layers may be charge-balanced, i.e. neutral, or may have charge17–20 making redox reactions necessary for electrochemical detection possible. Additionally, the layered silicates have interlayer space available for adsorption21 and these combined attributes as it relates to CaCuSi4O10 in particular can be leveraged for the electrochemical detection of drugs such as norfloxacin. The transition metal oxide MnO2 was added to CaCuSi4O10 to improve electrical conductivity.
2 Experimental section
2.1 Chemicals and materials
Analytical reagents used in this study had a purity ≥98%. Calcium chloride, copper nitrate, tetraethyl orthosilicate (TEOS), ammonium hydroxide solution (25 wt%), ethanol, potassium ferricyanide, potassium ferrocyanide, potassium dihydrogen phosphate, dipotassium hydrogen orthophosphate, norfloxacin were obtained from Merck, Germany. Utin-400 (Cipla, Durban, South Africa) was purchased from a local pharmacy. Monopotassium dihydrogen orthophosphate and dipotassium hydrogen orthophosphate were used in the preparation of 0.1 M phosphate buffer solutions of different pHs for the pH study. Double distilled water was used throughout the experiment.2.2 Instruments
Powder X-ray diffraction (PXRD) analysis was done using an X-ray diffractometer (Bruker AXS D8 Advance, Germany), equipped with a Cu-Kα radiation source (wavelength = 0.154 nm) operating at 40 kV and 40 mA. The XRD pattern was recorded over the angular range 2θ = 5–90° at room temperature. Surface topography and composition of the samples were performed by a Zeiss Ultra Plus Field Emission Gun Scanning Electron Microscope (FEG-SEM) equipped with an energy-dispersive X-ray (EDX) detector (Germany). A JEOL 1010 (Japan) Transmission Electron Microscope (TEM) with a JEOL 2100 (Japan) High-Resolution Transmission Electron Microscope (HRTEM) was used to obtain TEM micrographs. Raman spectra of the samples were done using a DeltaNu Advantage 532 high-performance Raman spectrometer with a resolution ranging from 8–10 cm−1, and a spectral range of 200–3400 cm−1. The spectrometer used a 532 nm solid-state frequency-doubled Nd:YAG laser with a peak power of 200 mW and a 35 μm diameter focused beam. Infra-red spectroscopic analysis was done by a Spectrum 100 infrared spectrometer equipped with a universal diamond crystal attenuated total reflection (ATR) accessory (PerkinElmer, USA) within the wavenumber range 380–4000 cm−1 at a resolution of 4 cm−1. A Hanna Instruments pH meter (Woonsocket RI, USA) with a glass electrode was used to obtain pH measurements.The CHI 660E electrochemical workstation (USA) was used for electrochemical studies. Electrochemical measurements were done using a three-electrode setup comprising a Ag/AgCl electrode (reference electrode), glassy carbon electrode (GCE) (working electrode, diameter 3 mm), and platinum wire (counter electrode). Electrochemical impendence spectroscopy (EIS) measurements were performed at a frequency range of 10![[thin space (1/6-em)]](https://www.rsc.org/images/entities/char_2009.gif) 000 Hz to 1 Hz with 5 mV amplitude. A supporting electrolyte of both 2.5 mM [Fe(CN)6]3− and 2.5 mM [Fe(CN)6]4− in 0.1 M KCl was used. For differential pulse voltammetry (DPV), 50 mV pulse amplitude and 50 ms pulse width were used while varying the step potential (3–8 mV).
000 Hz to 1 Hz with 5 mV amplitude. A supporting electrolyte of both 2.5 mM [Fe(CN)6]3− and 2.5 mM [Fe(CN)6]4− in 0.1 M KCl was used. For differential pulse voltammetry (DPV), 50 mV pulse amplitude and 50 ms pulse width were used while varying the step potential (3–8 mV).
2.3 Synthesis of CaCuSi4O10
CaCuSi4O10 was synthesized in aqueous medium through a one-pot Stöber sol–gel synthesis of silica22 followed by co-precipitation of calcium and copper metal precursors. TEOS and the calcium and copper metal precursors were added according to their mole ratios in CaCuSi4O10, which is 1![[thin space (1/6-em)]](https://www.rsc.org/images/entities/char_2009.gif) :
:![[thin space (1/6-em)]](https://www.rsc.org/images/entities/char_2009.gif) 1
1![[thin space (1/6-em)]](https://www.rsc.org/images/entities/char_2009.gif) :
:![[thin space (1/6-em)]](https://www.rsc.org/images/entities/char_2009.gif) 4 for calcium, copper and silica, respectively. The precipitate was filtered, rinsed three times with double distilled water, dried in an oven for 12 h at 120 °C and heated in muffle furnace at 800 °C for 24 hours.23,24
4 for calcium, copper and silica, respectively. The precipitate was filtered, rinsed three times with double distilled water, dried in an oven for 12 h at 120 °C and heated in muffle furnace at 800 °C for 24 hours.23,24
2.4 Fabrication of the CaCuSi4O10 modified glassy carbon electrode
Initially, the GCE was cleaned with alumina slurry to polish its surface and then rinsed with deionised water to remove any adsorbed alumina particles. Afterward, a 1 mg mL−1 suspension of CaCuSi4O10 with 10 wt% MnO2 (for conductivity) was prepared and 5 μL was drop cast on the surface of the polished and clean GCE. The electrode was exposed to IR radiation from a lamp for ten minutes to obtain initial dryness, which resulted in a CaCuSi4O10/GCE modified electrode. The modified electrode was used for norfloxacin drug sensing electrochemical measurements using a CHI660E electrochemical workstation. Measurements were done in replicates of three and for each run, the GCE was freshly coated with the CaCuSi4O10.2.5 Preparation of pharmaceutical samples
Utin-400 tablet (Cipla) that contained 400 mg norfloxacin was finely ground to powder using a mortar and pestle. The obtained norfloxacin powder was dissolved in distilled water to prepare a suitable stock solution. Differential pulse voltammetry results of the detection of norfloxacin in the presence of pharmaceutical excipients at the CaCuSi4O10/GCE electrochemical sensor were recorded using diluted aliquots within the linear concentration range.2.6 Electrochemical equations
The following equations were used to calculate specific parameters. The Scherrer equation, eqn (1) (ref. 25)
Dhkl = Kλ/(Bhkl![[thin space (1/6-em)]](https://www.rsc.org/images/entities/char_2009.gif) cos cos![[thin space (1/6-em)]](https://www.rsc.org/images/entities/char_2009.gif) θ) θ)
| (1) |
Randles–Ševčík equation, eqn (2),26
| ip = 2.69 × 10⁵n3/2AD1/2Cν1/2 | (2) |
 | (3) |
![[thin space (1/6-em)]](https://www.rsc.org/images/entities/char_2009.gif) 485 coulomb, and D is the diffusion coefficient28
485 coulomb, and D is the diffusion coefficient28
 | (4) |
3 Results and discussion
3.1 Physical characterization
The PXRD diffractograms of the synthesized CaCuSi4O10 sample are shown in Fig. 1 and confirmed the successful synthesis as compared to the American Mineralogist Crystal Structure Database reference standard, AMCSD 0013768. The sharp peaks of the PXRD diffractograms indicate the material is crystalline. As shown on the diffractogram of Egyptian blue and also in agreement with the literature,29 the pattern can be indexed exactly to the (200) and (020) reflections, which provides a zone axis of [001]. The PXRD data for Egyptian blue also shows basal cleavage along the (001) plane and preferred orientation along the (001) series, which suggested a stacked alignment of such anisotropic particles when drop-cast onto a substrate.30 The X-ray diffraction (XRD) pattern of the Egyptian blue shows a ditetragonal–dipyramidal structure.29 The CaCuSi4O10 phyllosilicate belongs to the gillespite series and has a structure belonging to the P4/ncc – D84h space group. The maximum diffraction peak showed at 2theta degrees corresponding to 27.04 with a full width at half maximum of 2.88 × 10⁻³ radians. Furthermore, the crystallite size was calculated using the Scherrer equation to obtain 49.46 nm, which reveals that nano-crystallite CaCuSi4O10 was synthesised. Indications were that the synthesised CaCuSi4O10 was a probable electroactive material for the electrochemical detection of norfloxacin deriving from its layered structure, properties and the nano-crystallite sized nature, which size is known to facilitate some reactions that may not be possible at a relatively larger physical size.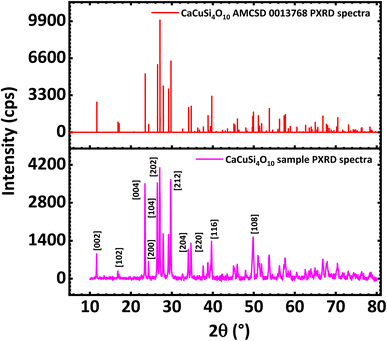 | ||
| Fig. 1 PXRD spectra of CaCuSi4O10 (below) compared against PXRD of CaCuSi4O10 (AMC SD 0013768) standard (above). | ||
The FT-IR spectra are shown in Fig. S1.† Notably, the CaCuSi4O10 sample has intense peaks within the range 980–1055 cm−1 due to the silicon–oxygen stretching vibrations. CaCuSi4O10 has notable bands at 1050, 1000, and 1161 cm−1 that is attributed to antisymmetric Si–O–Si stretching vibrations. The vibration modes in the range 1000–1200 cm−1 resulted from bond stretching of oxygen relative to silicon, which involves both silicon and oxygen displacements.31 Compounds that have tetrahedrally coordinated silicon have a complex absorption band due to Si–O stretching in the range 800–1100 cm−1.32 The degree of polymerization of the SiO44− tetrahedral determines the actual position of this band.33 The 754 cm−1 weak IR bands may be attributed to an OH-vibration mode of crystal water.34 Peaks below 600 cm−1 are mostly attributed to bending vibrations35 and are associated with cation–oxygen bending vibrations.36 Around 450 cm−1 rocking vibrations occur,37 which is one of the types of bending vibration together with the scissoring, wagging, or twisting vibrations.38 The peaks obtained for the sample at 479 cm−1 and 411 cm−1 are in agreement with literature reports.35 Modes A2u and Eu are IR-active and give rise to observed peaks on the IR spectra.
The Raman spectra of CaCuSi4O10 were obtained as shown in Fig. S2.† Intense peaks at 425 cm−1 and 1080 cm−1, were observed. According to lattice dynamics, modes A1g, B1g, B2g and Eg are Raman active and give rise to peaks observed for gillespite and its isostructural minerals such as Egyptian blue.39
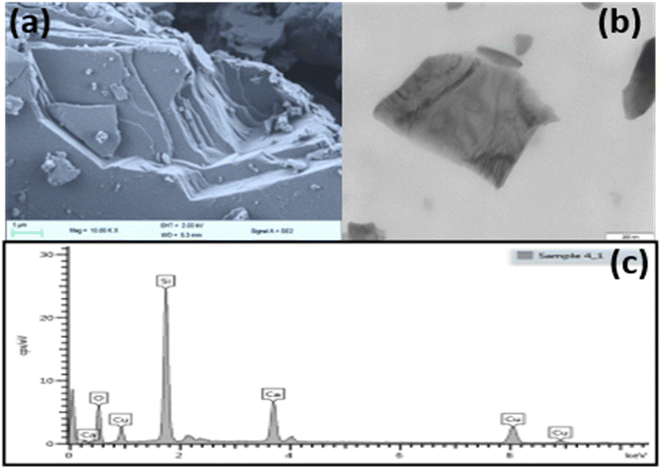
The SEM and TEM analysis was performed on CaCuSi4O10 and pictures are presented in Fig. 2(a) and (b). The SEM images confirmed the layered nature of the phyllosilicates while TEM showed a layer of the CaCuSi4O10. The SEM EDX analysis, Fig. 2(c), illustrated the composition of each of the phyllosilicates. The elements constituting CaCuSi4O10 were determined by matching the energy values of the recorded distinctive peaks of the obtained X-rays with the associated elements and the particular transition involved. Consistent with previous reports, the peaks at 3.690, 8.040, 1.739 and 0.525 keV corresponded to the Kα line of Ca, Cu, Si and O,40 while the peak at 0.930 keV corresponded to the Lα value of Cu.
3.2 Electrochemical characterization of electrodes
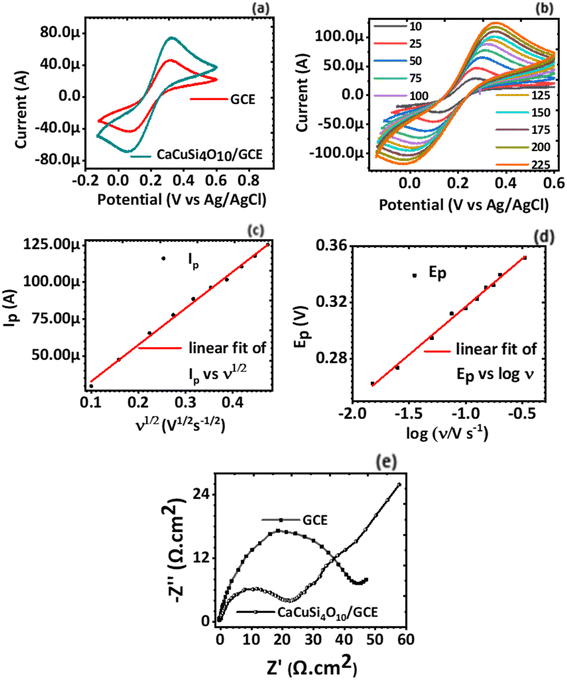
Cyclic voltammetry (CV) was used to establish the electrochemical behaviour, in particular the electron transport properties of the GCE and CaCuSi4O10/GCE using 2.5 mM [Fe(CN)6]3− and 2.5 mM [Fe(CN)6]4− as the redox couple probe. The current response to the voltage potential at a scan rate of 100 mV s−1 was plotted, Fig. 3(a). The cyclic voltammograms for the GCE and CaCuSi4O10/GCE electrodes showed well-defined reduction and oxidation peaks due to [Fe(CN)6]3− and [Fe(CN)6]4−. It was noted that the CaCuSi4O10/GCE modified electrode had a better current response compared to the bare GCE. The better current response for the CaCuSi4O10/GCE modified electrode was established from the scan rate studies, Fig. 3(b), to be a result of higher electrochemical surface area compared to the bare GCE.Scan rate studies were done to find out the effect of the scan rate on the electrode current response of the electrochemical system. Furthermore, the active electrochemical surface areas for both the GCE electrode and the CaCuSi4O10/GCE modified electrodes were deduced using the Randles–Ševčík equation, eqn (2). CVs of the modified GCE electrode in KCl containing 2.5 mM [Fe(CN)6]3− and 2.5 mM [Fe(CN)6]4− solution were obtained at various scan rates ranging from 10 mV s−1 to 200 mV s−1. From the raw data, plots of both ip vs. ν1/2 (Fig. 3(c)) and Ep vs. log![[thin space (1/6-em)]](https://www.rsc.org/images/entities/char_2009.gif) ν (Ep is a voltage corresponding to the peak voltage) (Fig. 3(d)) were also performed. It was noted that the anodic current response of the electrochemical system varies linearly with the square root of the potential scan rate. In particular, as the potential scan rate increased, the current response also increased linearly. The relationship was defined by the equation Ip = 8.2933μA + 246.8568μν1/2, r = +0.9981, which shows a linear relationship.
ν (Ep is a voltage corresponding to the peak voltage) (Fig. 3(d)) were also performed. It was noted that the anodic current response of the electrochemical system varies linearly with the square root of the potential scan rate. In particular, as the potential scan rate increased, the current response also increased linearly. The relationship was defined by the equation Ip = 8.2933μA + 246.8568μν1/2, r = +0.9981, which shows a linear relationship.
The electrochemical surface area of the CaCuSi4O10/GCE modified electrode was calculated from the slope of the ip vs. ν1/2 (Fig. 3(c)) plot and was found to be 0.0463 cm.2 Compared to the electrochemical surface area of the bare GCE (0.0384 cm2), the CaCuSi4O10/GCE modified electrode had a higher surface area. The CaCuSi4O10/GCE modified electrode, therefore, provided a great interfacial area for the electrochemical oxidation of norfloxacin necessary for electrochemical drug sensing.
A plot of Ep vs. log![[thin space (1/6-em)]](https://www.rsc.org/images/entities/char_2009.gif) ν was done from the raw data of the scan rate studies. It was established that the peak potential (Ep) obtained for each scan rate observed a linear relationship with log
ν was done from the raw data of the scan rate studies. It was established that the peak potential (Ep) obtained for each scan rate observed a linear relationship with log![[thin space (1/6-em)]](https://www.rsc.org/images/entities/char_2009.gif) ν as shown in Fig. 3(d). The linear relationship is defined by the equation Ep = 0.38544 + 0.06823
ν as shown in Fig. 3(d). The linear relationship is defined by the equation Ep = 0.38544 + 0.06823![[thin space (1/6-em)]](https://www.rsc.org/images/entities/char_2009.gif) log
log![[thin space (1/6-em)]](https://www.rsc.org/images/entities/char_2009.gif) ν, where the intercept is 0.38544, the slope is 0.06823, and r = +0.99509. There is a linear relationship between Ep and log
ν, where the intercept is 0.38544, the slope is 0.06823, and r = +0.99509. There is a linear relationship between Ep and log![[thin space (1/6-em)]](https://www.rsc.org/images/entities/char_2009.gif) ν and additionally, a Nyquist plot (Fig. 3(e)) was done from the electrochemical impedance spectroscopy (EIS) data. The charge transfer resistance of the CaCuSi4O10/GCE is 22.1 Ω cm2 and that of the GCE is 43.5 Ω cm2. The charge transfer resistance obtained for bare GCE is higher to that obtained for the CaCuSi4O10/GCE electrochemical sensor, suggesting that comparatively diffusion of [Fe(CN)6]3−/[Fe(CN)6]4− to the CaCuSi4O10/GCE is more favourable. Thus, to reduce charge transfer resistance of the GCE, it is was necessary to modify the GCE with CaCuSi4O10. Based on the favorable electrochemical attributes of the CaCuSi4O10/GCE, subsequent reactions were carried out for this modified electrochemical sensor.
ν and additionally, a Nyquist plot (Fig. 3(e)) was done from the electrochemical impedance spectroscopy (EIS) data. The charge transfer resistance of the CaCuSi4O10/GCE is 22.1 Ω cm2 and that of the GCE is 43.5 Ω cm2. The charge transfer resistance obtained for bare GCE is higher to that obtained for the CaCuSi4O10/GCE electrochemical sensor, suggesting that comparatively diffusion of [Fe(CN)6]3−/[Fe(CN)6]4− to the CaCuSi4O10/GCE is more favourable. Thus, to reduce charge transfer resistance of the GCE, it is was necessary to modify the GCE with CaCuSi4O10. Based on the favorable electrochemical attributes of the CaCuSi4O10/GCE, subsequent reactions were carried out for this modified electrochemical sensor.
3.3 Electrochemical sensing of norfloxacin
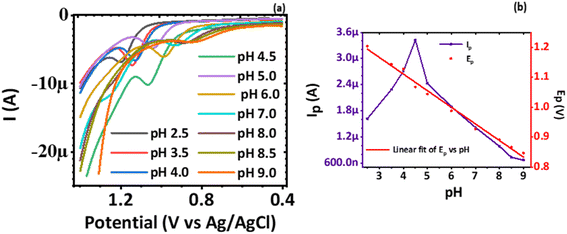
| Ep = 1.33 − 0.05543pH | (5) |
 | (6) |
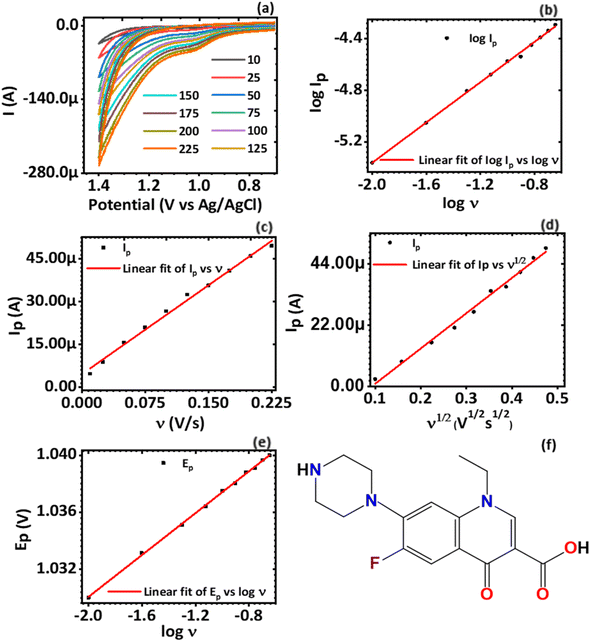
A plot of log![[thin space (1/6-em)]](https://www.rsc.org/images/entities/char_2009.gif) Ip vs. log
Ip vs. log![[thin space (1/6-em)]](https://www.rsc.org/images/entities/char_2009.gif) ν was also done, Fig. 5(b). It was established that log
ν was also done, Fig. 5(b). It was established that log![[thin space (1/6-em)]](https://www.rsc.org/images/entities/char_2009.gif) Ip varied linearly with log
Ip varied linearly with log![[thin space (1/6-em)]](https://www.rsc.org/images/entities/char_2009.gif) ν as defined by the linear regression equation obtained from Fig. 5(b), eqn (7)
ν as defined by the linear regression equation obtained from Fig. 5(b), eqn (7)
log![[thin space (1/6-em)]](https://www.rsc.org/images/entities/char_2009.gif) Ip = −3.7526 + 0.7846 Ip = −3.7526 + 0.7846![[thin space (1/6-em)]](https://www.rsc.org/images/entities/char_2009.gif) log log![[thin space (1/6-em)]](https://www.rsc.org/images/entities/char_2009.gif) ν ν
| (7) |
![[thin space (1/6-em)]](https://www.rsc.org/images/entities/char_2009.gif) Ip showed a positive linear correlation with log
Ip showed a positive linear correlation with log![[thin space (1/6-em)]](https://www.rsc.org/images/entities/char_2009.gif) ν. The value of the slope (0.7846) is between the theoretical values of 0.5, typical for a redox process controlled only by diffusion mass transport, and 1.0, a value that is for redox processes governed by adsorption.44 To establish whether the diffusion or the adsorption process dominated the electron transfer, a plot of peak current (Ip) versus potential scan rate (ν), Fig. 5(c), and also peak current (Ip) versus square-root of potential scan rate (ν1/2), Fig. 5(d), were plotted. It was found that Ip varied linearly with ν according to the linear regression, eqn (8)
ν. The value of the slope (0.7846) is between the theoretical values of 0.5, typical for a redox process controlled only by diffusion mass transport, and 1.0, a value that is for redox processes governed by adsorption.44 To establish whether the diffusion or the adsorption process dominated the electron transfer, a plot of peak current (Ip) versus potential scan rate (ν), Fig. 5(c), and also peak current (Ip) versus square-root of potential scan rate (ν1/2), Fig. 5(d), were plotted. It was found that Ip varied linearly with ν according to the linear regression, eqn (8)| Ip = −4.5737μA + 208.1227μν | (8) |
Similarly, the response of Ip to the ν1/2 had also a linear relationship defined by the linear regression, eqn (9)
 | (9) |
The variation of Ep to the log![[thin space (1/6-em)]](https://www.rsc.org/images/entities/char_2009.gif) ν over a scan rate of (5–200 mV s−1) was plotted, Fig. 5(e). The plot revealed that Epvaried linearly with log
ν over a scan rate of (5–200 mV s−1) was plotted, Fig. 5(e). The plot revealed that Epvaried linearly with log![[thin space (1/6-em)]](https://www.rsc.org/images/entities/char_2009.gif) ν according to the linear regression, eqn (10)
ν according to the linear regression, eqn (10)
Ep = 1.0448 + 0.07354![[thin space (1/6-em)]](https://www.rsc.org/images/entities/char_2009.gif) log log![[thin space (1/6-em)]](https://www.rsc.org/images/entities/char_2009.gif) ν ν
| (10) |
![[thin space (1/6-em)]](https://www.rsc.org/images/entities/char_2009.gif) ν during the oxidation of norfloxacin was investigated according to the classical equation eqn (3), which relates the peak potential for an irreversible electrode process46 to log
ν during the oxidation of norfloxacin was investigated according to the classical equation eqn (3), which relates the peak potential for an irreversible electrode process46 to log![[thin space (1/6-em)]](https://www.rsc.org/images/entities/char_2009.gif) ν. The equation established that Ep varied linearly with log
ν. The equation established that Ep varied linearly with log![[thin space (1/6-em)]](https://www.rsc.org/images/entities/char_2009.gif) ν. The two simultaneous equations, eqn (3) and (10), can be solved to find out αn, which was found to be 0.8. Taking the charge transfer coefficient for irreversible reactions to be from 0.4–0.6,47 it implies two electrons were transferred during the oxidation reaction of norfloxacin at the CaCuSi4O10/GCE modified electrode, and this finding was consistent with previously reported results.48
ν. The two simultaneous equations, eqn (3) and (10), can be solved to find out αn, which was found to be 0.8. Taking the charge transfer coefficient for irreversible reactions to be from 0.4–0.6,47 it implies two electrons were transferred during the oxidation reaction of norfloxacin at the CaCuSi4O10/GCE modified electrode, and this finding was consistent with previously reported results.48
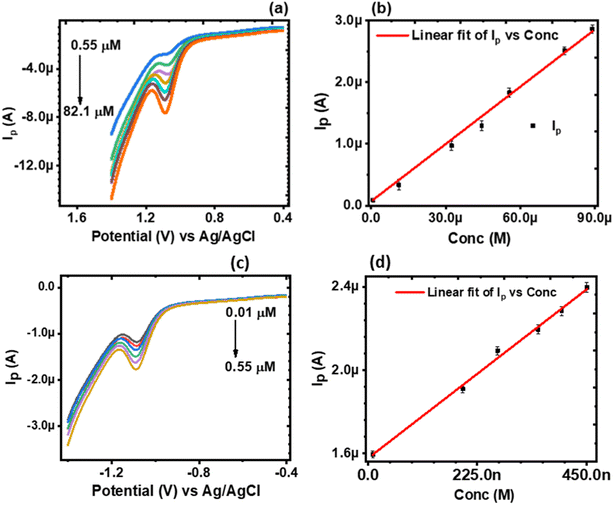
| Ip = −18.20μ + 0.0369C | (11) |
| Ip = −1.60μ + 1.8C | (12) |
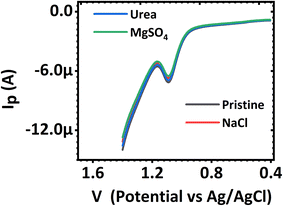
A linear relationship was also observed in the concentration range 0.01 to 0.55 μM, Fig. 6(d). The limit of detection (LOD) and the limit of quantification (LOQ) of norfloxacin at the CaCuSi4O10/GCE was calculated from the relationship 3σ/N and 10σ/N, correspondingly where σ is the standard deviation of the response and N is the number of replicates. The LOD was found to be 0.0046 μM and the LOQ was 0.0153 μM. Norfloxacin concentration in contaminated soil can be as high as 9.8 mg kg−1, and up to 6.8 μg L−1 in urban sewage and surface water,49 which are higher concentrations compared to the LOD obtained using the CaCuSi4O10/GCE electrochemical sensor in this study. The results showed high selectivity of the CaCuSi4O10/GCE modified electrode towards norfloxacin. A comparison of the present work with the performance of other electroanalytical methods for the detection of norfloxacin reported in the literature is made in Table 1. The current reported method has a comparatively lower detection limit and a wider linear concentration range for the detection of norfloxacin.
| Electrode | Technique | Concentration range (μM) | LOD (μM) | Verified applications | Ref. |
|---|---|---|---|---|---|
| MWCNT-CPE/pRGO-ANSAg/Au | DPV | 0.03–1.0 and 1.0–50.0 | 0.016 | Pharmaceutical & plasma | 43 |
| MWCNTs-TOCT/GCE | CV | 0.5–8.0 | 0.1 | Pharmaceutical & urine | 50 |
| CuO/MWCNTs/GCE | DPV | 1.0–47.7 | 0.321 | None | 51 |
| CaCuSi4O10/GCE | DPV | 0.01–0.55 and 0.55–82.1 | 0.0046 | Pharmaceutical | This work |
4 Conclusions
CaCuSi4O10 was successfully synthesized as confirmed by physical methods of characterization. Electrochemical characterization showed that the CaCuSi4O10/GCE had a higher current response than the bare GCE. Compared to the bare GCE, the CaCuSi4O10 had a higher electrochemical surface area and a lower charge transfer resistance. The CaCuSi4O10 was therefore used for the electrochemical sensing of norfloxacin. The CaCuSi4O10/GCE modified electrode showed a wider linear concentration range, 0.01 to 0.55 μM and 0.55 μM to 82.1 μM, and LOD, 0.0046 μM, compared to literature reports. It also exhibited satisfactory selectivity and sensitivity towards norfloxacin in the presence of interferents including matrix in pharmaceutical formulation. It can be concluded that the electrochemical quantification of norfloxacin using the CaCuSi4O10/GCE modified electrode is a viable method since it offers high precision and low detection limits.Author contributions
G. Muungani: conceptualization; data curation; formal analysis; investigation; methodology; writing – original draft. W. E. van Zyl: conceptualization; funding acquisition; project administration; resources; supervision; writing – review & editing.Conflicts of interest
There are no conflicts of interest to declare.Acknowledgements
The authors thank the University of KwaZulu-Natal for financial and infrastructure support and WEVZ acknowledges the research supported by the National Research Foundation (NRF) of South Africa (Grant Number: 132014).References
- D. C. Hooper, J. S. Wolfson, K. S. Souza, C. Tung, G. L. McHugh and M. N. Swartz, Antimicrob. Agents Chemother., 1986, 29, 639–644 CrossRef CAS PubMed.
- J. C. Brocklehurst and S. Brocklehurst, Br. J. Urol., 1978, 50, 102–105 CAS.
- D. A. Leigh, E. C. Smith and J. Marriner, J. Antimicrob. Chemother., 1984, 13, 79–83 CrossRef PubMed.
- K. J. Marians and H. Hiasa, J. Biol. Chem., 1997, 272, 9401–9409 CrossRef CAS PubMed.
- Y. Pan, J. Dong, L. Wan, S. Sun, H. J. MacIsaac, K. G. Drouillard and X. Chang, J. Hazard. Mater., 2020, 385, 121625 CrossRef CAS PubMed.
- S. Muthusaravanan, S. V. Priyadharshini, N. Sivarajasekar, R. Subashini, S. Sivamani, S. Dharaskar and N. Dhakal, Desalin. Water Treat., 2019, 156, 238–244 CrossRef CAS.
- H. Guo, Z. Chen, C. Lu, J. Guo, H. Li, Y. Song, Y. Han and Y. Hou, Bioresour. Technol., 2020, 305, 123073 CrossRef CAS PubMed.
- A. S. Maia, P. Paíga, C. Delerue-Matos, P. M. L. Castro and M. E. Tiritan, Environ. Pollut., 2020, 259, 113927 CrossRef CAS PubMed.
- B. Kaur, R. Kumar, S. Chand, K. Singh and A. K. Malik, Spectrochim. Acta, Part A, 2019, 214, 261–268 CrossRef CAS PubMed.
- M. Liu, L. Guo, Y. Yin, L. Chen, Z. Chen, J. Liu and B. Qiu, Anal. Methods, 2020, 12, 2693–2702 RSC.
- T. He, Z. Xu and J. Ren, Microchem. J., 2019, 146, 1295–1300 CrossRef CAS.
- M. Gamal, H. M. Ali, S. M. Fraihat and T. A. Seaf Elnasr, Luminescence, 2019, 34, 644–650 CrossRef CAS PubMed.
- M. S. El-Hamshary, M. A. Fouad, R. S. Hanafi, H. S. Al-Easa and S. M. El-Moghazy, Spectrochim. Acta, Part A, 2019, 206, 578–587 CrossRef CAS PubMed.
- H. Karimi-Maleh and O. A. Arotiba, J. Colloid Interface Sci., 2020, 560, 208–212 CrossRef CAS PubMed.
- E. Burzo, Phyllosilicates, Springer, Berlin, Heidelberg, 2007, vol. III/2 Search PubMed.
- S. Bailey, A. Alietti, G. Brindley, M. Formosa, K. Jasmund, J. Konta, R. Mackenzie, K. Nagasawa, R. RausellColom and B. Zvyagin, Clay Sci., 1979, 5, 209–220 Search PubMed.
- G. Brown, Philos. Trans. R. Soc., A, 1984, 311, 221–240 CrossRef CAS.
- S. Bailey, A. Alietti, G. Brindley, M. Formosa, K. Jasmund, J. Konta, R. Mackenzie, K. Nagasawa, R. RausellColom and B. Zvyagin, Clay Sci., 1979, 5, 209–220 Search PubMed.
- R. T. Martin, S. W. Bailey, D. D. Eberl, D. S. Fanning, S. Guggenheim, H. Kodama, D. R. Pevear, J. Środoń and F. J. Wicks, Clays Clay Miner., 1991, 39, 333–335 CrossRef CAS.
- M. F. Brigatti, E. Galan and B. K. G. Theng, in Developments in clay science, Elsevier, 2013, vol. 5, pp. 21–81 Search PubMed.
- Surface and interface chemistry of clay materials, ed. R. A. Schoonheydt, C. T. Johnston and F. Bergaya, Elsevier, 1st edn, 2018, pp. 1–21 Search PubMed.
- S. Nandy, D. Kundu and M. K. Naskar, J. Sol-Gel Sci. Technol., 2014, 72, 49–55 CrossRef CAS.
- P. Berdahl, S. K. Boocock, G. C.-Y. Chan, S. S. Chen, R. M. Levinson and M. A. Zalich, J. Appl. Phys., 2018, 123, 193103 CrossRef.
- A. Bloise, S. Abd El Salam, R. De Luca, G. M. Crisci and D. Miriello, Appl. Phys. A, 2016, 122, 650 CrossRef.
- P. Scherrer, Math. Phys., 1918, 2, 98–100 Search PubMed.
- P. Zanello, C. Nervi and F. F. de Biani, Inorganic Electrochemistry, Royal Society of Chemistry, Cambridge, 2007 Search PubMed.
- L. Fotouhi, Z. Atoofi and M. M. Heravi, Talanta, 2013, 103, 194–200 CrossRef CAS PubMed.
- A. J. Bard, L. R. Faulkner, J. Leddy and C. G. Zoski, Electrochemical methods: fundamentals and applications, John Wiley & Sons, New York, 1980, vol. 2 Search PubMed.
- D. Johnson-McDaniel, C. A. Barrett, A. Sharafi and T. T. Salguero, J. Am. Chem. Soc., 2013, 135, 1677–1679 CrossRef CAS PubMed.
- T. T. Salguero, D. Johnson-McDaniel, C. A. Barrett, A. Sharafi, R. Weimar and T. Blevins, MRS Online Proc. Libr. Arch., 2014, 1618, 161–166 CrossRef.
- P. F. McMillan and B. Piriou, Bull. Mineral., 1983, 106, 57–75 CAS.
- B. D. Saksena, Trans. Faraday Soc., 1961, 57, 242–258 RSC.
- R. B. Laughlin and J. D. Joannopoulos, Phys. Rev. B: Solid State, 1978, 17, 4922–4930 CrossRef CAS.
- J. T. Kloprogge, R. D. Schuiling, Z. Ding, L. Hickey, D. Wharton and R. L. Frost, Vib. Spectrosc., 2002, 28, 209–221 CrossRef CAS.
- P. Mirti, L. Appolonia, A. Casoli, R. P. Ferrari, E. Laurenti, A. A. Canesi and G. Chiari, Spectrochim. Acta, Part A, 1995, 51, 437–446 CrossRef.
- S. W. Kiefer, Rev. Geophys. Space Phys., 1979, 17, 20–34 CrossRef CAS.
- I. I. Shaganov, T. S. Perova, R. A. Moore and K. Berwick, J. Mater. Sci.: Mater. Electron., 2001, 12, 351–355 CrossRef CAS.
- J. J. Ojeda and M. Dittrich, Methods Mol. Biol., 2012, 881, 187–211 CrossRef CAS PubMed.
- D. A. McKeown and M. I. Bell, Phys. Chem. Miner., 1998, 25, 273–281 CrossRef CAS.
- J. R. Rumble, T. J. Bruno and M. J. Doa, CRC handbook of chemistry and physics: a ready-reference book of chemical and physical data, CRC Press/Taylor & Francis Group, Boca Raton, 2021 Search PubMed.
- M. J. O'Neil, The Merck Index: An Encyclopedia of Chemicals, Drugs, and Biologicals, Royal Society of Chemistry, Cambridge, 2013 Search PubMed.
- A. M. Y. Jaber and A. Lounici, Analyst, 1994, 119, 2351–2357 RSC.
- Z. Liu, M. Jin, J. Cao, J. Wang, X. Wang, G. Zhou, A. van den Berg and L. Shui, Sens. Actuators, B, 2018, 257, 1065–1075 CrossRef CAS.
- E. Laviron, L. Roullier and C. Degrand, J. Electroanal. Chem. Interfacial Electrochem., 1980, 112, 11–23 CrossRef CAS.
- K. Anuar, W. T. Tan, M. S. Atan, K. Dzulkefly, S. M. Ho, H. M. Jelas and N. Saravanan, Pacific Journal of Science and Technology, 2007, 8, 252–260 Search PubMed.
- E. Laviron, J. Electroanal. Chem., 1979, 101, 19–28 CrossRef CAS.
- M. M. Aleksić, J. Pantić and V. P. Kapetanović, Chem. Technol., 2014, 12, 55–63 Search PubMed.
- B. Agrawal, P. Chandra, R. N. Goyal and Y. B. Shim, Biosens. Bioelectron., 2013, 47, 307–312 CrossRef CAS PubMed.
- F. Wang, J. Gao, W. Zhai, J. Cui, D. Liu, Z. Zhou and P. Wang, Ecotoxicol. Environ. Saf., 2021, 208, 111717 CrossRef CAS PubMed.
- J. Dang, H. Cui, X. Li and J. Zhang, Anal. Sci., 2019, 35, 979–985 CrossRef CAS PubMed.
- M. Devaraj, R. K. Deivasigamani and S. Jeyadevan, Colloids Surf., B, 2013, 102, 554–561 CrossRef CAS PubMed.
Footnote |
| † Electronic supplementary information (ESI) available. See DOI: https://doi.org/10.1039/d3ra01702h |
| This journal is © The Royal Society of Chemistry 2023 |

