 Open Access Article
Comparative investigation of gas sensing performance of liquefied petroleum gas using green reduced graphene oxide-based sensors
Allen Abiodun Olorunkosebia,
Kayode Oladele Olumurewa *b,
Oladepo Fasakina,
Adetayo Victor Adedejic,
Bidini Taleatua,
Bolutife Olofinjanaa and
Marcus Adebola Elerujaa
aDepartment of Physics and Engineering Physics, Obafemi Awolowo University, Ile-Ife, 220282, Nigeria
bDepartment of Physical and Computer Sciences, McPherson University, Seriki Sotayo, 110117, Nigeria. E-mail: kayodeolumurewa@gmail.com
cDepartment of Chemistry and Physics, Elizabeth City University, Elizabeth City, NC, USA
First published on 2nd June 2023
Abstract
Herein, we report the comparative gas sensing performance (at room temperature) of reduced graphene oxide sensors obtained by reducing graphene oxide using extracts of pumpkin leaf, neem leaf and methionine. An interdigitated pattern was designed on soda-lime glass using a stamp method and the dispersed solution of rGO was spin coated on the pattern. The electrical response of the sensors was investigated (using a simple in-house measurement set up) by measuring change in resistance of graphene with varying gas concentration on exposure to liquefied petroleum gas (LPG). From the characterization results using FTIR, SEM, EDX and UV-Visible, methionine reduced graphene oxide (MRGO 12H) indicated a greater degree of reduction compared to pumpkin reduced graphene oxide (PRGO 12H) and neem reduced graphene oxide (NRGO 12H). The LPG sensing results showed an increase in the resistance of the sensor materials upon the introduction of the gas and, an increased sensitivity as the concentration of the test gas increased from 100 ppm to 200 ppm while the MRGO 12H sensor was more selective towards LPG sensing. Furthermore, it was observed that the sensor response for the fabricated sensors is strongly dependent on the concentration of gas exposed to the sensors and the degree of removal of oxygen functional groups in the graphene-based materials. Hence, the MRGO 12H sensor had a sensor response of 23.58% at 200 ppm. PRGO 12H at 100 ppm illustrates the least sensor response while NRGO 12H showed very poor sensor response that ranged between 5.10% and 7.56%. The sensor response of the materials demonstrates an improvement in results obtained for pure rGO based sensors. We obtained a response time as low as 5.3 seconds for MRGO 12H while the recovery time of the sensors ranged between 6.46 seconds and 41.50 seconds. The MRGO 12H sensor typified the best recovery time and thus outperformed results from most of the reported literature. Considering different performance metrics such as sensor response, response time, recovery time and sensing period, MRGO 12H is more selective towards detecting LPG. Our results showed that a greater restoration of the sp2 carbon chain brought about by increased reduction of graphene oxide is largely responsible for the sensing behavior of rGO towards LPG.
1 Introduction
Graphene material and its composites have been generating great attention in the area of research and development. It is becoming one of the most studied materials because of its significant properties and the ability of the material to be processed and manufactured cheaply and easily for large scale production. Graphene, which is a single layer of graphite1,2 has consistently been shown to be a promising material in the electronics industry owing to its extraordinary mechanical, thermal, optical and electronic properties3 that can generate enhanced material performance. In the electronics industry, graphene has not yet successfully replaced semiconductor materials like silicon, but there have been steady improvements thus positioning the material for applications in the fabrication of some devices1,4 while also serving appropriate purposes in applications where silicon is deficient.Sensing of gases in the surrounding is very important to our daily living. Some of the gases that are very harmful to human health are colorless, odorless and flammable. These properties cannot be detected by human sensory organs, hence, there is the need for a special device that can measure or detect the presence of such gases to accelerate safety measures. Gas detection is very important because of the hazards of flammable gas concentrations such as liquefied petroleum gas in domestic area, gas depots and industries, which may lead to explosions and toxic gas-build ups, thereby poisoning the environment. In addition, LPG is utilized as a combustive fuel alongside premium motor spirit (PMS) in certain devices. A device to sense early leakages is required in systems that function on LPG as their combustive fuels.
In recent times, sensors have received great attention by researchers because of ever increasing applications in industry and environmental monitoring especially with the increasing concern in global warming. Sensors, ranging from: thermal sensors,5,6 light sensors7 and gas sensors8,9 have attracted the interests of researchers. Gas waste in urban areas are of great concern due to heavy vehicular movement, emission of carbon monoxide (CO) from industrialization of processed chemicals, pharmaceutical, and food products.10,11 There is the need for proper monitoring to control the ejection of gases into the atmosphere and produce an acceptable quality of air needed for healthy living.
Gas sensors are devices which produce an alteration in conductivity because of exposure to a target gas molecule. The gas sensing operation of graphene sensor device can be ascribed to the adsorption and desorption of gas molecules acting as donors and acceptors of electron on the surface and thereby altering the sensor's conductivity by altering the resistance of graphene.12 Properties such as: ability to operate at room temperature, good sensitivity, sensor response and recovery rate to the target gas are very important indicators needed to measure the efficiency of a sensor.8,13 Most metal oxide sensors are deficient in their ability to function as room temperature sensor. Metal oxide sensors utilize a change in resistivity when the target gas interacts with the surface of the sensor. During the process, the adsorbed gas molecules interact with electrons from the metal oxide resulting in a deficiency of electron. Metal oxide sensors have relatively high energy band gap and thus there is need for high electric field energy for the transition of electrons into the conduction band. This become possible when micro heaters are incorporated into the design thus providing the required activation energy.13 The provision of an embedded micro heater makes this type of sensor unsuitable for flexible and smart sensor applications. However, even though graphene-based sensors operate similarly to metal oxide sensor, they do not require an external heater to activate the band gap of the material during sensing applications. This is because of the low or zero-band gap of graphene and the large and uniform surface area.1
Gas sensors can be classified into chemiresistor, silicon-based field-effect transistor (FET), surface acoustic wave, capacitance sensor, surface work function, optical fiber sensor (OFS), and so on.14 According to literature, chemiresistors are the most widely used in the construction of gas sensors because of their simple structure, convenience to fabricate, room-temperature operation, and relatively low cost.15,16 Graphene and composite material are advantageous for the electrically based sensor because of their structural arrangement which allows for maximum interaction of all atoms so as to obtain a better adsorption of gas molecules.17 In addition, they do not require special circuits to reduce the noise level in the signal because of their high crystal quality and low resistance.18
According to literature studies, graphene-based sensors have been fabricated using different approaches. Dua et al.,19 Fowler et al.,20 Lu et al.21 and Robinson et al.22 obtained gas sensors by reducing graphene oxide. Schedin et al.12 obtained sensors from mechanical exfoliation approach. Pearce et al.23 obtained sensors by epitaxial growth on silicon carbide (SiC) and Joshi et al.24 obtained sensors by chemical vapor deposition (CVD) growth of graphene composites. Mishra et al.25 reported the performance of SnO2 quantum dots decorated on rGO towards sensing of LPG. Their results showed high sensor response at 500 ppm and good selectivity towards LPG. However, the sensors require high operating temperature to function. Anand et al.26 investigated the performance of graphene ZnO thick film sensor in sensing LPG. Their result showed that optimum sensor response was obtained at 150 °C and are more selective in sensing hydrogen gas. Despite the progress recorded in reducing the operating temperature for optimum sensor application, the sensors were obtained by reducing graphene oxide with hydrazine monohydrate which is toxic and may interfere with the gases during sensing at higher concentration. Also, the thick film sensor used comes with drawbacks that may affect sensitivity and durability of the sensors. Furthermore, their result also shows that graphene ZnO sensors have poor sensor response and are not selective in sensing LPG. While a few studies have investigated the performance of graphene-based materials towards sensing of LPG, to the best of our knowledge, no study has reported the performance of rGO-based sensors obtained from green reduction using plant extracts. Obtaining rGO based sensors by reduction using green and environmental approach is beneficial to the environment and cost effective. This further removes the possibility of the contamination of the sensors with chemicals used during reduction27 thus reducing the recovery time of the sensors. Also, for thermally reduced graphene oxide utilized in sensor applications, the high temperature utilized during the reduction process results in irreproducibility of the sensors and longer recovery times.28 In addition, methionine was used to reduced graphene oxide based on the presence of sulfur, hydroxyl and amine reactive species present in it.29 For the first time, we report the sensing of LPG at room temperature using rGO obtained by green reduction and at room temperature and compared with results obtained using methionine.
This study, therefore, focused on the development of a sensitive, selective, low cost and high-quality graphene-based sensor using green reduction methods. Extracts from neem plant, pumpkin leaf and methionine were used to reduced graphene oxide and the obtained reduced graphene oxide were utilized to fabricate sensors for detecting liquefied petroleum gas (LPG) at different concentrations. We then proceeded to determine which of the rGO obtained by green reduction is more selective towards LPG sensing. A simple home grown set up was used to test the sensing performance of the sensors while an interdigitated pattern on the glass substrate was obtained by using stamp method.
2 Experimental method
2.1 Synthesis of graphene oxide (GO)
GOs were synthesized from graphite flakes using: modified Hummers' method (GO-12H), modified Hummers' method without phosphoric acid (GO-NP) and simplified Hummers' method (GO-SIM) as previously reported by Olorunkosebi et al.302.2 Reduction of graphene oxide using methionine
The reduced graphene oxide obtained by reduction using pumpkin leaves and neem extract have been previously reported in our previous study.30 For methionine reduced graphene oxide, the required amount of DL-methionine was put into GO aqueous suspension according to Table 1. The mixture was kept in a sealed glass bottle and stirred continuously for 24 hours at 30 °C. Then, the homogenous solution of methionine reduced graphene oxide (MRGO) was centrifuged at 3000 rpm, and 20 mL NaOH aqueous solution of 0.1 mol L−1 was added into the product to dissolve unreacted methionine. Subsequently, the solution was centrifuged at 10![[thin space (1/6-em)]](https://www.rsc.org/images/entities/char_2009.gif) 000 rpm, and the obtained black slurry was washed with adequate distilled water and ethanol until the pH was 7.0.31 Black MRGO dispersion was obtained and oven-dried at 60 °C.
000 rpm, and the obtained black slurry was washed with adequate distilled water and ethanol until the pH was 7.0.31 Black MRGO dispersion was obtained and oven-dried at 60 °C.
| Sample | Mass of sample (mg) | Distilled water (mL) | DL-Methionine |
|---|---|---|---|
| GO-SIM | 250.00 | 500.00 | 5.00 |
| GO-NP | 250.00 | 500.00 | 4.00 |
| GO-12H | 500.00 | 1000.00 | 10.00 |
2.3 Characterization of samples
The UV-spectra of the samples were run on UV-visible spectrophotometer (SHIMADZU). The UV analysis result gave plots of absorbance against wavelength λ. Results were further analyzed to plot transmittance against wavelength λ, and the absorbance edge of each sample determined. The FTIR analysis of samples were carried out using SHIMADZU FTIR model 8400S spectrophotometer. Results obtained gave plots of percentage of transmittance versus wavenumber per centimeter. Data obtained were further analyzed using Origin Pro8 software to determine the chemical functional groups present in rGO powder. Surface characterization of rGOs were measured using scanning electron microscope (SEM, JEOL JSM-6010 PLUS/LA) while elemental composition was determined from the energy dispersive X-ray spectroscopy (EDX) combined with the scanning electron microscope (SEM).3 Device fabrication
3.1 Fabrication of the stamp
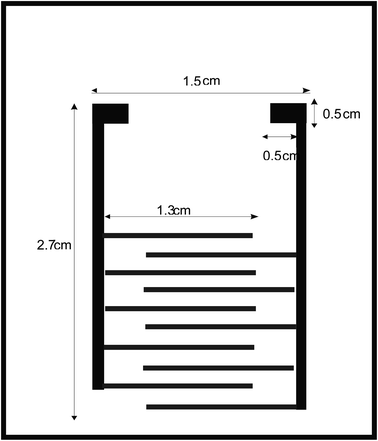
Interdigitated pattern was designed on soda-lime glass using stamp method and the dispersed solution of rGO was spin coated on the pattern. The schematic diagram of dimensions and structure of the electrodes are shown in Fig. 1. The fingers have 2 mm spacing in between them32 after it was printed out on a paper using laser printer, then transferred into a rubber using hot iron in order to carve out a pattern of ordinary stamp.3.2 Stamping of electrode pattern
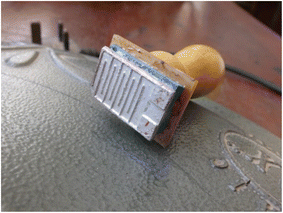
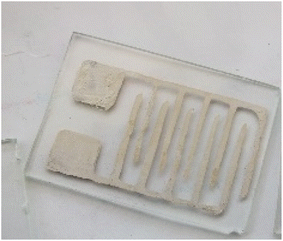
2.0 mL of 57.5 to 59 wt% of properly mixed silver suspension (Pelco colloidal silver liquid) was dropped into a small container that could accommodate the shape of the stamp. The stamp shown in Fig. 2 was gently dipped into the suspension and allowed to spread across all parts of the shape. Then, the stamp was mildly placed on the sterilized glass substrate while the silver paste formed the pattern before lifting. The stamp was then used to make three different patterns on different glass substrate as shown in Fig. 3 before being dipped into the suspension again. The obtained clean pattern was immediately dried in an oven at the temperature of 70 °C for 30 minutes.3.3 Spin coating of samples on the pattern
Gelatinous solutions of methionine reduced graphene oxide (MRGO 12H), neem extract reduced graphene oxide (NRGO 12H) and pumpkin leaf extract reduced graphene oxide (PRGO 12H) were prepared with addition of carboxymethylcellulose (CMC) to act as a binder. Spin coater (Ossilla E441) was used to spin coat sample on glass substrate with interdigitated electrode. The substrate was adapted and secured firmly into substrate chuck of the spin coater and spirit level of the machine was set to balance on the rigid platform. The machine was set to step 01 and operational time of 2 minutes. The speed of 500, 1000 and 1500 rpm for a process, two drops of sample were dropped on the substrate each using a pipette while several trials were used to obtain better uniform coating films. It was further annealed in an oven at 200 °C for 30 min to burn off the binders (CMC) from the sample.3.4 Testing of the device fabricated
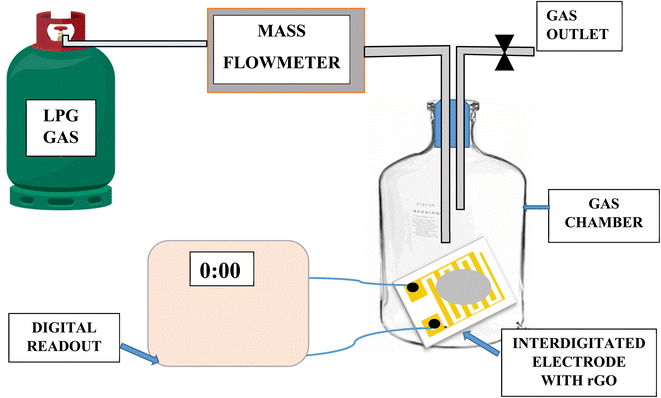
A simple homemade set up was used to measure the gas sensing behavior of LPG. The sensor was first calibrated by utilizing the single point calibration where the sensor was initially exposed to air and the resistance recorded. This was followed by exposing the sensor to a known volume of the target gas. Electrical response of the sensor was investigated by measuring change in resistance of graphene with gas concentration during exposure to liquefied petroleum gas (LPG). 4 kg of liquefied petroleum gas (LPG) was purchased from a gas depot and filled into a gas cylinder. Copper connecting wires of length 30.00 cm and diameter of 0.30 mm were used to extend the sensor from the chamber to digital multimeter (Mastech MY64). The set up was arranged as shown in the schematic in Fig. 4. Teflon tube was used for gas inlet and outlet which passed through a cork, terminal wires. The electrometer was set to 200 MΩ range and the base resistance before introduction of gas into the chamber was recorded. 500 mg, 750 mg and 1000 mg mass of gas were introduced into the 5 L chamber while changes in resistance at interval of time in seconds were recorded for NRGO-12H, PRGO 12H and MRGO 12H sensors. Plots of sensor response at 500 mg, 750 mg and 1000 mg were made against time in seconds. The response of the sensor to target gas was determined with the following equations.
 | (1) |
 | (2) |
4 Results and discussion
4.1 Fourier transform infrared spectroscopy analysis of MRGO
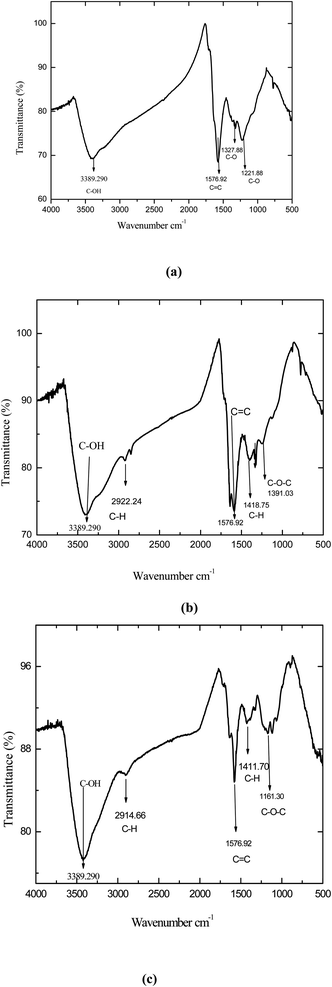
Fig. 5(a–c) shows the spectra of all rGO samples. The stretching and bending vibration of O–H groups were still observed but experienced a slight reduction in bending of the vibration from 3415.90 cm−1 to 3389.29 cm−1. Vibration of C![[double bond, length as m-dash]](https://www.rsc.org/images/entities/char_e001.gif) O of carbonyl groups present at the edges of all GOs had disappeared or diminished to confirm that the GO has been successfully exfoliated to graphene sheets (rGO). This was further confirmed by report of Stankovich et al.2 In Fig. 5(a), methionine reduced graphene oxide (MRGO-12) exhibited higher level of reduction compared to other samples.
O of carbonyl groups present at the edges of all GOs had disappeared or diminished to confirm that the GO has been successfully exfoliated to graphene sheets (rGO). This was further confirmed by report of Stankovich et al.2 In Fig. 5(a), methionine reduced graphene oxide (MRGO-12) exhibited higher level of reduction compared to other samples.
4.2 Scanning electron microscopy analyses of MRGO
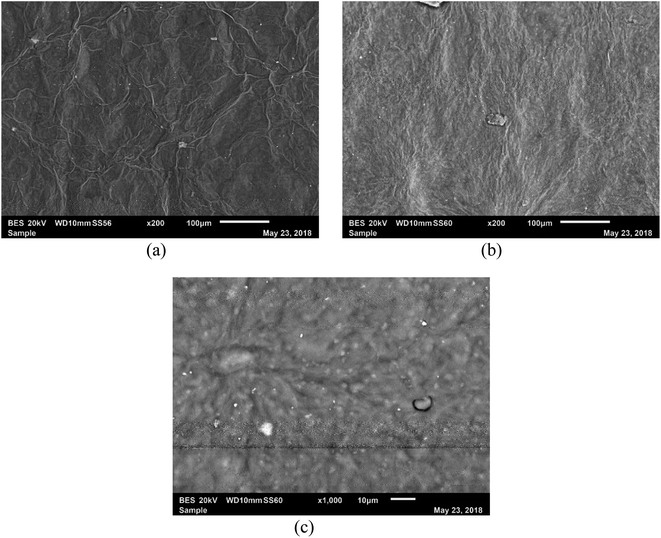
Surface morphology of reduced graphene oxides (rGO) in Fig. 6(a–c), show surfaces that were more refined and smother than GOs30 with sharp edges that confirmed that graphene oxide has been reduced. The morphology shows that it is well refined and smoother in variants of GOs reduced by methionine unlike previously reported rGO reduced by neem and pumpkin extract30 and those reduced by hydrazine and hydrothermal method.274.3 Energy dispersive X-ray spectroscopy of MRGO
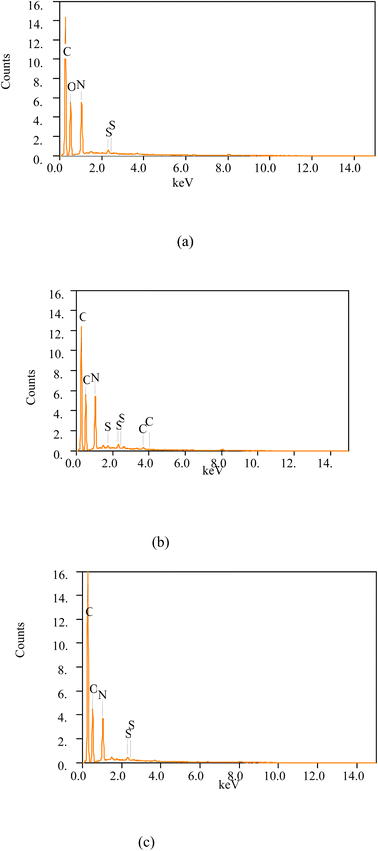
Fig. 7(a)–(c) shows the spectra of reduced graphene oxide (rGOs). When comparing reduction of graphene oxide at 12H (GO 12H) in Table 2, MRGO 12H showed higher reduction in oxygen contents from 43.07% to 31.51% followed by NRGO 12H, 36.00% and PRGO 12H, 38.60%. The lower amount of oxygen in MRGO 12H shows a greater reduction efficiency compared to other methods. From Table 2, the lower the value of O/C ratio, the greater the reduction efficiency of the reduced graphene oxide. Hence, methionine was more effective in reducing graphene oxide compared to neem plant and pumpkin leaf. This may contribute to improved gas sensing performance of the material. The presence of sodium (Na) in rGOs reduced by methionine is traceable to NaOH solution used to dissolve the residue from the solution. As a result, reduced graphene oxide obtained from reducing GO 12H with methionine, extracts of neem leaf and pumpkin leave were used for fabricating the sensors.4.4 Optical characterization of MRGO
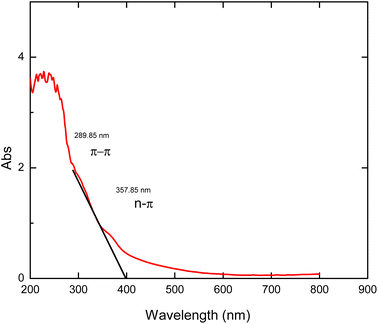
The UV analysis of graphene-based materials can be identified as an interesting absorption patterns at EM regions of between 230 nm and 300 nm which relate to transitions involving π, σ and n electrons bond energies.33 Fig. 8 indicates the spectrum of MRGO 12H. In the spectrum, the typical GO peak at 230 nm shifted to 260 nm on reducing with methionine29 while the plasmon peak red-shifted to longer wavelength of 289.85 nm which showed an increase in electron concentration of the π–π* orbital. This is a pointer to an increased restoration of sp2 carbon caused by greater reduction of GO and thus a rearrangement of atoms.27,34 Also, the n–π* peak of MRGO 12H red shifted to 357.85 nm which is much higher than the values for NRGO and PRGO. For all the orbitals, MRGO 12H showed a greater red shift in wavelength compared to PRGO and NRGO as previously reported.30 This is a further confirmation of the heightened reduction potential of methionine.4.5 Gas sensor performance test of rGO
The results of the gas sensing measurement of pumpkin reduced graphene oxide (PRGO 12H), methionine reduced graphene oxide (MRGO 12H) and neem reduced graphene oxide (NRGO 12H) on exposure to LPG concentration of 150 ppm and studied at ambient room temperature are presented in Table 3 and Fig. 9(a)–(c) respectively. The results showed an increase in the resistance of the sensor materials at room temperature of 30 °C upon the introduction of the gas. This can be explained that, when LPG was introduced, the molecules of the gas interacted with the surface of the sensor by absorbing an electron of oxygen to form water molecule H2O thus acting as an acceptor and reducing the carrier concentration in the fabricated sensors.22,28 When the sensor was inserted into the glass chamber, it interacted first with oxygen in the atmosphere to form ions (O2− and O−) on the surface of the sensor. Propane (C3H8) and butane (C4H10) are the major components of LPG and they have the same homologous series of CnH2n+2. Thus, we assume the same chemical reactions. The reaction mechanism between oxygen in the atmosphere and the rGO sensor at the surface is given by the following equations.| O2 (air) ↔ O2 (adsorbed) | (3) |
| O2 (adsorbed) + e− ↔ O2− (adsorbed) | (4) |
| O2− (adsorbed) + e− ↔ 2O− | (5) |
| Sensor type | Initial resistance at room temperature (MΩ) | Peak resistance (MΩ) | Time to reach peak resistance (seconds) | Response time (seconds) | Recovery time (seconds) | Sensor response (%) |
|---|---|---|---|---|---|---|
| PRGO 12H | 24.80 | 30.36 | 3016.83 | 23.05 | 32.27 | 16.95 |
| MRGO 12H | 14.34 | 20.75 | 1710.06 | 6.46 | 15.52 | 20.34 |
| NRGO 12H | 35.32 | 41.68 | 1949.11 | 17.75 | 33.89 | 7.56 |
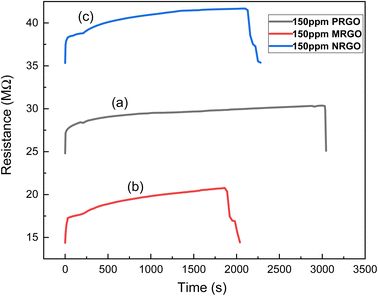 | ||
| Fig. 9 Graph of sensor resistance against time for (a) PRGO 12H at 150 ppm LPG, (b) MRGO 12H at 150 ppm LPG and (c) NRGO 12H at 150 ppm LPG. | ||
LPG gas comprises of C3H8 and C4H10. In these molecules, the reducing hydrogen species are bound to carbon therefore the LPG dissociates less easily into the reactive reducing components on the surface.25
However, the LPG sensing mechanism is a complex process, and it is believed to proceed through numerous transitional steps which is still being studied. The reaction mechanism of LPG with chemisorbed active site O− can be written as follows35
| CnH2n+2 + 2O− → H2O + CnH2nO− + e− | (6) |
| CnH2n:O + O− → CO2 + H2O + e− | (7) |
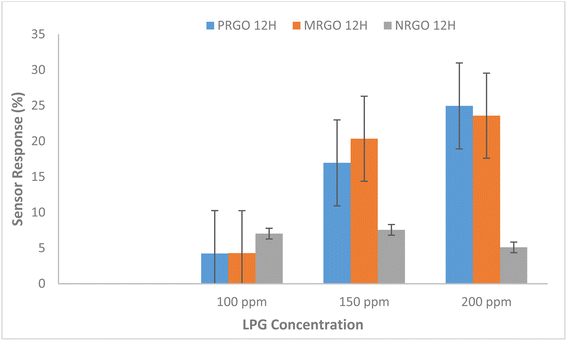
If the carrier concentration of the sensor is reduced, the resistivity of the material will increase. A reduction in the resistance of the sensor was however observed when LPG was released. Furthermore, it was observed that the sensor response for the fabricated sensors as shown in Fig. 10 is strongly dependent on the concentration of gas exposed to the sensors and the degree of removal of oxygen functional group in the graphene-based materials. Hence, MRGO 12H sensor had sensor response of 23.58% at 200 ppm while at 100 ppm, a sensor response of 11.90% was obtained. This is traceable to the higher reduction efficiency of MRGO 12H which resulted in enhancement of the sensor response. The degree of reduction determines the rate at which gas molecules adsorb on the different sites of the sensor resulting in changes in resistance.14 Apart from the degree of removal of oxygen from the graphene plane, other factors like the irregular structure of rGO at both macroscale and nanoscale, film thickness, and electrode configuration may be responsible for the sensing behavior of rGO sensors.28
Also, the facile permeation of LPG molecules on the rGO sensor is responsible for the fast response time.28 PRGO 12H at 100 ppm illustrates the least sensor response of 4.23% while NRGO 12H showed very poor sensor response that ranged between 5.10% and 7.56%. While the sensor response of our sensors indicates lower values than what was obtained in some literature studies,36,37 considering the operating temperature of the sensor and the concentration of target gas exposed to the film, our results demonstrates an improvement in sensing response for pure rGO based sensors. To this effect, for optimization of results, functionalizing rGO obtained by these methods with other materials is likely to generate higher sensor response compared to results of previous studies.
In addition, different factors are responsible for the sensing response of the sensor. For example, in LPG sensing, considerable energy is required to overcome the energy barrier in order to obtain an improved sensor response while at lower concentration of target gas, there is reduced surface reaction and coverage thus resulting in lower sensor response.37 Based on the graph in Fig. 10 where sensor response increased steadily with target gas concentration for MRGO and PRGO, an improved sensor response is anticipated for higher gas concentration. Since sensor response is a measure of the selectivity of a sensor to a gas,9 MRGO 12H is more selective in detecting LPG unlike NRGO 12H whose sensor response decreased with increased target gas concentration. The cooperation between the poly amino acid (present in methionine) and other nanomaterials enhanced the reduction potential of methionine thus improving the sensitivity and selectivity of MRGO 12H towards LPG.38 The three sensors show characteristic n-type when exposed to an oxidation atmosphere, such as LPG and delivers electrons to the gas molecules thus leading to an increase in hole concentration and increasing the resistance of rGO surface sensor. The resistance of NRGO 12H sensor on exposure to gaseous species is much higher than values obtained for PRGO 12H. The diminishing sensor response obtained for NRGO 12H unlike in PRGO 12H despite the similar reducing property of neem and pumpkin leaves is traceable to the higher resistance in NRGO 12H sensor on exposure to gaseous species. Thus, NRGO 12H couldn't respond to corresponding changes in resistance as gas concentration increased. While neem plant typified good reduction potential for graphene oxide, NRGO 12H sensors behaved poorly as sensors for LPG. Further studies might also be required to investigate the sensing mechanism of NRGO sensors. From the graphs in Fig. 11 and 12, we observed that, generally, all the three sensors exhibited good response time upon the introduction of LPG and excellent recovery time when the gas was released from the chamber. Robinson et al.22 reported that the good response time of graphene-based sensors is due to the adsorption of molecules at the sp2 carbon domains which are regarded as low energy binding sites. The fast response time of the sensors is a validation of the sensitivity of the sensors to LPG while the excellent recovery time, in addition to reinforcing the sensitivity of the sensors, also indicate that the sensors are fabricated from suitable materials that do not interfere with the sensing process and may be investigated for their selectivity. However, MRGO 12H sensor had outstanding response and recovery time superior to PRGO 12H and NRGO 12H, thus indicating superior material selectivity towards sensing LPG compared to NRGO 12H and PRGO 12H. While reports have been made on how high operating temperature of sensors results in reduced response time and large recovery time,28 at a low operating temperature of 30 °C, we have obtained response time that are far below reported values in several literature9,37,39,40 while recovery time of the sensors ranged between 6.46 seconds and 41.50 seconds. MRGO 12H sensor typified the least recovery time and thus outperformed results from reported literature.
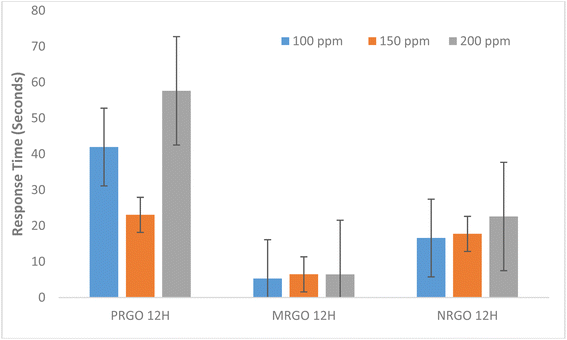 | ||
| Fig. 11 Graph showing relationship between response time of fabricated sensors with LPG concentration. | ||
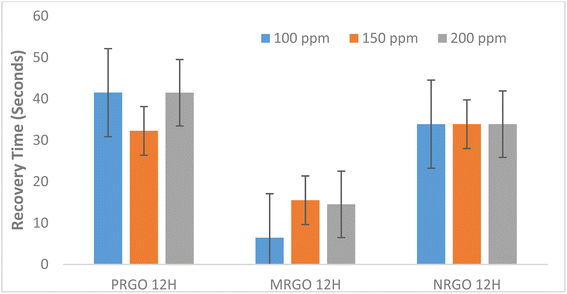 | ||
| Fig. 12 Graph showing relationship between recovery time of fabricated sensors with LPG concentration. | ||
The time required for MRGO to attain peak resistance at a concentration of 150 ppm is about 1710 seconds while NRGO required a time of about 1949 seconds and 3016 seconds was required in the case of PRGO as shown in Table 3. Thus, MRGO 12H sensor had a lower sensing period for the same concentration compared to PRGO and NRGO. We can infer thus that, the period of exposure to sensitivity is shorter for MRGO 12H sensor. This further reiterates the selectivity of MRGO 12H sensors to LPG compared to other variants of rGO sensor fabricated. Considering different performance metrics such as sensor response, response time, recovery time and sensing period, MRGO 12H is more selective towards detecting LPG.
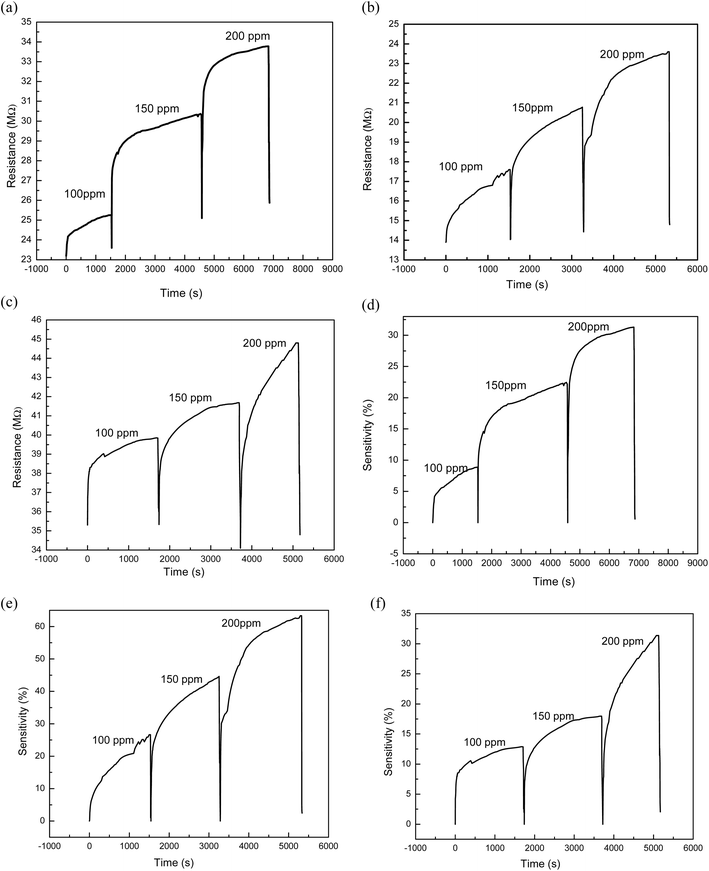
The graph of resistance of sensors against time at different concentrations of 100 ppm, 150 ppm, and 200 ppm are presented in Fig. 13(a)–(c) for PRGO 12H, MRGO 12H and NRGO 12 sensors respectively. It was evident from the figures shown that all the fabricated sensors exhibited good dependence on the LPG concentration. When LPG concentration is increased, it leads to more molecules of the gas on the surface of the sensor and subsequently an increase in the rate of reaction thus resulting in improved sensing properties. The sensing power depended on the degree of reduction28 because the reduction of graphene oxide eliminates a considerable amount of oxygen containing group which influenced the resistance of the sensor.41 In addition, the performance of MRGO sensor towards sensing LPG has further corroborated the fact that sensing potential is dependent on the degree of reduction.
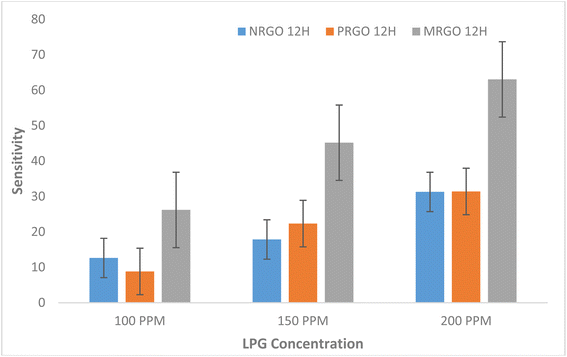
Fig. 13(d)–(f) showed plots of percentage ratio of change in resistance to the initial resistance for PRGO 12H, MRGO 12H and NRGO 12H sensors respectively. This was done to compare the sensitivity of each sensor relative to another. From the plots, MRGO 12H sensor is the most sensitive of the sensors. Fig. 14 shows the graph of percentage ratio of change in resistance to the initial resistance for the sensors. The improved reduction of MRGO 12H compared to PRGO 12H and NRGO 12H as indicated by the characterization techniques using: FTIR, EDX, SEM and UV-Visible have been validated by the sensitivity even at low gas concentration of MRGO 12H.
5 Conclusions
Graphene-based sensor obtained from the reduction of graphene oxide using methionine, extracts of neem plant and pumpkin leaf were successfully fabricated on soda lime glass substrate. Three types of sensors were made using stamp method for the transfer of interdigitated electrodes into the glass substrate and, prepared reduced graphene oxide was spin coated on the pattern to form a thin film. During the testing, highly reduced graphene oxide (MRGO 12H) was more sensitive to LPG than other sensors. Our results also showed that a greater restoration of the sp2 carbon chain brought about by increased reduction of graphene oxide is largely responsible for the sensing behavior of rGO towards LPG. Furthermore, it was observed that the sensor response for the fabricated sensors is strongly dependent on the concentration of gas exposed to the sensors and the degree of removal of oxygen functional group in the graphene-based materials. Hence, MRGO 12H sensor had highest sensor response of 23.58% at 200 ppm while a value of 11.90% was obtained at 100 ppm. PRGO 12H at 100 ppm illustrates the least sensor response while NRGO 12H showed sensor response that ranged between 5.10% and 7.56%. The sensor response of the materials, demonstrates an improvement in results obtained for pure rGO based sensors. While this further reiterates the importance of functionalizing graphene-based materials with other materials for improved sensor performance, functionalizing rGO obtained by these methods with other materials is likely to generate higher sensor response compared to results of previous studies. Considering different performance metrics such as sensor response, response time, recovery time and sensing period, MRGO 12H is more selective towards detecting LPG. In summary, we have demonstrated and shown that a convenient and inexpensive home grown set up can be used to measure the sensing properties of reduced graphene oxide sensors to LPG gas. The fabricated sensor is cheap, scalable and can be mass produced for commercial purposes.Author contributions
Allen Abiodun Olorunkosebi: conceptualization, methodology, investigation, visualization, writing – original draft. Kayode Oladele Olumurewa: writing – original draft, writing – review and editing, visualization, formal analysis. Oladepo Fasakin: resources, formal analysis. Adetayo Victor Adedeji: resources, formal analysis. Bidini Taleatu: resources, formal analysis. Bolutife Olofinjana: supervision, visualization. Marcus Adebola Eleruja: conceptualization, supervision, visualization.Conflicts of interest
On behalf of all authors, the corresponding author states that there is no conflict of interest.References
- A. K. Geim and K. S. Novoselov, The rise of graphene, Nat. Mater., 2007, 6, 183–191 CrossRef PubMed.
- S. Stankovich, et al., Graphene-based composite materials, Nature, 2006, 442(7100), 282–286, DOI:10.1038/nature04969.
- K. S. Novoselov, et al., Electric Field Effect in Atomically Thin Carbon Films, Science, 2004, 306, 666–670 CrossRef CAS PubMed.
- K. S. Novoselov and A. H. Castro Neto, Two-dimensional crystals-based heterostructures: Materials with tailored properties, Phys. Scr., 2012, T146, 1–6, DOI:10.1088/0031-8949/2012/T146/014006.
- K. O. Olumurewa and M. A. Eleruja, Photoelectrical and thermal sensing measurement of spin coated ZnO and ZnO-RGO thin film, Phys. B, 2023, 650, 414588, DOI:10.1016/j.physb.2022.414588.
- K. O. Olumurewa, B. Taleatu, A. V. Owoeye, O. Fasakin and M. A. Eleruja, Effect of incorporating graphene oxide in ZnS and study of the thermistor applications of ZnS-RGO film, Appl. Surf. Sci. Adv., 2023, 13 DOI:10.1016/j.apsadv.2023.100370.
- K. O. Olumurewa and M. A. Eleruja, Investigation of the thermal and light sensing properties of graphene oxide and reduced graphene oxide films obtained by spin coating method, Fullerenes, Nanotubes Carbon Nanostruct., 2022, 30(9), 913–922, DOI:10.1080/1536383X.2022.2037569.
- L. D'Arsié, et al., Improved recovery time and sensitivity to H2 and NH3 at room temperature with SnOx vertical nanopillars on ITO, Sci. Rep., 2018, 8(1), 1–9, DOI:10.1038/s41598-018-28298-w.
- K. Anand, O. Singh, M. Pal, J. Kaur and R. Chand, Hydrogen sensor based on graphene/ZnO nanocomposite, Sens. Actuators, B, 2014, 195(2), 409–415, DOI:10.1016/j.snb.2014.01.029.
- J. Hansen, et al., Assessing ‘dangerous climate change’: Required reduction of carbon emissions to protect young people, future generations and nature, PLoS One, 2013, 8(12) DOI:10.1371/journal.pone.0081648.
- T. Ming, R. De Richter, W. Liu and S. Caillol, Fighting global warming by climate engineering: Is the Earth radiation management and the solar radiation management any option for fighting climate change, Renewable Sustainable Energy Rev., 2014, 31, 792–834, DOI:10.1016/j.rser.2013.12.032.
- F. Schedin, et al., Detection of individual gas molecules adsorbed on graphene, Nat. Mater., 2007, 6(9), 652–655, DOI:10.1038/nmat1967.
- K. Arshak, E. Moore, G. M. Lyons, J. Harris and S. Clifford, A review of gas sensors employed in electronic nose applications, Sens. Rev., 2004, 24(2), 181–198, DOI:10.1108/02602280410525977.
- W. Yuan and G. Shi, Graphene-based gas sensors, J. Mater. Chem. A, 2013, 1(35), 10078–10091, 10.1039/c3ta11774j.
- T. Seiyama, K. Fujiishi, M. Nagatani and A. Kato, A New Detector for Gaseous Components Using Zinc Oxide Thin Films, J. Soc. Chem. Ind., Jpn., 1963, 66(5), 652–655, DOI:10.1246/nikkashi1898.66.5_652.
- P. J. Shaver, Activated tungsten oxide gas detectors, Appl. Phys. Lett., 1967, 11(8), 255–257, DOI:10.1063/1.1755123.
- M. Gautam and A. H. Jayatissa, Detection of organic vapors by graphene films functionalized with metallic nanoparticles, J. Appl. Phys., 2012, 112(11) DOI:10.1063/1.4768724.
- X. Li, et al., Large-area synthesis of high-quality and uniform graphene films on copper foils, Science, 2009, 324(5932), 1312–1314, DOI:10.1126/science.1171245.
- V. Dua, et al., All-organic vapor sensor using inkjet-printed reduced graphene oxide, Angew. Chem., Int. Ed., 2010, 49(12), 2154–2157, DOI:10.1002/anie.200905089.
- J. D. Fowler, M. J. Allen, V. C. Tung, Y. Yang, R. B. Kaner and B. H. Weiller, Practical Chemical Sensors from Chemically Derived Graphene, ACS Nano, 2009, 3(2), 301–306 CrossRef CAS PubMed.
- G. Lu, L. E. Ocola and J. Chen, Gas detection using low-temperature reduced graphene oxide sheets, Appl. Phys. Lett., 2009, 3–5, DOI:10.1063/1.3086896.
- J. T. Robinson, F. K. Perkins, E. S. Snow, Z. Wei and P. E. Sheehan, Reduced graphene oxide molecular sensors, Nano Lett., 2008, 8(10), 3137–3140, DOI:10.1021/nl8013007.
- R. Pearce, T. Iakimov, M. Andersson, L. Hultman, A. L. Spetz and R. Yakimova, Epitaxially grown graphene based gas sensors for ultra sensitive NO 2 detection, Sens. Actuators, B, 2011, 155(2), 451–455, DOI:10.1016/j.snb.2010.12.046.
- R. K. Joshi, Precise and ultrafast molecular sieving through graphene oxide membranes, Science, 2014, 343, 752–754 CrossRef CAS PubMed.
- R. K. Mishra, S. B. Upadhyay, A. Kushwaha, T.-H. Kim, G. Murali, R. Verma, M. Srivastava, J. Singh, P. P. Sahay and S. H. Lee, SnO2 quantum dots decorated on RGO: A superior sensitive, selective and reproducible performance for H2 and LPG sensor, Nanoscale, 2015, 1–9, 10.1039/C5NR02837J.
- K. Anand, O. Singh, M. P. Singh, J. Kaur and R. C. Singh, Hydrogen sensor based on graphene/ZnO nanocomposite, Sens. Actuators, B, 2014, 195(2), 409–415, DOI:10.1016/j.snb.2014.01.029.
- K. O. Olumurewa, B. Olofinjana, O. Fasakin, G. Akhigbe, M. A. Eleruja and E. O. B. Ajayi, Effect of hydrothermal and chemical treatment on the optical and electrical properties of reduced graphene oxide deposited on ITO glass, Mater. Res. Express, 2020, 7(10), 1–12, DOI:10.1088/2053-1591/abc126.
- A. Lipatov, A. Varezhnikov, P. Wilson, V. Sysoev, A. Kolmakov and A. Sinitskii, Highly selective gas sensor arrays based on a thermally reduced graphene oxide, Nanoscale, 2013, 5(207890), 5426–5434 RSC.
- N. Belachew, D. S. Meshesha and K. Basavaiah, Green syntheses of silver nanoparticle decorated reduced graphene oxide using l-methionine as a reducing and stabilizing agent for enhanced catalytic hydrogenation of 4-nitrophenol and antibacterial activity, RSC Adv., 2019, 9(67), 39264–39271, 10.1039/c9ra08536j.
- A. A. Olorunkosebi, et al., Optimization of graphene oxide through various Hummers' methods and comparative reduction using green approach, Diamond Relat. Mater., 2021, 117, 108456, DOI:10.1016/j.diamond.2021.108456.
- D. Chen, L. Li and L. Guo, An environment-friendly preparation of reduced graphene oxide nanosheets via amino acid, Nanotechnology, 2011, 22(32) DOI:10.1088/0957-4484/22/32/325601.
- H. Lee, et al., A graphene-based electrochemical device with thermoresponsive microneedles for diabetes monitoring and therapy, Nat. Nanotechnol., 2016, 11(6), 566–572, DOI:10.1038/nnano.2016.38.
- S. Kashyap, S. Mishra and S. K. Behera, Aqueous Colloidal Stability of Graphene Oxide and Chemically Converted, J. Nanopart., 2014 DOI:10.1155/2014/640281.
- G. Eda and M. Chhowalla, Chemically derived graphene oxide: Towards large-area thin-film electronics and optoelectronics, Adv. Mater., 2010, 22(22), 2392–2415, DOI:10.1002/adma.200903689.
- R. K. Mishra and P. P. Sahay, Synthesis, characterization and alcohol sensing property of Zn-doped SnO2 nanoparticles, Ceram. Int., 2012, 38(3), 2295–2304, DOI:10.1016/j.ceramint.2011.10.081.
- S. Goutham, N. Jayarambabu, C. Sandeep, K. K. Sadasivuni, D. S. Kumar and K. V. Rao, Resistive room temperature LPG sensor based on a graphene/CdO nanocomposite, Microchim. Acta, 2019, 186(2), 1–8, DOI:10.1007/s00604-018-3170-2.
- M. R. Das and P. Mitra, SILAR-synthesized CdO thin films for improved supercapacitive, photocatalytic and LPG-sensing performance, Chem. Pap., 2019, 73(7), 1605–1619, DOI:10.1007/s11696-019-00712-1.
- C. Akkapinyo, K. Subannajui, Y. Poo-Arporn and R. P. Poo-Arporn, Disposable electrochemical sensor for food colorants detection by reduced graphene oxide and methionine film modified screen printed carbon electrode, Molecules, 2021, 26(8) DOI:10.3390/molecules26082312.
- A. Singh, A. Verma and B. C. Yadav, MnO2 -SnO2 Based Liquefied Petroleum Gas Sensing Device for Lowest Explosion Limit Gas Concentration, ECS Sens. Plus, 2022, 1(2), 025201, DOI:10.1149/2754-2726/ac8437.
- P. Patial, N. Kumar and M. Deshwal, Exploration of highly sensitive LPG sensing performance of hexagonal ZnO thin films, J. Mater. Sci.: Mater. Electron., 2022, 33(24), 18991–19003, DOI:10.1007/s10854-022-08722-8.
- S. Drewniak, R. Muzyka, A. Stolarczyk, T. Pustelny, M. Kotyczka-Morańska and M. Setkiewicz, Studies of reduced graphene oxide and graphite oxide in the aspect of their possible application in gas sensors, Sensors, 2016, 16(1) DOI:10.3390/s16010103.
| This journal is © The Royal Society of Chemistry 2023 |

