 Open Access Article
Glowing selenates: novel alkaline earth nanoparticles†
Natalie Kuhlmann and
Claudia Wickleder*
Department of Chemistry, University of Siegen, 57068 Siegen, Germany. E-mail: wickleder@chemie.uni-siegen.de
First published on 13th July 2023
Abstract
Up to now, no selenate nanoparticles have been described even though much research has been done on respective oxidic compounds such as sulfates and phosphates. For the first time, alkaline earth selenates of the composition MSeO4 (M = Ca, Sr, Ba) were synthesized as nanoparticles or nanorods as described in this publication. For this purpose, a micro emulsion method was applied using CTAB as a surfactant. Using X-ray diffraction measurements (XRD) phase purity of the materials could be proven. Furthermore, the nanoparticles were analyzed by raster electron microscopy (REM) and dynamic light scattering (DLS) measurements. Finally, the products were doped with small amounts of Eu3+ to obtain luminescent materials. Successful doping was demonstrated by luminescence investigations in the region of 18![[thin space (1/6-em)]](https://www.rsc.org/images/entities/char_2009.gif) 000 to 14
000 to 14![[thin space (1/6-em)]](https://www.rsc.org/images/entities/char_2009.gif) 000 cm−1 (550–715 nm). Incorporation of Eu3+ led to strong red-emitting nanoparticles. Low temperature measurements at 10 K allowed conclusions about the site symmetry of Eu3+ ions located on the alkaline earth sites.
000 cm−1 (550–715 nm). Incorporation of Eu3+ led to strong red-emitting nanoparticles. Low temperature measurements at 10 K allowed conclusions about the site symmetry of Eu3+ ions located on the alkaline earth sites.
Introduction
Inorganic phosphors have gained a strong interest in bulk form or, above all, as nanomaterials. Possible applications of these phosphors are display applications, LEDs, upconversion materials or nano-thermometry.1–3 However, the fundamental understanding of the optical properties is still being examined for many systems, and the development of novel luminescent materials is necessary as well. Furthermore, most of the applications require materials in nano-sized form (e.g. bioimaging4 or luminescent inks5) while others are at least more effective by using nanocrystallites (like luminescent films or coatings1,6).For many rare earth doped materials, the luminescent properties are described in the literature. The trivalent rare earth elements, especially Eu3+, Sm3+ or Tb3+, are suitable in this context due to their large stability against air and humidity and also due to their long-time stability also at higher temperatures using appropriate host lattices. Trivalent rare earth elements show narrow emission bands at typical positions independently from the host lattice.7 Eu3+ is the most prominent among them with its red to orange emission color. It emits radiation in the range of about 590 to 700 nm.8 The intensity of the emission bands itself depends on the site symmetry of the rare earth ion in the host lattice.9
Altogether, the luminescence properties of Eu3+ ions are well understood. Publications of Eu3+ in manyfold systems, like halides,10 oxides1,11 or silicates12 are already available. Also Eu3+-doped complex oxidic host lattices like sulfates,13,14 phosphates15,16 and aluminates4,11 are known in both, bulk and nanocrystalline form. Also less prominent crystal classes like arsenates or vanadates are already described as host lattices for Eu3+.17–19 However, up to now, no selenate compounds are presented as host lattices for any rare earth ion. The reason for this may be the fact that selenates decompose already at moderate temperatures. Therefore, common solid state synthesis as well as melting synthesis for corresponding bulk materials is not possible.
Here, we present rare earth doped alkaline earth selenates, MSeO4 (M = Ca, Sr, Ba), for the first time together with an investigation of the luminescence properties of SrSeO4:Eu3+. For this goal, we used micro emulsion techniques below 100 °C to obtain respective materials as nanoparticles as well as in nanorod forms. Beside the novelty of the materials in general, also the nanosize of the particles must be highlighted, which allows the additional use for several applications, like bio-imaging.
Materials and methods
Materials
For the preparation of the doped alkaline earth-selenate nanoparticles micro emulsion technique was used. In detail, 1-octadecene (ODC, technical grade, 90%, Alfa Aesar) was used as oil phase together with cetyltrimethylammonium bromide (CTAB, purity 98%, Alfa Aesar) and 1-hexanol (purity > 95%, J. T. Baker) as surfactant and co-surfactant. Distilled water and ethanol (technical grade, ChemSolute) were used without further purification. The reactants sodium selenate (purity ≥ 98%, Alfa Aesar), barium chloride (BaCl2·2H2O, ≥99.0%, Merck), calcium chloride (CaCl2·2H2O, practical grade, Merck), and strontium chloride (SrCl2·6H2O, practical grade, Fischer Chemical) were used as purchased. EuCl3·6H2O was prepared from Eu2O3 (99.99%, smart elements) by dissolving in HCl (analytical grade, Fischer Scientific) and evaporating the acid. The resulting powders were analysed by X-ray diffraction measurements.Preparation of selenate nanoparticles
A water-in-oil (w/o) micro emulsion was used for the synthesis of the alkaline earth nanoparticles.20 For this purpose, ODC (50 ml) was mixed with the surfactants CTAB (3 g) and 1-hexanol (5 ml). After the addition of the aqueous phase (Na2SeO4 in 0.5 ml distilled water), a stable and transparent micro emulsion could be obtained. The corresponding alkaline earth chloride and europium chloride dissolved in 2.5 M HCl (1 ml) were added dropwise at 60 °C. Precipitation of a colourless product starts immediately. The calculated amount of product was 0.2 g and the molar ratio of alkaline earth ions to SeO42− ions was 1.1![[thin space (1/6-em)]](https://www.rsc.org/images/entities/char_2009.gif) :
:![[thin space (1/6-em)]](https://www.rsc.org/images/entities/char_2009.gif) 1. A small excess of alkaline earth ions was used to ensure a complete precipitation of selenate ions. For doped samples 2 mol% of MCl2 were replaced by EuCl3.
1. A small excess of alkaline earth ions was used to ensure a complete precipitation of selenate ions. For doped samples 2 mol% of MCl2 were replaced by EuCl3.
In case of doped samples, a high temperature micro emulsion synthesis (HT-ME) was additionally performed by adding the following steps to the synthesis procedure above: after the precipitation took place, the micro emulsion was heated to 120 °C to evaporate the volatile compounds and afterwards stirred at 200 °C under reflux for 2 h. This step increases the crystallinity of the products, and, thus, improves the luminescence intensity.21 Finally, the mixture was allowed to cool down below 50 °C. The precipitate was collected by centrifugation and washed with water and ethanol several times in all cases. Drying of particles was done in a compartment dryer at 80 °C.
Characterization methods
Sample composition and phase purity of all samples were checked with a HUBER G 21 X-ray diffractometer using a Cu-Kα1 (0.154056 nm) radiation. Afterwards, the results were compared to theoretical XRD patterns collected from the Inorganic Crystal Structure Database (ICSD).Furthermore, particle sizes were determined by dynamic light scattering (DLS) measurements using a ZETASISER NANO ZS from MALVERN PANANLYTICAL equipped with a He–Ne-Laser (λ = 633 nm). For the measurement, the samples are dispersed in diethylene glycol (viscosity 35.7 cP) and treaded with an ultrasonic beam. The measurement took place at 20 °C. The intensity of the backscattered light was measured at an angle of 173°. For size calculation the refraction indices of the samples are required. They were calculated according to the ionic refractions of the elements in each sample.22 Namely, 1.5847 for CaSeO4·2H2O, 1.7249 for SrSeO4 and 1.7717 for BaSeO4 were employed.
Images of selected selenate nanoparticles were recorded with a QUANTA FEG 250 raster electron microscope equipped with a large field detector in low vacuum mode.
Luminescence properties of the doped samples were examined with a FLUOROLOG-3 FL3-22 spectrometer from HORIBA JOBIN YVON equipped with a 450 W xenon arc lamp. Emission was detected with a HAMAMATSU photomultiplier tube R928P (equipped with an additional Ulbricht sphere for photoluminescence quantum yield (PLQY) measurements). The recorded emission spectra were corrected for the photomultiplier sensitivity. For the determination of the PLQY the excitation and emission of each sample doped with 2 mol% Eu3+ were measured in a range of 370–420 nm resp. 550–725 nm alternating with a BaSO4 standard in triplicate and an average value was calculated from the three measurements.
Results and discussion
MSeO4 and MSeO4:Eu3+ nanoparticles were successful synthesized for the first time. Fig. 1 depicts results of XRD of SrSeO4 measurements compared to reference patterns out of the ICSD. In detail, it shows doped and undoped SrSeO4 with comparison to its reference.23 Even though, the intensity ratio of the nanoparticles in the range of 25 to 30° is different from that of the reference, the samples without thermal treatment (undoped and “ME”) may be described as phase pure materials. The intensity differences can be explained by preferred orientations during crystallization of nanoparticles. The position of the reflections itself agrees with the reference. The reflection around 20° marked with a * can be explained as an artifact from the used foil during the sample preparation. Doping of 2 mol% Eu3+ seems not to have an impact on the final crystal structure as it can be seen in Fig. 1. Consequently, the introduced charge (replacing M2+ with Eu3+) must be balanced. This can be compensated by oxygen on interstitial sites as well as alkaline earth vacancies. Especially for nanoparticles (which have a relatively high surface area), the introduced charges can be balanced by surface defects and a charged particle surface. In this case, the surface would be positively charged, which is compensated by the adhesion of the negatively charged CTAB ions.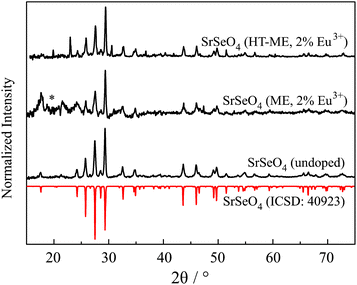 | ||
| Fig. 1 XRD pattern of SrSeO4 compared to the theoretical pattern abstracted from ICSD.23 Results of undoped SrSeO4 and doped with 2 mol% Eu3+ using micro emulsion synthesis (ME) and after thermal treatment at 200 °C (HT-ME). Reflection marked with * can be assigned to an artifact of the measurement. | ||
The reflections of the two doped Sr samples are slightly shifted to higher 2Θ values. An inset of Fig. 1 is shown in the ESI S1.† This is an indication that Eu3+ is successfully incorporated into the host lattice. Shorter bond distances (due to a smaller ionic radius of Eu3+) 24 lead to a shift to larger 2θ.25 Unfortunately, the doped sample with thermal treatment (HT-ME) shows two reflections originated by Na2SeO4 (at 24 and 31°). It can be assumed that this was not indicated by the higher temperature itself. Decomposition of selenates at high temperatures would rather lead to selenite ions as observed for the Ca sample. Thus, it can be assumed that SrSeO4 can be prepared and stabilized using CTAB at 200 °C. The impurification of Na2SeO4 seems not to have an influence on the optical properties of the sample. Both doped samples show the same behavior at low temperature with respect to their Stark-splitting. In case of doping on the Na layer in Na2SeO4, a deviating behavior must be observed here at the latest.9 In addition, doping onto the Sr layer is preferred over Na+ in terms of charge, ion size and coordination number.24 Furthermore, the HT-ME sample has a better signal-to-noise ratio compared to the same product without the thermal treatment at 200 °C. This implies the higher crystallinity after the “in situ-sintering step” which might enhance the PLQY and might be advantageous for other applications.
XRD results of undoped BaSeO4 and CaSeO4·2H2O compared to the theoretical pattern26,27 are depicted in Fig. 2. The same behavior as in case of the heat-treated doped sample of SrSeO4 could be observed for BaSeO4. Unfortunately, CaSeO4·2 H2O already starts to decompose during the HT-ME step at 200 °C. Hence, the doped sample of CaSeO4·2 H2O was synthesized as the undoped one without the in situ-sintering step.
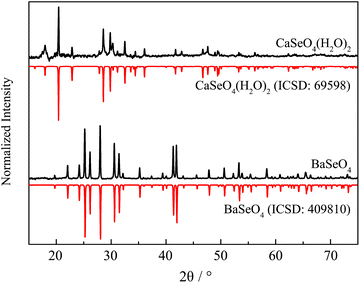 | ||
| Fig. 2 XRD pattern of BaSeO4 and CaSeO4·2H2O compared to the theoretical pattern abstracted from ICSD.24,25 | ||
XRD patterns of the doped Ba and Ca selenates are shown in the ESI S2 and S3.† The XRD patterns presented above (Fig. 1 and 2) were used to calculate the particle size with the aid of the Scherrer equation.28 For this purpose, the experimental FWHM of the three most intense reflections between 20 and 35° was used according to eqn (1). The average calculated size of the particles is depicted in Table 1.
 | (1) |
| Compound | Particle size/nm | ||
|---|---|---|---|
| DLS | Scherrer | ||
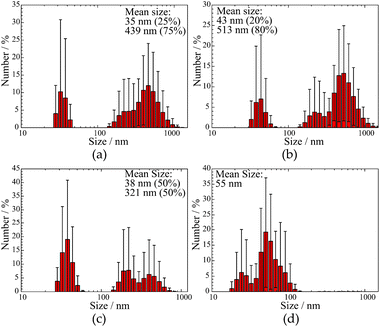
| CaSeO4·2H2O | 38 (50%), 321 (50%) | 48 ± 2 | |
| SrSeO4 | Undoped | 35 (20%), 439 (80%) | 31 ± 4 |
| 2% Eu3+ | 43 (20%), 518 (80%) | 29 ± 9 | |
| HT-ME | 36 (25%), 287 (80%) | 35 ± 6 | |
| BaSeO4 | 55 | 54 ± 11 | |
The samples were additionally analyzed using DLS measurements to determine the particle size of the dispersed NPs. The respective results are shown in Fig. 3 and summarized in Table 1. A comparison of undoped SrSeO4 prepared at 60 °C and the doped out of HT-ME synthesis proves that the thermal treatment does not lead to particle growth or agglomeration. This behavior can be explained by a CTAB shell on the NPs surface, that avoids agglomeration at higher temperatures. This has also been described for syntheses of other nanomaterials from the same microemulsion.21 The calculated particle size (Scherrer) and measured size distribution (by DLS) is similar in both cases (Fig. 3a and b). However, DLS measurements seem to depict that the particles are polydisperse. Especially for SrSeO4 and CaSeO4 two main sizes of the particles (around 40 nm and 200 to 1000 nm) are indicated.
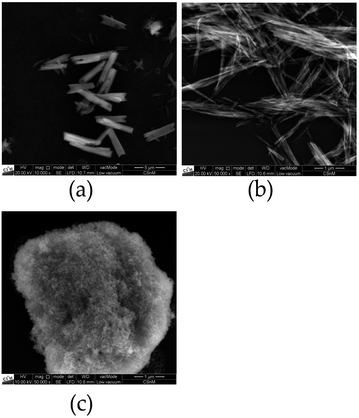
Interestingly, REM images of selenate NPs depict rod-like shape for the Ca and fiber-shape for the Sr compound, while spherical particles for BaSeO4 where observed, as shown in Fig. 4. This is in agreement with the DLS investigations (only one size determined for the Ba compound). Thus, the observations of two size distributions of CaSeO4·2H2O and SrSeO4 (Fig. 3) can be explained by the particle morphology (smaller size as diameter and larger size as length of the rods/fibers). The proportion of smaller and larger sizes (respectively diameter and length) seems to depend on the compound itself, but not on the synthesis method or sample preparation for the measurements. While the percentage ratio between the two size distributions is around 20% (diameter) to 80% (length) for SrSeO4 (resulting in nano-fibers) in several DLS measurements and different batches, it is around 50% to 50% for the Ca samples (resulting in nano-rods), as it can be seen in Fig. 3a–c and 4a, b. The REM image of BaSeO4 shows large agglomerates while the individual small particles/spheres are still visible. A common feature of the Ca and Sr compound is that both crystallize in a monoclinic crystal system, while BaSeO4 is orthorhombic. It is known that minerals of monoclinic systems can grow preferentially in one room direction, such as in gypsum crystals. This occurs less frequently in orthorhombic. Systems. This crystallization behavior could explain the different shape of BaSeO4 compared to the Sr and Ca compound.
In summary, the calculated particle sizes are similar for all samples whether determined by the Scherrer equation or by DLS (regarding the smaller determined size, if two different sizes are found), although the Stokes–Einstein equation (DLS) assumes spherical particles and determines a hydrodynamic radius29 plus there is no suitable shape factor for cylindrical NPs with the diameter to length ratio shown in REM (Scherrer).30 One has to take these points into account as it comes to a comparison between the size calculation with the Scherrer equation or with DLS. Fortunately, in this case, both calculated values are in a good agreement. A second larger diameter between 430 and 520 nm could be additionally determined by DLS measurements for Ca and Sr compounds. This can be explained with the rod-like or fiber shape, respectively, for CaSeO4·2H2O and SrSeO4. The length of the rods can be determined to 1 to 5 μm by REM measurements for most of the particles. The size difference to roughly 0.5 μm length (determined by DLS) can be explained by a better dispersion medium and dispersion time for the DLS measurements and sedimentation of large particles in an aqueous medium.
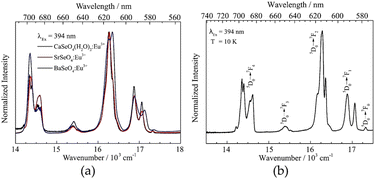
Finally, the optical properties of the selenate NPs were investigated. The corresponding emission spectra are depicted in Fig. 5. On the left side, room temperature emission spectra of the Ca, Sr and Ba selenate NPs are compared. All materials show typical Eu3+ emission peaks arising from the 4f–4f transitions with a maximum around 615 nm (assigned to 5D0 → 7F2 transitions). Due to different host lattices and, thus, coordination numbers and bond lengths, the ratio of the emission peaks varies. However, the stark splitting seems to be nearly identical in all cases.
According to the crystal structure of the host lattices and assuming doping on the alkaline earth site, a C1 site symmetry is expected for the Eu3+ ion in all samples. The emission spectrum of SrSeO4:Eu3+ recorded at 10 K is shown in Fig. 5b exemplarily. Here, the fine splitting can be observed more in detail due to lower occupation of higher states. Although the resolution is certainly lower compared to bulk (crystalline) samples. The optical transitions are assigned by the Dieke-diagram,31 while the number of stark levels for each transition depends on the site symmetry of the Eu3+ ion.9 Due to a relatively large surface area in nanomaterials the site symmetry of the doped ions may vary between ions located on the surface and those in the core. Therefore, the exact number of stark levels (of Eu3+ ions in the core, assumed C1 symmetry) could not be determined, even at 10 K. However, the presence of a 5D0 → 7F0 transition implies that Eu3+ occupies a Cnv, Cn or Cs site.32 Furthermore, at least two stark levels for the 5D0 → 7F1 transition and at least four for the 5D0 → 7F2 transition could be observed. This confirms a low site symmetry (like C1) and, thus, the successful incorporation of Eu3+ (in addition to the observed shift observed in the XRD pattern, cf. in the ESI S1†) in the host lattice onto the alkaline earth site. Similar observations are made in other monazite compounds like LaPO4:Eu3+.15,33 The excitation spectra of the Ca, Sr, and Ba compound recorded at an emission wavelength of 615 nm are shown in the ESI S4.† The PLQY of MSeO4:Eu3+ (2%) compounds were determined as well. SrSeO4 has a PLQY of 14% while the Ca compound showed a PLQY of 8%. BaSeO4:Eu3+ has with 6% the lowest PLQY among them. This can be explained by the slight yellow coloration of the sample. Here, more relaxation processes will occur due to defect levels, which leads to the lower PLQY. The obtained PLQY can be compared quite well with other published data of oxidic nanomaterials. Eu2O3 on a SiO2 substrate, for example, achieves a PLQY of about 10%.34 A higher PLQY (above 30%) was found in sodium zinc molybdate nanomaterials by codoping with Li+ ions.35 However, it is also shown that the PLQY scales with the particle size. In case of Gd2O3:Eu3+ NPs the PLQY decreases from 23% (135 nm) to 4% (15 nm).36 Our particles might experience further quenching due to the organic CTAB shell. Therefore, the quantum yield of the first described light emitting selenate (nano)particles is with around 10% very encouraging.
Conclusions
Selenate nanoparticles were successful synthesized for the first time. In detail, alkaline earth nanoparticles of the composition MSeO4 (M = Sr, Ba) and CaSeO4·2H2O were synthesized using a w/o micro emulsion with the aid of CTAB and 1-octadecene. Different in situ-sintering steps and heating procedures led to similar size distributions around 50 nm. DLS and REM investigations were performed to examine the morphology of the NPs, the respective results are in agreement with those calculated by XRD measurements. Ba selenate NPs had a spherical shape, while Ca has a rod-like-, and Sr a fiber-shape with a length of about 500 nm (DLS). Larger particles or agglomerates were found by dispersing the products in ethanol instead of diethylene glycol. Here, the length of the rods was up to 5 μm with still a small diameter (REM). Furthermore, all nanoparticles could be doped with Eu3+ to get glowing selenate NPs for the first time with a PLQY around 10%. Emission spectra depict peaks typical for Eu3+ ions with maxima at about 613 nm. A low site symmetry of the Eu3+ ion doped in SrSeO4 could be confirmed by emission measurements at 10 K. The amount of Stark levels for the 5D0 → 7FJ (J = 0–4) indicated a low site symmetry, which is in agreement to C1 in SrSeO4.Author contributions
N. Kuhlmann wrote the complete draft of this manuscript. She did the synthetic work, all measurements as well as the interpretation and conclusion of the results. Prof. Dr C. Wickleder gave the input to this project, supervised and discussed it and optimized the manuscript to its final form.Conflicts of interest
There are no conflicts to declare.Acknowledgements
The authors acknowledge Dr Christian Pritzel, University of Siegen, for the SEM measurements.References
- R.-S. Liu and X.-J. Wang, Phosphor Handbook: Novel Phosphor, Synthesis, and Applications, CRC Press, Boca Raton, 3rd edn, 2021 Search PubMed.
- Y. H. Kim, N. S. M. Viswanath, S. Unithrattil, H. J. Kim and W. B. Im, ECS J. Solid State Sci. Technol., 2017, 7, R3134 CrossRef.
- C. D. S. Brites, P. P. Lima, N. J. O. Silva, A. Millán, V. S. Amaral, F. Palacio and L. D. Carlos, Nanoscale, 2012, 4, 4799 RSC.
- R.-S. Liu and X.-J. Wang, Phosphor Handbook: Experimental Methods for Phosphor Evaluation and Characterization, CRC Press, Boca Raton, 3rd edn, 2021 Search PubMed.
- Y. Liu, D. Tu, H. Zhu and X. Chen, Chem. Soc. Rev., 2013, 42, 6924–6958 RSC.
- H. Terraschke and C. Wickleder, Chem. Rev., 2015, 115, 11352–11378 CrossRef CAS PubMed.
- Phosphor handbook, ed. W. M. Yen, S. Shionoya and H. Yamamoto, CRC Press/Taylor and Francis, Boca Raton, FL, 2nd edn, 2007 Search PubMed.
- G. Blasse and B. C. Grabmaier, Luminescent materials, Springer-Verlag, Berlin, New York, 1994 Search PubMed.
- K. Binnemans, Coord. Chem. Rev., 2015, 295, 1–45 CrossRef CAS.
- Q. Ju, Y. Liu, R. Li, L. Liu, W. Luo and X. Chen, J. Phys. Chem. C, 2009, 113, 2309–2315 CrossRef CAS.
- G. Blasse, J. Chem. Phys., 1966, 45, 2356–2360 CrossRef CAS.
- H. C. Streit, J. Kramer, M. Suta and C. Wickleder, Materials, 2013, 6, 3079–3093 CrossRef CAS PubMed.
- D. Van Der Voort and G. Blasse, J. Solid State Chem., 1990, 87, 350–359 CrossRef CAS.
- B. Zhai, D. Liu, Y. He, L. Yang and Y. M. Huang, J. Lumin., 2018, 194, 485–493 CrossRef CAS.
- S. K. Gupta, P. S. Ghosh, M. Sahu, K. Bhattacharyya, R. Tewari and V. Natarajan, RSC Adv., 2015, 5, 58832–58842 RSC.
- B. V. Ratnam, M. K. Sahu, A. K. Vishwakarma, K. Jha, H.-J. Woo, K. Jang and M. Jayasimhadri, J. Lumin., 2017, 185, 99–105 CrossRef CAS.
- L. Benarafa, L. Rghioui, S. Zaydoun, M. Idrissi, A. Lorriaux and F. Wallart, Phys. Chem. News, 2009, 49, 111–119 Search PubMed.
- A. Lorriaux-Rubbens, E. Antic-Fidancev, M. Lemaitre-Blaise, P. Porcher and F. Wallart, J. Alloys Compd., 1998, 275–277, 412–415 CrossRef CAS.
- A. Strzep, A. Watras, K. Zawisza, P. Boutinaud and R. J. Wiglusz, Inorg. Chem., 2017, 56, 10914–10925 CrossRef CAS PubMed.
- S. Wolf and C. Feldmann, Angew. Chem., Int. Ed., 2016, 55, 15728–15752 CrossRef CAS PubMed.
- D. H. M. Buchold and C. Feldmann, Adv. Funct. Mater., 2008, 18, 1002–1011 CrossRef CAS.
- A. S. Korotkov and V. V. Atuchin, Opt. Commun., 2008, 281, 2132–2138 CrossRef CAS.
- H. Prévost-Czeskleba and H. Endres, Acta Crystallogr., Sect. C: Struct. Chem., 1984, 40, 18–20 CrossRef.
- R. D. Shannon, Acta Crystallogr., Sect. A: Cryst. Phys., Diffr., Theor. Gen. Crystallogr., 1976, 32, 751–767 CrossRef.
- F. Kang, Y. Hu, L. Chen, X. Wang, H. Wu and Z. Mu, J. Lumin., 2013, 135, 113–119 CrossRef CAS.
- A. Andara, M. A. Salvado, Á. Fernández-González, S. García-Granda and M. Prieto, Z. Kristallogr. - New Cryst. Struct., 2005, 220, 5–6 CAS.
- R. R. Krüger and W. Abriel, Acta Crystallogr., Sect. C: Struct. Chem., 1991, 47, 1958–1959 CrossRef.
- P. Scherrer and P. Debye, Nachr. Ges. Wiss. Goettingen, Geschaeftliche Mitt., 1918, 1918, 98–100 Search PubMed.
- C. C. Miller, Proc. R. Soc. Lond., Ser. A Contain. Pap. Math. Phys. Character, 1924, 106, 724–749 CAS.
- S. Lele and T. R. Anantharam, Proc. - Indian Acad. Sci., Sect. A, 1966, 64, 261–274 CrossRef CAS.
- G. H. Dieke, Spectra and energy levels of rare earth ions in crystals, Wiley, New York, 1968 Search PubMed.
- T. Gavrilović, K. Laganovska, A. Zolotarjovs, K. Smits, D. J. Jovanović and M. D. Dramićanin, Opt. Mater., 2018, 82, 39–46 CrossRef.
- J. Dexpert-Ghys, R. Mauricot and M. D. Faucher, J. Lumin., 1996, 69, 203–215 CrossRef CAS.
- G. Bellocchi, G. Franzò, F. Iacona, S. Boninelli, M. Miritello, T. Cesca and F. Priolo, Opt. Express, 2012, 20, 5501–5507 CrossRef CAS PubMed.
- N. Jain, R. Paroha, R. K. Singh, S. K. Mishra, S. K. Chaurasiya, R. A. Singh and J. Singh, Sci. Rep., 2019, 9, 2472 CrossRef PubMed.
- C. Liu, J. Liu and K. Dou, J. Phys. Chem. B, 2006, 110, 20277–20281 CrossRef CAS PubMed.
Footnote |
| † Electronic supplementary information (ESI) available. See DOI: https://doi.org/10.1039/d3ra01669b |
| This journal is © The Royal Society of Chemistry 2023 |

