 Open Access Article
Creative Commons Attribution 3.0 Unported Licence
Nano-metal–organic frameworks as corrosion inhibitors for strengthening anti-corrosion behavior of carbon steel in a sulfuric acid environment: from synthesis to applications†
S. E. H. Etaiwa,
G. S. Hassana,
A. A. El-Hossianybc and
A. S. Fouda *b
*b
aDepartment of Chemistry, Faculty of Science, Tanta University, Tanta 31527, Egypt
bDepartment of Chemistry, Faculty of Science, Mansoura University, Mansoura 35516, Egypt. E-mail: asfouda@hotmail.com; Fax: +20 50 2202264; Tel: +20 50 2365730
cDelta for Fertilizers and Chemical Industries, Talkha, Egypt
First published on 18th May 2023
Abstract
In order to demonstrate the effect of Nano-metal organic frameworks, [Cu2(CN)4(Ph3Sn) (Pyz2-caH)2] (NMOF1) and [∞3[Cu(CN)2(Me3Sn)(Pyz)]] (NMOF2) as corrosion inhibitors for C-steel in 0.5 M sulfuric acid solutions, the following methods were utilized: mass reduction (MR), potentiodynamic polarization (PDP), and AC electrochemical impedance (EIS). The results of the experiments showed that by increasing the dose of these compounds, the inhibition efficacy (η%) of C-steel corrosion increased and reached 74.4–90% for NMOF2 and NMOF1 at a dose of 25 × 10−6 M, respectively. On the other hand, the η% decreased as the temperature range rose. Parameters for activation and adsorption were determined and discussed. Both NMOF2 and NMOF1 were physically adsorbed on the surface of C-steel and conformed to the Langmuir adsorption isotherm model. The PDP studies revealed that these compounds functioned as mixed type inhibitors, i.e. affecting both metal dissolution and hydrogen evolution reactions. Attenuated Total Reflection Infra-Red (ATR-IR) analysis was carried out to determine the morphology of the inhibited C-steel surface. There is good agreement between the findings of EIS, PDP and MR.
1. Introduction
Steel corrosion is a significant industrial problem that affects the entire world and causes serious environmental problems as well as significant financial losses, material failure, and decreased efficiency. In many industrial procedures, including pickling, oil well acidification, cleaning, decalcification, and petrochemical processes, acid solutions are widely used. As a result, metals and alloys corrode more quickly in these extreme acidic conditions. Therefore, the protection of metals from corrosion is of great importance and has been receiving a considerable amount of attention over the past few decades.1–7 Numerous industries have conducted extensive study on corrosion inhibitors to slow down how quickly metal dissolves when it meets corrosive surroundings.8–12 Corrosion inhibitors with high efficacy have been demonstrated to be associated with their ability to absorb on metal surfaces.13–15Studies indicate that the physicochemical characteristics of the molecule related to its functional group, possible steric effects, and electronic density of donor atoms play a significant role in the adsorption of organic inhibitors.
Adsorption is also thought to be influenced by the potential relationship of the inhibitor's-orbital with the surface atoms d-orbital. A corrosion-protective layer developed on the surface of C-steel as a result of enhanced inhibitor adsorption.16
The authors focused on using readily available, inexpensive, environmentally friendly, and renewable sources of organic compounds as inhibitors because these compounds have a strong affinity to prevent metal corrosion in acidic solutions due to the presence of heteroatoms like O, N, and S in their molecular structure.17–21 Previous research has demonstrated that organic compounds with heteroatoms like N, O, S, and others, as well as aromatic rings, function as effective corrosion-preventing agents.
The main components of MOFs, which are a new kind of porous crystalline organic–inorganic hybrid material, are metal cations and organic ligands. The effectiveness of the sacrifice is increased by including additional electropositive metals in the organic framework. On the other hand, the organic structure creates a shield over the metal surface that prevents corrosion. Three-dimensional networks of silver-based MOFs that were suitable for preventing C-steel corrosion in 1 M HCl solution were described in a few literature-based research,22 proving that MOF may be used as a powerful corrosion inhibitor.
In a different study, metal organic frameworks with both silver and nitrogen donors were demonstrated to be effective inhibitors of Cu corrosion in HCl solution. As corrosion inhibitors for metals and alloys, MOFs with organic ligands that are substituted aryl, heteroaryl, or heterocyclic compounds containing an exocyclic sulfur group have also been characterized.23,24
The literature had reported the discovery of a novel MOF from Cd.25 In 2017, a report on the effects of Co, Ni, and Cu metal-based MOFs on the prevention of mild steel corrosion was published.26 ZIF-8 and other hydrophobic MOFs are used in the anticorrosion industry as a consequence of MOF research.27,28 Recent research developed an anticorrosive coating for the petrochemical industry utilizing samarium(III) nitrate and [bis(phosphonomethyl)amino] methyl phosphonic acid (ATMP).29 According to thermodynamic research,30 the extremely excellent inhibitory property of MOF on metal surface was attributed to chemisorption of MOF on metal surface. Silver(I) pyrazine complex31 and silver(I) quinoxaline metal organic framework (MOF)32 were recently tested as corrosion inhibitors. Etaiw et al.33 utilized MOF [(AgCN)4-(qox)2], as corrosion inhibitor for carbon steel in 1 M HCl solution. The inhibition efficacy was reached to 89.3% at 1 × 10⁻⁴ M. Izuchukwu et al.34 synthesized ZnMOF-BTA framework and used it as corrosion inhibitor for Q235 C-steel of two types of MOFs, namely Mg(C7)2 and Mg(C10)2, for magnesium corrosion inhibition in a neutral pH solution. They concluded that Mg(C10)2 framework reveals better corrosion inhibition efficiency due to its lower solubility compared to Mg(C7)2 structures, although both structures are very similar. A new metal–organic framework [Ag(qox)(4-ab)] was used as a corrosion inhibitor for carbon steel in HCl solution.35 Khaled et al.36 synthesized two new metal–organic frameworks based on silver(I) and nitrogen donors to investigate copper corrosion inhibition in HCl solution. They found out that the adsorption of both MOFs is physically obeyed by Langmuir adsorption isotherm. Furthermore, they studied the effect of temperature as one of the most significant parameters affecting corrosion efficiency. Finally, they concluded that the MOF synthesized with quinoxalinecarboxylic acid shows better efficiency in comparison to those containing pyrazine carboxylic acid. Etaiw et al.37 synthesized a new metal–organic framework based on cadmium thiocyanate to investigate the corrosion inhibition of copper in HCl solution. Their results showed that the adsorption of the as-synthesized MOF was based on Langmuir adsorption isotherm. Furthermore, only the effect of temperature on the corrosion inhibition efficiency was investigated. ZIF-8 and ZIF-8@{Mo132}were synthesized and utilized as corrosion inhibitors38 for C-steel in 1 M HCl solution. The inhibitor efficacy of ZIF-8@{Mo132} nano-structure (92.3% at 700 ppm) is always higher than that of pristine ZIF-8 (87.4% at 700 ppm).
The following factors informed the selection of NMOFs 1 & 2 for the current investigation: In addition to being easily produced from elements that are very inexpensive, it also has two heterocyclic moieties, four or two cyanide groups, and aromatic systems with N atoms that can enhance the adsorption of inhibitor molecules onto the surface of C-steel.
NMOFs 1 & 2 are supramolecular in size compared to most heterocyclic compounds. MOFs have significant advantages such as: (i) uniform structures, ultrahigh porosity, tunable composition, and easy-to-functionalize surface, due to many applications of MOFs in many fields as anticorrosion coatings and (ii) the use of organic–inorganic hybrid [metal–organic frameworks (MOFs)] inhibitors, especially for carbon steel protection, has been less reported so far. So, we examined the use of NMOF1 and NMOF2 as corrosive inhibitors for C-steel in 0.5 M H2SO4 solutions using MR method and the electrochemical techniques (PDP, EIS).
The morphology of the tested NMOFs had been investigated by transmission electron microscopy (TEM) measurements. Also, the analysis of C-steel surface was evaluated using attenuated total reflection infrared (ATR-IR) technique.
2. Experimental
2.1. Composition of C-steel samples
The experiments were performed with C-steel type C1018 with the composition as in Table 1.| Elements | C | Mn | P | Si | Fe |
| Weight% | 0.20% | 0.60% | 0.004% | 0.003% | Rest |
For MR measurements, rectangular specimens with dimensions of 2 × 2 × 0.2 cm were utilized. The exposed surface area of C-steel for electrochemical testing was 1 cm2.
2.2. Chemicals
1 × 10⁻³ M stock solution of NMOFs was diluted via deionized H2O to obtain different inhibitor concentrations (5–25 × 10−6 M). In 0.5 M H2SO4, the maximal dose of a metal–organic compound was reported to be 25 × 10−6 M. The metal–organic compound employed in this work is highly soluble in water, has higher molecular weights, and includes a significant number of donating atoms (N and O) and easily available, non-toxic and their structures are listed in Table 2.| Compound | NMOF1 | NMOF2 |
| Structure | [Cu2(CN)4(Ph3Sn)·(Pyz2-caH)2] | [∞3[Cu(CN)2(Me3Sn)(Pyz)]] |
| Mol. Wt | MW = 829.36 g mol−1 | MW = 359.46 g mol−1 |
| Mol. formula | C32H23N8O4Cu2Sn | C9H13N4CuSn |
2.2.1.1. Preparation of [Cu2(CN)3(Ph3Sn)·(Pyz2-caH)2], (NMOF1). 45 mg of K3 [Cu(CN)4] (0.157 mmol) was dissolved in 10 mL H2O, under stirring to the solutions of 0.385 mg Ph3SnCl (1.0 mmol) in 10 mL acetonitrile and 0.0620 mg Pyz2-caH (0.50 mmol) in 10 mL acetonitrile. The mixture of solutions was ultrasonically irradiated for 2 h with a distinct power of 70 W at 28 °C. Already, after several days, nano-yellow precipitate of NMOF1 started growing from the initially clear solution.39 Anal. calcd. for NMOF1: (%): C, 46.32; H, 2.77; N, 13.49; Cu, 15.66. Found: C, 46.08; H, 2.69; N, 13.39; Cu, 15.56.
2.2.1.2. Synthesis of [∞3[Cu(CN)2(Me3Sn)(Pyz)]], (NMOF2). Nano sized NMOF2 had been prepared using a solution of 180 mg (0.65 mmol) of K3 [Cu(CN)4] in 10 mL of water to a solution of 73 mg (0.63 mmol) of Pyz in 10 mL of acetonitrile placed in an ultrasonic bath. To this solution was added dropwise an aqueous solution of 380 mg (1.9 mmol) of Me3SnCl. The obtained mixture of solutions was ultrasonically irradiated for 60 min with a distinct power of 70 W at 30 °C. After that, the resulting precipitate was isolated by centrifugation, washed with 20 mL of water followed by acetonitrile and dried in open air. Nanoparticles of NMOF2 were collected in a yield of about 89%.39 Anal. calcd for NMOF2 (%): C, 30.07; H, 3.65; N, 15.59; Cu, 17.68; found (%): C, 30.41; H, 3.91; N, 14.52; Cu, 17.79. Single-crystal X-ray diffraction measurements were carried out using a Kappa CCD Enraf Nonius FR 90 four-circle goniometer with graphite monochromatic Mo Kα radiation (λ = 0.71073 Å) at 25 ± 2 °C. Structure solution, refinement by Full-matrix least-squares techniques on F2 and data output were completed using SHELX-97 and SIR92 programs.40
2.3. Methods
2.3.2.1. Tests of PDP. The capacity of PDP was adjusted automatically from −700 to +700 mV against (Eocp), at a scan rate of 0.2 mV s−1.
2.3.2.2. Tests of EIS. All open-circuit testing with EIS were carried out with AC signals ranging from 100 kHz to 0.1 Hz and peak amplitudes of 10 mV at open circuit potential (OCP). The equipment used in electrochemical experiments was a Gamry Potentiostat/Galvanostat/ZRA (PCI4-G750). Gamry comprises the DC105 DC Corrosion Program, the EIS300 EIS Program, and a data gathering computer. To plot and compute data, Echem Analyst version 5.5 was used.
2.4. Morphology of the surface
3. Results data and discussion
TEM images of NMOFs (1 and 2) support the nano scale of the particles ranging from 14.22 to 30.84 nm for NMOF1 and 19.25–41.65 nm for NMOF2, Fig. SF1.† The morphology shows regular nanostructures with spherical shapes.3.1. Structure of [Cu2(CN)3(Ph3Sn)(Pyz2-caH)2], NMOF1
The structure of NMOF1 was confirmed using analytical data and elemental analysis that are compatible to its structure based on computational methods. The magnetic moment of NMOF1 indicates diamagnetic of the NMOF1 and the presence of Cu(I). The molar conductance data support the nonelectrolyte nature having Λm = 9.6 ohm−1 cm2 mol−1, respectively. Molecular structure along with atom numbering of NMOF1 is shown in Fig. 1a and b. Analysis of the bond lengths and bond angles are listed in Table SF1.† The Cu1 atoms (Cu11 and Cu25) acquire slightly distorted tetrahedral (T-4) geometry where they coordinate to three ordered cyanide groups and one nitrogen atom of Pyz2-caH ligand. The (Cu8) atom exhibits linear geometry with coordination environment containing two ordered cyanide ligands. The Sn atom coordinates to three phenyl groups and two cyanide ligands creating TBPY-5 configuration, Fig. 1. The Cu–CN bond angles exhibit slight bent structures which are more pronounced in case of Cu25 and Sn atoms (165.370°), Table SF1.† The bond lengths and bond angles are in the normal range reported for the proto-type compounds.42 The cyanide ligand acquires different bonds where two cyanide ligands connect one Cu atom (1.121–1021 Å), which was confirmed by the appearance of two νCN IR-bands at 2120 and 2102 cm−1.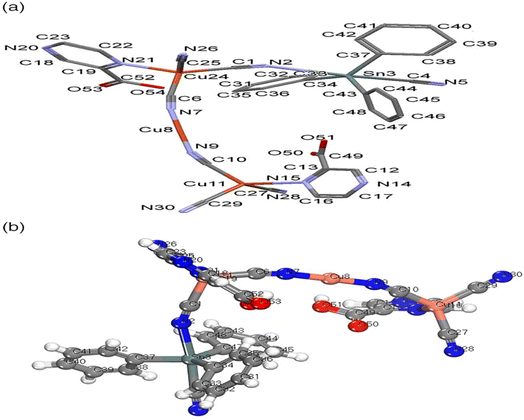 | ||
| Fig. 1 NMOF1 structure (a) mercury, with atom labeling scheme, hydrogen atoms are omitted for clarity (b) bmp structure. | ||
3.2. Structural description of [∞3[Cu(CN)2(Me3Sn)(Pyz)]] NMOF2
Direct synthesis of NMOF2 by the addition of Pyz, CuCN and Me3SnCl at ambient conditions was not verified due to the insolubility of CuCN in most common solvents. On the other hand, addition of CuCN with excess KCN, Me3SnCl and Pyz exclusively gave orange crystals of MOF2 at ambient conditions. NMOF2 structure exhibits the molecular formula [C9H13N4CuSn] which had been confirmed by elemental analyses meanwhile its chemical composition of [3∞[Cu(CN)2(Me3Sn)(Pyz)]]![[triple bond, length as m-dash]](https://www.rsc.org/images/entities/char_e002.gif) [3∞[Cu(CN)2μ-(Me3Sn)μ-(Pyz)]] was elucidated by single-crystal X-ray study. The intermolecular bond lengths and bond angles are collected in Table SF2.† Asymmetric unit of 2 contains one Me3Sn, one copper atom, 2 cyanide groups and one Pyz ligand meanwhile two asymmetric units represent the unit cell structure which are bridged via Pyrazine, Fig. 2a and b. The Cu(I) atom forms tetrahedral structure by linking to 2 cyanide groups and 2 Pyz ligands via nitrogen atoms. Bond lengths and bond angles of the Cu(I) site equal to 1.9207(13)–2.1359(11) Å and 102.47(5)–113.02(5)°, respectively, supporting tetrahedral geometry, Table SF2.† The tin atom acquires trigonal bipyramid geometry via coordination to 3 methyl ligands and 2 cyanide groups. The Sn–N and Sn–C bond lengths and angles are in the normal reported range43 (Table SF2†). The Cu–CN and Sn-NC fragments adopt nearly linear configuration (Table SF2†).
[3∞[Cu(CN)2μ-(Me3Sn)μ-(Pyz)]] was elucidated by single-crystal X-ray study. The intermolecular bond lengths and bond angles are collected in Table SF2.† Asymmetric unit of 2 contains one Me3Sn, one copper atom, 2 cyanide groups and one Pyz ligand meanwhile two asymmetric units represent the unit cell structure which are bridged via Pyrazine, Fig. 2a and b. The Cu(I) atom forms tetrahedral structure by linking to 2 cyanide groups and 2 Pyz ligands via nitrogen atoms. Bond lengths and bond angles of the Cu(I) site equal to 1.9207(13)–2.1359(11) Å and 102.47(5)–113.02(5)°, respectively, supporting tetrahedral geometry, Table SF2.† The tin atom acquires trigonal bipyramid geometry via coordination to 3 methyl ligands and 2 cyanide groups. The Sn–N and Sn–C bond lengths and angles are in the normal reported range43 (Table SF2†). The Cu–CN and Sn-NC fragments adopt nearly linear configuration (Table SF2†).
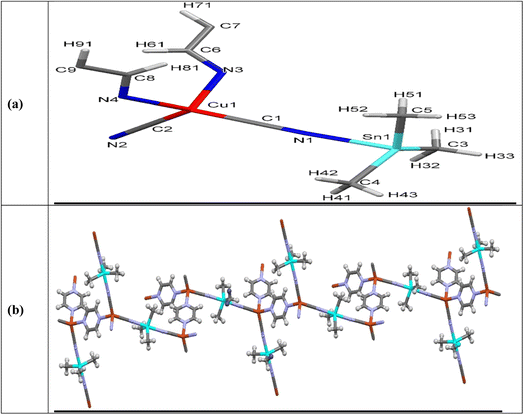 | ||
| Fig. 2 Asymmetric unit of NMOF2 (a) along a-axis showing atom labeling scheme (b) 1D-chain of MOF2 in ab-plane. | ||
3.3. Mass reduction (MR) tests
The mass loss (ΔW) which calculated from MR is given by eqn (1):| ΔW = (W1 – W2)/a | (1) |
Eqn (2) was used to calculate the IE percentage:
| η% = (ΔW − ΔWi)/ΔW × 100 | (2) |
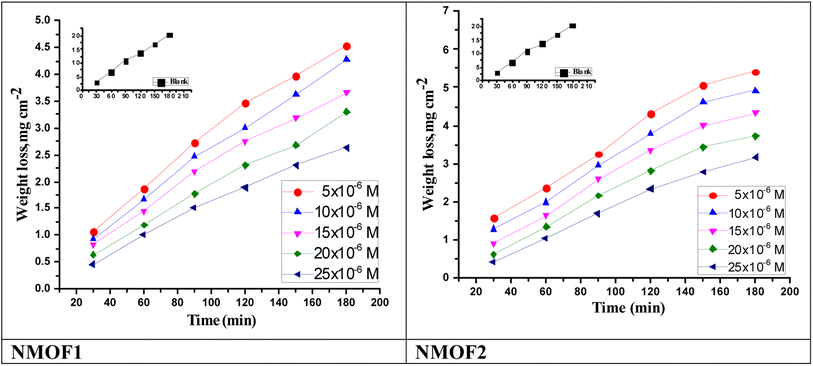 | ||
| Fig. 3 Time–MR curves of C-steel in sulfuric acid solution and in attendance of altered doses of NMOF1 & NMOF2 at 298 K. | ||
| Temp., °C | Conc., M | NMOF1 | NMOF2 | ||
|---|---|---|---|---|---|
| kcorr (mg cm−2 min−1) | η% | kcorr (mg cm−2 min−1) | η% | ||
| 25 | Blank | 0.10689 ± 0.0017 | — | 0.10689 ± 0.0021 | — |
| 5 × 10⁻⁶ | 0.02882 ± 0.0020 | 74.4 | 0.03553 ± 0.0023 | 66.8 | |
| 10 × 10−6 | 0.02555 ± 0.0019 | 77.3 | 0.02806 ± 0.0011 | 73.7 | |
| 15 × 10−6 | 0.02065 ± 0.0025 | 79.7 | 0.02142 ± 0.0013 | 80.0 | |
| 20 × 10−6 | 0.01652 ± 0.0014 | 83.1 | 0.01757 ± 0.0015 | 83.6 | |
| 25 × 10−6 | 0.00955 ± 0.0022 | 90.0 | 0.01289 ± 0.0017 | 87.9 | |
| 30 | Blank | 0.13398 ± 0.0023 | — | 0.13398 ± 0.0020 | — |
| 5 × 10⁻⁶ | 0.04073 ± 0.0020 | 69.6 | 0.050778 ± 0.0023 | 62.1 | |
| 10 × 10−6 | 0.036577 ± 0.0015 | 72.7 | 0.040462 ± 0.0014 | 69.8 | |
| 15 × 10−6 | 0.032423 ± 0.0018 | 75.8 | 0.032959 ± 0.0019 | 75.4 | |
| 20 × 10−6 | 0.02693 ± 0.0018 | 79.9 | 0.0276 ± 0.0018 | 79.4 | |
| 25 × 10−6 | 0.01942 ± 0.0021 | 85.5 | 0.023179 ± 0.0016 | 82.7 | |
| 35 | Blank | 0.19856 ± 0.0016 | — | 0.19856 ± 0.0023 | — |
| 5 × 10⁻⁶ | 0.06592 ± 0.0019 | 66.8 | 0.081608 ± 0.0021 | 58.9 | |
| 10 × 10−6 | 0.06036 ± 0.0015 | 69.6 | 0.064731 ± 0.0016 | 67.4 | |
| 15 × 10−6 | 0.05261 ± 0.0019 | 73.5 | 0.058575 ± 0.0015 | 70.5 | |
| 20 × 10−6 | 0.0413 ± 0.0025 | 79.2 | 0.050236 ± 0.0014 | 74.7 | |
| 25 × 10−6 | 0.03454 ± 0.0013 | 82.6 | 0.041698 ± 0.0015 | 79.0 | |
| 40 | Blank | 0.26488 ± 0.0020 | — | 0.26488 ± 0.0018 | — |
| 5 × 10⁻⁶ | 0.105422 ± 0.0012 | 60.2 | 0.13191 ± 0.0021 | 50.2 | |
| 10 × 10−6 | 0.100![[thin space (1/6-em)]](https://www.rsc.org/images/entities/char_2009.gif) 654 ± 0.0015 654 ± 0.0015 |
62.0 | 0.127![[thin space (1/6-em)]](https://www.rsc.org/images/entities/char_2009.gif) 407 ± 0.0018 407 ± 0.0018 |
51.9 | |
| 15 × 10−6 | 0.090589 ± 0.0023 | 65.8 | 0.094562 ± 0.0024 | 64.3 | |
| 20 × 10−6 | 0.076285 ± 0.0021 | 71.2 | 0.084497 ± 0.0022 | 68.1 | |
| 25 × 10−6 | 0.061982 ± 0.0015 | 76.6 | 0.07761 ± 0.0020 | 70.7 | |
| 45 | Blank | 0.31742 ± 0.0017 | — | 0.31742 ± 0.0021 | — |
| 5 × 10⁻⁶ | 0.144109 ± 0.0002 | 54.6 | 0.181247 ± 0.0015 | 42.9 | |
| 10 × 10−6 | 0.132047 ± 0.0021 | 58.4 | 0.166646 ± 0.0019 | 47.5 | |
| 15 × 10−6 | 0.119667 ± 0.0024 | 62.3 | 0.130777 ± 0.0017 | 58.8 | |
| 20 × 10−6 | 0.092687 ± 0.0017 | 70.8 | 0.113954 ± 0.0014 | 64.1 | |
| 25 × 10−6 | 0.078403 ± 0.0016 | 75.3 | 0.097131 ± 0.0013 | 69.4 | |
 , which can be derived from eqn (3), is an essential component that influences the speed of reaction and the kind of adsorption.
 | (3) |
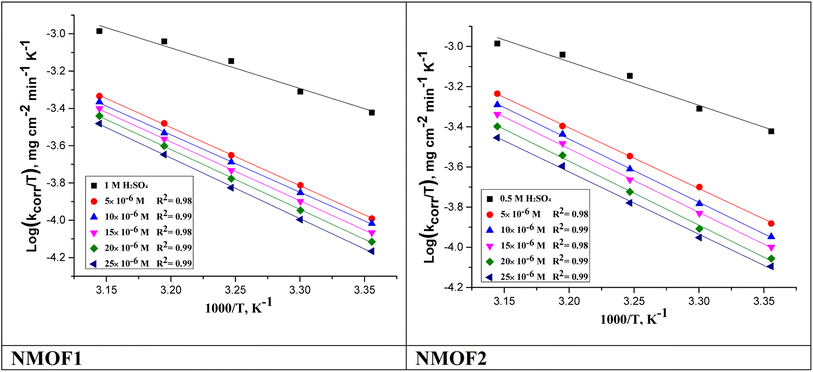
 energy of the analysis of the results was obtained in Table 4, It suggests that the surface reaction dominates the overall activity since the corrosion process
  is more than (20 kJ mol−1) and the activation energy increases as the dosage of metal–organic compound increases. Energy rises as the dose of metal–organic compound increases, it appears that the surface reaction dominates the overall activity. The adsorption nature of metal–organic compounds on C-steel causes this rise, which correlates to the physical adsorption of metal–organic compounds.45–48 The transitional state equation was used to calculate the changes in entropy and enthalpy. The activation enthalpy (ΔH*) and activation entropy (ΔS*) increase for C-steel corrosion in 0.5 M H2SO4 is calculated using the equation below:
 | (4) |
![[thin space (1/6-em)]](https://www.rsc.org/images/entities/char_2009.gif) R/Nh − ΔS*/2.303R) from which ΔH* and ΔS* data were calculated and depicted in Table 4. Negative results of (ΔH*) on the C-steel surface, indicating that the reaction that occurs during the dissolving process is exothermic, and it is known that they may be used to chemical and physical adsorption.49,50 The mean values (ΔS*) are both high and negative, indicating that the activated complex is associated rather than dissociated during the rate-determining stage.
R/Nh − ΔS*/2.303R) from which ΔH* and ΔS* data were calculated and depicted in Table 4. Negative results of (ΔH*) on the C-steel surface, indicating that the reaction that occurs during the dissolving process is exothermic, and it is known that they may be used to chemical and physical adsorption.49,50 The mean values (ΔS*) are both high and negative, indicating that the activated complex is associated rather than dissociated during the rate-determining stage.
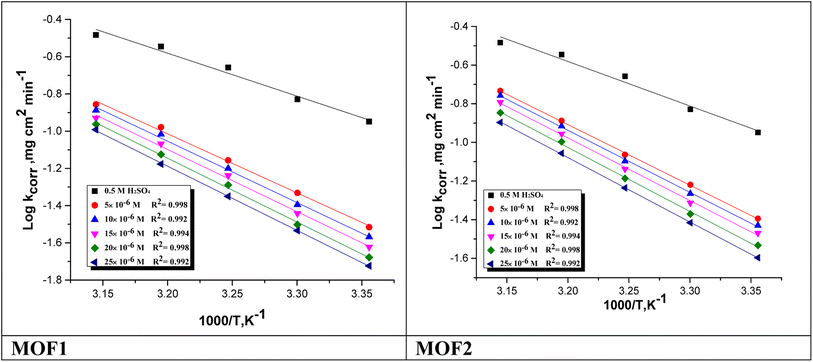 | ||
Fig. 4 log![[thin space (1/6-em)]](https://www.rsc.org/images/entities/char_2009.gif) kcorr vs. 1/T of the investigated NMOF1 & NMOF2 with and without altered doses of investigated compounds at temperature range 298–318 K. kcorr vs. 1/T of the investigated NMOF1 & NMOF2 with and without altered doses of investigated compounds at temperature range 298–318 K. | ||
| Comp. | Conc, ×106 M | , kJ mol−1 | ΔH*, kJ mol−1 | −ΔS*, J mol−1 K−1 |
|---|---|---|---|---|
| NMOF1 | Blank | 44.5 ± 0.2028 | 42 ± 0.2309 | 125 ± 0.2309 |
| 5 | 63.6 ± 0.2403 | 61.1 ± 0.2027 | 71.1 ± 0.1732 | |
| 10 | 64.9 ± 0.2729 | 62.3 ± 0.1732 | 69.6 ± 0.2404 | |
| 15 | 65.5 ± 0.1453 | 62.9 ± 0.2603 | 68.7 ± 0.2028 | |
| 20 | 66.2 ± 0.1453 | 63.6 ± 0.2603 | 67.5 ± 0.2021 | |
| 25 | 67.0 ± 0.1856 | 64.5 ± 0.2333 | 65.9 ± 0.2048 | |
| NMOF2 | 5 | 60.6 ± 0.1528 | 58.0 ± 0.1787 | 80.2 ± 0.2603 |
| 10 | 63.5 ± 0.1764 | 61.0 ± 0.1856 | 72.3 ± 0.1528 | |
| 15 | 64.2 ± 0.1856 | 61.6 ± 0.2048 | 71.5 ± 0.2603 | |
| 20 | 65.1 ± 0.1453 | 62.5 ± 0.1764 | 69.6 ± 0.1453 | |
| 25 | 66.1 ± 0.1856 | 63.5 ± 0.1856 | 67.8 ± 0.2048 |
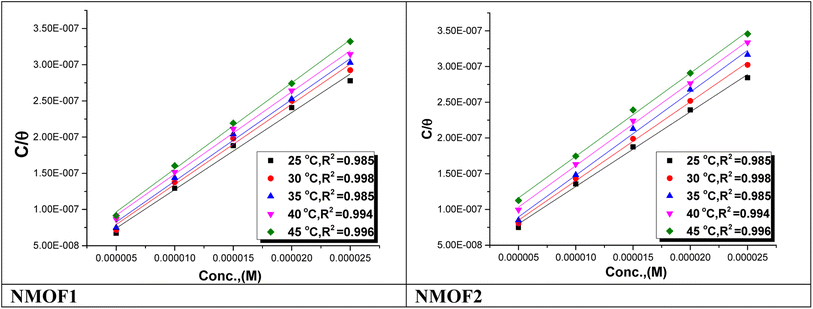
| C/θ = 1/Kads + C | (5) |
 | (6) |
 is the standard free energy of adsorption, C is the concentration of the inhibitor in M, and 55.5 dosage of molar water in solution. The data pattern revealed a negative sign of
  due to the spontaneous and stable adsorbed layer on the metal surface.52 The adsorption characteristics for the metal–organic compounds found are shown in Table 5. The free energy findings show that the kind of adsorption event is physical (mainly) and chemical adsorption, since it is known that negative values are greater than 20 kJ mol−1 and less than 40 kJ mol−1 for the current study. Due to the nonhomogeneous character of the metal surface, including microscopic spaces, non-metallic inclusions, and impurities, the Goads values in Table 5 alter with changes in inhibitor concentration. This confirms the Langmuir model. The
  values ranged between −22.7 and −23.1 kJ mol−1, suggesting physical and chemical adsorption (mixed adsorption). The enthalpy of adsorption,
  , was determined using the Vant Hoff equation:
 | (7) |
| Inhibitor | Temp., K | Kads, M−1 | , kJ mol−1 | , kJ mol−1 | , J mol−1 K−1 |
|---|---|---|---|---|---|
| NMOF1 | 298 | 48 ± 0.1859 | 19.5 ± 0.2025 | 37 ± 0.1645 | 57.3 ± 0.2033 |
| 303 | 41 ± 0.1833 | 19.4 ± 0.2251 | 56.5 ± 0.2120 | ||
| 308 | 34 ± 0.2141 | 19.3 ± 0.1654 | 56.1 ± 0.1654 | ||
| 313 | 29 ± 0.2241 | 19.1 ± 0.1452 | 55.4 ± 0.1425 | ||
| 318 | 22 ± 0.1741 | 18.8 ± 0.1325 | 55.1 ± 0.1345 | ||
| NMOF2 | 298 | 41 ± 0.1525 | 19.2 ± 0.1253 | 33 ± 0.1841 | 47.3 ± 0.1228 |
| 303 | 35 ± 0.2033 | 19.1 ± 0.1725 | 46.8 ± 0.2128 | ||
| 308 | 30 ± 0.2236 | 19.0 ± 0.2121 | 46.2 ± 0.2014 | ||
| 313 | 25 ± 0.2101 | 18.9 ± 0.2255 | 45.9 ± 0.2023 | ||
| 318 | 22 ± 0.1788 | 18.8 ± 0.2125 | 45.5 ± 0.1745 |
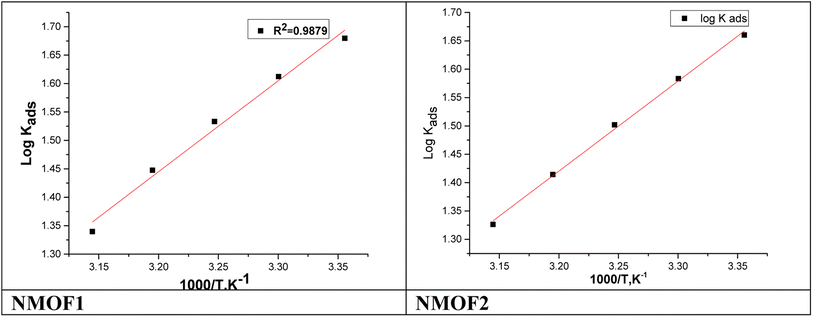
Fig. 7 shows plotting of log![[thin space (1/6-em)]](https://www.rsc.org/images/entities/char_2009.gif) Kads with 1/T for C-steel in 0.5 M H2SO4 with NMOF1 & NMOF2. The negative sign of the
Kads with 1/T for C-steel in 0.5 M H2SO4 with NMOF1 & NMOF2. The negative sign of the  data designates that the adsorption procedure is exothermic. Adsorption can be physical or chemical in an exothermic procedure, while it can only be chemical in an endothermic procedure. Finally, the next Eq. may be utilized to calculate
  .
.
 | (8) |
Table 5 demonstrations the values for  . The −ve sign of
  values designates that the order of the adsorbed molecules at the solid/liquid contact is decreasing.
3.4. Electrochemical measurements
| η% = (1 − (icorr/iocorr)) | (9) |
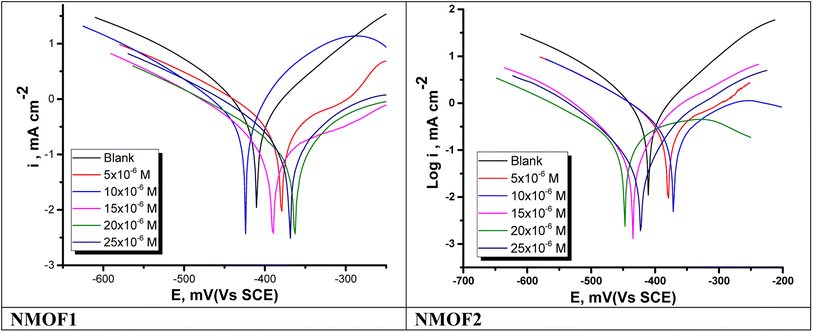 | ||
| Fig. 8 PDP bends for the liquefaction of C-steel in 0.5 M H2SO4 with and without altered doses of NMOF1 & NMOF2 at 298 K. | ||
| [Inh] | Conc., ×106 (M) | −Ecorr mV vs. SCE | icorr, mA cm−2 | βa, mV dec−1 | −βc, mV dec−1 | θ | η% |
|---|---|---|---|---|---|---|---|
| Blank | — | 410.0 ± 0.1658 | 0.9327 ± 0.0183 | 267.0 ± 0.2028 | 145.0 ± 0.2028 | — | — |
| NMOF1 | 5 | 379.6 ± 0.2033 | 0.5606 ± 0.0016 | 125.8 ± 0.1642 | 145.9 ± 0.1787 | 0.399 | 39.9 |
| 10 | 424.1 ± 0.2444 | 0.4132 ± 0.0250 | 89.3 ± 0.1243 | 114.1 ± 0.1645 | 0.557 | 55.7 | |
| 15 | 390.3 ± 0.1547 | 0.3098 ± 0.0220 | 137.8 ± 0.2014 | 150.4 ± 0.1457 | 0.668 | 66.8 | |
| 20 | 363.1 ± 0.1754 | 0.1921 ± 0.0156 | 148.5 ± 0.2531 | 152.2 ± 0.1347 | 0.794 | 79.4 | |
| 25 | 369.4 ± 0.1562 | 0.1229 ± 0.0172 | 214.0 ± 0.2124 | 157.8 ± 0.1687 | 0.868 | 86.8 | |
| NMOF2 | 5 | 369.6 ± 0.1465 | 0.6043 ± 0.0152 | 135.7 ± 0.1655 | 151.9 ± 0.2134 | 0.352 | 35.2 |
| 10 | 377.6 ± 0.1235 | 0.4719 ± 0.0132 | 124.3 ± 0.1892 | 143.7 ± 0.2245 | 0.494 | 49.4 | |
| 15 | 443.1 ± 0.1125 | 0.4019 ± 0.0186 | 148.8 ± 0.2121 | 129.8 ± 0.2217 | 0.569 | 56.9 | |
| 20 | 451.3 ± 0.2023 | 0.1977 ± 0.0521 | 119.4 ± 0.2301 | 159.6 ± 0.1787 | 0.788 | 78.8 | |
| 25 | 391.7 ± 0.2235 | 0.1343 ± 0.0148 | 114.3 ± 0.1871 | 160.5 ± 0.1975 | 0.856 | 85.6 |
| Cdl = Y0(ωmax)n−1 | (10) |
| Cdl = εε°A/δ | (11) |
 | (12) |
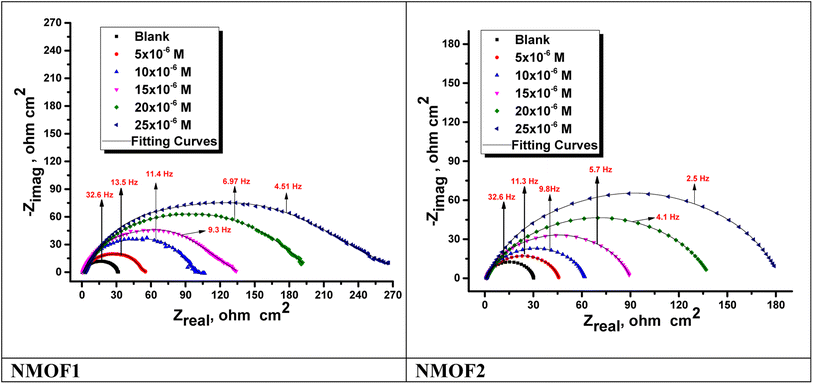 | ||
| Fig. 9 Nyquist plots for C-steel dissolving in 0.5 M H2SO4 in the presence and absence of altered doses of NMOF1 and NMOF2 at 298 K. | ||
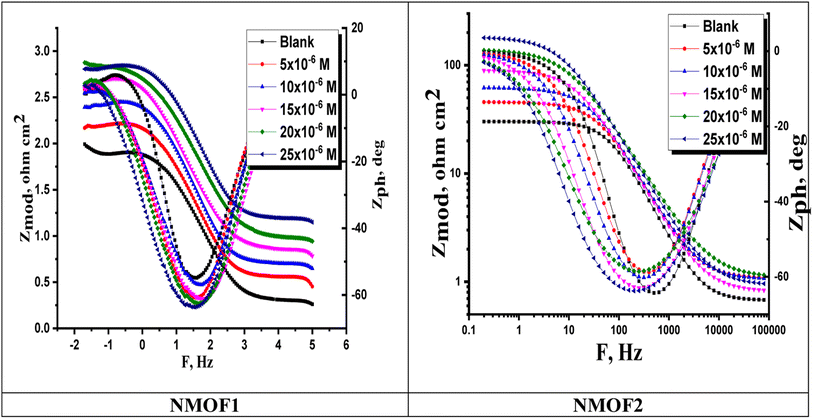 | ||
| Fig. 10 Bode graphs for C-steel dissolving in 0.5 M H2SO4 in the presence and absence of different doses of NMOF1 & NMOF2 at 298 K. | ||
| [Inh] | Conc. ×106 M | Rs, (Ω cm2) | Yo, μΩ−1 sn cm−2 | n | Cdl, (μF cm−2) | Rct, (Ω cm2) | η% | Goodness of fit (χ2) |
|---|---|---|---|---|---|---|---|---|
| Blank | — | 1.9283 ± 0.0183 | 689 | 0.960 | 586.9 ± 0.2321 | 30.4 ± 0.1757 | — | 16.88 × 10⁻³ |
| NMOF1 | 5 | 2.1328 ± 0.0175 | 482 | 0.968 | 427.4 ± 0.1487 | 53.7 ± 0.2128 | 43.5 | 21.45 × 10⁻³ |
| 10 | 2.4726 ± 0.0213 | 398 | 0.970 | 360.4 ± 0.1657 | 99.2 ± 0.1612 | 69.4 | 21.58 × 10⁻³ | |
| 15 | 2.670 ± 0.0230 | 303 | 0.973 | 276.1 ± 0.2587 | 128.1 ± 0.2109 | 76.3 | 19.10 × 10⁻³ | |
| 20 | 2.786 ± 0.0165 | 243 | 0.976 | 225.81 ± 0.1458 | 194.8 ± 0.2228 | 84.4 | 17.22 × 10⁻³ | |
| 25 | 2.791 ± 0.0244 | 176 | 0.978 | 164.42 ± 0.2102 | 260.6 ± 0.1932 | 88.4 | 17.33 × 10⁻³ | |
| NMOF2 | 5 | 1.882 ± 0.0147 | 499 | 0.979 | 460.1 ± 0.1753 | 47.2 ± 0.1828 | 35.7 | 20.11 × 10⁻³ |
| 10 | 1.954 ± 0.0214 | 437 | 0.983 | 410.5 ± 0.1987 | 61.8 ± 0.1744 | 50.9 | 21.16 × 10⁻³ | |
| 15 | 2.232 ± 0.0145 | 393 | 0.985 | 373.3 ± 0.2112 | 89.4 ± 0.2121 | 66.0 | 14.87 × 10⁻³ | |
| 20 | 2.336 ± 0.0157 | 261 | 0.987 | 249.7 ± 0.1722 | 138.7 ± 0.1857 | 78.1 | 16.75 × 10⁻³ | |
| 25 | 2.449 ± 0.0168 | 242 | 0.989 | 233.4 ± 0.1653 | 181.1 ± 0.1732 | 83.2 | 17.5810−3 |
3.5. Surface analysis by FT-IR analysis
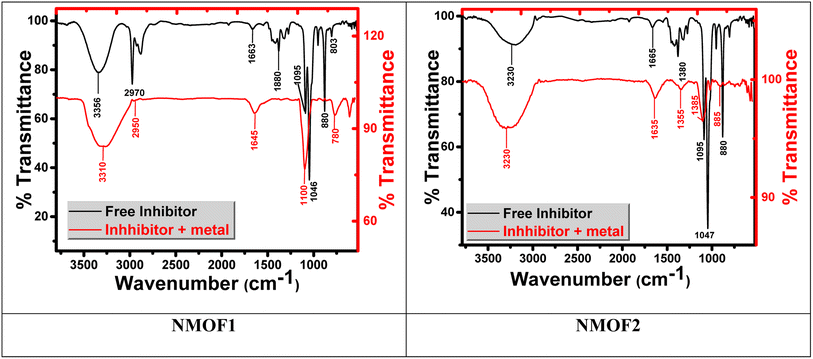
Fourier transform infrared spectroscopy (FT-IR) identifies chemical bonds in a molecule by producing an infrared absorption spectrum. FT-IR spectrum of the corrosion product at C-steel surface in 0.5 M H2SO4 does not show any useful adsorption peaks.62,63 FT-IR fingerprint spectra of the stock metal–organic EIS and the C-steel surface after dipping in 0.5 M H2SO4 + 25 × 10−6 M of metal–organic NMOF1 for 24 hours was obtained and compared to each other it was obviously clear that the same fingerprint of metal–organic. NMOF1 solution present on C-steel surface except the absence of some functional group and it suggested being due to reaction with H2SO4. From Fig. 12 there are small shift in the peaks at C-steel surface from the original peak of the stock inhibitor solution, these shifts indicate that there is interaction between C-steel NMOF1 & NMOF2.3.6. Corrosion inhibition mechanism
The inhibitory process in acid media begins with adsorption on the metal surface.64 Most studies on inhibition hypothesize that the unoccupied d-orbitals of the metal and the inhibitor's p-electrons create a donor–acceptor surface complex.65 The synthetic compounds for metal organic frameworks have a lot of surface area that is easily adsorbable to the metal surface to create a corrosion-inhibiting coating. Moreover, when coordinated with metal ions, the nitrogen and oxygen in the metal organic framework molecule are frequently positively charged and capable of drawing the chloride ions. To inhibit corrosion, lower the amount of chloride ions present on the metal surface.66 In aqueous acidic solutions, the inhibitor is either neutral or takes the form of cations (i.e., protonated species). Two different adsorption kinds could be generally thought of. As a result of the displacement of water molecules from the metal surface and the sharing of electrons between N, O atoms and Fe as well as between the π-electrons of the aromatic ring and the open d-orbitals of Fe, the neutral form of the inhibitor may adsorb on the metal surface. On the other hand, it is well known that the steel surface is positively charged under acidic circumstances.67 As a result, a protonated inhibitor has suffering adhering to the positively charged steel surface due to electrostatic repulsion. Because they are more strongly adsorbed SO42+ ions produce an excess negative charge in the solution, which encourages the adsorption of more protonated inhibitors. When the protonated inhibitor is deposited on the metal surface, two things could happen: (i) a coordinate bond could form as a result of a partial electron transfer from N atoms to the metal surface, and (ii) the protonated inhibitor could combine with recently formed Fe2+ ions to form a metal-inhibitor complex on the surface of C-steel.67| Fe2+ + x inh → [inhx + Fe](2+x)+ |
These complexes may be adsorbed on the steel surface by van der Waals forces, generating a corrosion-resistant covering. The film blocks both cathodic and anodic processes at the same time.68 As a result, the primary mechanism of the inhibitor's corrosion inhibition is the adsorption of inhibitor molecules containing N heteroatoms and π-electrons of aromatic rings on the surface of steel.
4. Conclusions
From the overall experimental results, the following conclusions can be deduced:(1) Organometallic framework compounds NMOF1 & NMOF2 were synthesized and characterized by altered techniques.
(2) The investigated NMOFs compounds are excellent corrosion inhibitors for C-steel in 0.5 M H2SO4 solution.
(3) The effect acquired from all measurements confirmed that the inhibiting action will increase with elevating the NMOFs concentration and reduces with the increasing the temperature.
(4) All measured methods results showed that the inhibition performance of NMOF1 was better than that of NMOF2, and the inhibition rate of NMOF1 was 90.0%. This may be because NMOF1 was a large molecule complex, which can effectively form a cover layer, thereby enabling better corrosion inhibition of steel sheets.
(5) Double layer capacitance (Cdl) lowered while Rct increases with improving the concentration of NMOFs. This reality confirms the adsorption of these molecules at the C-steel surface obeying Langmuir adsorption isotherm. The adsorption constants Kads of NMOF1 and NMOF2 were 48 ± 0.1859 L mg−1 and 41 ± 0.1515 L mg−1, respectively, and the inhibition ability of NMOF1 was better than that of NMOF2.
(6) PDP data revealed that these NMOFs performance as mixed type inhibitors.
(7) The negative values of  indicate the spontaneity and stability of the adsorbed layer of the NMOFs on the surface of C-steel.
(8) The η% values gotten from the altered independent quantitative techniques show the validity of the results.
Data availability
The authors confirm that the data supporting the findings of this study are available within the article and/or its ESI.†Author contributions
S. E. H and A. S. F. analyzed all measurement data and then wrote the manuscript. G. S. H and A. A. E. designed the experiments. All authors discussed the results and revised the manuscript.Conflicts of interest
The authors declare that we have no competing financial interests or personal relationships that could have appeared to influence the work reported in this paper.References
- I. K. Nwokolo, H. Shi, A. I. Ikeuba, N. Gao, J. Li, S. Ahmed and F. Liu, Coatings, 2022, 12, 1288 CrossRef CAS.
- F. Tang, G. Chen, R. K. Brow and M. L. Koenigstein, Materials, 2014, 7, 6632–6645 CrossRef PubMed.
- A. S. Fouda, M. A. Ismail, M. A. Khaled and A. A. El-Hossiany, Sci. Rep., 2022, 12, 1–19 CrossRef PubMed.
- S. Liu, N. Xu, J. Duan, Z. Zeng, Z. Feng and R. Xiao, Corros. Sci., 2009, 51, 1356–1363 CrossRef CAS.
- P. Lowmunkhong, D. Ungthararak and P. Sutthivaiyakit, Corros. Sci., 2010, 52, 30–36 CrossRef CAS.
- I. B. Obot and N. O. Obi-Egbedi, Corros. Sci., 2010, 52, 657–660 CrossRef CAS.
- I. Ahamad, R. Prasad and M. A. Quraishi, Corros. Sci., 2010, 52, 3033–3041 CrossRef CAS.
- N. Soltani, M. Behpour, S. M. Ghoreishi and H. Naeimi, Corros. Sci., 2010, 52, 1351–1361 CrossRef CAS.
- R. D. Nikolova, G. N. Vayssilov, N. Rodios and A. Bojilova, Molecules, 2002, 7, 420–432 CrossRef.
- A. M. El-Agrody, A. El-Latif, N. A. El-Hady, A. H. Fakery and A. H. Bedair, Molecules, 2001, 6, 519–527 CrossRef CAS.
- M. Mahdavian and S. Ashhari, Electrochim. Acta, 2010, 55, 1720–1724 CrossRef CAS.
- A. M. M. El-Saghier and A. Khodairy, Phosphorus, Sulfur Silicon Relat. Elem., 2000, 160, 105–119 CrossRef CAS.
- S. M. Kovalenko, I. E. Bylov, K. M. Sytnik, V. P. Chernykh and Y. V Bilokin, Molecules, 2000, 5, 1146–1165 CrossRef CAS.
- R. Flašík, H. Stankovičová, A. Gáplovský and J. Donovalová, Molecules, 2009, 14, 4838–4848 CrossRef PubMed.
- M. Čačić, V. Pavić, M. Molnar, B. Šarkanj and E. Has-Schön, Molecules, 2014, 19, 1163–1177 CrossRef PubMed.
- J. Azizian, A. A. Mohammadi, I. Bidar and P. Mirzaei, Monatsh. Chem., 2008, 139, 805–808 CrossRef CAS.
- V. S. V Satyanarayana, P. Sreevani, A. Sivakumar and V. Vijayakumar, Arkivoc, 2008, 17, 221–233 Search PubMed.
- M. M. Garazd, O. V Muzychka, A. I. Vovk, I. V Nagorichna and A. S. Ogorodniichuk, Chem. Nat. Compd., 2007, 43, 19–23 CrossRef CAS.
- G. Smitha and C. Sanjeeva Reddy, Synth. Commun., 2004, 34, 3997–4003 CrossRef CAS.
- A. Kotali, I. S. Lafazanis and P. A. Harris, Synth. Commun., 2008, 38, 3996–4006 CrossRef CAS.
- Z. M. Nofal, M. I. El-Zahar and A. El-Karim, Molecules, 2000, 5, 99–113 CrossRef CAS.
- N. Piller, in Coumarins: Biology, Applications and Mode of Action, John Wiley & Sons Ltd, 1997, pp. 185–208 Search PubMed.
- M. Zahradník, The production and application of fluorescent brightening agents, Wiley, 1982 Search PubMed.
- M. M. Heravi, S. Sadjadi, H. A. Oskooie, R. H. Shoar and F. F. Bamoharram, Catal. Commun., 2008, 9, 470–474 CrossRef CAS.
- S. A. Soliman, M. S. Metwally, S. R. Selim, M. A. Bedair and M. A. Abbas, J. Ind. Eng. Chem., 2014, 20, 4311–4320 CrossRef CAS.
- S. Kumaraguru, R. Pavulraj and S. Mohan, Trans. IMF, 2017, 95, 131–136 CrossRef CAS.
- M. Zhang, L. Ma, L. Wang, Y. Sun and Y. Liu, ACS Appl. Mater. Interfaces, 2018, 10, 2259–2263 CrossRef CAS PubMed.
- S. Duan, B. Dou, X. Lin, S. Zhao, W. Emori, J. Pan, H. Hu and H. Xiao, Colloids Surf., A, 2021, 624, 126836 CrossRef CAS.
- A. Dehghani, F. Poshtiban, G. Bahlakeh and B. Ramezanzadeh, Constr. Build. Mater., 2020, 239, 117812 CrossRef CAS.
- A. S. Fouda, S. E. H. Etaiw and G. S. Hassan, Sci. Rep., 2021, 11, 1–16 CrossRef PubMed.
- A. M. Alshima'a, A. Hefnawy, V. Langer, M. A. Khatab, L. Öhrstrom and M. A. M. Abu-Youssef, Polyhedron, 2009, 28, 2794–2802 CrossRef.
- A. S. Fouda, S. E.-D. H. Etaiw, M. M. El-bendary and M. M. Maher, J. Mol. Liq., 2016, 213, 228–234 CrossRef CAS.
- S. E. H. Etaiw, A. S. Fouda and M. M. El-bendary, Prot. Met. Phys. Chem. Surf., 2013, 49, 113–123 CrossRef CAS.
- I. K. Nwokolo, H. Shi, A. Ikeuba, N. Gao, J. Li, S. Ahmed and F. Liu, Coatings, 2022, 12, 1288 CrossRef CAS.
- S. E. H. Etaiw, A. S. Fouda, S. A. Amer and M. M. El-bendary, J. Inorg. Organomet. Polym. Mater., 2011, 21, 327–335 CrossRef CAS.
- M. A. Khaled, M. A. Ismail, A. A. El-Hossiany and A. S. Fouda, RSC Adv., 2021, 11, 25314–25333 RSC.
- S. E. H. Etaiw, M. M. El-bendary, A. S. Fouda and M. M. Maher, Prot. Met. Phys. Chem. Surf., 2017, 53, 937–949 CrossRef CAS.
- S. Zafari, M. N. Shahrak and M. Ghahramaninezhad, Met. Biomater. Interfaces, 2020, 26, 25–38 Search PubMed.
- S. E. H. Etaiw, H. Marie and F. A. Elsharqawy, Appl. Organomet. Chem., 2020, 34, e5831 CAS.
- A. Altomare, G. Cascarano, C. Giacovazzo, A. Guagliardi, M. C. Burla, G. t Polidori and M. Camalli, J. Appl. Crystallogr., 1994, 27, 435–436 Search PubMed.
- A. Asan, S. Soylu, T. Kıyak, F. Yıldırım, S. G. Öztaş, N. Ancın and M. Kabasakaloğlu, Corros. Sci., 2006, 48, 3933–3944 CrossRef CAS.
- H. Hanika-Heidl, S. E. H. Etaiw, M. S. Ibrahim, A. S. B. El-din and R. D. Fischer, J. Organomet. Chem., 2003, 684, 329–337 CrossRef CAS.
- S. E. H. Etaiw and S. N. A. Abdou, J. Inorg. Organomet. Polym. Mater., 2010, 20, 622–627 CrossRef CAS.
- A. M. Salem, A. M. Wahba, A. El Hossiany and A. S. Fouda, J. Indian Chem. Soc., 2022, 99, 100778 CrossRef CAS.
- F. Tirbonod and C. Fiaud, Corros. Sci., 1978, 18, 139–149 CrossRef CAS.
- D. T. W. Chu, A. K. Claiborne, J. J. Clement and J. J. Plattner, Can. J. Chem., 1992, 70, 1328–1337 CrossRef CAS.
- J. Frigola, J. Pares, J. Corbera, D. Vano, R. Merce, A. Torrens, J. Mas and E. Valenti, J. Med. Chem., 1993, 36, 801–810 CrossRef CAS PubMed.
- G. B. Barlin, T. M. T. Nguyen, B. Kotecka and K. H. Rieckmann, Aust. J. Chem., 1992, 45, 1651–1662 CrossRef CAS.
- A. A. Al-Amiery, A. A. H. Kadhum, A. Kadihum, A. B. Mohamad, C. K. How and S. Junaedi, Materials, 2014, 7, 787–804 CrossRef PubMed.
- A. B. Mohamad, A. A. H. Kadhum, A. A. Al-Amiery, L. C. Ying and A. Y. Musa, Met. Biomater. Interfaces, 2014, 20, 459–467 CAS.
- N. O. Eddy and P. A. P. Mamza, Port. Electrochim. Acta, 2009, 27, 443–456 CrossRef CAS.
- R. M. Dakhil, T. S. Gaaz, A. A. Al-Amiery and A. A. H. Kadhum, Green Chem. Lett. Rev., 2018, 11, 559–566 CrossRef CAS.
- G. Banerjee and S. N. Malhotra, Corrosion, 1992, 48, 10–15 CrossRef CAS.
- S. A. Abd El-Maksoud, Corros. Sci., 2002, 44, 803–813 CrossRef CAS.
- A. S. Fouda, S. A. Abd El-Maksoud, A. A. M. Belal, A. El-Hossiany and A. Ibrahium, Int. J. Electrochem. Sci., 2018, 13, 9826–9846 CrossRef CAS.
- B. F. Abdel-Wahab, H. A. Mohamed and A. A. Farhat, Org. Commun., 2014, 7, 1 Search PubMed.
- S. Leleu, B. Rives, N. Caussé and N. Pébère, J. Magnesium Alloys, 2019, 7, 47–57 CrossRef CAS.
- M. Behpour, S. M. Ghoreishi, N. Soltani, M. Salavati-Niasari, M. Hamadanian and A. Gandomi, Corros. Sci., 2008, 50, 2172–2181 CrossRef CAS.
- A. S. Fouda, A. El-Mekabaty, I. E. I. Shaaban and A. El-Hossiany, Prot. Met. Phys. Chem. Surf., 2021, 57, 1060–1075 CrossRef CAS.
- A. S. Fouda, S. A. A. El-Maksoud, A. El-Hossiany and A. Ibrahim, Int. J. Electrochem. Sci., 2019, 14, 6045–6064 CrossRef CAS.
- M. J. S. Dewar and D. M. Storch, J. Am. Chem. Soc., 1985, 107, 3898–3902 CrossRef CAS.
- E. A. Noor and A. H. Al-Moubaraki, Mater. Chem. Phys., 2008, 110, 145–154 CrossRef CAS.
- T. Koopmans, Physica, 1933, 1, 104–113 CrossRef CAS.
- A. F. S. A. Rahiman and S. Sethumanickam, Arabian J. Chem., 2017, 10, S3358–S3366 CrossRef.
- B. Tan, J. He, S. Zhang, C. Xu, S. Chen, H. Liu and W. Li, J. Colloid Interface Sci., 2021, 585, 287–301 CrossRef CAS PubMed.
- I. B. Obot, Z. M. Gasem and S. A. Umoren, Int. J. Electrochem. Sci., 2014, 9, 510–522 Search PubMed.
- X. Li, S. Deng, N. Li and X. Xie, J. Mater. Res. Technol., 2017, 6, 158–170 CrossRef CAS.
- L. Ge, F. Zuo, J. Liu, Q. Ma, C. Wang, D. Sun, L. Bartels and P. Feng, J. Phys. Chem. C, 2012, 116, 13708–13714 CrossRef CAS.
Footnote |
| † Electronic supplementary information (ESI) available. See DOI: https://doi.org/10.1039/d3ra01644g |
| This journal is © The Royal Society of Chemistry 2023 |


