 Open Access Article
Study on the concentration retrieval of SO2 and NO2 in mixed gases based on the improved DOAS method
Yibiao Yang ab,
Jianing Wang*a,
Zihui Zhanga and
Guanyu Lina
aA Changchun Institute of Optics, Fine Mechanics and Physics, Chinese Academy of Sciences, Changchun 130033, China
bUniversity of Chinese Academy of Sciences, Beijing 100049, China. E-mail: qazedcfv@sina.com
First published on 23rd June 2023
Abstract
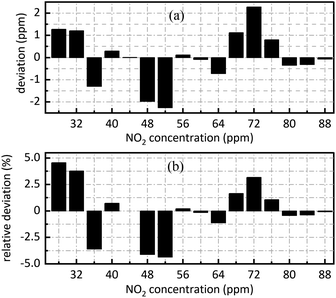
NO2 and SO2 are important components of air pollutants, and their absorption spectra are superimposed at 193–253 nm. The superposed spectra affect the gas concentration retrieval based on the ultraviolet differential optical absorption spectroscopy (DOAS) method. In this study, a suitable wavelength band was chosen for concentration retrieval, moreover, the characteristics of the quasi-periodic variation of absorption cross-section with wavelength was given sufficient attention and then the superposed spectra were separated by the Fast Fourier transform (FFT) method. The concentration of the gases to be measured was calculated according to the relationship between the amplitude of absorbance after FFT and the gas concentration. The experimental results prove that by using an absorption cell with a 700 mm optical path, the relative deviation absolute value of the retrieval concentration of SO2 in a NO2 and SO2 gas mixture is less than 1.471%, and that of NO2 in a NO2 and SO2 gas mixture is less than 7.207%. The method has good adaptability, high detection precision, whether single SO2, NO2 or a mixture of both, and important reference value for the development of DOAS and future research on the high-precision detection of more types of mixed gases in the ultraviolet band, such as gas mixtures of NO2, SO2 and NO in flue gas.
1. Introduction
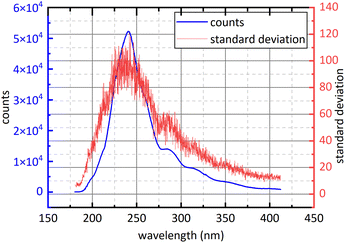
Controlling the release of air pollutants is an important part of ecological environment protection.1 NO2 and SO2 play a predominant role in atmospheric pollutants. SO2 and NO2 in the air mainly come from the combustion of fossil fuels, such as thermal power plant exhaust emissions, motor vehicle exhaust emissions and boiler flue gas emissions.2,3 SO2 and NO2 could cause building corrosion, acid rain, chemical smoke, air contamination and damage to human health,1 so the measurement technique for SO2 and NO2 has important application value.2–4At present, the methods of detecting NO2 and SO2 mainly include metal oxide sensor methodology5–8 and spectroscopic methodology. Metal oxide sensor is widely used because of low price while the stability of metal oxide sensor will decrease with the increase of working time, resulting in excessive deviations in measurement results.1,5 Spectroscopic methodology has the advantages of high reliability, low economic cost, easy maintenance and strong scalability. Spectroscopic methodology is also divided into chemiluminescence (CL),9 tunable diode laser absorption spectroscopy (TDLAS),4 non-dispersive infrared spectroscopy (NDIR),2,10 differential optical absorption spectroscopy (DOAS) and photoacoustic spectroscopy (PAS),11 etc. CL is to convert NO2 into NO and then to measure the concentration of NO. Its advantages are large linear range and good sensitivity but its disadvantage is easy to convert NOX into NO, resulting in measurement deviations increase.12 The infrared light used in NDIR is susceptible to interference from water-vapour absorption and poor species selectivity of gases detection.13,14 TDLAS has high detection accuracy but only detects one gas at a time, furthermore, the equipment is expensive and poor scalability.1 PAS has high environmental requirement, is vulnerable to the interference from environmental noise and only detects one gas at a time. DOAS usually use deuterium lamp or xenon lamp as detection system light source so it has wide detection wavelength and can detect several kinds of gases simultaneously with low cost relative to other method of gas detection. However, because of the poor collimation of deuterium lamp, the optical path of DOAS is shorter than other method so DOAS has limited detection accuracy. DOAS has also the advantages of high selectivity, high reliability, excellent stability and high anti-interference performance,15–17 so it has good economic applicability and broad application prospects. To avoid difficulties in data processing caused by the superposition of gases absorption spectra, the detection of SO2 and NO2, in traditional DOAS measurements, usually uses 290 nm–315 nm (ref. 18) and 323 nm–335 nm (ref. 18) respectively. However, with the progress of Chinese environmental policy, the release of NO2 and SO2 has subjected to more stringent.20 For example, Chinese government issued that the concentration of NO2 and SO2 emitted by thermal power plants shouldn't exceed 48.7 ppm and 35 ppm respectively in 2011.21 The SO2 absorption cross-section at 290 nm–315 nm is small as shown in Fig. 1,22 so the signal-to-noise ratio of SO2 spectral signal is small under very low emission conditions. Moreover, in order to obtain ultraviolet (UV) continuous spectrum, deuterium lamps are often used as light sources in detection system.1 However, deuterium lamp is dark at 323 nm–335 nm as show in Fig. 2. It isn't conducive to obtain sufficient signal-to-noise ratio for NO2 absorption spectral signal. The above problems limit the use of DOAS technology in the field of multi-gas simultaneous detection and high-precision detection, for example, flue gases composition detection. Compared with the traditional band at 290 nm–315 nm, SO2 and NO2 have relatively big absorption cross-section at 193 nm–253 nm, and deuterium light is strong in this interval. They are beneficial to obtain high signal-to-noise ratio. However, the absorption cross-section of SO2 and NO2 at 193 nm–253 nm is continuous, so aliasing phenomenon exists. It brings difficulties to data processing.
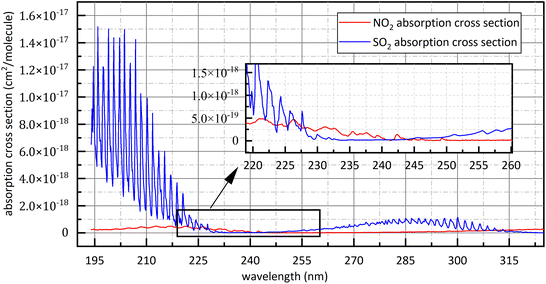 | ||
| Fig. 1 The absorption cross-section of SO2 and NO2 at 193 nm–325 nm.22 | ||
Facing the above problems, Bo Peng etc.1,21,23 studied SO2 in single gas and the mixed gases of NO2, NO and SO2 based on FFT and inverse Fourier transform method at 206 nm–213 nm. SO2 was measured in the concentration range from 1 ppm to 30 ppm with the maximum deviation of 0.24 ppm. However, single NO2 and the NO2 in mixed gases need to be studied further. In addition, the spectral separation method he used can be further improved to remove well the influence of superposed spectra.
This paper made full use of the characteristic of quasi-periodic variation of absorption cross-section with wavelength of the gases to be measured. The absorbance was subjected to FFT and then the concentrations of SO2 and NO2 were retrieved according to the relationship between the amplitude of absorbance after FFT and the concentration of the gases to be measured. The experimental results have shown that this method can separate superposed spectra in mixed gases measurement. This method is suitable for the gas concentration retrieval whose absorption cross-section varies quasi-periodically with wavelength. It is helpful for the separation of superposed absorption spectra. It has strong anti-interference ability and provides important reference value for the development of gases detection instrument based on DOAS principle.
2. Theory
2.1 Differential absorption spectrum
The propagation of light at the specific wavelength in the specific gas can be expressed by Lambert–Beer law as shown in eqn (1).1,14,24 Where I0(λ) is the light intensity at the wavelength λ which isn't absorbed by the gas to be measurement, I(λ) is the light intensity of transmission out absorption cell through gas absorption, σ(λ) is the absorption cross-section of the gas to be measured (cm2 per molecule) , C is the gas concentration (molecule per cm3), and L is the optical path (cm) of light propagation in the gas.| I(λ) = I0(λ) × exp[−σ(λ)CL] | (1) |
In DOAS theory, the gas absorption cross-section σ(λ) is composed of two parts as shown in eqn (2).14 The first part is fast-varying part σf(λ) that varies rapidly with wavelength. The second part is slow-varying part σs(λ) that varies slowly with wavelength. Hence, eqn (1) can be adjusted to eqn (2).14
| I(λ) = I0(λ) × exp[−(σf(λ) + σs(λ))CL] | (2) |
In addition, Rayleigh scattering and meter scattering of gas molecules also can reduce initial light intensity. They varies more slowly with wavelength than slow-varying part, so eqn (1) can be revised as eqn (3).24
| I(λ) = I0(λ) × exp[−(σf(λ) + σs(λ))CL − εR(λ) − εM(λ)] | (3) |
Since nitrogen has almost no absorb at 193 nm–253 nm, only Rayleigh and Mie scattering, Rayleigh and Mie scattering can be replaced by completely filling absorption cell with nitrogen. When the gas chamber passes into nitrogen gas, the light intensity received by spectrometer is  as shown in eqn (4).24 Take the logarithm of eqn (3) as shown in eqn (5). A(λ) is absorbance in eqn (5).
 | (4) |
 | (5) |
The absorbance expressed in eqn (5) has the aliasing effect of fast-varying part and slow-varying part. In order to improve signal-to-noise ratio and eliminate the influence of hardware device on absorbance, slow-varying part can be filtered out by filtering method, and the concentration of the gas to be measurement can be expressed by the information of fast-varying part.25,26 The remaining part after filtering the slow-varying part is defined as differential absorbance DOD(λ) as described in eqn (6).14
| DOD(λ) = σf(λ)CL | (6) |
According to eqn (6), the linear relationship between the gas concentration C and differential absorbance DOD(λ) can be obtained. It is the theoretical basis for the concentration retrieval of DOAS.
2.2 Spectrum superposition law
In fact, in situ measurement the gases to be measured is often the mixture of several kinds of gases, and their absorption spectrum will superpose at the wave band to be measured. The absorption spectrum of several kinds of gases at the same wavelength can be expressed by spectrum superposition law as shown in eqn (7).24 σif(λ) and σis(λ) are the fast-varying part and slow-varying part of the i-th gas at the wavelength λ respectively. I(λ) is the transmission intensity of the light passing through the gases to be measured. Ci is the concentration of the i-th gas. Other parameters are defined as the same as eqn (3). Rayleigh scattering and Mie scattering are treated as single gas. The absorbance equation of the mixed gases is given as eqn (8). The remaining part after filtering out slow-varying part is defined as differential absorbance DOD(λ) of the mixed gases.24
 | (7) |
 | (8) |
 | (9) |
The absorbance A(λ) of the mixed gases contains the concentration information of several kinds of gases, so it is difficult to find a suitable algorithm to completely filter out the slow-varying part of various components in the mixed gases. It is also one of the reasons that hinder the extensive use of DOAS.
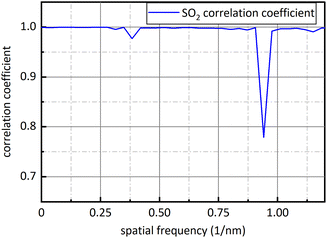
Fortunately, the absorption cross-section of SO2 at 193 nm–225 nm and 280 nm–315 nm as shown in Fig. 1 show the characteristic of quasi-periodic variation, and the energy in frequency domain is relatively centralized. The level of frequency domain energy is related to gas concentration, and the position of frequency domain energy is related to gas type.18 In frequency domain, we can avoid the mutual interference from different kinds of gases.18 The similar characteristic can be observed at the absorption cross-section of NO2 at 200 nm–253 nm. They provide conditions for the separation of the superposed spectra of SO2 and NO2 at 193 nm–253 nm. According to the above analysis results, absorbance was firstly treated by the method of FFT in this study and then gas concentration was retrieved by using the relationship between the amplitude of absorbance after FFT and the gas concentration to be measured.
2.3 Selection of the study band
Firstly, in study band, light source should have sufficient intensity to ensure sufficient signal-to-noise ratio and large concentration measurement range. In order to avoid the superposition of the absorption spectra of different kinds of gases, 323 nm–335 nm is often used for NO2 concentration retrieval.19 The emission spectrum of deuterium lamp is shown in Fig. 2. At 323 nm–335 nm, deuterium lamp has small light intensity, so previous measurements of NO2 in this band had small signal-to-noise ratio and small concentration measurement range.Secondly, the gases absorption cross-section at study band should varies quasi-periodically with wavelength and should be as large as possible. At 193 nm–225 nm and 275 nm–313 nm, SO2 shows completely different absorption characteristics27,28 as shown in Fig. 1. Compared with 275 nm–313 nm, SO2 has larger absorption cross-section and higher oscillation frequency at 193 nm–225 nm, so the spectral signal of SO2 has higher signal-to-noise ratio at 193 nm–225 nm. Therefore, 193 nm–223 nm was chosen for SO2 study. The absorption cross-section of NO2 quasi-periodically varies at 193 nm–223 nm band. However, the absorption cross-section of SO2 in this band is dozens of times that of NO2, so spectral signal of NO2 is easily overwhelmed by that of SO2 when the gases to be measured is the mixed gases of NO2 and SO2. The absorption cross-section of NO2 at 228 nm–253 nm varies quasi-periodically with wavelength, and deuterium lamp also has big light intensity. They provide good conditions for NO2 study. Therefore, in this study, 228 nm–253 nm was chosen for NO2 study. Besides, it is known in Fig. 1 that at study band the absorption cross-section of NO2 is superimposed with that of SO2. It is therefore necessary to measure the mixture of SO2 and NO2 to verify the applicability of separation algorithm.
3. Experiments
3.1 Experimental setup and principle
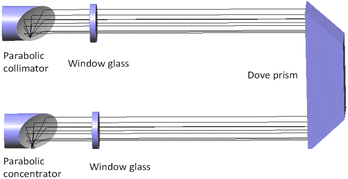
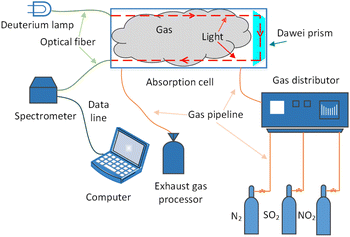
The schematic diagram of the experiment is shown in Fig. 4. The light source of the detection system is deuterium lamp (Hamamatsu L6301, Japan). The effective spectrum range of the deuterium lamp is from 185 nm to 400 nm and its emission spectrum is shown in Fig. 2. The light emitted by the deuterium lamp is coupled into an anti-UV quartz fiber. The anti-UV quartz fiber has little light intensity loss and its numerical aperture is 0.22. The outgoing light of the optical fiber enters a homemade gas absorption cell. The design of the absorption cell will be detailed later. Photons at the specific wavelength are absorbed by the specific gas molecules in the absorption cell. Remaining unabsorbed light is transmitted out the absorption cell and transmitted to a UV spectrometer (GanWei GW-5040, China) by another anti-UV quartz fiber. The spectrometer can transmit spectral signal to computer by a data line. Due to the use of incoherent light source, the interference between the light can be ignored.18 The resolution of the spectrometer is 0.1 nm and its detectable wavelength range is from 180 nm to 400 nm. Tested gases are discharged into atmosphere after tail gases treatment.The light trace of the absorption cell is shown in Fig. 3. The outgoing light of the optical fiber connected to the deuterium lamp was reflected by a parabolic collimator (Thorlabs MPD01M9-F01, USA) into the absorption cavity with melting quartz window glass. UV-reinforced aluminum has high reflectivity and melting quartz window glass absorbs little in ultraviolet band. They can reduce the loss of light intensity. After the light in the absorption cavity is absorbed by gases for the first time, it illuminates on a melting quartz Dove prism. The light reflected by the Dove prism is absorbed by gases for the second time and then reflected to another anti-UV fiber by a parabolic concentrator (Thorlabs MPD01M9-F01, USA). The optical path of the absorption cell is 700 mm. According to experimental data and eqn (10),18 the signal-to-noise ratio of the experimental system can reach 24.955 dB at 237.5 nm.
SNR = 20![[thin space (1/6-em)]](https://www.rsc.org/images/entities/char_2009.gif) lg(IS/IN) lg(IS/IN)
| (10) |
The experimental gases come from Dalian Great Special Gas Co., Ltd. Nitrogen is high purity nitrogen with concentration of 99.999%, the NO2 concentration is 195.2 ppm, the SO2 concentration is 170 ppm, and this three gases can be mixed into various gases concentration to be measured. The composition ratio of mixed gases is controlled by gas distributor (SWISSGAS Sonimix7100, Switzerland) with the control accuracy of 0.5%. Four kinds of gases can be mixed by using it and nitrogen is dilution gas in which.
3.2 Experimental method
During the whole experiment, the outlet pressure of the gas cylinder pressure relief valves was maintained between 1.3 kPa and 1.5 kPa that met the pressure requirements of the gas distributor for input gas. The gases flow rate flowing into the absorption cell was 350 ml min−1. Spectral signal was denoted as when the absorption cell was completely filled with pure nitrogen. Spectral signal was denoted as I(λ) when the absorption cell was passed into the gases to be measure. The integration time of the spectrometer was 19 ms so that collected light intensity didn't exceed the maximum value of the detector and the collected spectral signal had sufficient signal-to-noise ratio. Fifty sets of spectral signal were collected for each gas measurement. When replacing sample gas, the gases to be tested was passed into the absorption cell for 200 s to ensure that last measured gases was completely exhausted and then data collection started. The absorption spectrum of nitrogen was measured every 10 gases samples throughout the whole experiment. The whole experimental procedure was performed at room temperature and atmospheric pressure. Under these conditions temperature and atmospheric pressure had little influence on the experiment results so the effect of temperature and pressure on the experimental results were ignored.
4. Methods and results
4.1 Oxygen absorption spectrum processing
During the whole experiment process, the spectrometer wasn't in vacuum or pure nitrogen environment, so spectral signal received by the spectrometer was inevitably effected by oxygen absorption in the air. However, the oxygen concentration in the air was relatively stable and wouldn't vary too much during the whole measurement process. In addition, the absorption cross-section of oxygen in measured band was smaller than the gases to be measured, so the absorption of oxygen was constant that could be removed by data processing. The detailed derivation process is as follows. The absorption of nitrogen is shown in eqn (12), and the absorption equation of SO2, NO2 or the mixed gases of both is shown in eqn (13). Comparing eqn (12) to (13) and then taking logarithm the result is shown in eqn (14). It show that in the measurement process the absorption of oxygen in the air wouldn't affect measurement results.
 | (12) |
 | (13) |
 | (14) |
4.2 Measurement of SO2 and NO2
| CSO2 = 564.783 × AMPSO2 − 18.2009 | (15) |
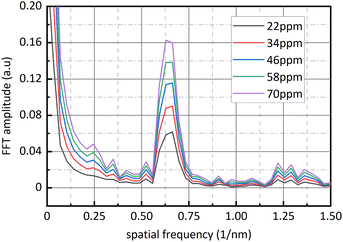
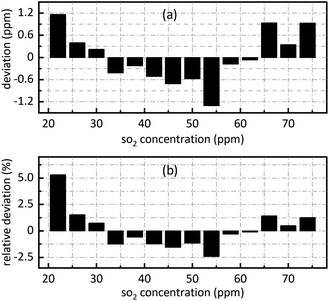
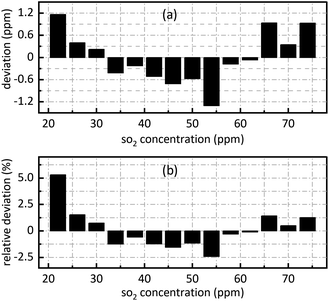
The retrieval results of SO2 are shown in Fig. 7. Fig. 7(a) shows the deviation between the retrieval concentration and the actual concentration. The minimum value is −1.308 ppm when SO2 actual concentration is 54 ppm in Fig. 7(a). Fig. 7(b) shows the relative deviation between the retrieval concentration and the actual concentration. It shows that there is a good linear relationship between the peak value at 0.628 nm−1 of SO2 absorbance after FFT and actual concentration. Its goodness of fit reaches 0.9982 which was conductive to accurate concentration retrieval.
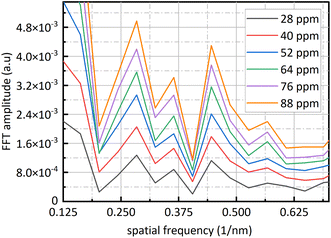
Fig. 9 is sixteen groups NO2 samples correlation analysis between the amplitude at 0.284 nm−1 of NO2 absorbance after FFT and NO2 concentration ranging from 28 ppm to 88 ppm at 4 ppm intervals. Their correlation coefficient reaches 0.998. It shows that there is a strong linear relationship between NO2 concentration and the amplitude at 0.284 nm−1, and NO2 concentration can be retrieved according to the amplitude at 0.284 nm−1. The fit relationship between the peak value at 0.284 nm−1 and the NO2 concentration is eqn (16).
| CNO2 = 16588.192 × AMPNO2 + 5.543 | (16) |
 | (17) |
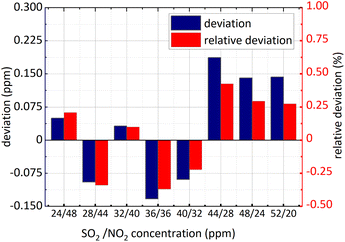
Firstly, NO2 concentration remained unchanged and was 36 ppm, and SO2 concentration changed; secondly, both the concentration of NO2 and SO2 changed. The concentration retrieval method of the gas mixture was consistent with that of single gas. Firstly, FFT was employed for the absorbance of the mixed gases at 193 nm–223 nm and then the amplitude at 0.628 nm−1 was substituted into eqn (15) to obtain SO2 concentration. The retrieval results of SO2 concentration are shown in the following Fig. 11 and 12.
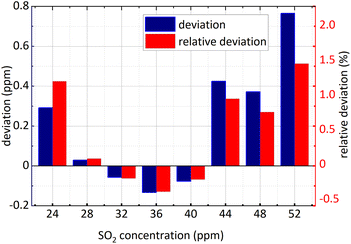 | ||
| Fig. 11 SO2 concentration retrieval in NO2 and SO2 gases mixture (NO2 concentration remained unchanged). | ||
The minimum relative deviation of the retrieval concentration is −1.471% when SO2 actual concentration is 52 ppm and NO2 actual concentration is 36 ppm known in the Fig. 11 and 12. The experimental results indicate that in NO2 and SO2 mixture, the retrieval concentration of SO2 can still obtain high retrieval accuracy based on the method of FFT amplitude.
| CNO2 = 20424.098 × AMPNO2 − 0.0889 × CSO2 + 7.546 | (18) |
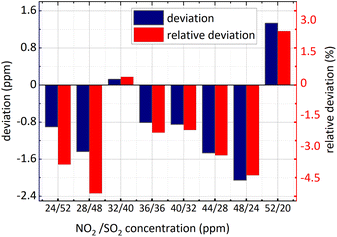
What different from eqn (16) is an extra SO2 influence coefficient in eqn (18). There are two reasons about it, on the one hand, at 228 nm–253 nm, NO2 absorption cross-section is relatively small and the spectral signal of NO2 is susceptible to that of SO2; on the another hand, the absorption cross-section of SO2 varies with wavelength quasi-periodically rather than periodically, so a component is present at 0.284 nm−1. In eqn (18) CSO2 represents SO2 concentration which can be obtained by eqn (15). To verify the applicability of the algorithm, kept 36 ppm SO2 concentration unchanged firstly, NO2 concentration changed and then the concentration of SO2 and NO2 changed simultaneously. The concentration retrieval results are shown in Fig. 13 and 14.
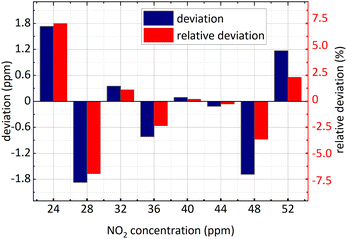 | ||
| Fig. 13 NO2 concentration retrieval in SO2 and NO2 gases mixture (SO2 concentration remained unchanged). | ||
It is known in the Fig. 13 and the Fig. 14 that: (1) the minimum relative deviation of the retrieval results is −7.207% when NO2 actual concentration is 24 ppm and SO2 actual concentration is 36 ppm. (2) There is no significant difference in the retrieval deviation of NO2, whether SO2 concentration changed or not. It shows that the concentration retrieval process of NO2 based on the relationship between FFT amplitude and NO2 concentration can well remove the interference from SO2.
It can be seen that from the retrieval results of SO2 and NO2 in the mixed gases, no matter whether the concentration of interfering gas changed, the deviation of SO2 concentration retrieval is significantly less than that of NO2. This is because the absorption cross-section of SO2 is larger than that of NO2, so the high signal-to-noise ratio of SO2 absorption spectrum can be obtained. It is clear that SO2 is more suitable than NO2 for gas concentration retrieval based on the method of FFT amplitude.
4.3 Comparison with the retrieval results of other methods
SO2 is gas that is widely studied based on DOAS principle. Therefore, SO2 in mixed gases is used to compare the concentration retrieval deviation by using different separation methods of superposed spectra. As shown in Table 1, using the amplitude of absorbance after FFT and selecting appropriate retrieval band have higher retrieval accuracy than using the iterative subtraction filter at 206 nm–213 nm and the FFT-IFF method at 280 nm–320 nm.5. Conclusions
In this paper, in hardware, the homemade gas absorption cell was used. In algorithm, FFT was used to transfer the absorbance of SO2, NO2 or the mixture of both from wavelength domain to frequency domain, and gas concentration was retrieved based on the relationship between the amplitude of absorbance after FFT of the gas to be measured and gas actual concentration. The experimental results show that the relative deviation absolute value of the retrieval concentration of single SO2 gas is less than 5.307%, that of single NO2 gas is less than 4.553%, that of SO2 in NO2 and SO2 gases mixture is less than 1.471%, and that of NO2 in NO2 and SO2 gases mixture is less than 7.207%.It can be seen that using the amplitude of absorbance after FFT of SO2, NO2 or the mixture of both and selecting appropriate retrieval band to retrieve gas concentration has higher detection accuracy than other methods. Regarding that the frequency resolution after FFT relates to spectrum numbers that was collected in study band, more spectrum numbers more high frequency resolution, the detection precision can be further improved by higher resolution spectrometer. In addition more longer absorption cell can also improve detection precision.
This paper fully utilizes the large absorption cross-section of NO2 and SO2 and their quasi-periodic variation with wavelength at 193 nm–253 nm, making it possible to detect the low concentration mixed gases of NO2 and SO2. Simultaneously, it also provides a feasible method for future research on high-precision detection of more types of mixed gases in ultraviolet band, such as gas mixture of NO2, SO2, NO in flue gas.
Author contributions
Yibiao Yang: conceptualization, methodology, software, investigation, writing-original draft, data curation. Jianing Wang: formal analysis, writing – review & editing and visualization. Zihui Zhang: validation, resources and supervision. Guanyu Lin: project administration and funding acquisition.Conflicts of interest
There are no conflicts to declare.Acknowledgements
This work was supported by National Natural Science Foundation of China under Grant 62005268; Key Research and Development Program of JiLin Province under Grant 20210203174SF and 20220203195SF.References
- B. Peng, Y. Zhou, G. Liu, Y. He, C. Gao and Y. Guo, Spectrochim. Acta, Part A, 2020, 233, 118169 CrossRef CAS PubMed.
- M. Xu, C. Gao and Y. Guo, Optik, 2022, 262, 169351 CrossRef CAS.
- A. Richter, J. Burrows and H. Nüβ, et al., Nature, 2005, 437, 129–132 CrossRef CAS PubMed.
- Z. Qu, O. Werhahn and V. Ebert, Appl. Spectrosc., 2018, 72, 853–862 CrossRef CAS PubMed.
- Y. Zhou, X. Li, Y. Wang, H. Tai and Y. Guo, Anal. Chem., 2019, 91, 3311–3318 CrossRef CAS PubMed.
- Y. Zhou, C. Gao and Y. Guo, J. Mater. Chem. A, 2018, 6, 10286–10296 RSC.
- Y. Zhou, G. Liu, X. Zhu and Y. Guo, Sens. Actuators, B, 2017, 251, 280–290 CrossRef CAS.
- S. Lee, B. Hwang, H. Choi, S. Kim and S. Jung, Sens. Actuators, B, 2011, 160, 1328–1334 CrossRef CAS.
- K. Gasmi, A. Aljalal, W. Al-Basheer and M. Abdulahi, Urban Clim., 2017, 21, 232–242 CrossRef.
- C. E. Stockwell, A. Kupc, B. Witkowski, R. Talukdar, Y. Liu, V. Selimovic, K. Zarzana, K. Sekimoto, C. Warneke, R. Washenfelder, R. Yokelson, A. Middlebrook and J. Roberts, Atmos. Meas. Tech., 2018, 11, 2749–2768 CrossRef CAS.
- L. Liu, H. Huan, W. Li, A. Mandelis, Y. Wang, L. Zhang, X. Zhang, X. Yin, Y. Wu and X. Shao, Photoacoustics, 2021, 21, 100228 CrossRef PubMed.
- A. Al-Jalal, W. Al-Basheer, K. Gasmi and M. S. Romadhon, Measurement, 2019, 146, 613–617 CrossRef.
- J. Li, B. Yu and H. Fischerb, Appl. Spectrosc., 2015, 69, 496–506 CrossRef CAS PubMed.
- X. Zhang, Z. Cui, Z. Cheng, Y. Li and H. Xiao, RSC Adv., 2017, 7, 50889 RSC.
- T. Wang, F. Hendrick, P. Wang, G. Tang, K. Clémer, H. Yu, C. Hermans, C. Gielen, J. F. Müller, G. Pinardi, N. Theys and H. Brenot, Atmos. Chem. Phys., 2014, 14, 11149–11164 CrossRef.
- C. Rivera, G. Sosa, H. Wöhrnschimmel, B. deFoy, M. Johansson and B. Galle, Atmos. Chem. Phys., 2009, 9, 6351–6361 CrossRef CAS.
- L. Wang, Y. G. Zhang, X. Zhou, F. Qin and Z. G. Zhang, Sens. Actuators, B, 2017, 241, 146–150 CrossRef CAS.
- B. Peng, C. Gao, Y. Zhou and Y. Guo, Sens. Actuators, B, 2020, 312, 127988 CrossRef CAS.
- U. Platt, D. Perner and H. W. Pätz, J. Geophys. Res., B, 1979, 84, 6329–6335 CrossRef CAS.
- Specifications and Test Procedures for Continuous Emission Monitoring Systems of Flue Gas Emitted From Stationary Sources, State Environmental Protection Administration of China, 2007 Search PubMed.
- Emission Standard of Air Pollutants for Thermal Power Plant, State Environmental Protection Administration of China, 2011 Search PubMed.
- H. Keller-Rudek, G. K. Moortgat, R. Sander and R. Sörensen, Earth Syst. Sci., 2012, 5, 365–373 CrossRef.
- B. Peng, C. Gao, Y. Guo and F. Chen, Proc. SPIE 10621, 2017 International Conference on Optical Instruments and Technology: Optoelectronic Measurement Technology and Systems, 2018, vol. 106211B Search PubMed.
- J. Zou and F. Wang, COL, 2020, 18(2), 021201 Search PubMed.
- M. Wenig, B. Jahne and U. Platt, Appl. Opt., 2005, 44(18), 3246–3253 CrossRef PubMed.
- J. Mellqvist and A. Rosen, J. Quant. Spectrosc. Radiat. Transfer, 1996, 56(2), 187–208 CrossRef CAS.
- Y. Zhang, Y. Wang, Y. Liu, X. Dong, H. Xia, Z. Zhang and J. Li, Spectrochim. Acta, Part A, 2019, 210, 120–125 CrossRef CAS PubMed.
- S. M. Ahmed and V. Kumar, J. Quant. Spectrosc. Radiat. Transfer, 1992, 47(5), 359–373 CrossRef CAS.
- Y. Zhao, X. Wang, D. Dai and Z. Dong, Meas. Sci. Technol., 2014, 25(2), 1–9 Search PubMed.
| This journal is © The Royal Society of Chemistry 2023 |

