 Open Access Article
Photodegradation of fleroxacin by g-C3N4/PPy/Ag and HPLC-MS/MS analysis of degradation pathways
Lei Ma†
a,
Lin Yang†b,
Laijun Lia,
Wu Zhanga,
Yuqing Chenga,
Lei Wanga,
Xiaoxuan Zhoua,
Yuguang Lv *a and
Mingyuan Liu*ab
aCollege of Pharmacy, Jiamusi University, Heilongjiang, China. E-mail: yuguanglv@163.com; liumingyuan12@163.com; Tel: +86 18697097060
bSchool of Basic Medical Sciences, Jiamusi University, Heilongjiang, China
First published on 17th April 2023
Abstract
To improve the photocatalytic activity of g-C3N4, graphitic phase carbon nitride was prepared using melamine as the substrate and modified with PPy and Ag nanoparticles. The structure, morphology, and optical properties of the photocatalysts were investigated using various characterization methods such as XRD, FT-IR, TEM, XPS, and UV-vis DRS. The degradation of fleroxacin, a common quinolone antibiotic, was isolated and measured using the HPLC-MS/MS technique to trace its intermediates and deduce the main degradation pathways. The results showed that g-C3N4/PPy/Ag had high photocatalytic activity and a degradation rate of more than 90%. The fleroxacin degradation reactions were primarily oxidative ring opening of the N-methyl piperazine ring structure, defluorination reactions on fluoroethyl, HCHO, and N-methyl ethylamine removal reactions.
1. Introduction
The sources of environmental pollution have now expanded from POPs to drugs with biochemical activity. Fleroxacin (FLE), a new type of fluoroquinolone antibiotic, is widely used in pharmaceuticals, livestock feed, etc.1,2 It has caused significant residues due to its long-term abuse and poses a significant risk to human health. Due to its wide distribution in water bodies, conventional water treatment technology is challenging to achieve efficient and green degradation of it. Therefore, finding an efficient and green degradation method is crucial to solving the pollution in water bodies.3–5Semiconductor photocatalysis is an efficient and green method for treating wastewater containing antibiotics. Among them, graphite-phase carbon nitride (g-C3N4) has received widespread attention due to its excellent photoelectric and physicochemical properties, simplicity of preparation, and lack of environmental pollution.6–8 However, it has disadvantages such as a small specific surface area and poor absorption of visible light, which restrict its practical application. Constructing them into heterojunctions with semiconductor materials can significantly enhance their catalytic properties. Matching with semiconductor energy bands results in higher conduction band sites and lower valence band sites, thus improving the redox performance of the material. At the same time, a potential difference will be formed on its surface, allowing photogenerated electrons (e−) and holes (h+) to be effectively separated, inhibiting the complexation of e−–h+.9,10 PPy is a narrow band gap semiconductor with a high absorption coefficient for visible light, a simple preparation process, non-toxicity, high carrier mobility, and good environmental stability. It has broad application prospects as an efficient electron donor, catalyst and photosensitizer.11–13 Research shows that introducing noble metal nanoparticles into semiconductor materials can effectively improve their photocatalytic performance by using its surface plasmon resonance (SPR) effect. The reasons for this are twofold: firstly, the broad spectral response and SPR effect of noble metals can be exploited to improve the light absorption efficiency during the reaction. The second is to improve photogenerated electrons and holes' generation and separation efficiency, thus significantly enhancing their photocatalytic performance.14,15 Compared with other precious metals, Ag nanoparticles are preferred by many researchers because of their large amount and low price. For this reason, in this study, PPy and Ag were chosen to modify g-C3N4 to improve the photocatalytic activity of g-C3N4.
Currently, there are many methods for the analysis of quinolone antibiotics. The traditional methods include fluorescence analysis, electrochemical analysis, and high-performance liquid chromatography (HPLC).16,17 Among them, when substances are detected by fluorescence analysis, the acidity and composition of the solution have a great influence on the fluorescence intensity, and the experimental conditions must be strictly controlled; electrochemical methods have studied the physicochemical properties of quinolone antibiotics, and the reproducibility between results is poor;18–21 high-performance liquid chromatography (HPLC) is currently the most commonly used analytical method, but its separation of complex matrix samples and sensitivity to complex matrix samples.22,23 High-performance liquid chromatography-tandem mass spectrometry (HPLC-MS/MS), a comprehensive analytical method that combines the high separation performance of HPLC with the high sensitivity of MS and the specificity characteristics for substance characterization, has been used by an increasing number of researchers to investigate the degradation pathways of quinolones in recent years.24–27 Therefore, this project proposes to use the HPLC-MS/MS technique to analyze the possible degradation pathways of quinolone antibiotics.
Based on the above references, g-C3N4 was modified with PPy and Ag in this study. The g-C3N4/PPy/Ag solid photocatalyst was constructed by a three-step method. Its structure and composition were characterized by X-ray diffraction (XRD), Fourier transforms infrared spectroscopy (FT-IR), transmission electron microscopy (TEM), and X-ray photoelectron spectroscopy (XPS), and its photocatalytic performance was analyzed by transient photocurrent response and ultraviolet-visible diffuse reflectance spectroscopy (UV-vis DRS). Photocatalytic experiments were performed to investigate g-C3N4/PPy/Ag degradation rate on FLE. In addition, the HPLC-MS/MS technique was applied to infer the degradation intermediates and the main degradation pathways.
2. Materials and methods
2.1. Materials
Melamine, polypyrrole (PPy), silver nitrate (AgNO3), vitamin C, and ethanol are all analytically pure, purchased from Tianjin Kaitong Chemical Reagent Co. Ltd. Fleroxacin, analytical pure, was purchased from Tianjin Kemiou Chemical Reagent Co. Ltd. All water used in the laboratory was deionized water.2.2. Synthesis of the photocatalysts
g-C3N4: 5 g of melamine was added to the crucible (50 mL), covered and sealed with aluminum foil, and placed in a muffle furnace. The temperature was raised to 550 °C (3 °C min−1) and held for 4 h. Then the product was filtered and dried in an oven at 80 °C to obtain a solid yellow powder.g-C3N4/PPy: a certain amount of g-C3N4 was dispersed in 100 mL of deionized water under stirring to obtain a suspension of 1 g L−1. The above suspension was mixed with 60 mg of PPy powder and placed in a water bath at 60 °C with vigorous stirring until all the solvents evaporated. The mixture was washed several times with distilled water, dried in an oven at 60 °C for 12 h, and ground for subsequent use.
g-C3N4/PPy/Ag: 40 mg of g-C3N4/PPy powder was dispersed in a glass vial containing vitamin C (1.5 g L−1, 150 mL), stirred for 1.5 h at 25 °C and then added AgNO3 (0.1 mol L−1, 1.3 mL) and sonicated for 5 h. Collect samples by centrifugation, wash them with deionized water and ethanol three times, and dry them in an oven at 60 °C.
2.3. Photocatalytic degradation experiments and analytical methods
Three sets of photocatalytic experiments were conducted on a photocatalytic degradation device (BBZM-I) with a 250 W xenon lamp as the light source to investigate the degradation of FLE by g-C3N4, g-C3N4/PPy, and g-C3N4/PPy/Ag photocatalysts, respectively. Different photocatalysts (50 mg) were added to the FLE solution (50 mL, 20 mg L−1) separately for 30 min under magnetic stirring for a dark reaction to establish the adsorption–desorption equilibrium. Take a proper amount of reaction solution for ultraviolet light test. Turn on the light for photodegradation and take an equal amount of sample solution for UV test every 1 h interval until the degradation was completed. The solution after each test was poured back into the reaction vessel. The degradation rate (D) of the samples was calculated according to the Lambert–Beer law:| D = (A0 − At)/A0 × 100% = (C0 − Ct)/C0 × 100% |
The sample solutions collected each time were filtered through a 0.45 μm microporous membrane. The concentration of FLE and intermediates for each sample was determined by HPLC-MS/MS (Dionex Ultimate 3000 UPLC, Thermo Scientific Q Exactive Series mass spectrometer).
2.4. Conditions for mass spectrometry and chromatography analysis
MS detection conditions: ion source: electron spray ion source (ESI), multiple reaction monitoring (MRM); spray voltage: 40 psi; capillary voltage 4000 V; the nebulizer gas at a flow rate of 12 L min−1; drying gas temperature: 350 °C.Chromatographic detection condition: Agilent Zorbax SB-C18 column (2.1 × 100 mm, 1.8 μm); column temperature: 30 °C; flow rate: 0.4 mL min−1; mobile phase: 0.2% formic acid (A) – acetonitrile (B). Table 1 shows the gradient elution process.
| Time (min) | Mobile phase A (%) | Mobile phase B (%) |
|---|---|---|
| 0.0 | 90 | 10 |
| 3.0 | 90 | 10 |
| 7.0 | 70 | 30 |
| 9.0 | 20 | 80 |
| 9.5 | 90 | 10 |
3. Results and discussion
3.1. Characterization of g-C3N4/PPy/Ag photocatalysts
As shown in Fig. 1(a), the XRD results of synthesized g-C3N4, g-C3N4/PPy and g-C3N4/PPy/Ag are as follows. In g-C3N4, the 27.8° characteristic peak of the lamellar stacking structure and the 13.0° characteristic peak of the planar triazine ring are consistent with the (002) and (100) crystal planes in the standard card (JCPDS no. 871526), respectively.28,29 The almost absence of impurity diffraction peaks indicates that the prepared g-C3N4 samples are well crystallized and pure. The peak intensities of g-C3N4/PPy and g-C3N4/PPy/Ag become more significant relative to g-C3N4, indicating a better quality crystal.30 In g-C3N4/PPy, the (002) crystal plane of g-C3N4 shifted at a lower angle relative to g-C3N4 and g-C3N4/PPy/Ag. This shift may be an error generated during the test.31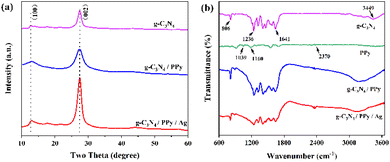 | ||
| Fig. 1 (a) XRD patterns of g-C3N4, g-C3N4/PPy and g-C3N4/PPy/Ag, (b) FT-IR spectra of g-C3N4, PPy, g-C3N4/PPy and g-C3N4/PPy/Ag. | ||
The FT-IR of synthesized g-C3N4, PPy, g-C3N4/PPy, and g-C3N4/PPy/Ag is displayed in Fig. 1(b). The bending vibration of the triazine heterocycle is responsible for the absorption peak of g-C3N4 at 806 cm−1, the stretching vibration of the C–N and C![[double bond, length as m-dash]](https://www.rsc.org/images/entities/char_e001.gif) N heterocyclic compounds is responsible for the absorption peak in the range of 1200–1700 cm−1, and the stretching vibration of the N–H and –OH of the adsorbed water molecules is responsible for the broad absorption peak in the range of 3000–3700 cm−1.32 It is evident that PPy has been effectively compounded on the material because the absorption peaks of g-C3N4/PPy and g-C3N4/PPy/Ag share the same characteristic absorption peak as PPy in the FT-IR spectrum at 2370 cm−1.33 It can be seen from the Fig. 1 that the composite samples have similar absorption bands as the single sample, indicating that the modification of PPy and Ag did not change the bonding structure of g-C3N4.
N heterocyclic compounds is responsible for the absorption peak in the range of 1200–1700 cm−1, and the stretching vibration of the N–H and –OH of the adsorbed water molecules is responsible for the broad absorption peak in the range of 3000–3700 cm−1.32 It is evident that PPy has been effectively compounded on the material because the absorption peaks of g-C3N4/PPy and g-C3N4/PPy/Ag share the same characteristic absorption peak as PPy in the FT-IR spectrum at 2370 cm−1.33 It can be seen from the Fig. 1 that the composite samples have similar absorption bands as the single sample, indicating that the modification of PPy and Ag did not change the bonding structure of g-C3N4.
The elemental composition of g-C3N4/PPy/Ag was analyzed using X-ray photoelectron spectroscopy (XPS), and the results are shown in Fig. 2. The survey spectrum is shown in Fig. 2(a), with three peaks at 288.18 eV, 372.63 eV, and 399.19 eV, corresponding to the C 1s, Ag 3d, and N 1s signals, respectively. As a result, the compound photocatalyst contains three elements: C, N, and Ag. For each element, we performed a thorough investigation. The C 1s spectrum is shown in Fig. 2(b), and four peaks emerge at 284.84 eV, 287.73 eV, 288.38 eV, and 293.39 eV, respectively, corresponding to C–C, C–N, N![[double bond, length as m-dash]](https://www.rsc.org/images/entities/char_e001.gif) C(–N)2, and sp2 hybridized carbon on the aromatic ring of the amino group. Fig. 2(c) depicts the N 1s spectra, with peaks at 398.37 eV, 399.85 eV, 400.90 eV, and 404.12 eV, respectively. Among them, the peak at 398.37 eV is ascribed to C
C(–N)2, and sp2 hybridized carbon on the aromatic ring of the amino group. Fig. 2(c) depicts the N 1s spectra, with peaks at 398.37 eV, 399.85 eV, 400.90 eV, and 404.12 eV, respectively. Among them, the peak at 398.37 eV is ascribed to C![[double bond, length as m-dash]](https://www.rsc.org/images/entities/char_e001.gif) N–C, the peaks at 399.85 eV and 400.90 eV to N–(C)3, and the peak at 404.12 eV to C–N–H.34 Fig. 2(d) depicts the Ag 3d spectroscopy, which contains two peaks at 367.76 eV (Ag 3d3/2) and 373.7 eV (Ag 3d5/2). The equivalent spin energy separation is 6.0 eV, confirming that Ag has a chemical valence of 0.35 Finally, silver nanoparticles were effectively loaded on the surface of g-C3N4/PPy and were able to influence its photocatalytic properties.
N–C, the peaks at 399.85 eV and 400.90 eV to N–(C)3, and the peak at 404.12 eV to C–N–H.34 Fig. 2(d) depicts the Ag 3d spectroscopy, which contains two peaks at 367.76 eV (Ag 3d3/2) and 373.7 eV (Ag 3d5/2). The equivalent spin energy separation is 6.0 eV, confirming that Ag has a chemical valence of 0.35 Finally, silver nanoparticles were effectively loaded on the surface of g-C3N4/PPy and were able to influence its photocatalytic properties.
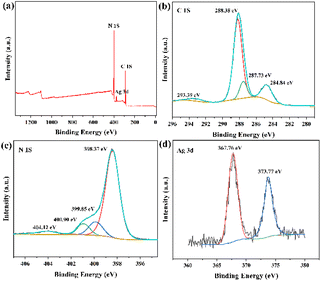 | ||
| Fig. 2 (a) Survey spectrum, (b) C 1s spectrum, (c) N 1s spectrum, (d) Ag 3d spectrum of g-C3N4/PPy/Ag. | ||
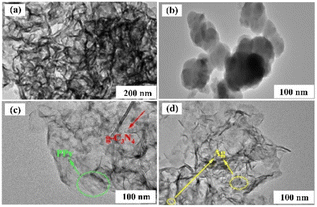
In this investigation, the samples were put through TEM testing to investigate the morphological properties of the composites, as shown in Fig. 3. The synthesized pristine g-C3N4 exhibits a convoluted shape and a laminar structure, as can be shown in Fig. 3(a). As demonstrated in Fig. 3(b), the PPy has a submicron sphere form, and the interaction has stacked the particles. In the composite g-C3N4/PPy, shown in Fig. 3(c), PPy is placed between the lamellae of g-C3N4 and distributed between its edges. The Ag nanoparticles combine nicely with g-C3N4/PPy, as can be observed in the TEM picture of g-C3N4/PPy/Ag in Fig. 3(d).
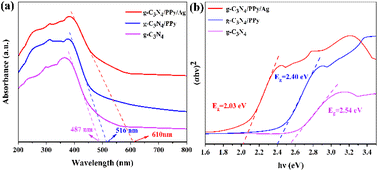
The photochemical properties of the photocatalysts were examined to analyze their light-capturing ability.9 Fig. 4(a) displays the UV-vis DRS of g-C3N4, g-C3N4/PPy, and g-C3N4/PPy/Ag. With an absorption edge of around 487 nm, the synthesized g-C3N4 possesses a weak absorption of visible light. The performance of the photocatalytic system is increased by the improved visible light absorption of g-C3N4/PPy composites, which has an absorption edge of about 516 nm. Meanwhile, the g-C3N4/PPy/Ag composites have higher visible light absorption with an absorption edge of about 610 nm. The respective forbidden band widths (Eg) were calculated from the Kubelka–Munk function: αhν = A(hν − Eg)n/2, with n = 1 since g-C3N4 is a direct band gap semiconductor.36 The curves of (αhν)2 versus hν are shown in Fig. 4(b) shows that the Eg values of g-C3N4, g-C3N4/PPy, and g-C3N4/PPy/Ag are 2.54 eV, 2.40 eV, and 2.03 eV, respectively. From the experimental data, it is clear that the modification of PPy and Ag can narrow the forbidden bandwidth of g-C3N4, reduce the band gap. The expanded spectrum response due to the improved light absorption capability allows for effective implementation of the photocatalytic properties in the visible spectrum.
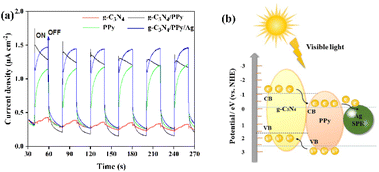
The transient photocurrent reactions of g-C3N4, PPy, g-C3N4/PPy, and g-C3N4/PPy/Ag are shown in Fig. 5(a). As can be seen, pure g-C3N4 has a low photocurrent density, and the composite PPy can improve its photocurrent response considerably. This phenomenon suggests that g-C3N4/PPy conduction band matching accelerates the effective e−–h+ separation of g-C3N4.37 The photocurrent density of g-C3N4/PPy/Ag is the highest after Ag doping, which is consistent with the absorption edge maximum mentioned above. The results demonstrated that PPy and Ag were required for the photocatalytic reaction.
To better explain the functions of materials in g-C3N4/PPy/Ag, we created a schematic energy band diagram. As shown in Fig. 5(b), g-C3N4 forms a Z-type heterojunction with PPy in the ternary composite. When exposed to visible light, g-C3N4 and PPy are simultaneously excited, producing e− and h+. Part of the photogenerated e− in g-C3N4 migrates to PPy, while part of the PPy-generated h+ also migrates to g-C3N4. Because of the SPR effect, the loading of Ag is then transferred to Ag by the conduction band of electrons.38 This process significantly improves the separation efficiency of the photogenerated carriers and reduces the possibility of recombination, resulting in increased photocatalytic activity.
3.2. Photocatalytic performance analysis
The different photocatalysts that were synthesized for FLE degrade at varying rates, as shown in Fig. 6(a). FLE can be steady in visible light, as evidenced by the fact that there is almost no degradation of FLE after 180 min of exposure to visible light. The degradation rates of FLE with different photocatalysts within 180 min are 61.6% for g-C3N4, 76.8% for g-C3N4/PPy, and 90.2% for g-C3N4/PPy/Ag.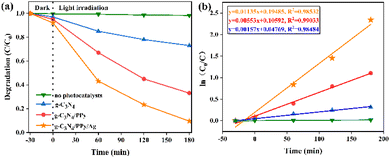 | ||
| Fig. 6 (a) Degradation curves of FLE degradation by different photocatalysts, (b) profiles of ln(c0/c) vs. irradiation time. | ||
The photocatalytic degradation satisfies a first-order kinetic model when the initial concentration of FLE is low: ln(c0/c) = kt, where c0 is the concentration of FLE at the start of degradation, k is the degradation rate constant, and c is the concentration of FLE after a specific time t of light irradiation. A linear fit to this model is depicted in Fig. 6(b).39 The k values obtained for g-C3N4, g-C3N4/PPy and g-C3N4/PPy/Ag are 0.00157 min−1 (R2 = 0.98484), 0.00553 min−1 (R2 = 0.99033) and 0.01135 min−1 (R2 = 0.98532), respectively, and it is clear that the k value of g-C3N4/PPy/Ag is the largest, which is about 7.2 times higher than that of g-C3N4. The correlation coefficients R2 of all samples were more significant than 0.9, indicating that they were following the primary kinetic model. Photocatalyst g-C3N4/PPy/Ag showed a good degradation effect on FLE.
3.3. Identification of intermediates and analysis of the main degradation pathways
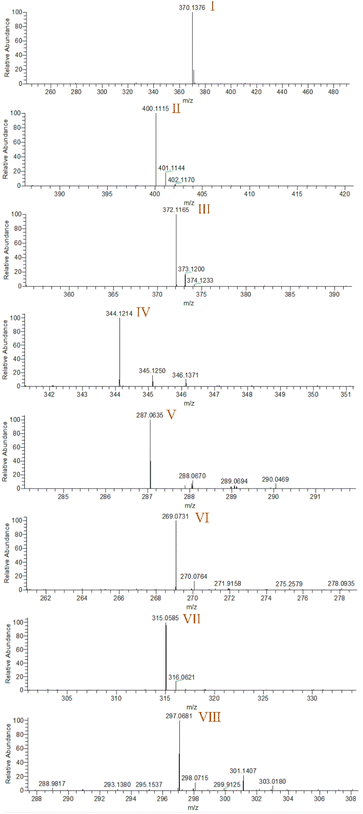
Electrospray electrostatic field Orbitrap high-resolution mass spectrometry (ESI-Q Orbitrap-MS) in positive ion mode (ESI+) was used to examine the degradation products of FLE at various stages. Using the knowledge gleaned from the high-resolution mass spectrometry data, their structures were examined and verified. The outcomes are depicted in Fig. 7. Within 180 minutes of catalytic degradation, eight peaks (I–VIII) were detected. Of these, peak I with a m/z of 370.14 occurred with a retention time of 1.20 min, indicating that the molecule was FLE.40,41 The other peaks (II–VIII) were intermediate intermediates formed during the degradation of FLE.40,41 Information on FLE and each intermediate during degradation is shown in Table 2.By merging the data from the intermediates, the primary FLE breakdown pathway was deduced. The N-methyl piperazine ring structure was the primary site of the early substrate FLE breakdown. m/z 400.11 was obtained by oxidizing the piperazine ring, and m/z 372.12 was produced by further removing –CHO. Then, m/z 372.12 was degraded in two ways: the first one was m/z 372.12 to remove HCHO to obtain m/z 344.12, further removal of N-methyl ethylamine to obtain m/z 287.06 and removal of F to obtain m/z 269.07; the second one was m/z 372.12 to remove N-methyl ethylamine to obtain m/z 315.06, further removal of F to obtain m/z 297.07 and removal of –CHO to obtain m/z 269.07. The intermediate m/z 269.07 was ultimately reduced to tiny molecules over time by a series of ring opening processes. The suggested FLE degradation pathway is shown in Scheme 1.42–46
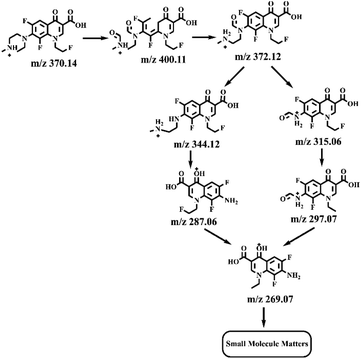 | ||
| Scheme 1 Multiple possible pathways for g-C3N4/PPy/Ag photocatalytic degradation of FLE under visible light. | ||
4. Conclusions
In this study, a solid photocatalyst made of g-C3N4/PPy/Ag was created using three-step methods. Its structure and composition were examined using XRD, FT-IR, TEM, and XPS to show that the ternary catalyst was successfully synthesized. Transient photocurrent response and UV-vis DRS were used to test the optical characteristics. As comparison to pure g-C3N4 and g-C3N4/PPy, g-C3N4/PPy/Ag has a better light absorption capacity and a narrower prohibited bandwidth (2.03 eV), which suggests that the addition of PPy and Ag can enhance photocatalytic g-C3N4's activity. Using g-C3N4, g-C3N4/PPy, photocatalytic tests were conducted. The outcomes demonstrated a significant degradation rate of more than 90% for g-C3N4/PPy/Ag. The produced g-C3N4/PPy/Ag photocatalyst is hence more active. Using HPLC-MS/MS, a timely sample of the hybrid solution of g-C3N4/PPy/Ag photocatalytic degradation of FLE was taken. The primary pathways of degradation were hypothesized after the degradation intermediates were examined in accordance with the m/z readings. During the conjecture, it was discovered that the key degradative reactions of FLE were the oxidative ring opening of the N-methyl piperazine ring structure, the defluorination reaction on fluoroethyl, the elimination of –CHO and N-methyl ethylamine, and lastly the degradation into tiny molecules.Author contributions
Lei Ma: formal analysis, data curation and writing – original draft; Lin Yang: investigation, methodology and writing – review & editing; Laijun Li and Wu Zhang: methodology and writing – original draft; Yuqing Cheng and Lei Wang: resources and writing – review & editing; Xiaoxuan Zhou: investigation and data curation; Yuguang Lv and Mingyuan Liu: resources, funding acquisition and writing – review & editing.Conflicts of interest
There are no conflicts to declare.Acknowledgements
This study was financially supported by the National Natural Science Foundation of China [Grant No. 52102119], Department of scientific research project in Heilongjiang province [Grant No. LH2022B022], and the Innovation and Entrepreneurship Project for College students in Heilongjiang Province [Grant No. S202210222075].References
- F. Bairamis and I. Konstantinou, Reactions, 2022, 3, 160–171 CrossRef.
- S. Bao, J. Wan, B. Tian and J. Zhang, Res. Chem. Intermed., 2018, 44, 6137–6149 CrossRef CAS.
- Y. Cui, X. Zhang, R. Guo, H. Zhang, B. Li, M. Xie, Q. Cheng and X. Cheng, Sep. Purif. Technol., 2018, 203, 301–309 CrossRef CAS.
- X. Dai, S. Feng, W. Zheng, W. Wu, Y. Zhou, Z. Ye, X. Cao and Y. Wang, Int. J. Hydrogen Energy, 2022, 47, 10603–10615 CrossRef CAS.
- C. Ding, K. Fu, M. Wu, S. Gong, J. Liu, J. Shi and H. Deng, J. Photochem. Photobiol., A, 2021, 414, 113283 CrossRef CAS.
- G. Fan, X. Lin, Y. You, B. Du, X. Li and J. Luo, J. Hazard. Mater., 2022, 421, 126703 CrossRef CAS PubMed.
- K. Fu, Y. Pan, C. Ding, J. Shi and H. Deng, J. Photochem. Photobiol., A, 2021, 412, 113235 CrossRef CAS.
- J. Gou, Q. Ma, X. Deng, Y. Cui, H. Zhang, X. Cheng, X. Li, M. Xie and Q. Cheng, Chem. Eng. J., 2017, 308, 818–826 CrossRef CAS.
- R. Yang, Z. Zhu, C. Hu, S. Zhong, L. Zhang, B. Liu and W. Wang, Chem. Eng. J., 2019, 390, 124522 CrossRef.
- R. Yang, S. Zhong, L. Zhang and B. Liu, Sep. Purif. Technol., 2019, 235, 116270 CrossRef.
- Y. Wang, D. Yu, W. Wang, P. Gao, S. Zhong, L. Zhang, Q. Zhao and B. Liu, Sep. Purif. Technol., 2020, 239, 116562 CrossRef CAS.
- Y. Wang, K. Ding, R. Xu, D. Yu, W. Wang, P. Gao and B. Liu, J. Cleaner Prod., 2020, 119108, 0959–6526 Search PubMed.
- H. Zhang, D. Yu, W. Wang, P. Gao, L. Zhang, S. Zhong and B. Liu, Appl. Surf. Sci., 2019, 497, 143820 CrossRef CAS.
- W. Wang, R. Yang, T. Li, S. Komarneni and B. Liu, Composites, Part B, 2021, 205, 108512 CrossRef CAS.
- T. Liu, L. Wang, X. Lu, J. Fan, X. Cai, B. Gao, R. Miao, J. Wang and Y. Lv, RSC Adv., 2017, 7, 12292–12300 RSC.
- S. Lv, C. Wu, Y. H. Ng, Y. Zhang, J. Peng, Y. Liu, Q. Zhang, S. Li, Y. Sun and L. Jing, Int. J. Hydrogen Energy, 2022, 47, 42136–42149 CrossRef CAS.
- H. Mohan, M. Ramasamy, V. Ramalingam, K. Natesan, M. Duraisamy, J. Venkatachalam, T. Shin and K.-K. Seralathan, J. Hazard. Mater., 2021, 412, 125330 CrossRef CAS PubMed.
- M. Padervand and S. Hajiahmadi, J. Photochem. Photobiol., A, 2022, 425, 113700 CrossRef CAS.
- X. Peng, J. Li, L. Yi, X. Liu, J. Chen, P. Cai and Z. Wen, Appl. Catal., B, 2022, 300, 120737 CrossRef CAS.
- K. Qin, Q. Zhao, H. Yu, X. Xia, J. Li, S. He, L. Wei and T. An, Environ. Res., 2021, 199, 111360 CrossRef CAS PubMed.
- B. Song, Z. Zeng, G. Zeng, J. Gong, R. Xiao, S. Ye, M. Chen, C. Lai, P. Xu and X. Tang, Adv. Colloid Interface Sci., 2019, 272, 101999 CrossRef CAS PubMed.
- H. Sun, Z. Liu, X. Liu, C. Yu and L. Wei, Mater. Today Sustain., 2022, 19, 100154 CrossRef.
- J. Tang, J. Wang, L. Tang, C. Feng, X. Zhu, Y. Yi, H. Feng, J. Yu and X. Ren, Chem. Eng. J., 2022, 430, 132669 CrossRef CAS.
- Z. Tian, X. Yang, Y. Chen, X. Wang, T. Jiao, W. Zhao, H. Huang and J. Hu, J. Alloys Compd., 2022, 890, 161850 CrossRef CAS.
- D. Van Thuan, T. B. Nguyen, T. H. Pham, J. Kim, T. T. H. Chu, M. V. Nguyen, K. D. Nguyen, W. A. Al-Onazi and M. S. Elshikh, Chemosphere, 2022, 308, 136408 CrossRef CAS PubMed.
- F. Wang, Y. Feng, P. Chen, Y. Wang, Y. Su, Q. Zhang, Y. Zeng, Z. Xie, H. Liu and Y. Liu, Appl. Catal., B, 2018, 227, 114–122 CrossRef CAS.
- Y. Wang, F. Wang, Y. Feng, Z. Xie, Q. Zhang, X. Jin, H. Liu, Y. Liu, W. Lv and G. Liu, Dalton Trans., 2018, 47, 1284–1293 RSC.
- Y. Zhu, M. Zhu, H. Lv, S. Zhao, X. Shen, Q. Zhang, W. Zhu and B. Li, J. Solid State Chem., 2020, 292, 121641 CrossRef CAS.
- W. Yan, L. Yan and C. Jing, Appl. Catal., B, 2019, 244, 475–485 CrossRef CAS.
- S. Haibo, Q. Pufeng, W. Zhibin, L. Chanjuan, G. Jiayin, L. Shuai and C. Youzheng, J. Alloys Compd., 2020, 834, 155211 CrossRef.
- Y. Wu, Y. Xu, Y. Zhang, J. Feng, Y. Li, J. Lan and X. Cheng, Chin. Chem. Lett., 2022, 33, 2741–2746 CrossRef CAS.
- M. Yan, R. Liu, S. Wang, X. Hu and M. Xu, Mater. Lett., 2022, 320, 132306 CrossRef CAS.
- X. Yu, J. Zhang, J. Zhang, J. Niu, J. Zhao, Y. Wei and B. Yao, Chem. Eng. J., 2019, 374, 316–327 CrossRef CAS.
- L. Ge, C. Han, J. Liu and L. Yunfeng, Appl. Catal., A, 2011, 409–410, 215–222 CrossRef CAS.
- W. Zhang, L. Zhou and H. Deng, J. Mol. Catal. A: Chem., 2016, 423, 270–276 CrossRef CAS.
- M. Feifei, D. Kai, Z. Jinfeng, L. Wanyue and L. Changhao, Appl. Surf. Sci., 2019, 488, 151–160 CrossRef.
- F. Chen, H. Yang, W. Luo, P. Wang and H. Yu, Chin. J. Catal., 2017, 38, 1990–1998 CrossRef CAS.
- S. Hu, L. Ma, H. Wang, L. Zhang, Y. Zhao and G. Wu, RSC Adv., 2015, 5, 31947–31953 RSC.
- M. A. Qamar, S. Shahid, J. Mohsin, I. Shahid, S. Mudassar, B. Ali, A.-A. M. Mana, D. X. Li and L. Dongxiang, Colloids Surf., A, 2021, 614, 126176 CrossRef CAS.
- L. Shijie, W. Chunchun, L. Yanping, X. Bing, J. Wei, L. Yu, M. Liuye and C. Xiaobo, Chem. Eng. J., 2021, 415, 128991 CrossRef.
- W. XiaoJu, N. ChengGang, Z. Lei, L. Chao and Z. GuangMing, Appl. Catal., B, 2018, 221, 701–704 CrossRef.
- W. Yichuan, T. Yingping, C. Dezhi, Z. Tianlin, Z. Quanzhi and Z. JianPing, Chem. Eng. J., 2023, 453, 141643 Search PubMed.
- W. Han, J. Wei, K. Xiao, T. Ouyang, X. Peng, S. Zhao and Z. Liu, Angew. Chem., Int. Ed., 2022, 61, e202206050 CAS.
- S. He, C. Yan, X. Chen, Z. Wang, T. Ouyang, M. Guo and Z. Liu, Appl. Catal., B, 2020, 276, 119138 CrossRef CAS.
- S. Huang, B. Zheng, Z. Tang, X. Mai, T. Ouyang and Z. Liu, Chem. Eng. J., 2021, 422, 130086 CrossRef CAS.
- Q. Long, Z. Zhang, G. Qi, Z. Wang, Y. Chen and Z. Liu, ACS Sustainable Chem. Eng., 2020, 8, 2512–2522 CrossRef CAS.
Footnote |
| † Lei Ma and Lin Yang are co-lead authors. |
| This journal is © The Royal Society of Chemistry 2023 |

