
 Open Access Article
 This Open Access Article is licensed under a Creative Commons Attribution-Non Commercial 3.0 Unported Licence
Comparison of the pharmacokinetics of timosaponin AIII, timosaponin BIII, and mangiferin extracted from crude and salt-processed Anemarrhenae Rhizoma by UPLC-MS/MS
XiaoTing Wang ,
YingQi Yu,
LinXiu Pei and
Hui Gao*
,
YingQi Yu,
LinXiu Pei and
Hui Gao*
School of Pharmacy, Liaoning University of Traditional Chinese Medicine, Dalian, 116600, China. E-mail: gaohuitcm@163.com
First published on 17th April 2023
Abstract
Processing is a traditional method for preparing decoctions of traditional Chinese medicine (TCM) that is imperative for reducing toxicity, increasing efficacy, and adjusting the properties of pharmacologically active components of the TCM. Salt processing of Anemarrhenae Rhizoma (AR), a traditional Chinese herb, has been employed since the Song dynasty and can enhance the ability of AR to enriching the Yin and downbearing fire according to the traditional theory recorded in the Enlightenment on Materia Medica. Previous research found that the hypoglycemic effect of AR was enhanced after salt processing, and the concentrations of three components, namely timosaponin AIII, timosaponin BIII, and mangiferin, all of which have hypoglycemic activities, have been found to be significantly increased after salt processing. In this study, we established an ultra-high-performance liquid chromatography-tandem mass spectrometry (UPLC-MS/MS) method to ultimately measure the concentrations of timosaponin AIII, timosaponin BIII, and mangiferin in rat plasma after administration of unprocessed AR and salt-processed AR (SAR) to the rats to further elucidate how salt processing affects the pharmacokinetic profiles of each of these compounds. Separation was achieved on an Acquity UPLC HSS T3 column. The 0.1% formic acid aqueous solution (v/v) and acetonitrile were used as the mobile phase system. Calibration curves of each compound in blank rat plasma, as well as the accuracy, precision, stability, and recovery of the total three analytes, were then measured to validate the method. The Cmax and AUC0–t values of timosaponin BIII and mangiferin in the SAR group were significantly higher than those of the AR group, while the Tmax values of timosaponin BIII and mangiferin in the SAR group were shorter than in the AR group. These results indicated that salt processing improved the absorption and bioavailability of timosaponin BIII and mangiferin in Anemarrhenae Rhizoma, and they provide a rationale for how the salt processing enhances the hypoglycemic effect of Anemarrhenae Rhizoma.
1. Introduction
In clinical applications, traditional Chinese medicines (TCMs) are processed from Chinese herbs by various means depending on the nature of the TCM and how the medicines are dispensed and prepared. These processing procedures change the pharmacological properties of the TCM and eliminate the toxicities of some of the drugs in the extracts. Processing with adjuvants materials, such as stir-frying with salt solution, wine, wheat bran, and other ingredients, is a common method for processing Chinese herbal medicines. In particular, stir-frying with salt solution has a long history in China and can help to conduct the effects of drugs to the kidney meridian in accordance with TCM theory and enhance drugs' effects, and moderate drugs' nature.1,2Diabetes is a metabolic disease caused by insulin resistance or insulin secretion dysfunction and results in persistent hyperglycemia. At present, the treatment of diabetes mainly involves Western medicine and typically involves the use of an oral hypoglycemic drug and/or insulin injections to manage the complications of the disease. Exogenous insulin is needed to replenish the absolute or relative deficiency of endogenous insulin that diabetes manifests, and it regulates blood glucose levels, but at the cost of dependence and other side effects. Although TCM is not as effective as Western medicine, the pharmacologically active components within TCMs can target multiple different biomarkers and pathways and has no obvious side effects on Type II diabetes mellitus (T2DM) patients. Therefore, patients can be treated and undergo adjustments in the type and amount of TCM based on syndrome differentiation, which is highly advantageous for ensuring hypoglycemic efficacy to alleviate the chronic complications of diabetes.
Anemarrhenae Rhizoma (AR), a traditional Chinese herb, refers to the dried roots of Anemarrhena asphodeloides Bge. (Fig. 1) and has been effective in heat-clearing, purging fire, nourishing the yin, and moisturizing dryness.3 The extract of AR has demonstrated several pharmacological activities, including anti-tumor, anti-Alzheimer's disease, anti-inflammatory, and anti-diabetic.4–6 The main functional components of AR include saponins, flavonoids, and polysaccharides,7 many of which have been efficacious in reducing glycemic levels. Historically, AR is often processed by salt-processing methods, which is known to enhance renal function. In addition, previous research found that salt processing significantly improved the hypoglycemic effect of AR.8,9 The strengthening effect of salt-processed Anemarrhenae Rhizoma (SAR) is consistent with the traditional Chinese medicine theory of “yin deficiency-engendered heat dry” in the pathogenesis of diabetes.10 The synergistic mechanism of AR after salt processing is shown in Fig. 2.
 | ||
| Fig. 1 The procedure of salt processing of Anemarrhena asphodeloides Bge. | ||
 | ||
| Fig. 2 The synergistic mechanism of AR after salt processing. | ||
In previous experiments, our group found that SAR had a stronger hypoglycemic effect than AR, and HPLC was used to quantify the concentrations of several flavonoids and saponins in AR before and after salt processing,11,12 which showed that the contents of timosaponin AIII, timosaponin BIII, and mangiferin increased during salt processing. In particular, there is a large amount of timosaponin E, a steroidal saponin, in AR. During salt processing, the C-22 methoxyl group of timosaponin E undergoes demethylation to produce timosaponin BII, and the C-22 hydroxyl group of timosaponin BII gets dehydrated to produce timosaponin BIII. Timosaponin AIII is also formed through deglycosylation and cyclization of timosaponin BII. In addition, neomangiferin, a naturally occurring xanthone C-glucoside, undergoes deglycosylation during salt processing to produce mangiferin. The transformations that representative functional components undergo during salt processing is shown in Fig. 3.
 | ||
| Fig. 3 Transformation of typical components. | ||
Pharmacokinetics (PK) is frequently employed to study the dynamic changes in the absorption, distribution, metabolism, and excretion (ADME) properties of active or characteristic components of TCM in the body; interpret the safety and effectiveness of TCM in combination with pharmacodynamic (PD) studies; and provide a basis for the scientific interpretation of the material basis, mechanism of action, and traditional theory of traditional Chinese medicine. PK can better relate the theory of TCM with the mechanism of efficacy. Ultra-high-performance liquid chromatography-tandem mass spectrometry (UPLC-MS/MS) is often employed for the separation, structural identification, and analysis of trace substances in TCM. The ability to provide rapid analysis, strong separation, high sensitivity, and degree of automation make it advantageous for the simultaneous detection and quantitative analysis of multiple components in TCM and elucidating the mechanisms of action, metabolic pathways, and side effects of TCMs.
Several PK studies have been conducted to identify the pharmacologically active flavonoids and saponins of AR because of their potential clinical applications. For example, Wei et al. used LC-MS to quantify the concentration of mangiferin within rat plasma.13 Wang et al. used HPLC-MS/MS for quantifying the concentrations of neomangiferin, mangiferin, timosaponin E1, timosaponin E, timosaponin BII, timosaponin BIII, timosaponin AIII, and timosaponin A-I in rat plasma after administration of crude (i.e. unprocessed) AR.14 However, these studies only investigated the PK parameters of key components in the crude AR. In previous PD experiments, our group found that timosaponin AIII, timosaponin BIII, and mangiferin improved the glucose consumption of HepG-2 cells. In addition, these three compounds have been proven to improve insulin resistance and were responsible for enhancing the hypoglycemic effect of AR.15–17 We also investigated the mechanism by which salt processing altered the pharmacological properties of AR in vivo.
At present, there are few reports that investigated the relationship between the pharmacokinetic properties of key functional components of AR and the effects of salt processing on the hypoglycemic effect of AR. In this study, a UPLC-MS/MS method was developed to simultaneously measure the concentrations of timosaponin AIII, timosaponin BIII, and mangiferin in rat plasma after administration of AR and SAR extracts to rats by oral gavage, and the method was further applied in the determination of the PK parameters of the analytes in rats. Ultimately, the goals of this research were aimed at elucidating the effects by which the salt processing of AR enhanced the hypoglycemic effect of AR.
2. Material and methods
2.1 Reagents, chemicals and instruments
Anemarrhena asphodeloides Bge. was purchased from Sichuan Xinhehua Co., Ltd (Chengdu, China) and authenticated by Professor Haibo Yin (College of Pharmacy, Liaoning University of Chinese Medicine, Dalian, China). All voucher specimens were deposited at the authors' laboratory. Reference standards of timosaponin AIII and timosaponin BIII were obtained from Mansite Biological Technology Co., Ltd (Chengdu, China), and the reference standard of mangiferin was obtained from Meilun Biological Technology Co., Ltd (Shanghai, China). The purity of each compound was determined to be > 98% by HPLC. LC-MS-grade acetonitrile and formic acid were purchased from Merck KGaA (Darmstadt, Germany). All other reagents were analytical-grade and obtained from Tianjin Kermol Chemical Reagent Co., Ltd (Tianjin, China). Ultrapure water was purified by a Milli-Q water purification system (Millipore, Billerica, MA, USA).2.2 Animals
Sprague-Dawley (SD) rats (200 ± 20 g) were purchased from Changsheng Biotechnology Co., Ltd (License No. SCXK (Liao) 2015-0001, Benxi, Liaoning Province). The rats were maintained in a room at 25 ± 2 °C and 60% ± 10% humidity with a 12 h light/dark cycle. Water and chow were provided ad libitum. All animal procedures were performed in accordance with the Guidelines for Care and Use of Laboratory Animals of Liaoning University of Traditional Chinese Medicine and approved by the Animal Core and Welfare Committee of Liaoning University of Traditional Chinese Medicine.2.3 UPLC-MS/MS analysis
Data acquisition and instrument control were performed using the MassLynx 4.1 software (Waters Corp., Milford, MA, USA). Chromatographic separation of the components in AR was achieved on an Acquity UPLC HSS T3 column (100 mm × 2.1 mm, 1.8 μm, Waters) that was maintained at a temperature of 30 °C. The mobile phase comprised water (w/0.1% formic acid, A) and acetonitrile (B). The elution gradient profile consisted of 0.00–2.00 min (98–95% B), 2.00–5.00 min (95–90% B), 5.00–7.00 min (90–50% B), 7.00–9.00 min (50–20% B), and 9.00–11.00 min (20–15%). The flow rate was 0.3 mL min−1.A Waters triple quadruple mass spectrometer (Xevo TQD, Waters Corp., Milford, MA, USA) equipped with an electrospray ionization source (ESI) and operating in negative-ion mode was used use for mass analysis of the UPLC data. The cone gas flow rate was 50 L h−1, the desolvation gas (N2) flow rate was 600 L h−1, and the desolvation gas temperature was 350 °C. All data were collected in multiple reaction monitoring (MRM) mode and were used to calculate the accurate mass and composition of relative target ions with the MassLynx™ V4.1 software. For MRM, the precursor and product ion pairs were m/z 739.48 → 577.44 for timosaponin AIII (collision energy 34 eV), m/z 901.61 → 739.57 for timosaponin BIII (collision energy 40 eV), m/z 421.03 → 331.07 for mangiferin (collision energy 27 eV), and m/z 415.21 → 267.15 for the IS (puerarin) (collision energy 36 eV).
2.4 Standards and sample preparation
To obtain the SAR, AR slices (100 g) were mixed with salt water (10%, w/w) until the salt water was fully absorbed. The wet AR slices were stirred over low heat until dry, crushed, and sifted through a No. 3 sieve. The SAR (and unprocessed AR) were refluxed in 75% ethanol (v/v) three times for 1 h each, and the combined filtrates were concentrated to 5 g mL−1 to yield the AR and SAR extracts. The contents of timosaponin AIII, timosaponin BIII, and mangiferin in the AR and SAR extracts were analyzed by UPLC-MS/MS using the method described in Section 2.3; the PK studies were performed using the same parameters. The contents of timosaponin AIII, timosaponin BIII and mangiferin in the AR and SAR extracts were 33.6 and 38.4, 21.0 and 25.6, 7.8 and 8.6 mg g−1, respectively. The concentrated extract was redissolved in distilled water.To prepare the calibration standards, blank rat plasma was spiked individually with working solutions of each reference to obtain concentrations of 1.28–256 μg mL−1 for timosaponin AIII, 1.88–376 μg mL−1 for timosaponin BIII, and 2.39–478 μg mL−1 for mangiferin. The QC concentrations for timosaponin AIII were 2.0 μg mL−1, 20.0 μg mL−1, and 200 μg mL; 2.5 μg mL−1, 25.0 μg mL−1, and 250 μg mL−1 for timosaponin BIII; and 3.0 μg mL−1, 30.0 μg mL−1, and 300 μg mL−1 for mangiferin. The QC samples used to determine the recoveries, matrix effects, intra- and inter-day accuracies, precisions, and stability of each compound in rat plasma were prepared analogous to the calibration standards. The solutions were stored for one week at −4 °C.
2.5 Preparation of plasma samples
Prior to analysis, plasma samples were thawed to room temperature. Each plasma sample (100 μL) was mixed with 500 μL of cold methanol and 10 μL of the IS in a centrifuge tube. The solution was vortexed for 3 min and then centrifuged at 12![[thin space (1/6-em)]](https://www.rsc.org/images/entities/char_2009.gif) 000 rpm for 15 min. Then, the supernatant was transferred to another centrifugation tube and evaporated to dryness under N2 at 40 °C. The residue was redissolved in 100 μL of a 1:1 water:acetonitrile mixture and centrifuged for 15 min at 12000 rpm. An aliquot (5 μL) of the supernatant was analyzed by UPLC-MS/MS for pharmacokinetics analysis.
000 rpm for 15 min. Then, the supernatant was transferred to another centrifugation tube and evaporated to dryness under N2 at 40 °C. The residue was redissolved in 100 μL of a 1:1 water:acetonitrile mixture and centrifuged for 15 min at 12000 rpm. An aliquot (5 μL) of the supernatant was analyzed by UPLC-MS/MS for pharmacokinetics analysis.
2.6 Method validation
The stabilities of timosaponin AIII, timosaponin BIII, and mangiferin were determined by analyzing the QC samples by repeated freeze–thaw cycles, short-term stability at 4 °C for 24 h, and long-term stability at −20 °C for 30 days. The permitted range was within 15%.
2.7 Pharmacokinetics analysis
The SD rats were randomly divided into two groups (n = 6). Extracts of the AR and SAR in ethanol were orally administered to the rats at a dose of 5 mL kg−1. Blood samples (0.5 mL) were collected from the venous plexus of the eye socket at 0.25, 0.5, 1.0, 2.0, 3.0, 4.0, 6.0, 8.0, 10.0, 12.0, 24.0, and 36.0 h post-administration under anesthesia. Then, the blood was centrifuged at 3800 rpm for 20 min, and the plasma was immediately transferred to new tubes and stored at −20 °C until analysis. The pharmacokinetic parameters, including mean residence time (MRT), half-time (t1/2), maximum plasma concentration (Cmax), time to reach the maximum concentrations (Tmax) and area under the concentration–time curve (AUC0–t), were calculated using the DAS software (3.2 version, China Food and Drug Administration). All data were recorded as the mean ± SD.3. Results and discussion
3.1 Liquid chromatography optimization
Various mobile phases and gradient elution profiles were tested to determine which provided the best chromatographic performance. Compared to methanol, water (w/0.1% formic acid water) and acetonitrile provided the best separation of the three components and IS. In addition, the gradient elution profile was optimized to achieve a more rapid and effective separation.3.2 Mass spectrometry optimization
To determine which operating mode would achieve higher resolutions and more peaks in the mass spectra of the AR and SAR extracts, mass analysis of the UPLC chromatograms was performed in both positive- and negative-ion modes. The three components and the IS all had the highest responses while operating under negative-ion mode; therefore, all subsequent analyses were conductive in negative-ion mode. The MS/MS transitions and parameters are shown in Table 1.| Compound | [M − H]− (m/z) | Quantitative ion (m/z) | Cone voltage (V) | Collision energy (eV) |
|---|---|---|---|---|
| Timosaponin AIII | 739.48 | 577.44 | 80 | 34 |
| Timosaponin BIII | 901.61 | 739.57 | 90 | 40 |
| Mangiferin | 421.03 | 331.07 | 46 | 20 |
| Puerarin | 415.21 | 267.15 | 60 | 36 |
3.3 Extraction procedure optimization
Protein precipitation (PP) was used for the pretreatment of the plasma samples using methanol. The samples had better peak shapes and recoveries after being pre-processed with methanol, so we used methanol for PP in this study.3.4 Method validation
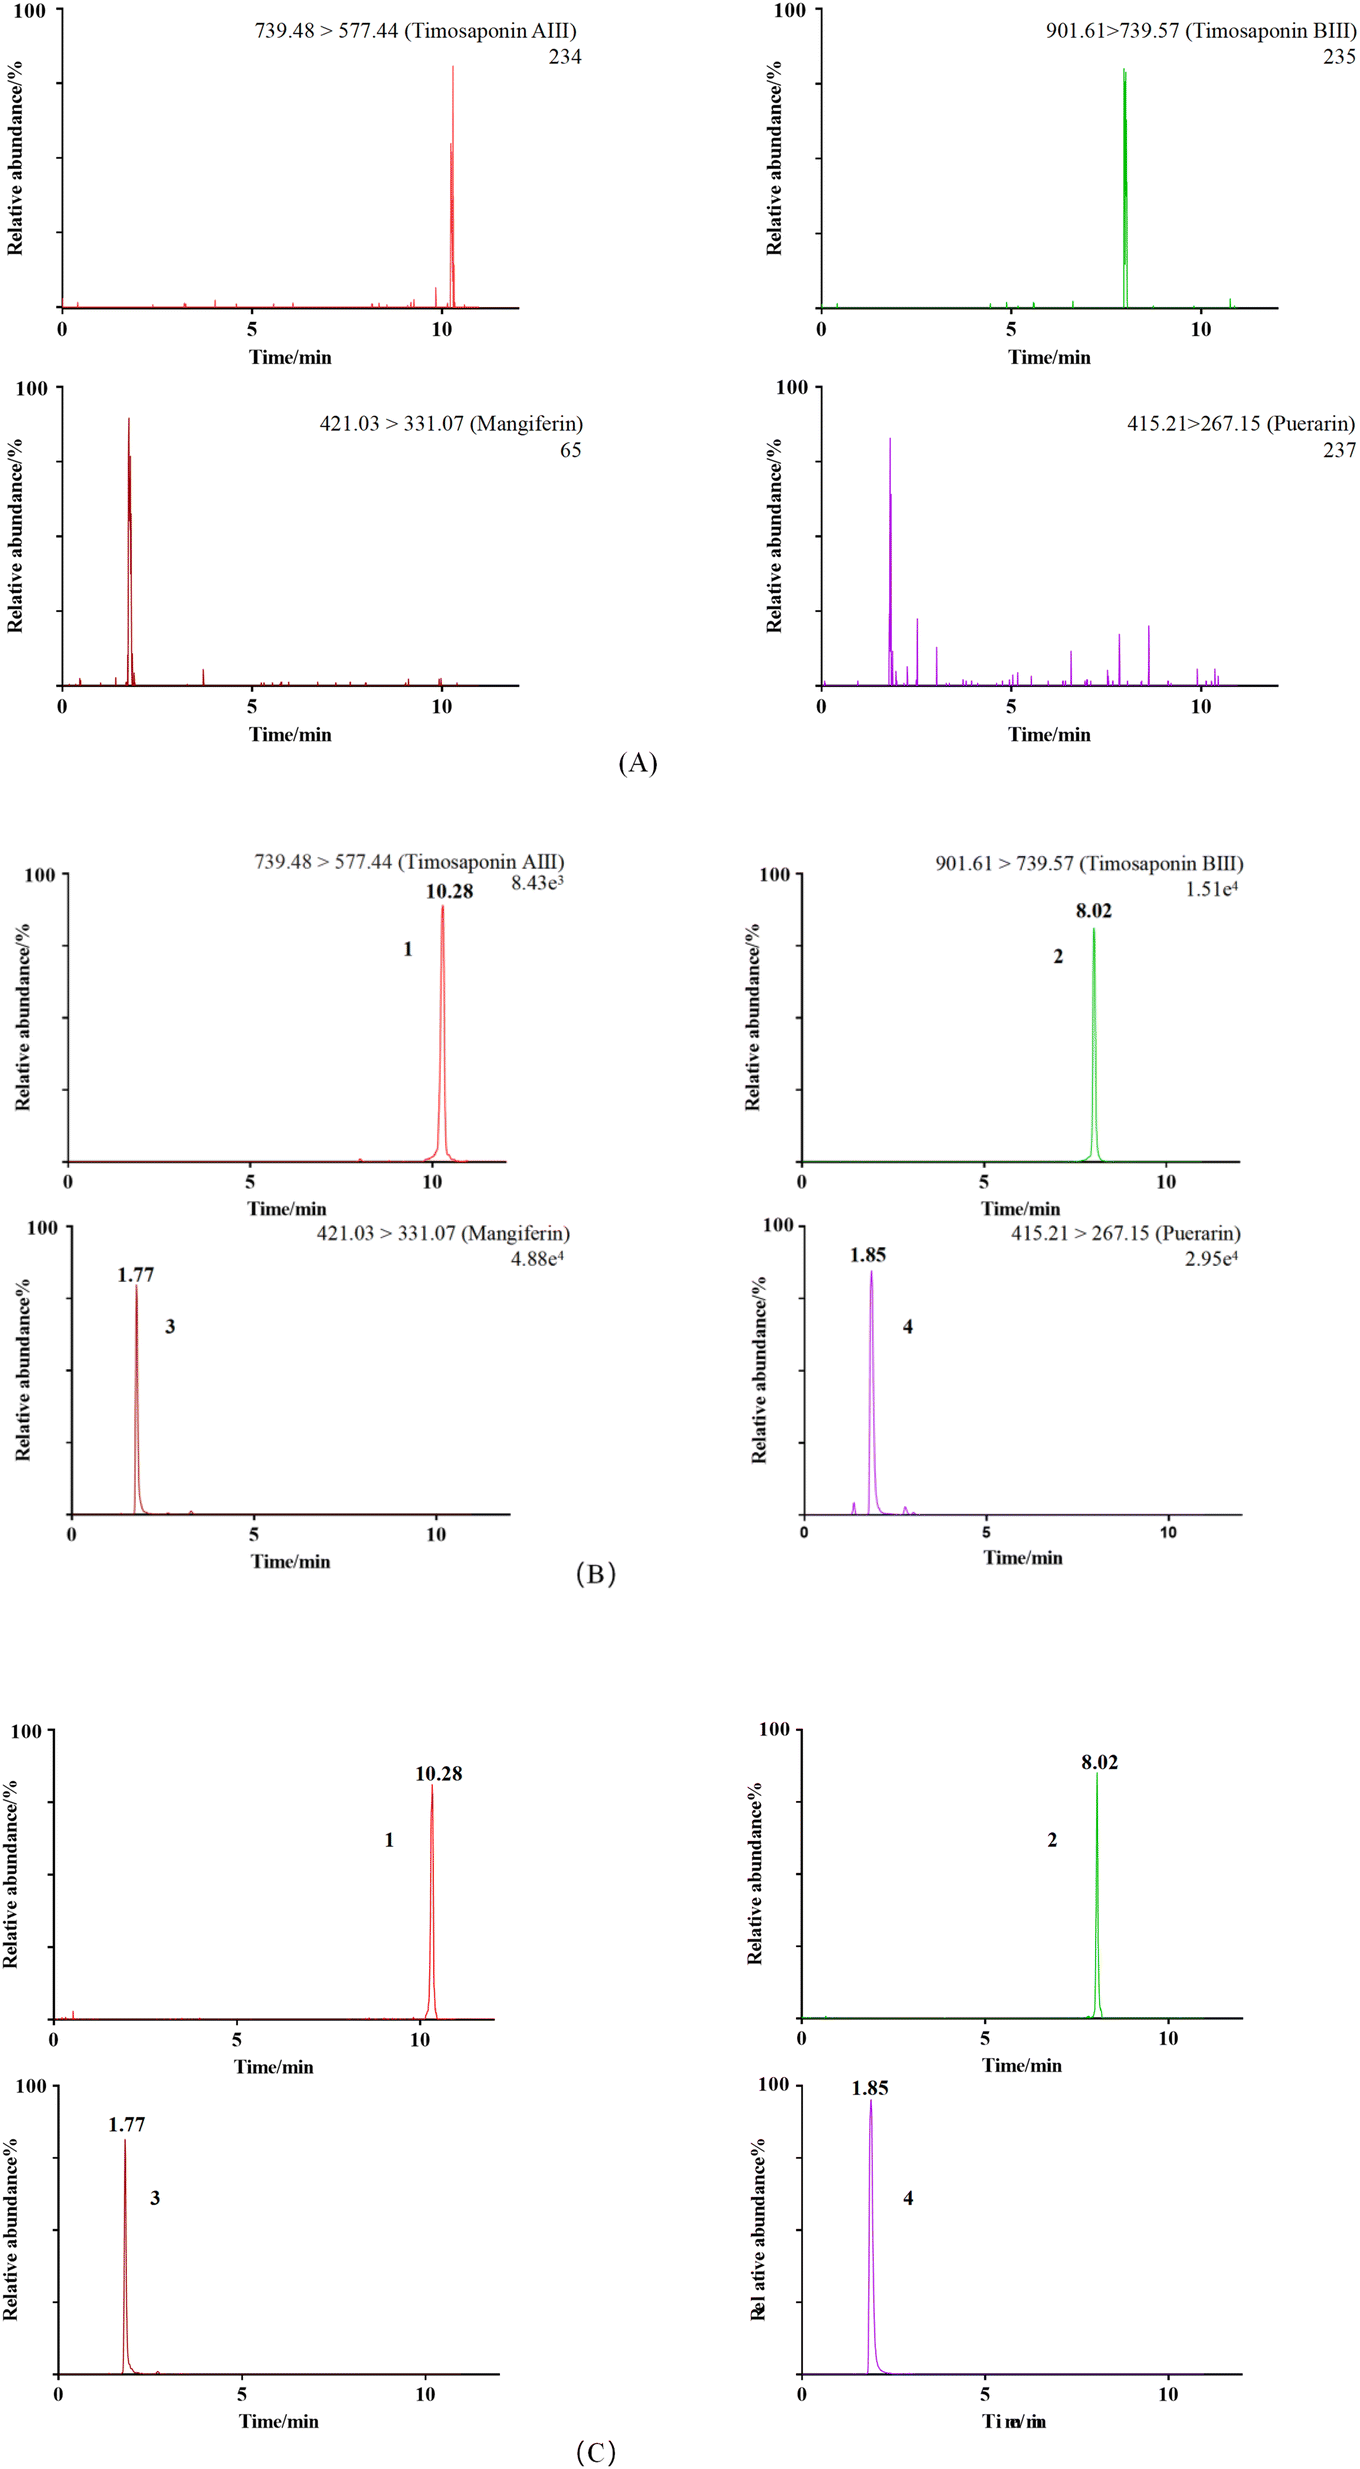 | ||
| Fig. 4 UPLC-MS/MS chromatograms of timosaponin AIII, timosaponin BIII and mangiferin, and the IS in rat plasma samples. Blank plasma sample (A); blank plasma spiked with three analytes and IS (B); a rat plasma sample 3 h after oral administration of Anemarrhenae Rhizoma extract (C). (1) timosaponin AIII, (2) timosaponin BIII, (3) mangiferin, (4) puerarin (IS). | ||
| Components | Calibration curve | r | Range/(μg ml−1) | LLOQ/(μg ml−1) |
|---|---|---|---|---|
| Timosaponin AIII | y = 5728.821x + 207.902 | 0.9995 | 1.28–256 | 1.28 |
| Mangiferin | y = 360.523x − 2.0801 | 0.9995 | 2.39–478 | 2.39 |
| Timosaponin BIII | y = 2323.550x − 19.210 | 0.9997 | 1.88–376 | 1.88 |
| Component | Concentration (μg mL−1) | Intra-day | Inter-day | ||
|---|---|---|---|---|---|
| Precision (RSD, %) | Accuracy (RE, %) | Precision (RSD, %) | Accuracy (RE, %) | ||
| Timosaponin AIII | 2.0 | 2.8 | 6.3 | 2.1 | 5.9 |
| 20.0 | 2.9 | −7.4 | 2.4 | −7.4 | |
| 200 | 3.2 | 5.9 | 3.0 | 4.8 | |
| Mangiferin | 3.0 | 1.8 | 6.1 | 1.4 | 5.1 |
| 30.0 | 1.9 | −8.5 | 2.7 | −7.3 | |
| 300 | 1.6 | 9.3 | 2.2 | −6.2 | |
| Timosaponin BIII | 2.5 | 1.9 | −7.4 | 1.7 | −8.2 |
| 25.0 | 2.4 | 0.7 | 2.3 | 1.3 | |
| 250 | 2.2 | −1.6 | 2.3 | −1.5 | |
| Component | Concentration (μg mL−1) | Autosampler at 4 °C for 24 h | −20 °C for 30 days | Freeze–thaw cycles | |||
|---|---|---|---|---|---|---|---|
| RE, % | RSD, % | RE, % | RSD, % | RE, % | RSD, % | ||
| Timosaponin AIII | 2.0 | 1.3 | 1.9 | 2.2 | 2.4 | −0.1 | 1.4 |
| 20.0 | 6.2 | 2.2 | 6.3 | 2.2 | 6.8 | 2.7 | |
| 200 | 7.1 | 4.0 | 10.6 | 5.1 | 3.8 | 1.8 | |
| Mangiferin | 3.0 | −3.1 | 5.7 | 4.4 | 3.3 | 5.6 | 1.9 |
| 30.0 | 6.4 | 3.6 | 8.7 | 4.3 | 7.8 | 2.4 | |
| 300 | 8.2 | 2.8 | 2.3 | 1.3 | 10.2 | 2.1 | |
| Timosaponin BIII | 2.5 | 9.3 | 2.9 | 3.9 | 4.2 | 2.8 | 1.7 |
| 25.0 | 6.5 | 3.2 | 6.6 | 7.9 | 4.5 | 3.9 | |
| 250 | 1.1 | 2.1 | 4.6 | 2.4 | 2.6 | 3.5 | |
| Component | Concentration (μg mL−1) | Recovery (%) | Matrix effect (%) |
|---|---|---|---|
| Timosaponin AIII | 2.0 | 91.6 | 89.4 |
| 20.0 | 98.6 | 96.7 | |
| 200 | 95.8 | 101.2 | |
| Mangiferin | 3.0 | 102.4 | 103.0 |
| 30.0 | 107.6 | 112.1 | |
| 300 | 103.5 | 106.3 | |
| Timosaponin BIII | 2.5 | 101.7 | 102.9 |
| 25.0 | 98.5 | 99.6 | |
| 250 | 99.2 | 101.8 |
3.5 Pharmacokinetics
The MassLynx 4.1 software was used to determine the AUC of the three analytes to calculate the concentrations of the components in rat plasma at various time points. The plasma drug concentration–time curves are displayed in Fig. 5. The DAS 3.2 statistical software was used to calculate the pharmacokinetic parameters of three analytes. The pharmacokinetic parameters, including AUC, MRT, Cmax, Tmax, and t1/2, are shown in Table 6. | ||
| Fig. 5 The plasma concentration–time curves of timosaponin AIII, timosaponin BIII, and mangiferin (Mean ± SD, n = 6) after oral administration of Anemarrhenae Rhizoma (AR) and salt-processed product (SAR) extracts. (a) Timosaponin AIII, (b) Timosaponin BIII, and (c) Mangiferin. | ||
| Parameters | Units | Timosaponin AIII | Timosaponin BIII | Mangiferin | |||
|---|---|---|---|---|---|---|---|
| AR | SAR | AR | SAR | AR | SAR | ||
| a *P < 0.05 compared to the AR. | |||||||
| AUC(0–t) | μg h L−1 | 16.46 ± 2.20 | 7.15 ± 1.37* | 75.60 ± 6.44 | 101.82 ± 5.41* | 165.74 ± 4.33 | 202.74 ± 3.53* |
| AUC(0–∞) | μg h L−1 | 16.48 ± 1.21 | 7.16 ± 1.38* | 75.96 ± 5.38 | 102.36 ± 7.16* | 171.29 ± 5.78 | 210.70 ± 5.21* |
| MRT(0–t) | h | 6.36 ± 0.68 | 5.91 ± 0.37 | 6.23 ± 0.46 | 7.66 ± 0.35* | 7.58 ± 0.62 | 6.39 ± 0.36 |
| t1/2 | h | 1.82 ± 0.47 | 2.06 ± 0.26 | 2.52 ± 0.79 | 2.67 ± 0.52 | 3.01 ± 0.36 | 5.13 ± 1.05* |
| Tmax | h | 4.67 ± 0.52 | 4.17 ± 0.41 | 5.53 ± 0.52 | 4.67 ± 0.41* | 5.76 ± 0.52 | 4.06 ± 0.41* |
| Cmax | μg L−1 | 3.67 ± 0.51 | 2.18 ± 0.44* | 12.27 ± 1.61 | 15.66 ± 2.66* | 27.58 ± 4.68 | 32.1 ± 2.56* |
Timosaponin BIII and mangiferin reached a Cmax at about 5 h after oral administration of the AR extract. There were no significant differences in the calculated Cmax of timosaponin BIII between the mice that were administered the AR extract and the mice that were administered the SAR extract, but the Tmax of mangiferin was shortened after administration of SAR extract compared to after administration of the AR extract. Therefore, salt processing appeared to accelerate the absorption of mangiferin. Compared to the pharmacokinetic parameters of the AR group, the Cmax and AUC values of timosaponin BIII and mangiferin were higher in rat plasma after oral administration of the SAR extract. Specifically, the AUC values of timosaponin BIII and mangiferin after administration of the SAR extract increased by 34.7% and 22.3%, respectively, which was more than the increase in the contents of these two compounds after salt processing (i.e. the contents of timosaponin BIII and mangiferin in the extract of SAR were 21.9% and 10.3% higher, respectively, than their contents in AR). This suggested that salt processing increased the bioavailability of timosaponin BIII and mangiferin in rats. In addition, the T1/2 of mangiferin was 3.5 h after oral administration of the AR extract. However, the t1/2 of mangiferin in the rats that were administered the SAR extract was prolonged, and it took longer for the compound to be eliminated. Specifically, the MRT of timosaponin BIII was 6.3 h after the oral administration of the AR extract, but the MRT was 5.9 h after SAR administration. After oral administration of the AR extract, the AUC and Cmax of timosaponin AIII were 16.5 μg h L−1 and 4.5 μg L−1, respectively, but after oral administration of the SAR extract, these values significant decreased (7.2 μg h L−1 and 2.18 μg L−1, respectively). Based on these results, we deduced that salt processing likely induced biotransformation, which ultimately affected the PK of the analytes. The pharmacokinetic characteristics in the present experiment are helpful to the research on the substantial basis of the enhanced hypoglycemic effect of AR after salt processing.
4. Discussion
We developed a UPLC-MS/MS method to simultaneously measure and compare the concentrations of three components (timosaponin AIII, timosaponin BIII, and mangiferin) in rat plasma after oral administration of AR and SAR extracts. Puerarin was used as the internal standard. The mobile phase consisted of (0.1% formic acid in water and acetonitrile), and no tailing was observed in the chromatograms. In addition, there was greater resolution in the mass spectra of the three components and IS while operating in negative-ion mode compared to positive-ion mode. The behaviors of the analytes and the sensitivity of detection were also dependent on the CE and CV. The corresponding parameters were optimized with the standard solution to obtain a high response of the analytes. Pretreatment of the rat plasma entailed PP, which was performed using a variety of different organic solvents to compare the effects of each solvent on the efficiency of PP. Methanol, acetonitrile, and ethyl acetate in water were all used for protein precipitation, but the extraction recoveries of the three analytes of interest after PP with ethyl acetate were all low. However, methanol yielded high extraction recoveries, and the chromatograms of the rat plasma samples after PP using methanol precipitation featured more peaks with better peak shapes. Therefore, methanol was chosen as the solvent for PP.The PK parameters of timosaponin AIII were different from that of timosaponin BIII and mangiferin between the AR group and SAR group. Several factors might be involved in the change in the PK behavior of timosaponin AIII after processing of the AR. First, salt processing might have improved the absorption and degradation properties of timosaponin AIII by intestinal flora after oral administration or promoted the metabolism of the compound, such as glycosylation. Therefore, further research should be performed, such as investigating the effect of salt processing on the metabolism and excretion of timosaponin AIII. In addition, metabolism of saponins in rats tends to involve oxygenation and deglycosylation, the processes of which are catalyzed mainly by enzymes in the liver, and there are a large number of bacteria in the intestine that can hydrolyze glycosidic bonds,18 which may lead to a decrease in the total amount of prototypical components entering blood circulation. The metabolism of drugs may also be affected by the pKa of drug molecules, resulting in differences of absorption in the small intestine.19 In general, the results of this study might be helpful for studying how the metabolism, excretion, and bioactivities of AR compare before and after salt processing when administered orally, which would be beneficial for researching potential applications of both AR and SAR in clinical therapy.
5. Conclusion
In this study, we developed a sensitive, rapid, and reliable UPLC-MS/MS method for the simultaneous quantification of timosaponin BIII, timosaponin AIII, and mangiferin in blank rat plasma and successfully utilized the method to measure the concentrations of the three components in rat plasma after oral administration of AR and SAR extracts. Furthermore, the validated method was successfully used to evaluate the effects of salt processing on the PK profiles of each compound in AR after oral administration. Salt processing improved the bioavailability of timosaponin B-III and mangiferin but reduced the absorption of timosaponin AIII in rats. PK was then used to elucidate the synergistic mechanism of the three components after salt processing based on the absorption profiles of the compounds in vivo. The PK parameters of the three components were significantly affected by salt processing. Our results suggested that pharmacokinetic changes of the three active compounds are attributed to the different pharmacological effects between AR and SAR. The significant feature of this paper was that clarify the change of the pharmacokinetic of typical constituents in rat plasma after oral administration of AR and SAR extract, and We combined the PK and previous PD data with the metabolism rule in vivo to elucidate how salt processing enhanced the hypoglycemic effect of AR.Abbreviations
| UPLC-MS/MS | Ultra-high-performance liquid chromatography-tandem mass spectrometry |
| AR | Anemarrhenae Rhizoma |
| MRM | Multiple reaction monitoring |
| ESI | Electrospray ionization |
| IS | Internal standards |
| SAR | Salt-processed Anemarrhenae Rhizoma |
| QC | Quality control |
| RSD | Relative standard deviation |
| RE | Relative error |
Conflicts of interest
The authors declare no conflicts of interest.Acknowledgements
This research was supported by the National Natural Science Foundation of China (Grant No. 81102810).References
- L. Y. Zhong, N. M. Cui and Q. F. Gong, Modern researches on effect of processing of Chinese herb medicine on Chinese medical properties, China J. Chin. Mater. Med., 2019, 44(23), 5109–5113, DOI:10.19540/j.cnki.cjcmm.20190916.301.
- K. Li, N. Zhou and Z. L. Zhang, Modern study on theory of salt-processing enhancing drug into kidney meridian, Chin. Tradit. Herb. Drugs, 2017, 48(24), 5281–5285 Search PubMed.
- Chinese Pharmacopoeia Commission, Pharmacopoeia of the People's Republic of China, China Medical Science and Technology Press, Beijing, 2020, vol. I, p. 222 Search PubMed.
- Z. Wang, J. Cai, Q. Fu, L. Cheng, L. Wu, W. Zhang, Y. Zhang, Y. Jin and C. Zhang, Anti-Inflammatory Activities of Compounds Isolated from the Rhizome of Anemarrhena asphodeloides, Molecules, 2018, 23, 10, DOI:10.3390/molecules23102631.
- H. Wang, J. Y. Dai, Y. Z. He, Z. W. Xia, X. F. Chen, Z. Y. Hong and Y. F. Chai, Therapeutic effect and mechanism of Anemarrhenae Rhizoma on Alzheimer's disease based on multi-platform metabolomics analyses, Front. Pharmacol., 2022, 13, 940555, DOI:10.3389/fphar.2022.940555.
- Y. C. Chu, C. S. Yang, M. J. Cheng, S. L. Fu and J. J. Chen, Comparison of Various Solvent Extracts and Major Bioactive Components from Unsalt-Fried and Salt-Fried Rhizomes of Anemarrhena asphodeloides for Antioxidant, Anti-alpha-Glucosidase, and Anti-Acetylcholinesterase Activities, Antioxidants, 2022, 11, 2, DOI:10.3390/antiox11020385.
- X. Tian, J. Wei, Y. Niu, M. Yang, Y. Jin, Y. Du and Q. Sun, Investigation of pharmacodynamic material basis of Anemarrhenae Rhizoma and its processed products based on plant metabolomics and molecular docking technology, Rapid Commun. Mass Spectrom., 2023, 37(7), e9473, DOI:10.1002/rcm.9473.
- Y. Q. Yu, L. Yan, X. T. Wang, L. Li, W. Zheng and H. Gao, Study on the Effects of Chinese Materia Medica Processing on the Hypoglycemic Activity and Chemical Composition of Anemarrhenae Rhizoma, Evidence-Based Complementary Altern. Med., 2021, 2021, 6211609, DOI:10.1155/2021/6211609.
- W. Zheng, Y. Li and H. Gao, Analysis on Changes of Chemical Composition Contents and Efficacy of Improving Insulin Resistance in Type 2 Diabetic Mice of Anemarrhenae Rhizoma Before and After Processing with Salt-water, Chin. J. Exp. Tradit. Med. Formulae, 2020, 26(22), 140–147, DOI:10.13422/j.cnki.syfjx.20202150.
- Y. N. Li, F. Gu, Y. F. Yang and Y. Shi, Study on Pathogenesis and Treatment of Diabetes Based on Theory of Huangdi Neijing, J Prac Trad Chin Int Med., 2022, 36(02), 32–34, DOI:10.13729/j.issn.1671-7813.Z20210579.
- L. Yan, Y. Wu and H. Gao, Determination of 4 Kinds of Saponnins in Rhizoma Anemarrhenae Before and After Processing by HPLC-CAD, Chin. Med. J. Res. Prac., 2019, 33(01), 46–49, DOI:10.13728/j.1673-6427.2019.01.011.
- B. Z. Song, Y. Wu and H. Gao, Determination of neomangiferin, mangiferin, and isomangiferin in Anemarrhenae Rhizoma before and after stir-frying with salt-water by HPLC, Drugs Clin., 2015, 30(02), 145–148 Search PubMed.
- Y. Wei, W. Y. Wu, D. Zhao, Y. Y. Xu, J. M. Xu and H. T. Xu, Study on hypoglycemic activity of mangiferin and its pharmacokinetics in vivo, J. Chongqing Med. Univ., 2022, 47(04), 387–392, DOI:10.13406/j.cnki.cyxb.003012.
- H. Q. Wang, F. Lan, Y. H. Zhang, J. E. Xia, X. M. Gong and M. Liu, Identification and pharmacokinetics of saponins in Rhizoma Anemarrhenae after oral administration to rats by HPLC-Q-TOF/MS and HPLC-MS/MS, Acta Pharm., 2021, 71(4), 567–585, DOI:10.2478/acph-2021-0033.
- X. T. Wang, L. S. Yan, Y. Dong, X. Y. Wang and H. Gao, The effects of incremental components from salt Rhizoma Anemarrhenae on glucose consumption in HepG-2 cells, Chin. J. Hosp. Pharm., 2018, 38(16), 1694–1696, DOI:10.13286/j.cnki.chinhosppharmacyj.2018.16.06.
- N. Wang, P. Xu, X. Wang, W. Yao, B. Wang, Y. Wu and D. Shou, Timosaponin AIII attenuates inflammatory injury in AGEs-induced osteoblast and alloxan-induced diabetic osteoporosis zebrafish by modulating the RAGE/MAPK signaling pathways, Phytomedicine, 2020, 75, 153247, DOI:10.1016/j.phymed.2020.153247.
- Q. Zhang, X. Kong, H. Yuan, H. Guan, Y. Li and Y. Niu, Mangiferin Improved Palmitate-Induced-Insulin Resistance by Promoting Free Fatty Acid Metabolism in HepG2 and C2C12 Cells via PPARalpha: Mangiferin Improved Insulin Resistance, J. Diabetes Res., 2019, 2019, 2052675, DOI:10.1155/2019/2052675.
- J. Xu, H. B. Chen and S. L. Li, Understanding the Molecular Mechanisms of the Interplay Between Herbal Medicines and Gut Microbiota, Med. Res. Rev., 2017, 37(5), 1140–1185, DOI:10.1002/med.21431.
- C. Li, C. Chen, W. W. Jia, Y. J. Ling, X. Yu and E. Olajide, OLALEYE. Multi-compound pharmacokinetic research on Chinese herbal medicines: identifying potentially therapeutic compounds and characterizing their disposition and pharmacokinetics, Acta Pharm. Sin., 2021, 56(09), 2426–2446, DOI:10.16438/j.0513-4870.2021-0839.
| This journal is © The Royal Society of Chemistry 2023 |