 Open Access Article
Synthesis of fructose bound Fe(III) integrated carbon dots as a robust turn-off detection sensor for chlortoluron
Rania,
Faiz Ali *a,
Mian Muhammad
 a,
Behisht Arab and
Aftab Ali Shahac
aDepartment of Chemistry, University of Malakand, Khyber Pakhtunkhwa, Pakistan. E-mail: faizy186@gmail.com
bInstitute of Chemical Sciences, University of Peshawar, Pakistan
cDepartment of Biotechnology, University of Malakand, Khyber Pakhtunkhwa, Pakistan
First published on 6th June 2023
Abstract
A simple, sensitive, and robust fluorescent sensor for chlortoluron detection has been developed. Fluorescent carbon dots were synthesized using ethylene diamine and fructose via a hydrothermal protocol. The molecular interaction between fructose carbon dots and Fe(III) resulted in a fluorescent metastable state exhibiting remarkable fluorescence quenching at λem of 454 nm and interestingly, further quenching occurred upon the addition of chlortoluron. The quenching in the fluorescence intensity of CDF-Fe(III) towards chlortoluron occurred in the concentration range of 0.2–5.0 μg mL−1 where the limit of detection was found to be 0.0467 μg mL−1, the limit of quantification was 0.14 μg mL−1, and the relative standard deviation was 0.568%. The selective and specific recognitive nature of the Fe(III) integrated fructose bound carbon dots towards the chlortoluron make it a suitable sensor for real sample applications. The proposed strategy was applied for the determination of chlortoluron in soil, water, and wheat samples with recoveries in the range of 95% to 104.3%.
Introduction
In agriculture, pesticides are generally used to control/eradicate pests and weeds from disrupting the crop chain to meet the food requirements for the ever-growing population.1 But nevertheless, a small concentration of their residues could cause serious threats to the environment as well as to the health of living organisms worldwide.1,2 The concentration of pesticides needs to be determined accurately through robust, cost-effective, and quickly validated analytical protocols and strategies.3–13In the early 1950s, phenyl urea was first employed to prevent weeds from growing in the cereal and poppy crops. Chlortoluron belonging to the class of phenyl urea derivatives is one of the excessively used herbicides with higher efficiency to control the broad-leaved weeds and annual grasses in the agricultural crops. It has often been detected in the surface and groundwater at concentrations ranging from 9.4 × 10⁻¹⁰ mol L−1 to 5.7 × 10⁻⁹ mol L−1. Although its solubility in water is low, its minute concentration can lead to drastic consequences.14 The long-term use of chlortoluron can lead to water pollution while the long-term exposure might result in carcinogenic effects.14–16 The chronic exposure to the chlortoluron exhibits carcinogenic properties and is directly toxic to the aquatic organisms. Chlortoluron is a potential human carcinogen and has been classified as a group 2B carcinogen by the international agency for research on cancer (IARC). The IARC monograph on the evaluation of carcinogenic risks to humans provides evidence of chlortoluron-induced tumours in the experimental animals, including mice and rats. These studies suggests that chlortoluron might cause tumours in several organs such as liver, urinary bladder, and thyroid. Exposure to chlortoluron can cause eye and skin irritation, respiratory problems, and digestive problems. Detection of chlortoluron is important for food safety, environmental protection, and regulatory compliance. Its detection can help monitor the herbicide level in the environment which might be helpful in the development of the relevant regulations/policies.15–18
New method development for the rapid, sensitive, simple, and selective quantification of chlortoluron is a challenging task.14 The available laboratory-based procedures for the chlortoluron detection are high-performance liquid chromatography,1 gas chromatography,1 enzyme-linked to immunosorbent testing,2 capillary electrophoresis, and electrochemical techniques.2 These analytical methods are associated with limitations such as longer analysis time, complicated operating procedure, tedious sample preparation, instrumentation cost and highly skilled technicians.14
The optical analysis methods offer better alternative for the pesticide analysis as these usually include simple instrumentation, cheaper reagents, shorter analysis time, and operational ease. Fluorescence-based sensors for the determination of pesticides including quantum dots, organic dyes, fluorescent proteins, and metal–organic frameworks have been reported.19,20
In 2004, during the cleaning of a single-walled carbon nanotubes the carbon dots were accidently discovered.21 The CDs are analogous to quantum dots with structural resemblances to those of the graphite oxide particles and they are one of the new carbon nanomaterials with sp3 bonded carbon skeleton belonging to the class of 0-dimensional carbon nanoparticles.21–23 The carbon dots are amorphous to nanocrystalline in structures with particle diameters of less than 10 nm. Since their discovery in early 2000s, CDs have been regarded as the green alternatives to the traditional quantum dots (QDs).24 Those materials consist of nitrogen and oxygen-based groups as well as the modified functional groups cause easy binding/interaction with target molecules.21–25 CDs have been widely used in various fields due to their remarkable properties such as stability, biocompatibility, photoluminescent nature, low toxicity, functionalization, low cost, higher solubility, and facile synthesis.1,2,26–37 Fluorescence emission is a defining property of carbon dots (CDs) making them an attractive sensing media in fluorescence sensing.
CD-based sensor systems are used to detect metal ions such as K+, Cu2+, Ag+, and Hg2+ in addition, they are reported for the detection of materials and biological agents such as bacteria, viruses, and pathogenic organisms. There are very limited reports on the detection of pesticides employing the carbon dot-based systems as the sensing media and this field of research is in the evolutionary phase.38–41
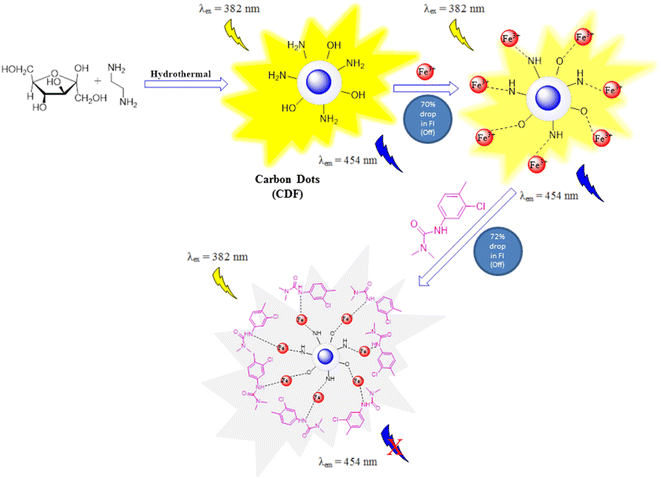
This study demonstrates the synthesis of fructose containing carbon dots using the ethylene diamine and fructose through the hydrothermal protocol. Using the ethylene diamine as a nitrogen source with fructose precursor for the synthesis of fructose based caron dots has not been reported prior to this study. The CDF came out with very good results when checked for the determination of chlortoluron. The synthesized CDF has excellent porous and fluorescent active nature with stable fluorescent intensity in the aqueous medium. In the presence of Fe(III) the fluorescence intensity of the CDF was quenched due to the formation of a metastable fluorescent ground state complex CDF-Fe(III). The addition of chlortoluron to the CDF-Fe(III) solution resulted in further quenching of the fluorescence intensity which confirmed the reliability of the procedure for better sensing. Under the optimized conditions, the proposed method was validated using the different statistical parameters and analytical figures of merit. The analytically validated method was applied for the chlortoluron determination in different spiked and real environmental samples.
Experimental
Chemicals and reagents
Technical standard of the analyte chlortoluron and other pesticides including pirimicarb, mesotrione, imidacloprid, carbofuran, methomyl, and atrazine were purchased from Dr Ehrenstrofer, Promochem, Germany through local vendors. For the preparation of Britton Robinson buffer, phosphoric acid (85%), boric acid (ACS reagent grade), glacial acetic acid (ACS reagent, ≥99.7%) NaOH (Sigma-Aldrich, Germany) and iron chloride hexahydrate (Sigma-Aldrich, Germany) were used in this work.Instruments
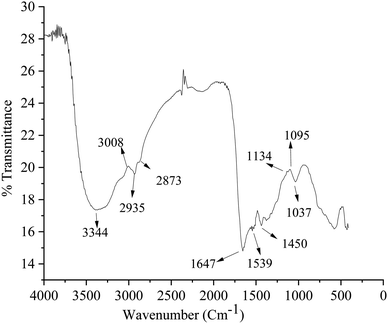
Analog pH meter (Model PHS-3BW, 2908 N, Chicago USA) for pH measurement, SEM (JSM 5910, JEOL Japan), TEM for analysing the CDF surface morphology, particle size analyzer (Master sizer), FTIR (PerkinElmer, spectrum version 10.5.1) for the investigation of surface functional groups and EDX (JSM-6390LV) for the elemental composition were used as the characterization tool for the CDF and the spectrofluorometer (RF-5301, PC, Shimadzu, Japan) was used for fluorescence measurement.Solutions
Stock solutions (100 μg mL−1) of chlortoluron, iron chloride hexahydrate (FeCl3. 6H2O) and carbon dots were prepared. In distilled water, dilute solutions were prepared by dissolving calculated volumes of the stock solutions. Britton Robinson buffer was used for pH adjustments; Britton Robinson buffer was prepared by mixing different volumes of 0.04 M (CH3COOH), 0.04 M (H3PO4), 0.04 M (H3BO3) solutions in a volumetric flask (1000 mL). Buffers of different pH were prepared by adding different volumes of NaOH (0.2 M) to the acid mixture.CDF synthesis
The fluorescent CDF was synthesized via hydrothermal method following bottom-up approach.1,38 Carbon dots synthesis was carried out in several steps. Ethylene diamine (1.39 mL) and fructose (0.8 g) were dissolved in 30 mL distilled water. The mixtures were sealed and autoclaved at 120 °C for 10 h. The resulting brown colour product was dried for 3–4 days in an oven at 140 °C. The dried samples were dispersed in 20 mL ethanol and sonicated for 30 min, followed by centrifugation for 20 min at 12![[thin space (1/6-em)]](https://www.rsc.org/images/entities/char_2009.gif) 000 rpm. The solvent was filtered removed and the resulting sample was dried in oven. Finally, the brownish-black colour carbon dots (CDF) obtained were used for further studies. The synthesis procedure for CDF is schematically illustrated in Fig. 1.
000 rpm. The solvent was filtered removed and the resulting sample was dried in oven. Finally, the brownish-black colour carbon dots (CDF) obtained were used for further studies. The synthesis procedure for CDF is schematically illustrated in Fig. 1.
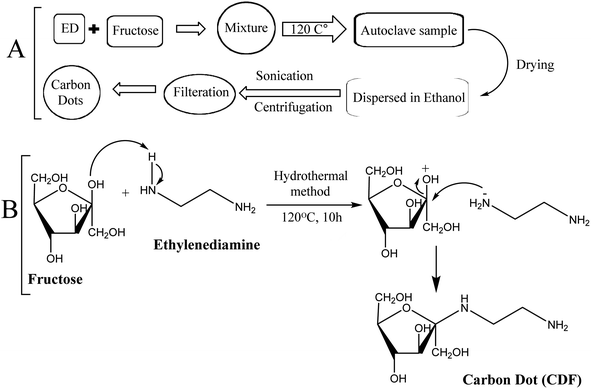 | ||
| Fig. 1 The Schematic representation (A) and reaction scheme (B) for the synthesis of fructose containing carbon dots. | ||
Chlortoluron sensing phenomena
All fluorescence spectra were recorded using a spectrofluorometer equipped with quartz cell having an excitation and emission slit width of 5 nm and an excitation wavelength of 382 nm. In a series of 10 mL volumetric flasks, 3.0 mL of CDF (100 μg mL−1) and 1.5 mL of Fe(III) solution (100 μg mL−1) were mixed to achieve concentration of 30 μg mL−1 and 15 μg mL−1 respectively. Variable volumes in the range of 0.2–0.5 mL from the chlortoluron solution (10 μg mL−1) were added sequentially in different flasks to achieve concentration in the range of 0.2–0.5 μg mL−1 upon dilution up to the mark with distilled water. Similarly, a blank solution was also prepared which contains all the reagents except analyte. The fluorescence intensity of each solution was measured against the reagent blank at λem = 454 nm. Further, the structural stability and luminescence of the nanomaterial was studied to evaluate the feasibility of CDF as a fluorescent probe in aqueous medium.The interfering effects
For investigating the selectivity of the proposed method, a series of volumetric flasks (10 mL) containing 0.5 mL of the chlortoluron (10 μg mL−1) was set up and different pesticides in the range of 0.2–0.6 mL were added from their stock solutions (100 μg mL−1). Fe(III) and CDF were added to each flask and the fluorescence intensity was measured against their respective blank. Similarly, for the investigation of the metal ion effect a series of flasks (10 mL), containing 0.5 mL chlortoluron (10 μg mL−1) and 3.0 mL CDF (100 μg mL−1) were taken followed by the addition of metal ions in the range of 0.2–0.6 mL from their respective stock solutions (100 μg mL−1). The fluorescence intensity was recorded against the reagent blank in all the cases.Samples collection/preparation
To justify the feasibility of CDF as sensor for practical applications in different environmental samples, spiking and recovery studies were conducted. Water samples (river, lake, drinking) soil and wheat grain samples were selected. All the samples from crop fields and water sources were collected from areas where there the chlortoluron was not used and samples were made cleaned. Triplicates of each of the sample (soil and wheat grains ∼5–15 g and water ∼2–6 mL) were taken and spiked with standard chlortoluron solution corresponding to 2.0, 4.0 and 6.0 μg mL−1 for soil and grain and 0.1, 0.3 and 0.5 μg mL−1 for water sample. The respective sample blanks for each of the samples were prepared and 20 mL distilled water was added to each. All samples were left in position for 1 h prior to extraction.Chlortoluron extraction from soil and grain samples
Each sample was filtered and taken in flask. 2.0 mL filtrate of each sample was transferred to 10 mL flask and optimized concentration of CDF, Fe(III) and BR buffer were added. Each sample was analyzed by the proposed method.Appropriate volumes of all cleaned extracts were taken in beakers. The optimized concentration of CDF solution: 30 μg mL−1, Fe(III): 15 μg mL−1, 0.5 μg mL−1 of chlortoluron solution and 4.0 mL of the BR buffer with pH 12 were added to each sample. Each combination was transferred to the flask (10 mL) and diluted with distilled water and the fluorescence intensity in each case was measured against the blank. Chlortoluron concentration and the % recovery was calculated in each case.
Results and discussion
Characterization of fructose bound carbon dots
SEM and TEM analysis of the carbon dots
The CDF morphology was examined via the scanning electron microscope (Fig. 3A) and transmission electron microscope (Fig. 3B). The CDF particles seems in the form of clusters being visualized in low resolution SEM imaging. The individual carbon dot particles are visualized in the high-resolution TEM imaging which suggests a particle size of ranging from 0.1 to 1 nm. The TEM image also suggests the uniform distribution of the individual particles.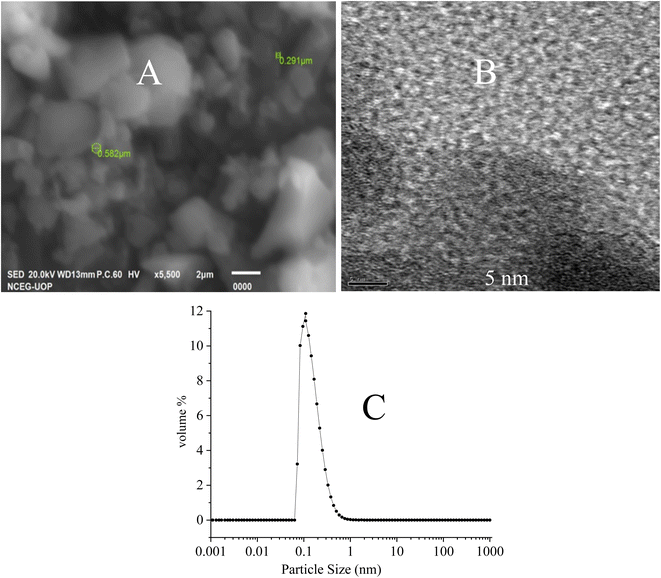 | ||
| Fig. 3 (A): SEM image (taken in 2 μm scale bar) (B): TEM image (taken in 5 nm scale bar) of the CDF nanoparticles and (C): volume % particle size distribution of carbon dots. | ||
Particle size of carbon dots
The synthesized carbon dots were characterized for particle size distribution data as shown in Fig. 3C. The particle size of the carbon dots (in the range of 0.5 nm) is in strong agreement with particle size being shown in the TEM image (Fig. 3B).Energy dispersive X-ray
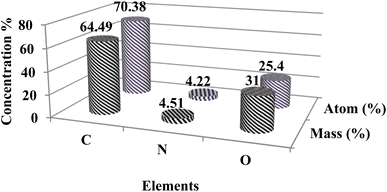
EDX spectrum of the CDF showed the presence of different elements with carbon as the dominant element. The percentage of C, O, and N are 70.38%, 25.4%, and 4.22% respectively as shown in Fig. 4.Chlortoluron “turn-off” fluorescence detection of CDF
The fluorescence intensity response of the CDF-Fe(III) sensor against chlortoluron was investigated (Fig. 5). The higher concentration of chlortoluron resulted in a significant decrease in the fluorescence intensity at emission wavelength of 454 nm when excited at 382 nm. Under the optimized conditions the quenching in fluorescence intensity of the CDF-Fe(III) towards chlortoluron clearly shows a linear decrease in the concentration range of 0.2–5.0 μg mL−1 with a 72% drop in the FI having the detection limit of 0.0467 μg mL−1.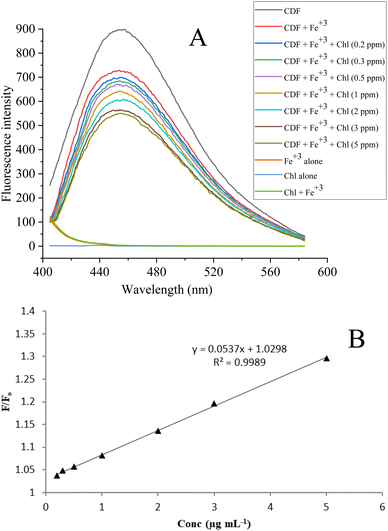 | ||
| Fig. 5 Effect of the Chl. Concentration on quenching of fructose carbon dots in the form of fluorescence emission spectra (A) and the Stern–Volmer plot showing the linear range of detection (B). | ||
Quenching effect of the CDF and Fe(III) solutions
5.0 μg mL−1 of Fe(III) and chlortoluron solutions were added to a CDF solution having concentration in the range of 2.0–40.0 μg mL−1. Maximum quenching was achieved with 30 μg mL−1 of CDF and 0.5 μg mL−1 of the chlortoluron solution as shown in Fig. 6a. The quenching phenomena could be described quantitatively by the Stern–Volmer equation “Fo/F = 1 + KSV [Q]” where F and Fo are the fluorescence intensity of CDF solution before and after the addition of Fe(III) solution respectively. [Q] is the molar concentration of chlortoluron, and [KSV] is the Stern–Volmer quenching constant. The fluorescence quenching efficiency gradually increased with increasing the concentration of CDF up to 30 μg mL−1. Exceeding the CDF dose from 30 μg mL−1 resulted in the lower quenching efficiency and hence it was selected as the optimal amount and used for further fluorescent studies.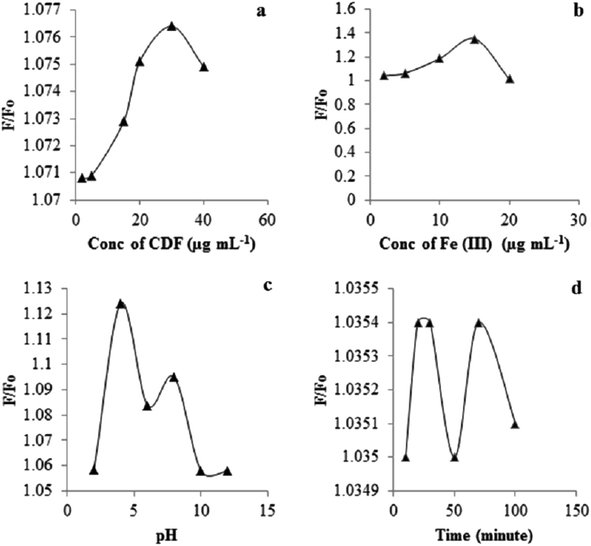 | ||
| Fig. 6 Concentration effect of the CDF (a), Fe(III) (b) and effect of the pH (c), and equilibration time (d) on quenching. | ||
The presence of amine groups at the CDF surface exhibiting the excellent fluorescence characteristics lead us to investigate the CDF fluorescence response to different concentrations of Fe(III) solution at 25 °C (Fig. 6b). The gradual addition of Fe(III) solution to the aqueous solution of CDF resulted in immediate decreased intensity of the emission peak at 454 nm. When the concentration of Fe(III) ion was increased from 2.0 μg mL−1 to 20 μg mL−1 there was a drop in the FI of CDF. The differential quenching effects of Fe(III) are related to their electronic status. Since the presence of unsaturated electronic states in Fe(III) can lead to non-radiative energy/charge transfer from CDF to Fe(III), the quenching in FI of the CDF by Fe(III) ions can be attributed to the formation of Fe(III) complex at the CDF surface.
pH and time effect
During the fluorescence detection of chlortoluron pH of the sensing medium plays an essential role. As shown in Fig. 6c the fluorescence intensity of the CDF-Fe(III) sensor increased with increasing pH and has a maximum value at pH 4.0, and the FI decreased as the pH increased above 8.0. Strong FI peak was observed in the pH range of (4–8). Under acidic conditions the surface groups of CDF-Fe(III) are protonated and able to coordinate with chlortoluron. Thus pH 4.0 is the optimum pH for further study. As a result of time effect investigation, no significant change was detected on the stability of CDF-Fe(III) in different time intervals (Fig. 6d).Sensing mechanism
The exact mechanism of fluorescent properties of carbon dots (CDs) is not well established yet.1 The CDF contains a basic amine and hydroxyl groups at its surface. The fluorescent activity is generated from electron–hole recombination pathways as well as from surface-trapped states. Upon excitation at 382 nm, the electrons jumped to a higher energy level and therefore exhibit a beautiful blue fluorescence. Chemical sensing is performed by monitoring changes in the CDF fluorescence in the presence of a target analyte. The presence of heteroatoms can potentially improve sensing performance and be made tailored to interact with specific analyte. For instance, CDF synthesized from ethylene diamine and fructose exhibit high selectivity towards Fe(III). The high affinity of CDF towards Fe(III) and the presence of nitrogen and oxygen groups in CDF allow for rapid chelation. A static fluorescence quenching mechanism is usually operative indicating the formation of a non-radiative complex between the CDF and the Fe(III). Initially, Fe(III) quenches the fluorescence of the CDF via the complex formation. The fluorescence quenching effect of Fe(III) was much stronger, which demonstrated that CDF has high selectivity for Fe(III).42 This phenomenon led to the quenching in the FI of the CDF-Fe(III) being reflected in its high binding affinity to the CDF.43 The quenching effect of Fe(III) at 454 nm can be attributed to the charge transfer between CDF and Fe(III) ion.2CDF sensing might consider such unique approaches towards the analyte sensing in comparison to the traditional methods. Deep understanding of the role of physical, chemical, and optical properties of the CDF can help improve the detection limits of the synthesized carbon dots.42 Which functional group/groups at the CDF surface were actively taking part during the interaction of the CDF with the target chlortoluron and do the pesticide complexed with the surface functional groups requires a deep insight into various phenomena. The chlortoluron might undergo ionic interactions, H-bonding, and covalent binding with the available groups at the surface of the CDF-Fe(III) resulting in the fluorescence quenching of CDF-Fe(III). Two types of the fluorescence quenching are collisional/dynamic quenching and static quenching.43 Static quenching is caused by the interaction of an empty orbital in the quencher ion with pi (π) electrons of the CDF, which can form a complex and then results in fluorescence quenching. Thus, excited-state reactions, molecular rearrangements, ground–state complex formation, collisional quenching, energy/electron transfer and emission group destruction lead to fluorescence quenching. The chlortoluron ∼CDF-Fe(III) interactions were driven by the ground state complex formation via the amino and hydroxyl groups. The dynamic quenching does not bring any persistent difference in the molecules although there is a minor involvement of a dynamic electron transfer reaction. An estimated sketch demonstrating the sensing mechanism is given in Fig. 7.
Chlortoluron addition to the CDF-Fe(III) solution rapidly quenched the CDF fluorescence. Thus, the CDF-Fe-Chl system was constructed to analyse the chlortoluron concentration. The chlortoluron ∼CDF-Fe(III) interactions were studied by the spectrofluorometer. The Stern–Volmer equation was used for the data processing.23,43–45
Selectivity of the probe and effect of other metal ions
The fluorescence response of the probe CDF-Fe(III) towards the chlortoluron in presence of several pesticides (pirimicarb, mesotrione, imidacloprid, carbofuran, methomyl, mesotrione, atrazine) and metal ions (Na+, Ca2+, Mg2+, K+, Cu+, Zn2+, Ag+, Cr3+, Co2+ and Cd2+) was carried out. The FI quenching response (F/Fo) of CDF towards the chlortoluron was much higher in comparison to those of the other pesticides and remained unaffected in the presence of other pesticides (Fig. 8A). Similarly, The FI response (F/Fo) of CDF was higher towards chlortoluron in the presence of Fe(III) in comparison to those in the presence of other metal ions (Fig. 8B). It indicates that there was no significant interference from similar types of metal ions in the sensing process. The results showed that other ions had no obvious quenching effect on the fluorescence of the probe being designed in current study. | ||
| Fig. 8 Selective fluorescence response of CDF-Fe(III) probe towards chlortoluron in the presence of pesticides (A) and in the presence of metal ions (B). | ||
The quenching phenomena could be described quantitatively by the Stern–Volmer equation “Fo/F = 1 + KSV [Q]” where F is the fluorescence intensity of the CDF solution alone and Fo is the fluorescence intensity of the CDF solution in the presence of chlortoluron (Chl). In this phenomenon of quenching, F is higher than Fo because F is the original fluorescence intensity of the CDF alone while Fo is the fluorescence intensity of the CDF in the presence of chlortoluron. Since the quenching of CDF being observed in the presence of chlortoluron is higher which means lower fluorescence intensity for Fo which in turns mean the higher ratio for F/Fo. In Fig. 5A, the red plot has been plotted using the CDF fluorescence intensity as F and that of the CDF + Fe(III) as Fo. Similarly, in the case of chlortoluron in the expression “F/Fo” F is the fluorescence intensity of CDF + Fe(III) in the absence of chlortoluron and Fo is the fluorescence intensity of CDF + Fe(III) in the presence of chlortoluron. Further quenching occurred after the addition of chlortoluron in the range of 0.2–0.5 μg mL−1 and hence the ratio F/Fo went on increasing linearly.
In the plots given in Fig. 8A and B we plotted the quenching efficiency taken on Y-axis in the form of F/Fo against the concentration of the interfering species being taken on X-axis. In the absence of the interfering species the quenching of the system containing the chlortoluron is maximum where the ratio F/Fo is around 1.1, while in the presence of interfering species change in the quenching efficiency has been plotted against the concentration of the interfering specie. Since the change in quenching efficiency is very small in the presence of interferant and we indicated that small change in quenching efficiency in the Figure. That's why the value has been dropped to a significant level that is around 0.2 in the plots which is the change in quenching efficiency as a result of interferant addition.
For further clarification, the ref. 23 and 44 are added to manuscript. But nevertheless, some pesticides such as pirimicarb (PRC) and methomyl (MT) can interfere showing a little higher change in the quenching efficiency of the system during the detection of chlortoluron. The change in quenching efficiency in the presence of the PRC and MT which is around 0.5 can be seen in the Fig. 8A. While no significant change in the quenching efficiency of the system was observed by the addition of metal ions as shown in Fig. 8B.
Stability of the carbon dots
The carbon dots synthesized in current project are mechanically, thermally, and chemically stable for longer periods of time making them suitable for practical applications. The stability of the synthesized carbon dots was checked after regular interval of times that is right after synthesis, after three months, after six months and at the end of the year. The stability was checked mechanically, thermally, and chemically. The CDF were stable under acidic and neutral conditions, but their stability decreased slightly at higher alkaline conditions. At elevated pH, the fluorescence intensity slightly decreased which might suggest the unstable nature of the CDF at pH higher than 10.Application of the proposed method to real sample analysis
To practicalize the sensor feasibility, sensing of the resultant probe was conducted in various environmental samples such as water samples (river, lake, and drinking) soil and wheat grain samples. The highest recovery percentage was achieved in all the cases showing the applicability of the proposed method. The recovery percentage ranges from 95% to 104.3% ± 2.24 (Table 1) indicating that this fluorescent sensor system has reasonable accuracy and can be used for detection of chlortoluron in practical samples.| Sample | Mass of sample | μg of the Chl added | F/Fo | Conc found (μg mL−1) | Mass of Chl found (μg) | Percent recovery | Average% recovery ± SD |
|---|---|---|---|---|---|---|---|
| Wheat grains | 5.0 g | 20 | 1.0398 | 0.186 | 18.6 | 93.10 | 95.17 ± 2.17 |
| 40 | 1.0502 | 0.379 | 37.9 | 94.97 | |||
| 60 | 1.0612 | 0.584 | 58.4 | 97.45 | |||
| 10 g | 20 | 1.0402 | 0.193 | 19.3 | 96.83 | 98.79 ± 1.70 | |
| 40 | 1.0512 | 0.398 | 39.8 | 99.62 | |||
| 60 | 1.062 | 0.599 | 59.9 | 99.93 | |||
| 15 g | 20 | 1.0404 | 0.197 | 19.7 | 98.69 | 100.66 ± 2.41 | |
| 40 | 1.052 | 0.413 | 41.3 | 103.35 | |||
| 60 | 1.062 | 0.599 | 59.9 | 99.93 | |||
| Soil sample | 5.0 g | 20 | 1.0405 | 0.199 | 19.9 | 99.62 | 99.42 ± 0.35 |
| 40 | 1.0512 | 0.398 | 39.8 | 99.62 | |||
| 60 | 1.0617 | 0.594 | 59.4 | 99.00 | |||
| 10 g | 20 | 1.0408 | 0.204 | 20.4 | 102.42 | 101.28 ± 1.25 | |
| 40 | 1.0516 | 0.405 | 40.5 | 101.48 | |||
| 60 | 1.062 | 0.599 | 59.96 | 99.93 | |||
| 15 g | 20 | 1.0408 | 0.204 | 20.4 | 102.42 | 100.55 ± 1.61 | |
| 40 | 1.0512 | 0.398 | 39.8 | 99.62 | |||
| 60 | 1.0619 | 0.597 | 59.7 | 99.62 | |||
| River water | 2.0 mL | 1 | 1.035 | 0.0968 | 0.96 | 96.83 | 99.23 ± 2.48 |
| 3 | 1.0462 | 0.305 | 3.05 | 101.80 | |||
| 5 | 1.0564 | 0.495 | 4.9 | 99.06 | |||
| 4.0 mL | 1 | 1.0349 | 0.094 | 0.94 | 94.97 | 99.85 ± 0.74 | |
| 3 | 1.0459 | 0.299 | 2.99 | 99.93 | |||
| 5 | 1.0564 | 0.495 | 4.95 | 99.06 | |||
| 6.0 mL | 1 | 1.0352 | 0.100 | 1.00 | 100.55 | 100.55 ± 1.36 | |
| 3 | 1.0462 | 0.305 | 3.05 | 101.80 | |||
| 5 | 1.0564 | 0.495 | 4.95 | 99.06 | |||
| Lake water | 2.0 | 1 | 1.0352 | 0.100 | 1.00 | 100.55 | 101.46 ± 0.79 |
| 3 | 1.0462 | 0.305 | 3.05 | 101.80 | |||
| 5 | 1.0572 | 0.510 | 5.10 | 102.04 | |||
| 4.0 | 1 | 1.0352 | 0.100 | 1.00 | 100.55 | 101.88 ± 2.48 | |
| 3 | 1.0458 | 0.297 | 2.97 | 99.31 | |||
| 5 | 1.0572 | 0.510 | 5.10 | 102.04 | |||
| 6.0 | 1 | 1.0354 | 0.104 | 1.04 | 104.28 | 104.28 ± 2.83 | |
| 3 | 1.0458 | 0.297 | 2.97 | 99.31 | |||
| 5 | 1.0565 | 0.497 | 4.97 | 99.44 | |||
| Drinking water | 2.0 | 1 | 1.0352 | 0.100 | 1.00 | 100.55 | 99.56 ± 0.93 |
| 3 | 1.0457 | 0.296 | 2.96 | 98.69 | |||
| 5 | 1.0565 | 0.497 | 4.97 | 99.44 | |||
| 4.0 | 1 | 1.0352 | 0.100 | 1.00 | 100.55 | 100.64 ± 1.36 | |
| 3 | 1.0458 | 0.297 | 2.97 | 99.31 | |||
| 5 | 1.0572 | 0.510 | 5.10 | 102.04 | |||
| 6.0 | 1 | 1.0352 | 0.100 | 1.00 | 100.55 | 100.55 ± 0.79 | |
| 3 | 1.0462 | 0.305 | 3.05 | 101.80 | |||
| 5 | 1.0572 | 0.510 | 5.10 | 102.04 |
Analytical figures of merit
The calibration curve was observed to be linear over a concentration range of 0.2 to 5.0 μg mL−1 under optimum experimental conditions of the proposed method. The linear regression equation, slope, intercept, regression coefficient, standard deviation, and relative standard deviation of the response factors are summarized in Table 2.| Title | Value |
|---|---|
| λex (nm) | 382 nm |
| λem (nm) | 454 nm |
| Linear range (μg mL−1) | (0.2–5.0 μg mL−1) |
| Slope | 0.0537 |
| Intercept | 1.0298 |
| Regression equation | y = 0.0537x + 1.0298 |
| Regression coefficient (R2) | 0.9989 |
| Standard deviation SD (μg mL−1) | 0.00076 μg mL−1 |
| Relative standard deviation RSD (%) | 0.568% |
| LOD (μg mL−1) | 0.0467 μg mL−1 |
| LOQ (μg mL−1) | 0.14 μg mL−1 |
Comparative study of the proposed sensor probe
There are limited reports on the determination of chlortoluron being summarized in Table 3. The comparison of the results obtained in current study with those of the previous studies for confirming the validity of the proposed method goes in strong favour of the sensing probe being designed in current study. The parameters selected for comparison were % recovery, R2, LOD, linear range, and RSD. The comparison confirms that the proposed method is comparable or even better to some of the reported designed sensor probes.| Method/technique | % Recovery | R2 | LOD (μg mL−1) | Linear range (μg mL−1) | RSD (%) | References |
|---|---|---|---|---|---|---|
| HPLC-UV | 84–110.3 | 0.998 | 0.35 | 2.12 × 10⁻³–21.2 | 7.7 | 6 |
| MIP | 96.9–104.7 | 0.996 | 5.1 × 10⁻⁴ | 2.12–21.2 | 5.2 | 46 |
| HPLC | 91–98 | 0.960 | 1.2 × 10⁻⁵ | 1.0 × 10⁻⁵–0.001 | 13 | 47 |
| FI-CL | 95.0–105.3 | 0.997 | 3.0 × 10⁻⁶ | 1.0 × 10⁻⁵–0.07 | Less than 4 | 48 |
| Electrochemical method | 98–115 | 0.998 | 9.99 × 10⁻⁵ | 2.12 × 10⁻⁴–2.12 × 10⁻² | Less than 2.5 | 49 |
| Spectrofluorimetry | 95–104.3 | 0.999 | 4.67 × 10⁻² | 0.2–5.0 | 0.568 | Current work |
Conclusions
A facile procedure for the direct synthesis of the fructose bound carbon dots has been proposed. The fluorescence intensity of the synthesized dots was quenched in the presence of Fe(III) due to the formation of non/less fluorescent CDF-Fe(III) ground state complex. The FI intensity was further quenched upon chlortoluron addition to the system owing to the affinity of the chlortoluron towards Fe(III). Thus, a reliable determination method for the chlortoluron was developed which can be used for the determination of chlortoluron traces in real samples with high sensitivity, good specificity, good accuracy and precision, wide linear range and acceptable recovery. The fast, simple, and cost-effective sensing system proposed and designed in current study has a great potential for practical use.Conflicts of interest
There are no conflicts to declare.Acknowledgements
This research was supported by the University of Malakand through Higher Education Commission (HEC) of Pakistan Project 20-14499/NRPU/R&D/HEC/2021.References
- F. A. Tafreshi, Z. Fatahi, S. F. Ghasemi, A. Taherian and N. EsfandiariI, PLoS One, 2020, 15, e0230646 CrossRef PubMed.
- M. J. Deka, P. Dutta, S. Sarma, O. K. Medhi, N. C. Talukdar and D. Chowdhury, Heliyon, 2019, 5, e01985 CrossRef PubMed.
- J. M. Calatayud, J. G. d. Ascencao and J. R. A. Garcıa, J. Fluoresc., 2006, 16, 61–67 CrossRef CAS PubMed.
- P. Mandal, D. Sahoo, P. Sarkar, K. Chakraborty and S. Das, R. Soc. Chem., 2019, 43, 12137–12151 CAS.
- M. V. Navarro, M. A. Cabezon and P. C. Damiani, J. Chem., 2020, 1–17 Search PubMed.
- T. Liu, H. Su, X. Qu, P. Ju, L. Cui and S. Ai, Sens. Actuators, B, 2011, 160, 1255–1261 CrossRef CAS.
- S. Zhao, J. Lei, D. Huo, C. Hou, P. Yang, J. Huang and X. Luo, Anal. Methods, 2018, 10, 5507–5515 RSC.
- K. Flynn, D. Lothenbach, F. Whiteman, D. Hammermeister, L. W. Touart, J. Swintek and R. Johnson, Environ. Toxicol. Chem., 2017, 36, 3387–3403 CrossRef CAS PubMed.
- J. V. Dias, V. Cutillas, A. Lozano, I. R. Pizzutti and A. R. Fernández-Alba, J. Chromatogr. A, 2016, 1462, 8–18 CrossRef CAS PubMed.
- E. D. Perry, F. Ciliberto, D. A. Hennessy and G. Moschini, Sci. Adv., 2016, 2, e1600850 CrossRef PubMed.
- A. Alsbaiee, B. J. Smith, L. Xiao, Y. Ling, D. E. Helbling and W. R. Dichtel, Nature, 2016, 529, 190–194 CrossRef CAS PubMed.
- M. H. Petrarca, J. O. Fernandes, H. T. Godoy and S. C. Cunha, Food Chem., 2016, 212, 528–536 CrossRef CAS PubMed.
- M. A. Farajzadeh, M. Bamorowat and M. R. A. Mogaddam, RSC Adv., 2016, 6, 112939–112948 RSC.
- H. Tao, X. Liao, C. Sun, X. Xie, F. Zhong, Z. Yi and Y. Huang, Spectrochim. Acta, Part A, 2015, 136, 1328–1334 CrossRef CAS PubMed.
- F. Dong, L. Wang, X. Han, B. Gao, Y. Jia and J. Liu, Chemosphere, 2015, 114, 1–7 Search PubMed.
- S. Wang, Z. Yang, Y. Liu, Y. Zhang and X. Lu, Chemosphere, 2021, 272, 129742 Search PubMed.
- X. Gao, X. Zhou, L. Yuan, S. Wang and R. Liu, Environ. Sci. Pollut. Res., 2016, 23, 3909–3917 Search PubMed.
- A. Kumar, R. K. Sharma and P. K. Jain, J. Chromatogr. Sci., 2015, 53, 418–425 Search PubMed.
- M. Muhammad, M. R. Jan, J. Shah and B. Ara, Environ. Toxicol. Chem., 2019, 38, 2614–2620 CrossRef CAS PubMed.
- E. A. Songa and J. O. Okonkwo, Talanta, 2016, 155, 289–304 CrossRef CAS PubMed.
- J. Wei, Y. Yang, J. Dong, S. Wang and P. Li, Microchim. Acta, 2019, 186, 1–9 CrossRef CAS PubMed.
- B. De and N. Karak, RSC Adv., 2013, 3, 8286–8290 RSC.
- J. Hou, G. Dong, Z. Tian, J. Lu, Q. Wang, S. Ai and M. Wang, Food Chem., 2016, 202, 81–87 CrossRef CAS PubMed.
- J. Yang, G. Gao, X. Zhang, Y. Ma, Xi. Chen and F. Wu, Carbon, 2019, 146, 827–839 CrossRef CAS.
- X. Yan, Y. Song, C. Zhu, H. Li, D. Du, X. Su and Y. Lin, Anal. Chem., 2017, 90, 2618–2624 CrossRef PubMed.
- W. Liang, L. Ge, X. Hou, X. Ren, L. Yang, C. E. Bunker, C. M. Overton, P. Wang and Y. Sun, J. Carbon Res., 2019, 5, 70 CrossRef CAS.
- Z. Peng, Y. Zhou, C. Ji, J. Pardo, K. J. Mintz, R. R. Pandey, C. C. Chusuei, R. M. Graham, G. Yan and R. M. Leblanc, Nanomater, 2020, 10, 1560 CrossRef CAS PubMed.
- J. Gogoi and D. Chowdhury, Master Life Sci., 2020, 55, 11597–11608 CAS.
- E. Yahyazadeh and F. Shemirani, Heliyon, 2019, 5, e01596 CrossRef PubMed.
- N. T. G. de Paula, R. Milani, A. F. Lavorante and A. P. S. Paim, J. Braz. Chem. Soc., 2019, 30, 2355–2366 CAS.
- C. Zhang, X. Yu, X. Shi, Y. Han, Z. Guo and Y. Liu, Food Anal. Methods, 2020, 13, 1042–1049 CrossRef.
- Y. Han, W. Yang, X. Luo, X. He, Y. Yu, C. Li, W. Tang, T. Yue and Z. Li, J. Agric. Food Chem., 2019, 67, 12576–12583 CrossRef CAS PubMed.
- X. Yan, Y. Song, C. Zhu, H. Li, D. Du, X. Su and Y. Lin, Anal. Chem., 2017, 90, 2618–2624 CrossRef PubMed.
- S. Majumdar, T. Bhattacharjee, D. Thakur and D. Chowdhury, J. Mater. Sci. Nanomater., 2018, 3, 673–677 CAS.
- J. Song, N. Zhao, Y. Qu and L. Zhao, Dyes Pigm., 2021, 193, 109–564 Search PubMed.
- W. Liang, L. Ge, X. Hou, X. Ren, L. Yang, C. E. Bunker, C. M. Overton, P. Wang and Y. Sun, J. Carbon Res., 2019, 70(4), 5 Search PubMed.
- Y. Yuan, Y. Wang, S. Liu, Y. Li, R. Duan, H. Zhang and X. Hu, RSC Adv., 2016, 6, 52255 RSC.
- Y. Yen, Y. Lin, T. Y. Chen, S. Chyueh and H. Chang, R. Soc. Chem., 2019, 6, 191017 CAS.
- L. Liu, H. Gong, D. Li and L. Zhao, J. Nanosci. Nanotechnol., 2018, 18, 5327–5332 CrossRef CAS PubMed.
- W. Lu, Y. Jiao, Y. Gao, J. Qiao, M. Mozneb, S. Shuang, C. Dong and C. Li, ACS Appl. Mater. Interfaces, 2018, 10, 42915–42924 CrossRef CAS PubMed.
- Y. Pan, W. M. Yin, R. Meng, Y. Guo, J. Zhang and Q. Pan, RSC Adv., 2021, 11, 24038 RSC.
- S. Chahal, J. Macairan, N. Yousefi, N. Tufenkji and R. Naccache, RSC Adv., 2021, 11, 25354–25363 RSC.
- M. Wang, Y. Wan, K. Zhang, Q. Fu, L. Wang, J. Zeng, Z. Xia and D. Gao, Anal. Bioanal. Chem., 2019, 411, 2715–2727 CrossRef CAS PubMed.
- M. K. Bera, L. Behera and S. Mohapatra, Colloids Surf., A, 2021, 624, 126792 CrossRef CAS.
- Y. Pan, W. M. Yin, R. Meng, Y. Guo, J. Zhang and Q. Pan, RSC Adv., 2021, 11, 24038 RSC.
- X. Li, L. Zhang, X. Wei and J. Li, Electroanalysis, 2013, 25, 1286–1293 CrossRef CAS.
- I. Losito, A. Amorisco, T. Carbonara, S. Lofiego and F. Palmisano, Anal. Chim. Acta., 2006, 575, 89–96 CrossRef CAS PubMed.
- Y. Li, J. Zhang, X. Xiong, K. Luo, J. Guo, M. Shen, J. Wang and Z. Song, Environ. Sci. Pollut. Res., 2014, 21(11), 7204–7210 CrossRef CAS PubMed.
- M. Haddaoui and N. Raouafi, Sens. Actuators, B, 2015, 219, 171–178 CrossRef CAS.
| This journal is © The Royal Society of Chemistry 2023 |

