 Open Access Article
An integrated MDC–FO membrane configuration for simultaneous desalination, wastewater treatment and energy recovery
Mostafa Elnahas *a,
Abdelsalam Elawwad
 b,
Ayat Ghallab
 a,
Reem Ettouneya and
Mahmoud El-Rifaia
aChemical Engineering Department, Faculty of Engineering, Cairo University, Cairo University St., Giza, 12613, Egypt. E-mail: mostafa.nahas@eng.cu.edu.eg
bEnvironmental Engineering Department, Faculty of Engineering, Cairo University, Cairo University St., Giza, 12613, Egypt
First published on 6th June 2023
Abstract
A novel microbial desalination cell (MDC) configuration was developed by introducing a forward osmosis (FO) membrane, separating the cathode chamber from a fourth extra chamber. Wastewater is treated using a sequential anode–cathode feed. The new chamber then serves as a FO draw chamber, where a saline solution is used to recover freshwater from the adjacent cathode chamber. The diluted saline solution then goes to the MDC middle chamber for further desalination. Three identical cells were constructed and operated in cyclic-batch-flow mode at different initial wastewater and saline solution concentrations. Up to 84.8 ± 1.7% of the wastewater was recovered as freshwater. Freshwater recovery decreases at lower salt concentrations and higher wastewater COD concentrations due to the lower osmotic pressure difference. Salinity of saline water was decreased by up to 69.57 ± 3.85% at the highest initial salinity. COD removal up to 94.42 ± 4.15% was reached. COD removal rates were higher at higher COD concentrations. Polarization curves show the effect of COD on the internal resistance, where cells operated at lower COD experienced higher internal resistance. Scanning electron microscopy (SEM) images revealed the extent of fouling on the ion exchange membrane and biofilm formation on the FO membranes and the electrodes.
Introduction
Increasing global population and scarcity of freshwater resources is a major environmental problem. The population under water scarcity has increased from 0.24 billion (14% of global population) in the 1900s to 3.8 billion (58% of global population) in the 2000s.1 New sources of freshwater such as desalination must be resorted to. However, the currently used desalination processes, whether thermal or membrane, are energy intensive.2 Another approach would be wastewater treatment to recover freshwater. Wastewater treatment depends on the nature of different possible contaminants in the water. Many technologies have been developed for wastewater treatment, such as the conventional coagulation and flocculation technique to remove suspended solids, turbidity, colour, organic matter, and oils.3,4 Other technologies include adsorption of organic and inorganic contaminants using activated carbon, zeolite, graphene or graphene oxides, and carbon nanotubes.5,6 Different types of membranes can also be used for water treatment such as reverse osmosis, forward osmosis, nanofiltration, ultrafiltration, and microfiltration to remove microbiological contaminants, dissolved ions, and heavy metals.7,8 Some membranes are specially synthesized to remove specific pollutants such as dyes or proteins.9 Ultraviolet radiation has been used for the degradation of organic pollutants.10 Photodegradation can also be used for wastewater treatment using nanophotocatalysts.11,12 However, wastewater treatment in general is an expensive and energy-intensive process.13 Energy can be recovered using anaerobic wastewater systems such as Up flow Anaerobic Sludge Blanket (UASB).14 However, it is a sophisticated process and can fail under low temperature and low-strength wastewater conditions. A combined system that uses bioenergy from the wastewater to desalinate saline water should be effective, both practically and economically, in addition to being environmentally friendly.15One of the relatively new technologies is Microbial Desalination Cells (MDCs), an electrochemical system that simultaneously works on both wastewater treatment and saline water desalination in addition to power generation.16 It is a combination of Microbial Fuel Cells (MFCs), used for simultaneous wastewater treatment and power supply;17 and electrodialysis, which is a well-known desalination technique for saline water.18 A typical MDC includes three chambers: anode chamber, desalination chamber, and cathode chamber separated by an anion exchange membrane (AEM), and a cation exchange membrane (CEM) respectively. In the anode chamber, organic matter from the wastewater is oxidized in an electrochemical reaction that is catalyzed by bacteria, releasing electrons that are transported externally through an electric connection to the cathode chamber where they find electron acceptors to complete the cell reaction. As a result of the charge transfer, anions and cations are transported to the anode and cathode chambers through the AEM and CEM, respectively, thus desalinating the saline water in the middle chamber while maintaining electron neutrality.16
Unlike other thermal or membrane-based desalination processes,2 MDCs have low energy consumption and low environmental impact,5 as they generate more energy than that required for operating the system, thus saving 30–50% of the desalination costs.19 Many modifications to the MDCs attempted to improve their performance. These include using an air cathode, which utilizes oxygen as a cost-effective electron acceptor but requires using a platinum catalyst on the cathode.20 MnO2/graphene was used as a potential low-cost cathodic catalyst.21 A bio-cathode was also used to promote the system's sustainability.20 Stacked MDCs have been used to increase the desalination rate.22 MDCs can also be used to generate H2 by applying an external voltage to the cell, or to produce acids by the addition of a bipolar membrane to the cell.22 Another modification can work to minimize pH variations in the anode and cathode chambers, by recirculating the anolyte and catholyte through the cell to improve the COD removal, but this results in the loss of part of the substrate in the cathode chamber without converting it to power.22
Forward osmosis (FO) membranes have been coupled with or integrated into the MDCs to enhance freshwater recovery from wastewater. FO is a physical process that involves the transport of freshwater through a semi-permeable membrane from a solution with low salinity and high water chemical potential to a solution with high salinity and low water chemical potential.23 FO is intended to both recover freshwater from wastewater, and dilute the saline water using the recovered freshwater, if these solutions were placed on the two sides of the membrane. In the osmotic MDCs (OsMDC) configuration, the AEM is replaced by a FO membrane to allow osmotic water transport from the wastewater in the anode chamber to the desalination chamber24 thus, diluting the saline solution by the recovered freshwater. Also, MDCs have been coupled with FO cells23,25 and osmotic MFC.26 Osmotic MFC consists of placing the FO membrane between the anode and cathode chambers.27 This coupling is similar to the osmotic MDCs without affecting the performance. A MDC–FO coupled system reduced the wastewater volume by 64%, while doubling the conductivity reduction of saline water, and achieved a higher COD removal than a standalone cell.23 Iskander et al. managed to recover 51.5% freshwater from a raw leachate, and still managed to get a significant COD removal, as high as 65.4%, and a high value of current density compared to the previous studies with leachate in bio-electrochemical systems.25 An upflow MDC was also proposed as the first continuously operated MDC.28,29
It is thus clear that many studies coupled MDCs and FO separately,23,25,26 which has clearly shown the significance of using FO to recover freshwater from wastewater without affecting the performance of the MDC in terms of wastewater treatment or power generation. However, none of the above studies attempted to integrate the MDC and FO in one cell, by adding a FO membrane, not by replacing the AEM, and the effect of this integration is not known.
In this study, a novel four-chamber integrated FO and MDC system (MDC–FO) is proposed. It consists in the addition of an extra chamber separated from the cathode chamber by a FO membrane. This configuration utilizes the cathode chamber as a feed solution chamber for the FO membrane, while the fourth extra chamber works as the draw solution chamber for the FO. Thus, wastewater is being treated in the cathode chamber simultaneously with fresh water being recovered through the FO membrane, diluting the saline solution before being introduced to the middle chamber for desalination. Three identical cells were constructed and operated with different concentrations of wastewater and saline water to examine the feasibility of the system, and the effects of the input parameters on the system performance. The input parameters included the wastewater COD concentration between 500 and 2000 mg L−1, while the saline water concentration ranged between 10–35 g L−1 NaCl. At the end of the experimental runs, samples of the electrodes and membranes were taken for SEM examination.
Materials and methods
System setup
Three identical four-chamber MDC–FO cells were constructed. Transparent acrylic sheets were used to form the cells. Fig. 1 shows the details of the cells' construction consisting of the anode chamber, desalination chamber, cathode chamber, and FO draw chamber. All chambers were 3 cm width. Holes were made in each chamber for filling and draining, air blowing, and electrical connections. The four chambers were separated by different membranes. An anion exchange membrane (AMI-7001S, Membranes International, USA) was used between the anode and desalination chambers. A cation exchange membrane (CMI-7000S, Membranes International, USA) was used between the desalination and cathode chambers. A FO membrane (CTA – FO membrane, FTSH2O, USA) was used between the cathode and FO draw chambers, with the active layer facing the cathode chamber. All membranes had a surface area of 8 cm × 8 cm. Both anion and cation exchange membranes were immersed in a 5% NaCl solution for 12 hours before being used as per the manufacturer's instructions. The anode electrode was 7.5 cm by 7.5 cm of plain carbon cloth (Fuel Cell Earth, USA), while the cathode electrode was 6.5 cm by 6.5 cm of 60% Pt on carbon cloth (Fuel Cell Earth, USA). In each of the cells, the two electrodes were connected by a titanium wire with an external resistance of 1000 Ω that was used throughout the experiments.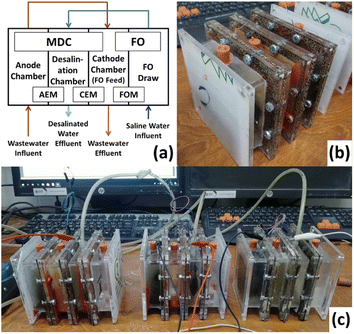 | ||
| Fig. 1 Configuration of the new MDC–FO system: (a) schematic plan; (b) real picture of one cell; (c) real picture of the experimental setup. | ||
System operation
All cells were operated in cyclic-batch-flow mode with each cycle ranging from 3 to 4 days. At the start of each cycle, new batches of synthetic wastewater and saline water were introduced to the anode and the FO draw chambers respectively. At the end of the first cycle, the anode and FO draw chamber contents were respectively transferred to the cathode and the middle desalination chambers in the next cycle. The diluted saline solution from the FO draw chamber was further desalinated in the middle desalination chamber while the wastewater anode effluent was further treated in the cathode chamber. Freshwater was recovered from the wastewater solution in the cathode chamber to dilute the saline solution in the FO draw chamber.Synthetic wastewater solutions with different constant concentrations of organic substrate were used in the different cells as follows; COD = 500 mg L−1 in Cell 1, COD = 1000 mg L−1 in Cell 2, COD = 2000 mg L−1 in Cell 3. Sodium acetate was used as the organic substrate in the synthetic wastewater. The solutions were prepared as per Ragab et al.,30,31 containing the following salts per 1 g COD per liter of deionized water: sodium acetate trihydrate, 2.126 g; NaCl, 0.15 g; NH4Cl, 0.22 g; MgSO4, 0.02 g; CaCl2, 0.015 g; KH2PO4, 0.55 g; K2HPO4, 1.10 g. At the start-up stage, the synthetic wastewater in the anode chamber was inoculated with a mixture of activated sludge and anaerobic sludges till the cells reached steady-state operation. The sludges were obtained from primary sedimentation and thickening tanks from a local wastewater treatment plant. Saline solutions with concentrations ranging from 10 to 35 g L−1 NaCl were prepared to be used initially in the FO draw chamber.
Each cycle was repeated at least three times before increasing the concentration of the saline solution in the next cycle as shown in Table 1. The first set of experiments were conducted using a 10 g L−1 NaCl solution, 20 g L−1 in the second set, and 35 g L−1 in the third set. An extra cycle (cycle no. 4) was performed to obtain polarization curves. All experiments were conducted at room temperature with the cathode chamber continuously aerated by an air blower. The air rate was controlled by a rotameter.
| Exp. | Cell 1 | Cell 2 | Cell 3 | |||
|---|---|---|---|---|---|---|
| COD (mg L−1) | Salt (g L−1) | COD (mg L−1) | Salt (g L−1) | COD (mg L−1) | Salt (g L−1) | |
| Cycle 1–1 | 500 | 10 | 1000 | 10 | 2000 | 10 |
| Cycle 1–2 | ||||||
| Cycle 1–3 | ||||||
| Cycle 2–1 | 20 | 20 | 20 | |||
| Cycle 2–2 | ||||||
| Cycle 2–3 | ||||||
| Cycle 3–1 | 35 | 35 | 35 | |||
| Cycle 3–2 | ||||||
| Cycle 3–3 | ||||||
| Cycle 3–4 | ||||||
| Cycle 3–5 | ||||||
| Cycle 4 | 20 | 20 | 20 | |||
Measurement and analysis
The voltages across the external resistances of the three cells were measured every minute by a data acquisition system (SensorDAQ, Vernier, USA). The concentration of COD was measured at the beginning and end of each cycle using an UV/VIS spectrophotometer (DR4000, Hach, Germany) according to the manufacturer's instructions. Salt concentration was measured using a benchtop conductivity meter at the end of each cycle.The average current and power densities were calculated for each cycle based on the average voltage across the cycle and on the anode areas.
The coulombic efficiency (CE) calculated from eqn (1) is the ratio between the total number of electrons transferred externally from the anode to the cathode to the total number of electrons produced by oxidation reaction in the anode chamber.16
 | (1) |
![[thin space (1/6-em)]](https://www.rsc.org/images/entities/char_2009.gif) 845 Col per mol e−, CODi and CODf are the initial and final COD concentrations, Va is the anode volume, and MO2 is the molecular weight of oxygen.
845 Col per mol e−, CODi and CODf are the initial and final COD concentrations, Va is the anode volume, and MO2 is the molecular weight of oxygen.
Polarization curves were obtained for the last three cycles by varying the external resistance between 100–10![[thin space (1/6-em)]](https://www.rsc.org/images/entities/char_2009.gif) 000 Ohm, as suggested by Ragab et al.30 COD removal efficiencies were calculated for the anode and cathode separately, and for the overall cycle. The COD removal rate in the anode and the cathode was calculated based on the cycle time, and the overall COD removal rate was calculated based on two consecutive cycle times. The dilution efficiency in the FO chamber, and the desalination efficiency in the middle desalination chamber were calculated separately, and the total decrease in salinity was also calculated for the overall cycle. The dilution rate in the FO chamber, and desalination rate in the middle desalination chamber were calculated based on the cycle time, and the total decrease in the salinity across the system was calculated based on two consecutive cycle times. SEM images were taken for the different electrodes and membranes to investigate the formation of biofilms or fouling. SEM investigation was carried out using electron microscopy (FE-SEM, Quanta FEG 250, Philips, USA).
000 Ohm, as suggested by Ragab et al.30 COD removal efficiencies were calculated for the anode and cathode separately, and for the overall cycle. The COD removal rate in the anode and the cathode was calculated based on the cycle time, and the overall COD removal rate was calculated based on two consecutive cycle times. The dilution efficiency in the FO chamber, and the desalination efficiency in the middle desalination chamber were calculated separately, and the total decrease in salinity was also calculated for the overall cycle. The dilution rate in the FO chamber, and desalination rate in the middle desalination chamber were calculated based on the cycle time, and the total decrease in the salinity across the system was calculated based on two consecutive cycle times. SEM images were taken for the different electrodes and membranes to investigate the formation of biofilms or fouling. SEM investigation was carried out using electron microscopy (FE-SEM, Quanta FEG 250, Philips, USA).
Results and discussion
The effect of changing wastewater organics concentration represented by the chemical oxygen demand (COD), and the salinity of the salt solution on the system performance in terms of voltage, desalination efficiency, and COD removal efficiency was studied in the three cells operating at different concentrations of COD and salt.Average voltage
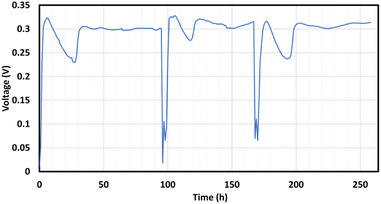
The voltage was continuously measured throughout the different cycles. Typical voltage trends are shown in Fig. 2 for a COD concentration of 2000 mg L−1 and an initial salt concentration of 35 g L−1. These have been averaged for each cycle to obtain the experimental value of Vavg.Effect of initial salt concentrations
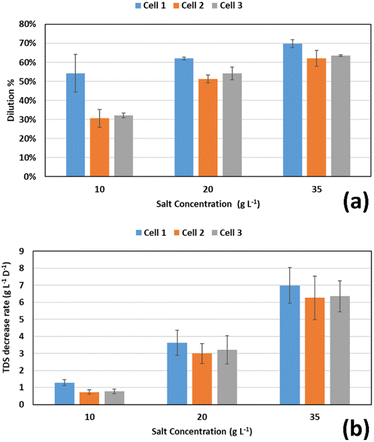
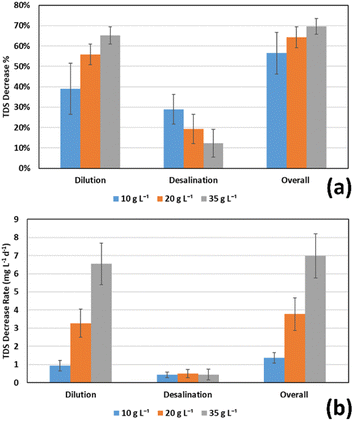
Three salt concentrations were used as inputs for the FO chamber: 10, 20, and 35 g L−1. Table 2 and Fig. 3 present the results of dilution in the FO draw solution chamber. When the 35 g L−1 solution was used, the high osmotic pressure resulted in a high water transport flux, resulting in an average reduction of salt concentration in the FO chamber of 65.19 ± 4.30% over the three-to-four days cycle period, compared to 55.87 ± 5.11% and 38.98 ± 12.53% in case of using 20, and 10 g L−1 solutions, respectively. In terms of TDS decrease rate, the previous percentages correspond to 6.54 ± 1.14, 3.28 ± 0.77, and 0.93 ± 0.29 g L−1 d−1 at 35, 20, and 10 g L−1 initial salt concentrations, respectively. This means that both the dilution efficiency and rate are higher at higher initial salt concentrations. Good performance of the FO process at higher salt concentrations is due to the higher osmotic pressure difference.| Cycle | Cell | Dilution (%) | Desalination (%) | Overall TDS decrease (%) | Overall TDS decrease (g L−1 d−1) | Final salt concentration (g L−1) |
|---|---|---|---|---|---|---|
| Initial salt concentration = 10 g L−1 | ||||||
| 1–1 | 1 | 41.2 | 37.5 | 63 | 1.689 | 3.68 |
| 1–1 | 2 | 23.9 | 26.8 | 44.3 | 1.183 | 5.57 |
| 1–1 | 3 | 33.9 | 28.0 | 52.5 | 1.401 | 4.75 |
| 1–2 | 1 | 65.1 | 38.6 | 78.6 | 1.486 | 2.14 |
| 1–2 | 2 | 34.1 | 16.7 | 45.1 | 0.853 | 5.49 |
| 1–2 | 3 | 31.2 | 27.2 | 49.9 | 0.944 | 5.01 |
| 1–3 | 1 | 56.3 | 18.4 | 64.4 | 1.729 | 3.56 |
| 1–3 | 2 | 33.7 | 34.1 | 56.3 | 1.513 | 4.37 |
| 1–3 | 3 | 31.3 | 32.9 | 53.9 | 1.447 | 4.61 |
| Average | 38.98 ± 12.53 | 28.91 ± 7.30 | 56.46 ± 10.23 | 1.36 ± 0.29 | 4.35 ± 1.02 | |
![[thin space (1/6-em)]](https://www.rsc.org/images/entities/char_2009.gif) |
||||||
| Initial salt concentration = 20 g L−1 | ||||||
| 2–1 | 1 | 61.6 | 34.2 | 74.7 | 5.632 | 5.06 |
| 2–1 | 2 | 50.4 | 15.0 | 57.8 | 4.359 | 8.43 |
| 2–1 | 3 | 57.8 | 15.5 | 64.3 | 4.849 | 7.13 |
| 2–2 | 1 | 61.5 | 14.9 | 67.3 | 3.264 | 6.54 |
| 2–2 | 2 | 49.2 | 16.2 | 57.4 | 2.786 | 8.52 |
| 2–2 | 3 | 49.8 | 29.6 | 64.7 | 3.139 | 7.06 |
| 2–3 | 1 | 63.1 | 14.1 | 68.3 | 3.519 | 6.34 |
| 2–3 | 2 | 54.3 | 12.9 | 60.2 | 3.101 | 7.97 |
| 2–3 | 3 | 55.1 | 21.1 | 64.6 | 3.328 | 7.09 |
| Average | 55.87 ± 5.11 | 19.27 ± 7.16 | 64.36 ± 5.1 | 3.78 ± 0.90 | 7.13 ± 1.03 | |
![[thin space (1/6-em)]](https://www.rsc.org/images/entities/char_2009.gif) |
||||||
| Initial salt concentration = 35 g L−1 | ||||||
| 3–1 | 1 | 71.4 | 2.1 | 72.0 | 6.359 | 9.80 |
| 3–1 | 2 | 60.7 | 11.5 | 65.2 | 5.759 | 12.17 |
| 3–1 | 3 | 62.9 | 16.2 | 68.9 | 6.087 | 10.87 |
| 3–2 | 1 | 71.2 | 10.9 | 74.3 | 8.849 | 8.98 |
| 3–2 | 2 | 67.8 | 6.0 | 69.7 | 8.300 | 10.59 |
| 3–2 | 3 | 64.1 | 28.2 | 74.2 | 8.834 | 9.02 |
| 3–3 | 1 | 67.0 | 13.8 | 71.5 | 6.616 | 9.97 |
| 3–3 | 2 | 57.9 | 9.7 | 62.0 | 5.734 | 13.31 |
| 3–3 | 3 | 63.7 | 12.2 | 68.1 | 6.304 | 11.15 |
| Average | 65.19 ± 4.30 | 12.28 ± 6.85 | 69.57 ± 3.85 | 6.98 ± 1.22 | 10.65 ± 1.35 | |
The reduction in concentration of 65.19 ± 4.30% when the 35 g L−1 solution was used is slightly higher than the value of 61 ± 0.3% reported23 for the same initial salt concentration in a FO cell operating at 12 hour batch cycles and coupled with a MDC. However, in terms of the rate of decrease in TDS concentration, their reported rate was 22.7 ± 5.3 g L−1 d−1, which is about 3.5 times the 6.54 ± 1.14 g L−1 d−1 rate obtained in the present work under the same conditions. This may be attributed to the longer cycle time used in the present work (3–4 days rather than 12 hours), because the FO process is relatively fast and most of the salinity reduction takes place at the beginning of the cycle. This means that TDS decrease rates could be significantly improved at lower batch cycles or when the cells are operated in a continuous mode.
The water flux through the FO membrane also depends on the osmotic pressure of the feed solution in the cathode chamber, which is the effluent of the anode chamber. The higher the osmotic pressure in the cathode chamber, the lower the water flux. Hence, the initial COD introduced to the anode chamber will have an indirect effect on the TDS reduction of the saline water. The osmotic pressure in the cathode chamber depends on the quantity of electrolytes present in the feed wastewater which also depends on the initial COD of the wastewater.
The highest water flux was noticed in Cell 1 (lowest wastewater COD concentration of 500 mg L−1), compared to Cells 2 and 3 (COD concentrations of 1000 and 2000 mg L−1) as shown in Fig. 3. The difference was higher during cycle 1 in all cells (10 g L−1 salt concentration in the draw chamber) and decreased in cycle 2 (20 g L−1) and cycle 3 (35 g L−1). This is because the very high osmotic pressure at high salt concentrations makes the operation less sensitive to changes in the relatively low osmotic pressures of the wastewater. The sensitivity increases when the salt concentration is lower, as the difference in osmotic pressure between the two sides is lower. These results are in accordance with those obtained by (Yuan et al., 2015)23 who tested the effect of the COD concentration of wastewater placed in the feed side of a FO membrane on the water flux through the membrane when a 35 g L−1 salt solution was used as a draw solution. They concluded that the COD concentration did not affect the water flux under these conditions.
In subsequent cycles, higher desalination efficiencies were obtained in the middle MDC chamber at the lower initial salt concentrations. Salt solutions with an initial concentration of 10, 20, and 35 g L−1 achieved desalination efficiencies of 28.91 ± 7.30%, 19.27 ± 7.16%, and 12.28 ± 6.85% respectively. However, the TDS decrease rate in the middle chamber were almost equal: 0.43 ± 0.16, 0.5 ± 0.22, 0.44 ± 0.33 g L−1 d−1 at the same initial concentrations, respectively. It is obvious that the salt concentration in the middle chamber did not have a significant effect on the desalination rate. However, a better desalination efficiency was obtained for the solutions with lower initial concentration. This is in agreement with the results obtained by Ramírez-Moreno et al.32 who achieved very close desalination rates for both brackish water and seawater with an air diffusion cathode. Also, Zhang and He24 achieved higher salinity removal in a MDC at 5 g L−1 salt solution compared to 10 and 20 g L−1 solutions. Since the rates of desalination are close, the salt removal efficiency is higher at lower initial salt concentrations.
The overall performance of FO chamber and the middle MDC chamber in two consecutive cycles gave an overall reduction in salinity of 56.46 ± 10.22%, 64.37 ± 5.16%, 69.57 ± 3.85% for initial salt concentrations of 10, 20, and 35 g L−1 respectively, resulting in final salt concentrations of 4.35 ± 1.02, 7.13 ± 1.03, and 10.65 ± 1.35 respectively, as shown in Table 2 and Fig. 4. These values correspond to TDS decrease rates of 1.36 ± 0.29, 3.78 ± 0.90, and 6.98 ± 1.22 g L−1 d−1 respectively. Yuan et al.23 achieved an 80% overall reduction in conductivity for 24 hour overall batch cycles for the 35 g L−1 salt solution, which was introduced first to a FO cell, then to a MDC compared to the 69.57 ± 3.85% obtained in this work.
Effect of initial COD concentrations
Each of the three cells was operated at a different feed COD concentrations in the anode chamber. Table 3 shows the COD removal percentage and rates in the anode and cathode chambers in the different cells operating at different COD loads. Rates were calculated per liter of the anode solution. In Cell 1, where the 500 mg L−1 anode solution was used, an average COD removal efficiency of 78.61 ± 9.67% was achieved, compared to 68.59 ± 12.26% in Cell 2 which operated with 1000 mg L−1 solution, and 53.46 ± 11.8% in Cell 3 which operated with 2000 mg L−1 solution, as shown in Fig. 5(a). The three cells operated for the batch time of three to four days. It is seen that larger values of COD need more retention time to achieve higher COD removal efficiency. That is why the removal efficiencies were lower at higher initial COD concentrations, since the batch time was the same for the three cells. However, if these removal values were presented in terms of removal rate, the rates would be as follows; 0.17 ± 0.05, 0.27 ± 0.06, and 0.4 ± 0.12 mg L−1 d−1 for Cells 1, 2, and 3 respectively as shown in Fig. 5(b). This means that higher values of COD input concentration will result in higher rates of removal regardless of the relative removal efficiency, since the cycle time is already taken into consideration in the calculation of the rate. Comparing the results to previous work by Mehanna et al.,33 who worked in the same range of substrate concentration, a COD removal of 77 ± 3% was achieved at 1 g L−1 acetate, while 82 ± 6% was achieved at 2 g L−1 acetate, but at a longer cycle time. Also, in the work done by Ragab et al.,31 a COD removal of 90 ± 5.2% was achieved at 0.5 g L−1 acetate, compared to 53.4 ± 7.2% at 3000 g L−1 acetate.| Initial COD in the anode chamber (mg L−1) | 500 (Cell 1) | 1000 (Cell 2) | 2000 (Cell 3) | |
|---|---|---|---|---|
| a Water recovery from wastewater. | ||||
| COD removal anode | % | 78.53 ± 10.10 | 69.06 ± 12.70 | 54.11 ± 12.12 |
| Rate | 4.05 ± 1.26 | 6.46 ± 1.53 | 9.69 ± 2.81 | |
| Corresponding initial COD in the cathode chamber (mg L−1) | 107.35 ± 50.5 | 309.4 ± 127 | 917.8 ± 242.4 | |
| COD removal cathode | % | 74.96 ± 13.53 | 80.02 ± 8.11 | 84.05 ± 5.97 |
| Rate | 0.85 ± 0.38 | 2.42 ± 1.12 | 7.71 ± 2.43 | |
| Overall COD removal | % | 94.42 ± 4.15 | 93.93 ± 3.13 | 92.45 ± 2.35 |
| Rate | 4.67 ± 1.05 | 9.04 ± 1.57 | 17.49 ± 2.53 | |
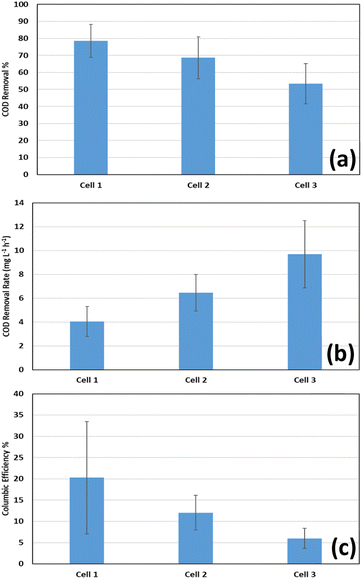 | ||
| Fig. 5 Average (a) COD removal percentage in the anode chamber; (b) COD removal rate in the anode chamber; (c) coulombic efficiency at the three cells operating at different loads of COD. | ||
Fig. 5(c) shows the average coulombic efficiencies in each cell. Coulombic efficiencies of 20.26 ± 13.18%, 12.03 ± 4.08%, and 6 ± 2.35% were achieved at Cells 1, 2, and 3 respectively. The results indicate that the coulombic efficiency is lower at higher COD concentrations. However, these values are relatively low compared to Mehanna et al.33 who achieved values of 68 ± 11%, and 66 ± 11% at 2 g L−1, and 1 g L−1 respectively. Also, the wide range of results indicate a level of performance instability. This implies that non-exoelectrogens might have had a great contribution to COD removal, and that this contribution increases with the increase of the initial COD values in the anode chamber at the beginning of the cycles. However, similarly low values of coulombic efficiencies were reported in many studies. In the work of Ragab et al.,31 coulombic efficiencies of 11.2 ± 2.7, 5.2 ± 1.2 and 3.8 ± 0.5% were achieved in MDCs operating at COD concentrations of 0.5, 1.5, and 3 g L−1 respectively. Also, in the work of Sun,34 coulombic efficiencies were in the range from 16.8% to 24.4% in MFCs operated with glucose substrate with concentrations ranging between 0.5 and 4 g L−1.
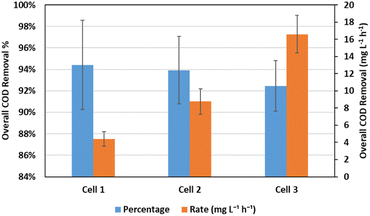
The introduction of the anode effluent to the cathode chamber resulted in a significant increase in the COD removal efficiency. The COD removal percentage and rate in both the anode and cathode chambers of the different cells, as well as the overall rate of removal are shown in Table 3. Average values of 94.42 ± 4.15%, 93.93 ± 3.13%, and 92.45 ± 2.35% overall COD removal were achieved through two consecutive cycles in the anode and cathode chambers, which corresponds to average removal rates of 4.4 ± 0.83, 8.75 ± 1.48, and 16.58 ± 2.19 mg L−1 h−1 respectively as shown in Fig. 6. It was noticed that at lower initial COD concentrations in the anode chamber, the anode chamber was dominant in terms of COD removal rates, while at the highest initial COD concentrations, the rates were almost similar. This can be explained by the fact that each time the initial COD in the anode chamber is doubled, the corresponding initial COD in the cathode chamber is almost tripled, as shown in Table 3, resulting in a relatively higher increase in the rate of COD removal in the cathode chamber than that in the anode chamber with increasing the initial COD concentration in the anode chamber. However, the rate of COD removal increases with initial COD concentration in each chamber in a different manner. While the rate is almost directly proportional to the initial COD concentration in the cathode chamber, it only increased by 50–60% in the anode chamber when the initial concentration was doubled. This can be attributed to the nature of the reaction in each chamber, since the pumping of air in the cathode chamber facilitates the oxidation of organics more than the electrochemical reaction catalyzed by the microorganisms in the anode chamber. The overall values of COD removal percentages and rates demonstrate the contribution of the cathode chamber in the treatment of the residual organics in the wastewater effluent from the anode chamber, especially at higher COD concentrations, thus achieving a high and stable overall performance.
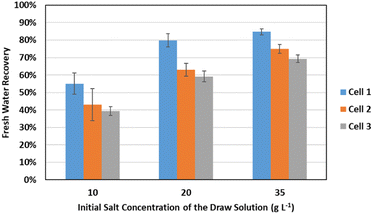
Recovery of freshwater from the wastewater took place in the cathode chamber through the FO membrane installed between the cathode and the FO draw solution chambers. The wastewater was first treated in the anode chamber in one cycle, before being transferred to the cathode chamber in the next cycle. The recovered water dilutes the salt solution in the FO draw chamber. In this section, the extent of water recovery from the wastewater will be discussed. The ratio of the recovered fraction of water will differ with both the initial salt concentration in the draw solution chamber and the initial COD concentration of the wastewater in the previous cycle, which will alter the osmotic pressure in the cathode chamber. Table 4 and Fig. 7 show the average recovery rates at the different input values of COD and salt concentrations.
| Initial COD in the anode chamber (mg L−1) | Initial salt concentration in draw solution (mg L−1) | ||
|---|---|---|---|
10![[thin space (1/6-em)]](https://www.rsc.org/images/entities/char_2009.gif) 000 000 |
20![[thin space (1/6-em)]](https://www.rsc.org/images/entities/char_2009.gif) 000 000 |
35![[thin space (1/6-em)]](https://www.rsc.org/images/entities/char_2009.gif) 000 000 |
|
| 500 (Cell 1) | 55.0 ± 6.1% | 79.9 ± 3.7% | 84.8 ± 1.7% |
| 1000 (Cell 2) | 43.0 ± 9.2% | 63.0 ± 3.7% | 74.9 ± 2.5% |
| 2000 (Cell 3) | 39.4 ± 2.5% | 59.1 ± 3.1% | 69.3 ± 2.2% |
At the highest initial salt concentration, 35 g L−1, the draw solution was able to recover an average of 76.34 ± 6.39% of the wastewater, while it was able to recover an average of only 67.35 ± 9.00% and 45.81 ± 6.69% at 20 g L−1 and 10 g L−1 of salt respectively. This can be explained by the high osmotic pressure of the draw solution at higher salt concentrations, which results in higher freshwater flux.
Regarding the effect of the initial COD concentration in the previous cycle, it was found that the highest freshwater recovery rates were achieved at Cell 1 (500 mg L−1 initial concentration of COD) compared to Cells 2 and 3 (1000 and 2000 mg L−1 respectively). The average freshwater recovery rates in the three cells were 73.23 ± 13.01%, 60.32 ± 13.19%, and 55.95 ± 12.41% respectively. This can be explained by the higher osmotic pressure of the solutions with high COD concentration as a result of the higher concentrations of nutrients in these solutions.
Power generation and polarization curves
Polarization experiments were carried out after one month of operation, after 3–4 h from the beginning of the cycle in each of the cells. Fig. 8 shows the power and polarization curves for the 3 cells. Cell 1 with the lowest COD anode solution was found to generate the least current and power compared to the other two cells. This is an indication of higher internal resistance.30,31 The power and current generation have significantly increased on increasing the COD concentration to 1000 mg L−1, while there was no significant change when it was increased to 2000 mg L−1 in most of the curve points. The maximum obtained power densities were 15.3 mW m−2 in Cell 1 at 470 Ω, 30.4 mW m−2 in Cell 2 at 470 Ω, and 28.5 mW m−2 in Cell 3 at 330 Ω. These results indicate that higher COD concentration results in higher power generation. However, the close results in Cells 2 and 3 could be explained by the substrate inhibition effect at higher concentrations of COD, at which some of the substrate is not consumed by the exoelectrogens.31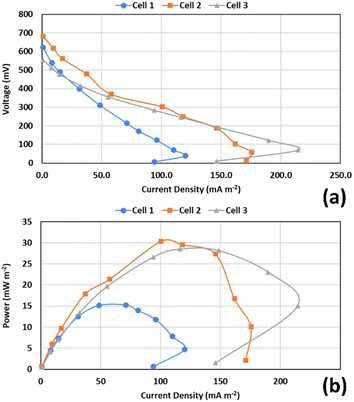 | ||
| Fig. 8 Power and polarization curves for the three cells: (a) voltage vs. current density; (b) power density vs. current density. | ||
Electrodes' biofilms and membranes fouling
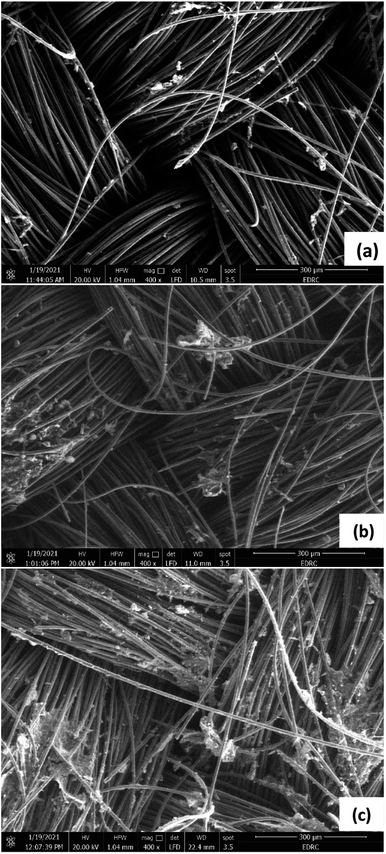
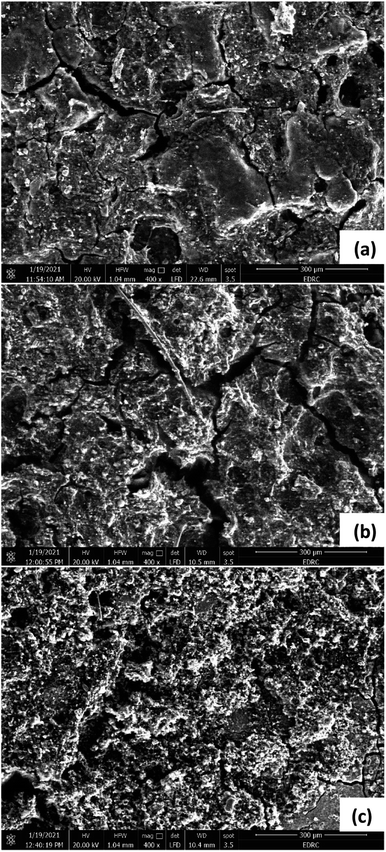
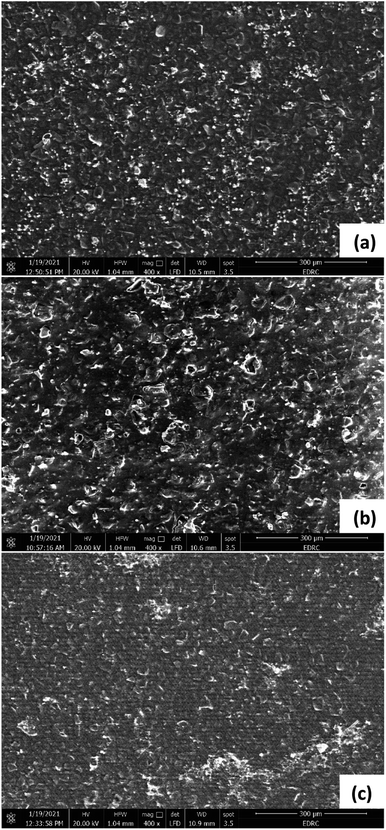
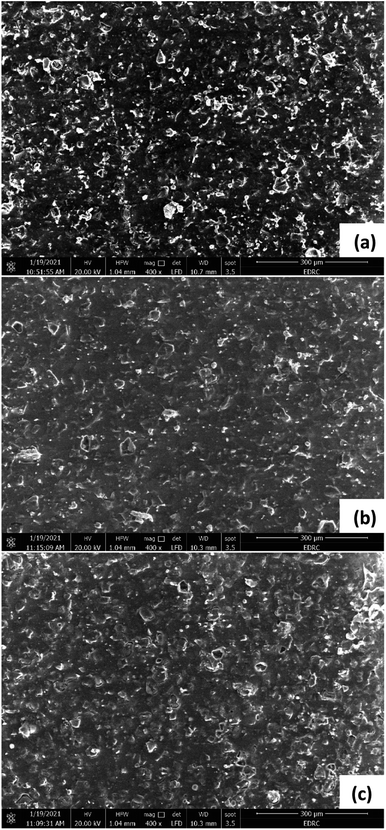
SEM images were taken to investigate the formation of biofilm on the anodes and cathodes of the three cells. Theoretically, biofilm formation at the anode surface would lead to a better current generation. Fig. 9 shows SEM images for the anodes of the three cells. It is seen that Cell 1 has the least density of biofilm compared to Cells 2 and 3 as it operates at the lowest COD concentration. This agrees with the results showing that Cell 1 had the lowest current generation. Ragab et al.31 found similar results after operating three cells under different COD concentrations: 500, 1500, 3000 mg L−1, which resulted in the formation of biofilms on the carbon cloth anode with the thickness and the mass of the biofilm increasing with the availability of substrate. Gholizadeh et al.35 also noticed biofilm formation on the graphite electrode that had a complex and dense structure when 25 g L−1 peptone water was used as the anode solution.SEM images of the cathodes, shown in Fig. 10, also indicate biofilm formation on the surface of the Pt catalyst coated electrodes. Similar to the anode biofilm, the density is highest in Cell 3, which has the highest COD concentration compared to Cells 1, and 2. Barahoei et al.36 found that a biofilm with a complex and dense structure was formed on the carbon felt cathode in a bio-cathode MDC, which was operated using microalgae in the cathode chamber. Unlike the anode, the formed biofilm on the cathode negatively affects the operation, due to reduction of the electrode's active surface area and the additional resistance to oxygen transfer at the cathode.
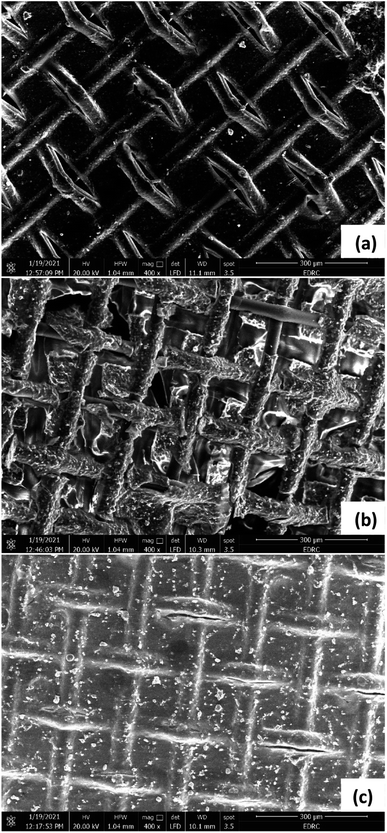
SEM images were also taken for the AEM, CEM, and FO membranes, to investigate the formation of scale or fouling. For the FO membranes (Fig. 11), images were taken for the active layer in the three cells, the layer facing the cathode chamber. The images show almost no fouling in Cell 1 (Fig. 11a).
However, partial fouling is seen in Cell 2 (Fig. 11b) and covers the whole surface of the membrane in Cell 3 (Fig. 11c). This can be attributed to wastewater and microorganisms in the cathode chambers, which led to biofilm formation on the FO membranes. The density of this biofilm is lowest in Cell 1 compared to Cells 2 and 3 respectively, in the same manner as the biofilms formed on both anode and cathode of the three cells. This is similar to results depicted in Kim et al.37 work, in which a pressure-assisted forward osmosis cell was operated using secondary treated wastewater from a wastewater treatment plant on the feed solution side versus natural seawater in the draw solution side. Despite pretreatment of both solutions in a mesh tube filter bed and cartridge filters to remove colloidal suspended solids and bacterial cells, large amounts of bacterial cells were still found on the wastewater side. This resulted in biofilm formation on the FO membrane surface due to the deposition of bacterial cells. Formation of biofilms on the FO membrane can shorten its life making the operation less stable.37 Therefore, it is recommended that the membrane be cleaned periodically, to avoid unstable operation.
For the AEM (Fig. 12), and CEM (Fig. 13), the images taken for the sides facing the desalination chamber were almost similar in the three cells, showing some minor fouling on the surface of the membranes in the form of coarse crystals of salt. This can be due to the relatively short time of operation of the cells, less than three months. However, in the long run, there is a possibility that fouling can negatively affect the membrane's performance. No biofouling was detected on the surfaces of AEM and CEM facing the desalination chamber, indicating that bacterial cells from the anode and cathode chambers were well isolated from the desalination chamber. Similar crystalline formations or aggregations of salt without any biofouling were noticed in many other studies. Ebrahimi et al.38 noticed coarse crystal shape aggregations covering the surfaces of AEM and CEM in an MDC which was used for the desalination of salt solution with an initial conductivity of 54 ± 0.93 mS cm−1, which is equivalent to 35 g L−1 NaCl. Ragab et al.30 found salt scale on both membranes in three cells operating at different temperatures with 20 g L−1 NaCl artificial salt water. Goren and Okten39,40 found considerable crystalline salt aggregations on AEM and CEM facing the desalination chamber in a MDC used for desalination of boron containing solutions in the concentrations of 5, 10, and 20 mg L−1, or real geothermal water that had a conductivity of 1.77 mS cm−1. Sevda et al.41 found coarse aggregation on the membranes surface facing 5, 20 g L−1 NaCl, and real seawater in a MDC operated with petroleum refinery wastewater. Images were not taken for the AEM and CEM sides facing the anode and cathode chambers. However, many studies showed that the formation of biofilm on the membranes surfaces facing the anode chambers in MDCs is common, and also on the membranes surfaces facing the cathode in MDCs with biocathode, which can affect the membranes performance in the long run.30,38–43
Conclusions
In this study, a novel MDC–FO four-chamber configuration was proposed for simultaneous saline water treatment, wastewater treatment and energy recovery. The wastewater was introduced first to the anode chamber for initial treatment and current generation and then to the cathode chamber for further treatment and freshwater recovery using FO membrane. Results revealed that regardless of the initial COD concentration, both anode and cathode chambers have successfully increased the COD removal efficiency up to more than 90% after two consecutive cycles (3 to 4 days per cycle). The anode chambers were only able to remove 78.61 ± 9.67%, 68.59 ± 12.26, 53.46 ± 11.8% of the COD in the wastewater at initial concentrations of 500, 1000, and 2000 mg L−1 respectively after one cycle. The rest of the removal capacity was achieved in the cathode chambers in the next cycle, which demonstrates the role of the cathode chamber in removing organic matter from the wastewater, especially at high concentrations of COD.The additional fourth FO chamber showed a remarkable ability to recover freshwater from the cathode chamber's wastewater. In one cycle, the saline solution in FO chamber recovered up to 84.8% of freshwater from the wastewater in the cathode chamber when the saline water had an initial concentration of 35 g L−1, and the wastewater had an initial concentration COD concentration of 500 mg L−1. The recovery rates were lower at lower initial saline water salinities and higher wastewater initial COD concentrations due to the lower osmotic pressure difference under these conditions. This means that the proposed configuration would be most successful in water recovery when operated at higher salinity of saline water and lower COD of wastewater, which are the conditions when treating domestic wastewater, and desalinating seawater. Within the 3–4 days cycle period, the recovered water was able to decrease the salinity of the saline draw solution by an average of up to 64.57% at the high salinity of 35 g L−1. This percentage was lower at lower salinities. This salinity reduction is more effective than the desalination that happens in the MDC middle chamber, which is around 20% effective on average over one cycle. Within two consecutive cycles, the FO chamber, and the middle desalination chamber together were able to decrease the salinity of saline water with an initial concentration of 35 g L−1 by 69.57%. These results indicate that the new configuration showed promising results in terms of fresh water recovery from the wastewater, and in terms of saline water desalination relative to conventional MDC with one desalination chamber.
SEM images of the electrodes in the three cells have shown that the biofilm's density increases with the COD concentration in the wastewater in both anode and cathode chambers. SEM images of the AEMs and CEMs facing the desalination chambers in the three cells have shown minor formation of crystalline salt scales, which might cause a scaling problem in case of long times of operation. SEM images of the FO membranes facing the cathode chambers in the three cells have shown the formation of biofilm on the membrane surface, which also might cause fouling in longer operation.
Compared to the conventional three-chambered MDC, the new proposed configuration has improved the wastewater treatment and water desalination performance. Although this improved performance, the desalination performance of the middle chamber is still relatively weak, limiting the direct use of the desalinated water. The performance can be optimized in future studies by switching to continuous operation with longer hydraulic retention time, which will give a chance for more stable operation, and adjustable hydraulic retention times for the different solutions by adjusting their flow rates. Other parameters can also be optimized such as pH and operating temperatures, and the possibility of reuse or recycling the membranes can be examined.
Abbreviations
| AEM | Anion Exchange Membrane |
| CEM | Cation Exchange Membrane |
| COD | Chemical Oxygen Demand |
| FO | Forward Osmosis |
| MDC | Microbial Desalination Cell |
| MFC | Microbial Fuel Cell |
| OsMDC | Osmotic Microbial Desalination Cell |
| SEM | Scanning Electron Microscope |
| TDS | Total Dissolved Salts |
| UASB | Up Flow Anaerobic Sludge Blanket |
Author contributions
Mostafa Elnahas: data curation, formal analysis, funding acquisition, investigation, resources, visualization, writing – original draft. Abdelsalam Elawwad: data curation, funding acquisition, methodology, project administration, resources, writing – review & editing. Ayat Ghallab: funding acquisition, writing – review & editing. Reem Ettouney: conceptualization, funding acquisition, supervision, writing – review & editing. Mahmoud El-Rifai: conceptualization, funding acquisition, supervision, writing – review & editing.Conflicts of interest
There are no conflicts to declare.Notes and references
- M. Kummu, J. H. A. Guillaume, H. de Moel, S. Eisner, M. Flörke, M. Porkka, S. Siebert, T. I. E. Veldkamp and P. J. Ward, Sci. Rep., 2016, 6, 1–16 CrossRef PubMed.
- S. Rahman, T. Jafary, A. Al-Mamun, M. S. Baawain, M. R. Choudhury, H. Alhaimali, S. A. Siddiqi, B. R. Dhar, A. Sana, S. S. Lam, M. Aghbashlo and M. Tabatabaei, J. Cleaner Prod., 2021, 288, 125597 CrossRef CAS.
- M. S. S. Abujazar, S. U. Karaağaç, S. S. Abu Amr, M. Y. D. Alazaiza and M. J. Bashir, J. Cleaner Prod., 2022, 345, 131133 CrossRef CAS.
- C. Zhao, J. Zhou, Y. Yan, L. Yang, G. Xing, H. Li, P. Wu, M. Wang and H. Zheng, Sci. Total Environ., 2021, 765, 142795 CrossRef CAS PubMed.
- S. Kim, S. N. Nam, A. Jang, M. Jang, C. M. Park, A. Son, N. Her, J. Heo and Y. Yoon, Chemosphere, 2022, 286, 131916 CrossRef CAS PubMed.
- M. Pivokonsky, I. Kopecka, L. Cermakova, K. Fialova, K. Novotna, T. Cajthaml, R. K. Henderson and L. Pivokonska, Sci. Total Environ., 2021, 799, 149455 CrossRef CAS PubMed.
- W. Jankowski, G. Li, W. Kujawski and J. Kujawa, Sep. Purif. Technol., 2022, 302, 122101 CrossRef CAS.
- A. Hosakote Shankara, J. Samuel Prabagar, T. Thinley, S. Yadav, A. Kotermane Mallikarjunappa, D. Bhusan Das, J. David, W. Kitirote and H. P. Shivaraju, Environ. Nanotechnol., Monit. Manage., 2023, 19, 100773 CAS.
- M. R. Ganjali, M. A. Al-Naqshabandi, B. Larijani, A. Badiei, V. Vatanpour, H. R. Rajabi, H. Rezania, S. Paziresh, G. Mahmodi, S. J. Kim and M. R. Saeb, Chem. Eng. Res. Des., 2021, 168, 109–121 CrossRef CAS.
- B. M. Jun, S. S. Elanchezhiyan, Y. Yoon, D. Wang, S. Kim, S. Muthu Prabhu and C. M. Park, Chem. Eng. J., 2020, 393, 124733 CrossRef CAS.
- H. R. Rajabi, F. Sajadiasl, H. Karimi and Z. M. Alvand, J. Mater. Res. Technol., 2020, 9, 15638–15647 CrossRef CAS.
- H. R. Rajabi, F. Shahrezaei and M. Farsi, J. Mater. Sci.: Mater. Electron., 2016, 27, 9297–9305 CrossRef CAS.
- M. Ilyas, F. M. Kassa and M. R. Darun, J. Cleaner Prod., 2021, 310, 127549 CrossRef.
- A. Elawwad and M. Hazem, Desalin. Water Treat., 2017, 91, 206–213 CrossRef CAS.
- M. Patel, S. S. Patel, P. Kumar, D. P. Mondal, B. Singh, M. A. Khan and S. Singh, J. Environ. Manage., 2021, 297, 113374 CrossRef CAS PubMed.
- Y. Kim and B. E. Logan, Desalination, 2013, 308, 122–130 CrossRef CAS.
- B. E. Logan, B. Hamelers, R. Rozendal, U. Schröder, J. Keller, S. Freguia, P. Aelterman, W. Verstraete and K. Rabaey, Environ. Sci. Technol., 2006, 40, 5181–5192 CrossRef CAS.
- S. Al-Amshawee, M. Y. B. M. Yunus, A. A. M. Azoddein, D. G. Hassell, I. H. Dakhil and H. A. Hasan, Chem. Eng. J., 2020, 380, 122231 CrossRef CAS.
- M. Methnani, Desalination, 2007, 205, 332–339 CrossRef CAS.
- M. Tawalbeh, A. Al-Othman, K. Singh, I. Douba, D. Kabakebji and M. Alkasrawi, Energy, 2020, 209, 118493 CrossRef.
- A. Elawwad, D. Z. Husein, M. Ragab and A. Hamdy, J. Water Reuse Desalin., 2020, 10, 214–226 CrossRef CAS.
- A. Al-Mamun, W. Ahmad, M. S. Baawain, M. Khadem and B. R. Dhar, J. Cleaner Prod., 2018, 183, 458–480 CrossRef CAS.
- H. Yuan, I. M. Abu-Reesh and Z. He, Chem. Eng. J., 2015, 270, 437–443 CrossRef CAS.
- B. Zhang and Z. He, RSC Adv., 2012, 2, 3265–3269 RSC.
- S. M. Iskander, J. T. Novak and Z. He, Bioresour. Technol., 2018, 255, 76–82 CrossRef CAS PubMed.
- B. Zhang and Z. He, J. Membr. Sci., 2013, 441, 18–24 CrossRef CAS.
- F. Zhang, K. S. Brastad and Z. He, Environ. Sci. Technol., 2011, 45, 6690–6696 CrossRef CAS PubMed.
- K. S. Jacobson, D. M. Drew and Z. He, Environ. Sci. Technol., 2011, 45, 4652–4657 CrossRef CAS PubMed.
- K. S. Jacobson, D. M. Drew and Z. He, Bioresour. Technol., 2011, 102, 376–380 CrossRef CAS PubMed.
- M. Ragab, A. Elawwad and H. Abdel-Halim, Desalination, 2019, 462, 56–66 CrossRef CAS.
- M. Ragab, A. Elawwad and H. Abdel-Halim, Renewable Energy, 2019, 143, 939–949 CrossRef CAS.
- M. Ramírez-Moreno, P. Rodenas, M. Aliaguilla, P. Bosch-Jimenez, E. Borràs, P. Zamora, V. Monsalvo, F. Rogalla, J. M. Ortiz and A. Esteve-Núñez, Front. Energy Res., 2019, 7, 135 CrossRef.
- M. Mehanna, T. Saito, J. Yan, M. Hickner, X. Cao, X. Huang and B. E. Logan, Energy Environ. Sci., 2010, 3, 1114–1120 RSC.
- X. Kong, G. Yang and Y. Sun, Biomed. J. Sci. Technol. Res., 2018, 3(2), 3099–3104 Search PubMed.
- A. Gholizadeh, A. A. Ebrahimi, M. H. Salmani and M. H. Ehrampoush, Chemosphere, 2017, 188, 470–477 CrossRef CAS.
- M. Barahoei, M. S. Hatamipour, M. Khosravi, S. Afsharzadeh and S. E. Feghhipour, Sci. Total Environ., 2021, 779, 146473 CrossRef CAS PubMed.
- D. H. Kim, C. Lee, T. T. Nguyen, R. S. Adha, C. Kim, S. J. Ahn, H. Son and I. S. Kim, J. Ind. Eng. Chem., 2021, 98, 237–246 CrossRef CAS.
- A. Ebrahimi, G. D. Najafpour and D. Yousefi Kebria, Desalination, 2018, 432, 1–9 CrossRef CAS.
- A. Y. Goren and H. E. Okten, Desalination, 2021, 515, 115187 CrossRef.
- A. Y. Goren and H. E. Okten, Chemosphere, 2021, 285, 131370 CrossRef CAS PubMed.
- S. Sevda, I. M. Abu-Reesh, H. Yuan and Z. He, Energy Convers. Manage., 2017, 141, 101–107 CrossRef CAS.
- A. Ebrahimi, D. Yousefi Kebria and G. D. Najafpour, Chem. Eng. J., 2018, 354, 1092–1099 CrossRef CAS.
- B. Kokabian and V. G. Gude, Membr. Water Treat., 2015, 6(1), 53–75 CrossRef.
| This journal is © The Royal Society of Chemistry 2023 |

