 Open Access Article
In silico studies of a novel scaffold of benzoxazole derivatives as anticancer agents by 3D-QSAR, molecular docking and molecular dynamics simulations†
Yuhan Jiang‡
a,
Wei Yang‡b,
Fangfang Wang *a and
Bo Zhouc
aSchool of Life Science, Linyi University, Linyi, 276000, China. E-mail: yu100288@163.com
bNational Clinical Research Center for Infectious Diseases, Shenzhen Third People's Hospital, Shenzhen, 518112, China
cState Key Laboratory of Functions and Applications of Medicinal Plants, College of Basic Medical, Guizhou Medical University, Guizhou 550004, China
First published on 15th May 2023
Abstract
The vascular endothelial growth factor receptor-2 kinases (VEGFR-2) expressed on tumor cells and vessels are attractive targets for cancer treatment. Potent inhibitors for the VEGFR-2 receptor are novel strategies to develop anti-cancer drugs. In this work, template ligand-based 3D-QSAR studies were performed on a series of benzoxazole derivatives toward different cell lines (HepG2, HCT-116 and MCF-7). Comparative molecular field analysis (CoMFA) and comparative molecular similarity indices analysis (CoMSIA) techniques were used to generate 3D-QSAR models. Good predictability was derived for the optimal CoMFA models (HepG2: Rcv2 = 0.509, Rpred2 = 0.5128; HCT-116: Rcv2 = 0.574, Rpred2 = 0.5597; MCF-7: Rcv2 = 0.568, Rpred2 = 0.5057) and CoMSIA models (HepG2: Rcv2 = 0.711, Rpred2 = 0.6198; HCT-116: Rcv2 = 0.531, Rpred2 = 0.5804; MCF-7: Rcv2 = 0.669, Rpred2 = 0.6577). In addition, the contour maps derived from CoMFA and CoMSIA models were also generated to illustrate the relationship between different fields and the inhibitory activities. Moreover, molecular docking and molecular dynamics (MD) simulations were also conducted to understand the binding modes and the potential interactions between the receptor and the inhibitors. Some key residues (Leu35, Val43, Lys63, Leu84, Gly117, Leu180 and Asp191) were pointed out for stabilizing the inhibitors in the binding pocket. The binding free energies for the inhibitors agreed well with the experimental inhibitory activity and indicated that steric, electrostatic and hydrogen bond interactions are the main driving force for inhibitor-receptor binding. Overall, a good consistency between theoretical 3D-SQAR and molecular docking and MD simulation studies would provide directions for the design of new candidates, avoiding time-consuming and costly synthesis and biological evaluations. On the whole, the results derived from this study could expand the understanding of benzoxazole derivatives as anticancer agents and would be of great help in lead optimization for early drug discovery of highly potent anticancer activity targeting VEGFR-2.
1. Introduction
In vertebrates, many physiological processes including embryogenesis, organ development, estrus, and wound healing require vascular growth and remodeling.1–3 Furthermore, several diseases such as tumor growth, metastasis, psoriasis, rheumatoid arthritis, macular degeneration and retinopathy are closely related to angiogenesis.4–7 Activation of tumor angiogenesis originates from the imbalance between pro-angiogenesis and anti-angiogenesis factors.8,9 Extensive studies have been carried out and have discovered several factors: vascular endothelial growth factor (VEGF), angiopoietin (Ang), and ephrins. VEGF as a specific endothelial cell growth factor has been shown to be essential for angiogenesis cascade.10 Anti-VEGF monoclonal antibodies have been employed to inhibit the VEGF pathway, which result in inhibiting a variety of human tumors.11Among angiogenic factors, vascular endothelial growth factor-A (VEGF-A) is involved in the basic signaling of angiogenesis, especially signals for endothelial cell growth and survival in vivo.12 And it activates two tyrosine kinase receptors, VEGFR-1 (Flt-1) and VEGFR-2 (KDR in humans/Flk-1 in mice).13 VEGFR-1 and VEGFR-2 possess different signaling pathways and functions. VEGFR-1 is mainly responsible for the regulation of monocyte and macrophage migration, VEGFR-2 is the major signal transducer for the differentiation of endothelial cells from precursor mesodermal cells and the growth of endothelial cells in early embryogenesis.14 Since VEGFR-2 plays a substantial role in tumor neoangiogenesis, thus it has become an appropriate target for suppression of solid tumor growth.15
VEGFR-2 including 1356 amino acids in humans can be divided into 4 domains: the extracellular ligand-binding domain with seven immunoglobulin (Ig)-like domains, transmembrane domain, tyrosine kinase domain with an about 70 amino acids insert and carboxyl terminal domain.16 Studies have proven that VEGFR-2 can bind all VEGF-A isoforms, further induce a cascade of different signaling pathways. The dimerization of the receptor and the autophosphorylation of the intracellular tyrosine kinase domain result in the simultaneous activation of PLC-γ-Raf kinase-MEK-MAP kinase and PI3K-AKT pathways, leading to following cellular proliferation and endothelial-cell survival. Therefore, specific inhibitors binding with the different domains of VEGFR-2 would be employed for the treatment of cancers.17,18
In the early years, a rat mAb named DC101 was developed against VEGFR-2, which mainly interferes the binding of VEGF to VEGFR-2, and blocks tumor growth in mice.19 However, this ligand cannot bind the human VEGFR-2, thus limiting its further development. For this reason, more efforts are devoted to finding molecules for clinical use,20 for example, ramucirumab (IMC-1121B) is the only tested in human subjects, which is a novel human IgG1 mAb that would inhibit VEGFR-2 (selectively bind to the extracellular domain) with IC50 of 0.8–1.0 nM.21,22 Additionally, orally active and small inhibitors of VEGFR-2 have been studied: phthalazines,23 indolinones,24 quinazolines,25 isothiazoles,25 thienopyridines,26 thiazoles,27 pyridines,28 indoles,29 imidazopyridines,30 benzimidazoles,31 pyrimidines,32 biheteroaryls,33 sorafenib,34 sunitinib,34 pazopanib34 and apatinib.35 Some VEGFR-2 inhibitors undergoing clinical evaluation are also developed, for example, PTK-787,36 SU-11248,37 ZD-6474,25 CP-547632,38 and CEP-7055.39 Recent paper has found that a series of benzoxazole derivatives as VEGFR-2 inhibitors exert anticancer activity against HepG2, HCT-116, and MCF-7 cells. However, the structure–activity relationship for these inhibitors have not been performed on these inhibitors.
In the present work, a molecular modeling study combining three dimensional structure–activity relationship (3D-QSAR), molecular docking, molecular dynamics (MD), and molecular mechanics Poisson–Boltzmann surface area (MM-PBSA) were employed to discover the detailed binding mode of these inhibitors and identify the key amino acid residues responsible for inhibition. Finally, the best 3D-QSAR models were thoroughly analyzed. The interpretations derived from molecular docking, MD simulation were compared for model validation. Overall, this study would offer useful references for the discovery and design of novel VEGFR-2 inhibitors, and serve as the approachable end resultant hits that can be applied further for clinical trials evaluation in cancer.
2. Methods and materials
2.1. Preparation of data set
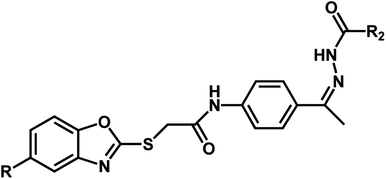
A series of substituted benzoxazole derivatives as VEGFR-2 inhibitors expressed inhibitory activity (IC50) against the HepG2, MCF-7, and HCT-116 cell lines were employed for the current study.40 The inhibitory activities were initially converted into corresponding pIC50 (−log![[thin space (1/6-em)]](https://www.rsc.org/images/entities/char_2009.gif) IC50) values, which have been used as dependent variables in the 3D-QSAR analyses, as shown in Table 1. Additionally, to derive the 3D-QSAR models, the whole data set was divided into the training set for the construction of CoMFA and CoMSIA models and the test set for validating the reliability of the model.
IC50) values, which have been used as dependent variables in the 3D-QSAR analyses, as shown in Table 1. Additionally, to derive the 3D-QSAR models, the whole data set was divided into the training set for the construction of CoMFA and CoMSIA models and the test set for validating the reliability of the model.
| Compound | n | R | R1 | pIC50 (HepG2) | pIC50 (HCT-116) | pIC50 (MCF-7) |
|---|---|---|---|---|---|---|
| a Represents the test set. | ||||||
| 1 | 1 | H | H | 4.0508 | 4.3152 | 4.2278 |
| 2 | 1 | H |  |
4.6048a | 4.7650a | 4.7846a |
| 3 | 1 | H |  |
4.8142 | 4.7857 | 4.7375 |
| 4 | 1 | CH3 | H | 4.3496a | 4.5955 | 4.5709 |
| 5 | 2 | H | H | 4.1712 | 4.2019a | 4.1352a |
| 6 | 2 | CH3 | H | 4.7442 | 4.5782a | 4.4594a |
| 7 | 1 | H |  |
4.8811 | 4.7368 | 4.7111 |
| 8 | 1 | H |  |
4.8502 | 4.6828 | 4.5508 |
| 9 | 2 | H |  |
5.2269a | 5.1463a | 5.0491a |
| 10 | 2 | H |  |
5.058 | 5.0214 | 5.0022 |
| 11 | 2 | CH3 |  |
5.384 | 5.1593 | 5.0620 |
| 12 | 2 | CH3 |  |
5.1818 | 5.0410 | 4.9952 |
| 13 | 1 | CH3 |  |
4.6702 | 4.5319 | 4.4342 |
| 14 | 2 | H |  |
5.0915 | 5.1018 | 4.9097 |
| 15 | 2 | CH3 |  |
5.0022 | 4.9038 | 4.8041 |
According to related ref. 41–43, the following criteria was considered when selecting the test set (labeled as a in Table 1): the inhibitory values in the test set should be distributed in various orders of magnitude in proportion to the whole data set.
2.2. Molecular modeling and alignment
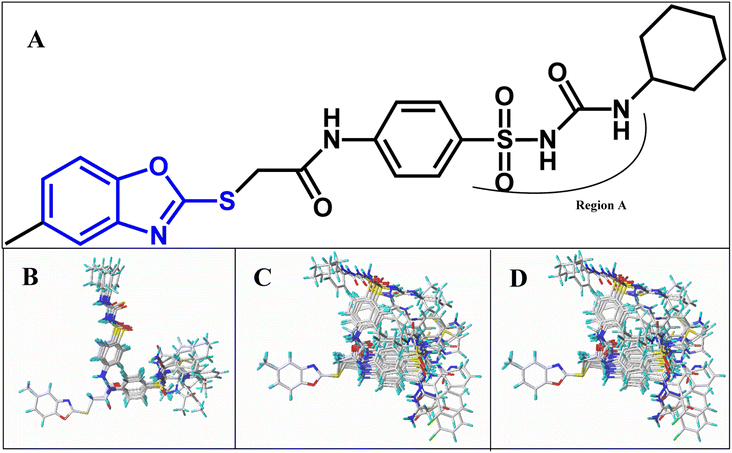
All structures of inhibitors were constructed using Sybyl-X 1.1 (Tripos Associates, St. Louis, MO). Then, the structures were optimized using the default Powell method with Gasteiger-Hückel charge, Tripos force field,44 the maximum number of iterations of 1000, and the termination of 0.005 kJ mol−1. Furthermore, the other parameters were set as default values as in Sybyl software.Molecular alignment is a crucial procedure in building accurate and reliable 3D-QSAR models.45 Some alignments approaches have been developed, i.e., rigid body-based, pharmacophore-based, and docking-based alignment to understand the effect of different substitutions on the inhibitory activity. In the present work, template ligand-based alignment was applied to derive the optimum 3D-QSAR models. In template ligand-based alignment, compound 11, exhibiting the highest activity in the whole data set, was selected as the template compound. The remaining compounds were aligned by the maximum common substructures (shown in blue in Fig. 1A). The alignment results of all inhibitors targeted on HepG2, HCT-116 and MCF-7 are shown in Fig. 1B–D.
2.3 3D-QSAR studies
In this work, CoMFA and CoMSIA methods were employed to explore the structure–activity relationships of the active inhibitors, which can connect different force fields of compounds with related activity in a quantificational way.46In CoMFA analysis,47 the steric and electrostatic fields were computed by Lennard Jones and coulombic potential functions, respectively. The aligned compounds were placed in the 3D cubic lattice with a grid spacing of 2 Å. A sp3 carbon atom with van der Waals radius of 1.52 Å and a charge of +1.0 were used to derive CoMFA descriptors. In addition, the CoMFA field was scaled using the CoMFA-STD method with a default energy of 30 kcal mol−1.
In addition to steric and electrostatic fields, hydrophobic, hydrogen bond donor and hydrogen bond acceptor fields were also calculated in the CoMSIA method.48 CoMSIA descriptors were also derived with the same lattice box as used in CoMFA. The probe atom possessed a hydrophobicity property of +1, and hydrogen bond donor and acceptor properties of +1. The attenuation factor and minimum column filtering was set to 0.3 and 2.0 kcal mol−1, respectively. More importantly, the distance dependence between the probe atom and each inhibitor atom was measured by a Gaussian function.49 Compared with CoMFA method, CoMSIA possesses a good performance in visualization and explanation of the contained correlations in terms of field contributions.50
2.4 Partial least-squares (PLS) analysis
PLS regression analysis was applied to build statistically significant 3D-QSAR models, which establish correlations between the CoMFA/CoMSIA descriptors and inhibitory activities, as independent and dependent variables, respectively. Initially, the cross-validation using leave-one-out (LOO) method was performed to evaluate the reliability of the constructed models, resulting in the optimum number of components (ONC), the cross-validated correlation coefficient (Rcv2) and the standard predicted errors (SEP). The Rcv2 is computed with equation:
 | (1) |
Then, non-cross-validation analysis was performed using the derived ONC to generate the final PLS regression models with the conventional correlation coefficient (Rncv2), standard error of estimation (SEE) and the F values calculated.
2.5 3D-QSAR model validation
The robustness and statistical significance of the 3D-QSAR models was evaluated with the test set inhibitors.51 The inhibitory activities of the test set were predicted based on the derived models and the predictive correlation coefficient (Rpred2) is computed using the following equations:
 | (2) |
| PRESS = ∑(Yexp − Ypred)2 | (3) |
| SD = ∑(Yexp − Ymean)2 | (4) |
2.6 Molecular docking
The crystal structure of VEGFR-2 in complex with a novel 4-amino-furo[2,3-d]pyrimidine (PDB ID: 1YWN) obtained from the RCSB Protein Data Bank (https://doi.org/10.2210/pdb1YWN/pdb) was employed for molecular docking with AutoDock software (version 4).52 Prior to molecular docking, all the hetero-atoms including co-crystallized ligand as well as water molecules and ions were firstly removed from the protein. Polar hydrogen atoms and Gasteiger charges were added to the receptor. In addition, the inhibitors employed in the present work were prepared by merging non-polar hydrogens, adding Gasteiger charges, defining the rotatable bonds, and assigning AutoDock type.53The 3D grid box with 60 × 60 × 60 Å grid points with grid spacing of 0.375 Å was generated using the AutoGrid algorithm to evaluate inhibitor-receptor interactions energy.54 Additionally, Lamarckian algorithm (LGA) approach was also used to search for the globally optimized conformations. Each molecular docking procedure was derived from 100 different runs that were set to terminate after a maximum of 250![[thin space (1/6-em)]](https://www.rsc.org/images/entities/char_2009.gif) 000 energy evaluations. Finally, the binding modes with lower binding free energies were chosen for further analysis.
000 energy evaluations. Finally, the binding modes with lower binding free energies were chosen for further analysis.
2.7. Molecular dynamics simulation
The docked complexes VEGFR-2/Cpd11 and VEGFR-2/Cpd15 were used as initial structures for the next MD simulations by using the AMBER v 20 (PMEMD) with CUDA acceleration by HPC cluster facility of Warshel Institute for Computational Biology.55 The parameters for inhibitors Cpd11 and Cpd15 were generated by Antechamber of Ambertools 21.55,56 The RESP charges57 and the bond constraints were extracted from Gaussian 09 by calculating the DFT function of B3LYP/6-31G**,58,59 and Amber GAFF,60 respectively. In addition, the AMBER 14SB force field61 was used for VEGFR-2 receptor. The topology file of the inhibitor-receptor complexes was retrieved and the structures were simulated in a periodic solvent TIP3P box with thickness of 16 Å in layer for each system.62 The total charge of the systems was then neutralized by adding counter ions (Na+ and Cl−). Finally, the system of VEGFR-2/Cpd11 and VEGFR-2/Cpd15 is 82.09 × 86.83 × 86.55 Å3 (50![[thin space (1/6-em)]](https://www.rsc.org/images/entities/char_2009.gif) 222 atoms) and 82.09 × 86.83 × 86.54 Å3 (50
222 atoms) and 82.09 × 86.83 × 86.54 Å3 (50![[thin space (1/6-em)]](https://www.rsc.org/images/entities/char_2009.gif) 218 atoms), respectively.
218 atoms), respectively.
The solvated systems were then minimized by 10![[thin space (1/6-em)]](https://www.rsc.org/images/entities/char_2009.gif) 000 steps to remove bad contacts between water, ions and the complex systems. Then, the temperature of the systems were heated from 0 to 300 K with 50 ps in the NVT ensemble. Furthermore, the equilibrium simulations at 300 K and 1 atm were incorporated. A Langevin thermostat was used for temperature control and the SHAKE algorithm63 was employed for hydrogen bonds, the detailed setting was as follows: 50 ps of density equilibration with weak restraints (5 kcal mol−1) on the complex followed by 500 ps of constant pressure (1 atm) equilibration at 300 K at a time step of 2 fs, the non-bonded cut-off was set to 20.0 Å. Finally, a 500 ns production run with 3 replicates was conducted by setting different velocities of random seeds to the equilibrium structure. And the trajectories were sampled every 10 ps.
000 steps to remove bad contacts between water, ions and the complex systems. Then, the temperature of the systems were heated from 0 to 300 K with 50 ps in the NVT ensemble. Furthermore, the equilibrium simulations at 300 K and 1 atm were incorporated. A Langevin thermostat was used for temperature control and the SHAKE algorithm63 was employed for hydrogen bonds, the detailed setting was as follows: 50 ps of density equilibration with weak restraints (5 kcal mol−1) on the complex followed by 500 ps of constant pressure (1 atm) equilibration at 300 K at a time step of 2 fs, the non-bonded cut-off was set to 20.0 Å. Finally, a 500 ns production run with 3 replicates was conducted by setting different velocities of random seeds to the equilibrium structure. And the trajectories were sampled every 10 ps.
2.8 Binding free energy calculation
MM/PB & GBSA64,65 with MMPBSA.py.MPI66 provided in the Amber program was employed to calculate the Gibbs binding free energies (ΔGbinding) between receptors and inhibitors (Cpd11, Cpd15), which was computed according to the following equations:| ΔGbinding = ΔGcom − (ΔGrec + ΔGlig) | (5) |
| ΔGcom/rec/lig = ΔH − TΔS | (6) |
| ΔH = ΔEgas + ΔGsol | (7) |
| ΔEgas = ΔEint + ΔEvdw + ΔEele | (8) |
| ΔGsol = ΔGPB/GB + ΔGNP | (9) |
| ΔGNP = γSASA + β | (10) |
3. Results and discussion
3.1. 3D-QSAR analysis
In the present work, template ligand-based alignment was carried out in both CoMFA and CoMSIA analyses. All combinations of different fields (Tables S1–S3†) were tried to produce the optimal model, which would be evaluated by some significant parameters, including the cross-validated correlation coefficient (Rcv2), the conventional correlation coefficient (Rncv2), the standard error of estimation (SEE), standard error of prediction (SEP) and F values. Furthermore, the optimal CoMFA and CoMSIA models are summarized in Table 2.| Parameters | HepG2 | HCT-116 | MCF-7 | |||
|---|---|---|---|---|---|---|
| CoMFA | CoMSIA | CoMFA | CoMSIA | CoMFA | CoMSIA | |
| a Rcv2 = cross-validated correlation coefficient using the leave-one-out methods; Rncv2 = conventional correlation coefficient; SEE = standard error of estimate; F = ratio of Rncv2 explained to unexplained = Rncv2/(1 − Rncv2); Rpred2 = predicted correlation coefficient for the test set of compounds; SEP = standard error of prediction; Nc = optimal number of principal components. | ||||||
| Rcv2 | 0.509 | 0.711 | 0.574 | 0.531 | 0.568 | 0.669 |
| Rncv2 | 0.904 | 0.865 | 0.746 | 0.984 | 0.755 | 0.981 |
| SEE | 0.134 | 0.153 | 0.171 | 0.047 | 0.157 | 0.048 |
| F | 44.077 | 48.191 | 49.903 | 218.135 | 52.355 | 179.713 |
| Rpred2 | 0.5128 | 0.6198 | 0.5597 | 0.5804 | 0.5057 | 0.6577 |
| SEP | 0.302 | 0.224 | 0.222 | 0.256 | 0.209 | 0.255 |
| Nc | 3 | 2 | 1 | 4 | 1 | 4 |
![[thin space (1/6-em)]](https://www.rsc.org/images/entities/char_2009.gif) |
||||||
| Field contribution | ||||||
| S | 0.729 | 0.262 | 0.623 | — | 0.623 | — |
| E | 0.271 | — | 0.377 | 0.375 | 0.377 | 0.372 |
| H | — | — | — | — | — | — |
| D | — | 0.738 | — | 0.625 | — | 0.628 |
| A | — | — | — | — | — | — |
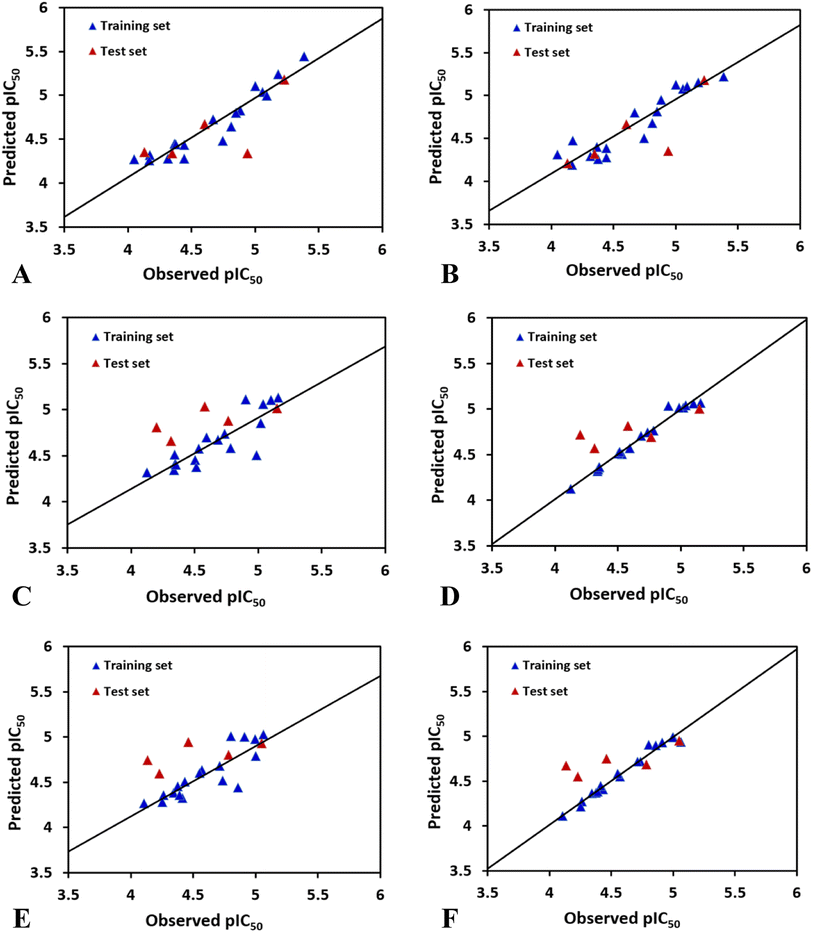
In case of CoMFAHepG2, the cross-validated correlation coefficients Rcv2 and the regression coefficient Rncv2 for the training set are 0.509 and 0.904 with optimal principal component Nc of 3, standard error of estimation SEE of 0.134, and F value of 44.077. Furthermore, the relative contributions of steric and electrostatic field of the CoMFA model are 72.9% and 27.1%, respectively, indicating that the steric field has higher impact on the inhibitory activity to HepG2 cell line than electrostatic field. Overall, the parameters derived from the CoMFA model suggest the reliability of this model. Besides, the test set inhibitors were also employed to validate the CoMFA model, and the predicted correlation coefficient Rpred2 of 0.5128 suggests that the model is strong enough to fit new observations. The plot of experimental against calculated values of inhibitory activity by the CoMFA model is listed in Fig. 2A. As shown in this figure, most points are equally dispersed anong the line y = x, further demonstrating the good quality of the CoMFA model.
The best CoMSIAHepG2 model was obtained using a combination of steric and hydrogen bond donor fields. The CoMSIA model has a cross-validated correlation coefficient Rcv2 of 0.711 with 2 optimal components. PLS analysis with non-cross-validation method gives Rncv2 of 0.865, F value of 48.191, and a SEE value of 0.153. The CoMSIA model also has a predicted correlation coefficient Rpred2 of 0.6198 which is higher than 0.5, indicating a good external predictive ability of this model. Additionally, the contributions of the steric and hydrogen bond donor fields are 26.2% and 73.8%, respectively, suggesting that the contribution of the hydrogen bond donor is predominant in the CoMSIA model. Fig. 2B shows predicted and experimental activities of training and test set compounds using the CoMSIA model.
The best CoMSIAHCT-116 model (combination of electrostatic and hydrogen bond donor fields) gives an Rcv2 of 0.531, Rncv2 of 0.984, SEE of 0.047, Nc of 4, F value of 218.135, indicating that the model had good fitting ability and predictive ability. The proportions of electrostatic and hydrogen bond donor contributions account for 37.5% and 62.5%, respectively, indicating that the hydrogen bond donor distribution of the group has more effect on the activity of HCT-116. The activity of the test set compounds were also predicted to verify the accuracy of the model. Through PLS analysis, the external predicted correlation coefficient Rpred2 is 0.5804, which suggests the derived model possesses good external prediction ability of the 3D-QSAR model. Fig. 2D indicates a strong linear association between the predicted pIC50 values and those observed.
The optimal CoMSIAMCF-7 model was constructed by using different combinations of steric, electrostatic, hydrophobic, hydrogen bond donor, and acceptor fields. Finally, CoMSIA-ED model gives significant results with Rcv2 of 0.669, Nc of 4, Rncv2 of 0.981, SEE of 0.048, and F of 179.713. The contributions of electrostatic and hydrogen bond donor fields are 37.2% and 62.8%, respectively, which suggest that the hydrogen bond donor descriptor has more impact on compounds' inhibitory activities than electrostatic field. The above statistical values suggest that the developed CoMSIA model is satisfactory. Additionally, to further validate the model's predictive ability, the activities of the test set compounds were predicted (shown in Table 2). The CoMSIA model exhibits excellent result in terms of predictive correlation coefficient Rpred2 of 0.6577. Fig. 2F depicts the relationship between the observed and predicted activities for the CoMSIA model, suggesting that the predicted values are in agreement with the experimental values in the allowable error range.
3.2. Contour maps
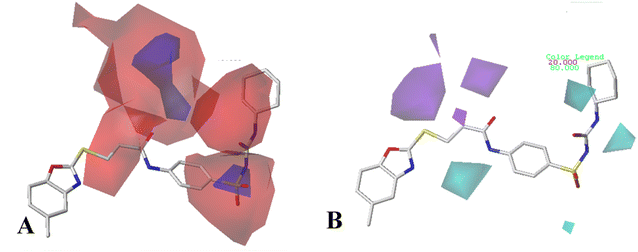
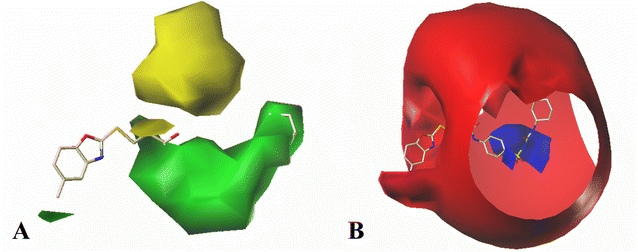
The results of 3D-QSAR models were graphically represented by contour maps using the field type ‘StDev*Coeff’. In order to facilitate the contour map analysis, the most potent Cpd11 was chosen as the reference in the 3D coefficient contour maps. Furthermore, a default value of 80% contribution for favored regions was defined to visualize the contour maps, while the disfavored regions was 20%.For the CoMFA steric field (Fig. 3A), a green contour map is observed around R1 substituent, suggesting that bulky substitution in this area is favorable for the inhibitory activity. This explains the lower activity of Cpd06 (pIC50 = 4.7442) with –H group when compared to Cpd11 (pIC50 = 5.384) with  group. In addition, there is also a larger yellow contour map is observed around the above green map, indicating that the size of the substituent at this place needs to be carefully selected. A yellow contour map covering the R substituent indicates that a small group in this region generally gets better inhibitory activity. This is in good agreement with the experimental data, for example, Cpd14 (R = H) > Cpd15 (R = CH3).
Fig. 3B shows the CoMFA electrostatic field contour map. There is a red contour map located in the R1 position, indicating that compounds with electronegative groups are beneficial for inhibitory activity, as observed from Cpd02 ( ), Cpd03 (
 ) > Cpd01 (H). Several blue contour maps are located around
  group, suggesting that the introduction of electropositive moieties into this position would be of benefit to activity. For the most active Cpd11, the substituents here can be modified to improve its activity.
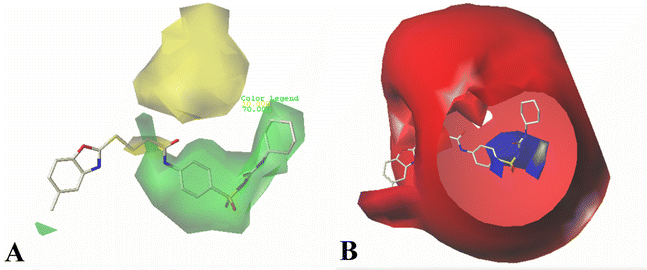
The contour maps of CoMSIA steric field are shown in Fig. 4A, which are found to be quite similar to the contour maps derived from the CoMFA model, thus are not discussed here.
In hydrogen bond donor contour map of CoMSIA (Fig. 4B), only purple contours and one cyan contour are discovered, illustrating that the hydrogen bond acceptor property is crucial for the inhibitory activity. In addition, the purple contour maps are mainly distributed at the nitrogen atom of the common skeleton and Region A, indicating that the atoms at these positions would act as hydrogen bond acceptors to interact favorably with the receptor. A cyan contour map is involved in the –NH group of Region A, indicating that a hydrogen bond interaction with the receptor (acting as a hydrogen bond donor) favors the activity, as is the case with Cpd16 and Cpd22. The activity of Cpd16 (pIC50 = 4.4444) is higher than that of Cpd22 (pIC50 = 4.3143).
 ) > Cpd02 (
 ), Cpd19 (
 ) > Cpd18 (
 ).
).
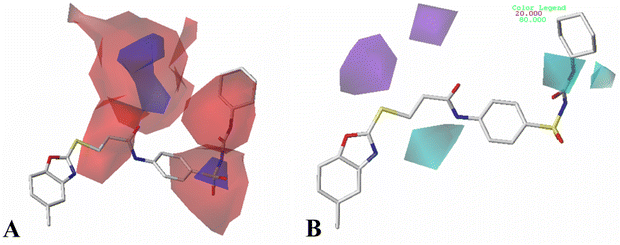
For CoMFA-electrostatic map in Fig. 5B, blue and red contours represent regions where electron positive and electron negative groups would increase the activity, respectively. There is red contour near R1 substituent, where electropositive occupation will enhance the activity. This can explain well why Cpd18 (pIC50 = 4.5018) has lower activity than Cpd19 (pIC50 = 4.5158). The red contour map near R position indicates that groups with negative charges may increase the activity. After analysis, it is found that all the compounds used in the present work are positively charged groups. Therefore, it can be modified to improve the activity. Furthermore, some blue contour maps are situated around Region A, thereby indicate the existence of electropositive groups in this region would improve the activity. Therefore, modifications can be made for Cpd11 at this position to improve the activity.
The electrostatic field of CoMSIA model (Fig. 6A) is similar to that of CoMFA model, for example: a red contour map at R1 substituent, a blue contour at Region A. However, the difference is that the red contour map at R substituent disappears.
The contour maps of the CoMSIA hydrogen bond donor field are shown in Fig. 6B. There is a purple contour at the sulfur atom of the common skeleton, which indicate hydrogen bond acceptor substituents here would increase the activity. It is also noted a cyan contour map appeared near the –NH of Region A, suggesting hydrogen bond donor in this position is important to the activity. This result can be explained by the Cpd11 and Cpd06 (pIC50 = 5.1593 for Cpd11, pIC50 = 4.5782 for Cpd06).
 ) exhibits higher value than Cpd18 (
 ).
).
The contour map of the electrostatic field in Fig. 7B shows a red contour map around R substituent, which indicate that electronegative groups at this location are favorable for the activity. However, all compounds possess positively charged groups here, therefore, it can be electrically modified to improve the activity. On the other, another red contour map is observed near R1 group, it results that the introduction of electronegative group in this region favors the inhibitory activity. Therefore, the higher activity observed in Cpd19 than Cpd18 may be explained by the presence of electronegative group –Cl at this position. In addition, around Region A, several blue contour maps are observed, indicating that electropositive substituents would enhance the inhibitory activity, therefore, modifications can be made to this substitution.
The electrostatic CoMSIA contour (Fig. 8A) is somewhat similar as the CoMFA contour. Therefore, it is no reason to describe it here as it is already explained in detail during CoMFA contour analysis. Here, we mainly focus on the hydrogen bond donor field.
The CoMSIA hydrogen bond donor contour maps are shown in Fig. 8B. A purple contour is appeared at the sulfur atom of the common skeleton, signifying that the hydrogen bond acceptor substituent would increase the activity. Moreover, two cyan contour maps near the –NH group of Region A indicate that hydrogen bond donor groups are preferred at this position. Thus, Cpd09, Cpd10, Cpd11 with hydrogen bond donor groups are more active than Cpd06.
3.3. Molecular docking studies
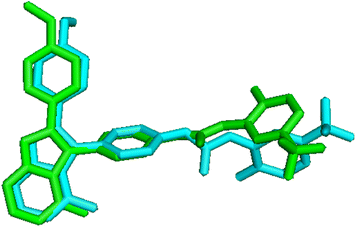
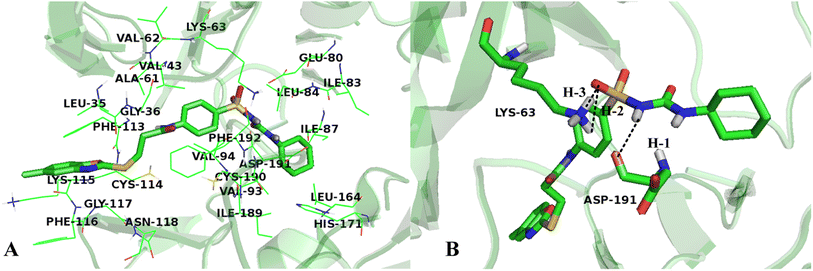
To validate the accuracy of molecular docking, the co-crystallized ligand of the protein was extracted and re-docked into the same binding site of the receptor. The conformation with lowest energy and the co-crystallized ligand were superimposed, as shown in Fig. 9, and the RMSD value is 0.863 Å, which is within the reliable range of 2 Å,73 illustrating that the docking procedure is rational. Although small rotation angle is presented, the binding site is same for the re-docked compound and the original structure. In addition, cross-docking with other VEGFR-2 structures 3VO3 was also done on Cpd11, the docked structures of 1YWN-Cpd11 and 3VO3-Cpd11 are aligned together to compare (Fig. S1†), the RMSD value is 0.324 Å and we find that the two docking structures are located at the same binding site, and the conformations are slightly different, further validating the reliability of molecular docking. Therefore, the relevant settings were employed for docking the most active Cpd11 and the lowest active Cpd15 into the binding pocket of VEGFR-2 to evaluate the detailed binding mode of this series of benzoxazole derivatives into the active site of VEGFR-2.Fig. 10A shows the binding environment of Cpd11 in VEGFR-2, which is surrounded by Leu35, Gly36, Val43, Ala61, Val62, Lys63, Glu80, Ile83, Leu84, Ile87, Val93, Val94, Phe113, Cys114, Lys115, Phe116, Gly117, Asn118, Leu164, His171, Ile189, Cys190, Asp191, and Phe192. As seen in Fig. 10B, the –NH group in Region A that acts as a hydrogen bond donor, forms a hydrogen bond with the backbone of Asp191 (–O⋯HN, 2.19 Å, 143.1°) (H-1). Furthermore, the backbones of Lys63, which act as hydrogen bond donors and form hydrogen bonds with the –SO group at Region A (–O⋯HN, 2.89 Å, 70.8°) (H-2), (–O⋯HN, 2.29 Å, 105.3°) (H-3). In addition, the cyan and purple contour maps from the above CoMSIA models (Fig. 4B, 6B and 8B) are fallen in this region, thus, the obtained results from molecular docking and QSAR models are harmonious. It also reveals that the groups at Region A are significant for the activity of VEGFR-2 inhibitors, and agree with the higher inhibitory activity of some inhibitors.
It can be seen from Fig. 10A that the R1 substituent is anchored in a bulky and electropositive pocket made by Ile83, Leu84, Ile87, Leu164 and His171, suggesting that large and electronegative groups are favorable in the site. This is in consistent with the positioned green and red contour maps (Fig. 3, 5 and 7). Additionally, the substituent at Region A is adjacent to amino acid residues Glu80, Val94, and Asp191, which indicates that electropositive groups are favored in this direction. This result is in concordance with the CoMFA results for electrostatic interactions shown in Fig. 3B, 5B and 7B.
The interactions between Cpd15 and the active site of VEGFR-2 are depicted in Fig. 11. The Cpd15 is surrounded by amino acid residues Met1, Cys12, Val43, Ala61, Val62, Lys63, Ser79, Glu80, Ile83, Leu84, Ile87, Val93, Val94, Val109, Ile110, Val111, Leu164, Cys169, Ile170, His171, Arg172, Ile189, Cys190, Asp191 and Phe192. Furthermore, the ligand is docked into the binding pocket via two hydrogen bonds and one arene–cation interaction. The hydrogen bond distances are observed to be 2.13 Å (Met1-NH⋯O![[double bond, length as m-dash]](https://www.rsc.org/images/entities/char_e001.gif) ) (H-1), and 2.64 Å (Met1-NH⋯O
) (H-1), and 2.64 Å (Met1-NH⋯O![[double bond, length as m-dash]](https://www.rsc.org/images/entities/char_e001.gif) ) (H-2). The arene–cation interaction is observed between Lys63 and the benzene ring and five-membered heterocyclic ring at the common skeleton. Analyses show that Cpd15 possess several interactional amino acids as Cpd11, but different residues are also exist, especially residues Lys63, Glu80, and Asp191, which can interact with Cpd11 via hydrogen bond interactions, affecting the inhibitory activity of this series of inhibitors from the field distributions in the CoMSIA models. This is the reason why Cpd11 has higher activity than Cpd15.
) (H-2). The arene–cation interaction is observed between Lys63 and the benzene ring and five-membered heterocyclic ring at the common skeleton. Analyses show that Cpd15 possess several interactional amino acids as Cpd11, but different residues are also exist, especially residues Lys63, Glu80, and Asp191, which can interact with Cpd11 via hydrogen bond interactions, affecting the inhibitory activity of this series of inhibitors from the field distributions in the CoMSIA models. This is the reason why Cpd11 has higher activity than Cpd15.
On the other hand, to explore the detailed binding modes between the receptor VEGFR-2 and the inhibitors in the aqueous solution, MD simulations were carried out to describe the most active and least active inhibitors during the dynamic binding process.
3.4. MD simulations
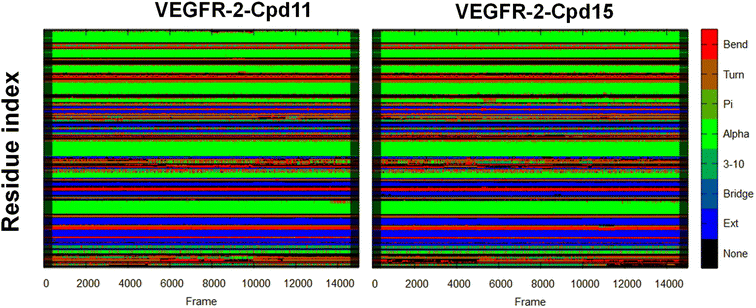
Two docked complexes (VEGFR-2/Cpd11 and VEGFR-2/Cpd15) were performed with MD simulations to examine the reliability of the molecular docking process, and in turn to gain insights into the stability and dynamics of the systems.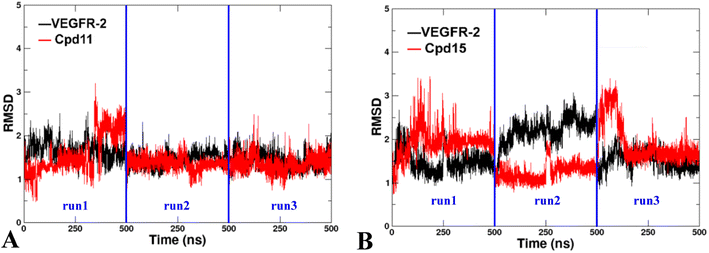 | ||
| Fig. 12 The RMSD of the backbone atoms relative to the docking structures as function of time. (A) The three replicates of VEGFR-2/Cpd11. (B) The three replicates of VEGFR-2/Cpd15. | ||
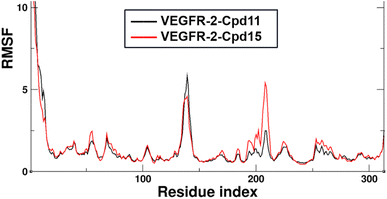
Additionally, the Root Mean Square Fluctuation (RMSF) of the backbone atoms that were summarized to exhibit the contribution on the residue-level. The trajectories were aligned by the Cα atoms of the starting structures of MD simulations beforehand to eliminate the rotation and transitions of the whole systems. The detailed analysis of RMSF of VEGFR-2 residues for the two MD systems are shown in Fig. 11. Firstly, the N-terminal of the protein is also seen large fluctuation for both systems at residues (7.28 ± 3.22 Å), this might because the truncation effect of recombinant protein itself. Secondly, the second largest fluctuation area locates in the flexible loop, Thr154 to Ser166 of domain II (6.87 ± 2.18 Å for VEGFR-2/Cpd11, 5.24 ± 1.25 Å for VEGFR-2/Cpd15). It is because of the missing 12 residues in the original crystal structure. Thirdly, the ligand binding domain (LBD) of Cpd11 containing system fluctuated lower (0.89 ± 0.14 Å) than that in Cpd15 system (1.23 ± 0.34 Å), which also suggesting the binding of Cpd15 is not as stable as that of Cpd11 (Fig. 14).
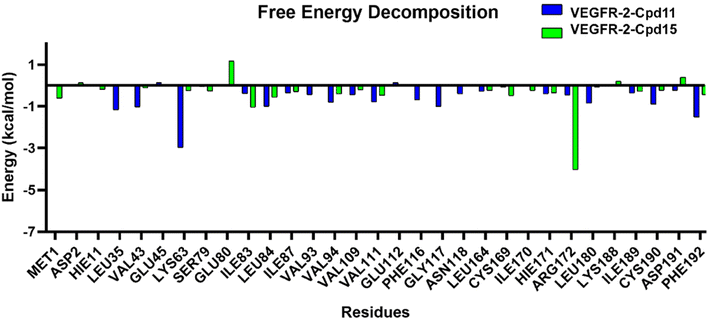
The results of binding free energy using MM-GBSA and MM-PBSA method are shown in Table S4.† The calculated binding free energy for Cpd11 and Cpd15 is −27.16 kcal mol−1 and −1.99 kcal mol−1, respectively for GBSA, and −7.87 kcal mol−1, 14.08 kcal mol−1 for PBSA (Table S1†). These total free energies indicate that Cpd11 is quite a better ligand for VEGFR-2 compared to Cpd15. Indeed, the ranking of the binding free energies of the two compounds are consistent with the predicted ranking that was calculated from the developed 3D-QSAR models, which further validated the reliability of the constructed models. It can be seen from the binding free energy components that the van der Waals and electrostatic interactions in the gas phase are the pivotal contributions for the inhibitor binding. On the other hand, the solvation energy (DELTA G solv) calculated from both GB and PB contributes negatively to the total binding affinity (131.84 kcal mol−1 and 54.82 kcal mol−1 for Cpd11, and 151.13 kcal mol−1 and 70.89 kcal mol−1 for Cpd15 respectively), illustrating that the solvation energies are unfavorable for stabilizing the binding of the two compounds. It might because of the large volume of the binding pocket that exposes to the massive solvent. Interestingly, the entropy contribution of the two systems are similar (29.23 kcal mol−1 for Cpd11, and 29.16 kcal mol−1 for Cpd15), owing to the similar size of the two compounds.
 and
and  are introduced. Additionally, we find that the CoMSIA model for HepG2, CoMFA model for HCT-116, and CoMSIA model for MCF-7 are superior to the other model, thus these 3D-QSAR models were chosen to predict the inhibitory activities. Then, the designed compounds are docked into the active site to the receptor. We find that D4 exhibits higher predicted inhibitory activities and docking scores. D4 is introduced one bulk and electronegative
  to R1 substituent, one moderate electronegative –NH2 to R substituent, which improve the binding activity, especially the R substituent form electrostatic interactions with amino acid residues Lys33 and Lys115. In conclusion, based on the analysis discussed above, some novel VEGFR-2 inhibitors, especially D4 shows higher predicted binding activity to the receptor VEGFR-2, further suggesting that the above findings would provide useful guidance to rational design novel and potent VEGFR-2inhibitors.
4. Conclusion
In the present work, the 3D-QSAR study combined with molecular docking and MD simulations were conducted on a series of VEGFR-2 inhibitors against HepG2, HCT-116, and MCF-7 cell lines. The CoMFA and CoMSIA models possess excellent internal and external validation. The steric, electrostatic and hydrogen bond donor fields of these models for different cell lines have been verified that alterations for these characteristics can affect the inhibitory activity. The developed models were analyzed to show the effects associated with position of each group in the ligand, resulting in better insights for designing novel VEGFR-2 inhibitors. Molecular docking was used to provide initial conformation for MD simulation, which help in the investigation on the behavior of the inhibitors and point possible effects that are responsible for the inhibitory activity. Based on the derived information, a bulky group with higher electron-withdrawing ability at the R1 position, minor group at R position, and electron-donating ability and hydrogen bond donor group at Region A would be favorable for anticancer activity against HepG-2. In addition, using a bulky group and electronegative group in R1, bulky and electronegative group in R, and electropositive and hydrogen bond donor group at Region A would lead to an increase in inhibition activity for HCT-116. Furthermore, bulky and electronegative groups at R1 and R, electropositive and hydrogen bond donor groups at Region A would be favorable for the activity against MCF-7 cell line. The powerful approaches, including 3D-QSAR studies, molecular docking and MD simulations led to the design of inhibitors with enhanced VEGFR-2 inhibitory activities. The newly designed inhibitors have improved VEGFR-2 inhibitory activities. Overall, the findings could represent good drug candidates for the treatment of cancer.Conflicts of interest
The authors declare that there are no conflicts of interest.Acknowledgements
The study was supported by the National Natural Science Foundation of China (No. 32001699).References
- W. Risau, Nature, 1997, 386, 671–674 CrossRef CAS PubMed.
- J. Folkman, Biology of endothelial cells, 1984, pp. 412–428 Search PubMed.
- W. Risau, FASEB J., 1995, 9, 926–933 CrossRef CAS PubMed.
- R. Kuiper, J. Schellens, G. Blijham, J. Beijnen and E. Voest, Pharmacol. Res., 1998, 37, 1–16 CrossRef CAS PubMed.
- R. Kumar and I. J. Fidler, In Vivo, 1998, 12, 27–34 CAS.
- Z. Szekanecz, G. Szegedi and A. E. Koch, J. Invest. Med., 1998, 46, 27–41 CAS.
- M. J. Tolentino and A. P. Adamis, Int. Ophthalmol., 1998, 38, 77–94 CrossRef CAS PubMed.
- G. Bergers and L. E. Benjamin, Nat. Rev. Cancer, 2003, 3, 401–410 CrossRef CAS PubMed.
- R. K. Jain, Nat. Med., 2003, 9, 685–693 CrossRef CAS PubMed.
- G. Neufeld, T. Cohen, S. Gengrinovitch and Z. Poltorak, FASEB J., 1999, 13, 9–22 CrossRef CAS PubMed.
- P. Borgström, K. J. Hillan, P. Sriramarao and N. Ferrara, Cancer Res., 1996, 56, 4032–4039 Search PubMed.
- N. Ferrara and T. Davis-Smyth, Endocr. Rev., 1997, 18, 4–26 CrossRef CAS PubMed.
- M. Shibuya and L. Claesson-Welsh, Exp. Cell Res., 2006, 312, 549–560 CrossRef CAS PubMed.
- M. K. Sobhy, S. Mowafy, D. S. Lasheen, N. A. Farag and K. A. Abouzid, Bioorg. Chem., 2019, 89, 102988 CrossRef CAS PubMed.
- M. Shibuya, Cancer Sci., 2003, 94, 751–756 CrossRef CAS PubMed.
- M. A. McTigue, J. A. Wickersham, C. Pinko, R. E. Showalter, C. V. Parast, A. Tempczyk-Russell, M. R. Gehring, B. Mroczkowski, C.-C. Kan and J. E. Villafranca, Structure, 1999, 7, 319–330 CrossRef CAS PubMed.
- N. Ferrara, K. J. Hillan, H.-P. Gerber and W. Novotny, Nat. Rev. Drug Discovery, 2004, 3, 391–400 CrossRef CAS PubMed.
- P. Hamerlik, J. D. Lathia, R. Rasmussen, Q. Wu, J. Bartkova, M. Lee, P. Moudry, J. Bartek Jr, W. Fischer and J. Lukas, J. Exp. Med., 2012, 209, 507–520 CrossRef CAS PubMed.
- L. Witte, D. J. Hicklin, Z. Zhu, B. Pytowski, H. Kotanides, P. Rockwell and P. Böhlen, Cancer Metastasis Rev., 1998, 17, 155–161 CrossRef CAS PubMed.
- J. Huang, Y. Tan, Q. Tang, X. Liu, X. Guan, Z. Feng and J. Zhu, Cytotechnology, 2010, 62, 61–71 CrossRef CAS PubMed.
- J. L. Spratlin, K. E. Mulder and J. R. Mackey, Future Oncol., 2010, 6, 1085–1094 CrossRef CAS PubMed.
- D. Lu, X. Jimenez, H. Zhang, P. Bohlen, L. Witte and Z. Zhu, Int. J. Cancer, 2002, 97, 393–399 CrossRef CAS PubMed.
- J. M. Wood, G. Bold, E. Buchdunger, R. Cozens, S. Ferrari, J. Frei, F. Hofmann, J. Mestan, H. Mett and T. O'Reilly, Cancer Res., 2000, 60, 2178–2189 CAS.
- L. Sun, C. Liang, S. Shirazian, Y. Zhou, T. Miller, J. Cui, J. Y. Fukuda, J.-Y. Chu, A. Nematalla and X. Wang, J. Med. Chem., 2003, 46, 1116–1119 CrossRef CAS PubMed.
- M. F. McCarty, J. Wey, O. Stoeltzing, W. Liu, F. Fan, C. Bucana, P. F. Mansfield, A. J. Ryan and L. M. Ellis, Mol. Cancer Ther., 2004, 3, 1041–1048 CrossRef CAS PubMed.
- M. J. Munchhof, J. S. Beebe, J. M. Casavant, B. A. Cooper, J. L. Doty, R. C. Higdon, S. M. Hillerman, C. I. Soderstrom, E. A. Knauth and M. A. Marx, Bioorg. Med. Chem. Lett., 2004, 14, 21–24 CrossRef CAS PubMed.
- M. T. Bilodeau, A. E. Balitza, T. J. Koester, P. J. Manley, L. D. Rodman, C. Buser-Doepner, K. E. Coll, C. Fernandes, J. B. Gibbs and D. C. Heimbrook, J. Med. Chem., 2004, 47, 6363–6372 CrossRef CAS PubMed.
- M. T. Bilodeau, L. D. Rodman, G. B. McGaughey, K. E. Coll, T. J. Koester, W. F. Hoffman, R. W. Hungate, R. L. Kendall, R. C. McFall and K. W. Rickert, Bioorg. Med. Chem. Lett., 2004, 14, 2941–2945 CrossRef CAS PubMed.
- M. E. Fraley, K. L. Arrington, C. A. Buser, P. A. Ciecko, K. E. Coll, C. Fernandes, G. D. Hartman, W. F. Hoffman, J. J. Lynch and R. C. McFall, Bioorg. Med. Chem. Lett., 2004, 14, 351–355 CrossRef CAS PubMed.
- Z. Wu, M. E. Fraley, M. T. Bilodeau, M. L. Kaufman, E. S. Tasber, A. E. Balitza, G. D. Hartman, K. E. Coll, K. Rickert and J. Shipman, Bioorg. Med. Chem. Lett., 2004, 14, 909–912 CrossRef CAS PubMed.
- M. T. Bilodeau, A. M. Cunningham, T. J. Koester, P. A. Ciecko, K. E. Coll, W. R. Huckle, R. W. Hungate, R. L. Kendall, R. C. McFall and X. Mao, Bioorg. Med. Chem. Lett., 2003, 13, 2485–2488 CrossRef CAS PubMed.
- P. J. Manley, A. E. Balitza, M. T. Bilodeau, K. E. Coll, G. D. Hartman, R. C. McFall, K. W. Rickert, L. D. Rodman and K. A. Thomas, Bioorg. Med. Chem. Lett., 2003, 13, 1673–1677 CrossRef CAS PubMed.
- G.-H. Kuo, A. Wang, S. Emanuel, A. DeAngelis, R. Zhang, P. J. Connolly, W. V. Murray, R. H. Gruninger, J. Sechler and A. Fuentes-Pesquera, J. Med. Chem., 2005, 48, 1886–1900 CrossRef CAS PubMed.
- L. Claesson‐Welsh and M. Welsh, J. Intern. Med., 2013, 273, 114–127 CrossRef PubMed.
- S. Tian, H. Quan, C. Xie, H. Guo, F. Lü, Y. Xu, J. Li and L. Lou, Cancer Sci., 2011, 102, 1374–1380 CrossRef CAS PubMed.
- G. Bold, K.-H. Altmann, J. Frei, M. Lang, P. W. Manley, P. Traxler, B. Wietfeld, J. Brüggen, E. Buchdunger and R. Cozens, J. Med. Chem., 2000, 43, 2310–2323 CrossRef CAS PubMed.
- T. J. Abrams, L. J. Murray, E. Pesenti, V. W. Holway, T. Colombo, L. B. Lee, J. M. Cherrington and N. K. Pryer, Mol. Cancer Ther., 2003, 2, 1011–1021 CAS.
- J. S. Beebe, J. P. Jani, E. Knauth, P. Goodwin, C. Higdon, A. M. Rossi, E. Emerson, M. Finkelstein, E. Floyd and S. Harriman, Cancer Res., 2003, 63, 7301–7309 CAS.
- D. E. Gingrich, D. R. Reddy, M. A. Iqbal, J. Singh, L. D. Aimone, T. S. Angeles, M. Albom, S. Yang, M. A. Ator and S. L. Meyer, J. Med. Chem., 2003, 46, 5375–5388 CrossRef CAS PubMed.
- A. G. A. El‐Helby, H. Sakr, I. H. Eissa, H. Abulkhair, A. A. Al‐Karmalawy and K. El‐Adl, Arch. Pharm., 2019, 352, 1900113 CrossRef PubMed.
- C. Roy, Mol. Inf., 2012, 31, 817–835 CrossRef PubMed.
- P. Gramatica, Int. J. Quant. Struct.-Prop. Relat., 2020, 5, 61–97 Search PubMed.
- M. F. Andrada, E. G. Vega-Hissi, M. R. Estrada and J. C. Garro Martinez, Sar & Qsar in Environmental Research, 2017, pp. 1011–1023 Search PubMed.
- M. Clark, R. D. Cramer III and N. Van Opdenbosch, J. Comput. Chem., 1989, 10, 982–1012 CrossRef CAS.
- U. Chaube and H. Bhatt, Mol. Diversity, 2017, 21, 741–759 CrossRef CAS PubMed.
- K. Gerhard, J. Comput.-Aided Mol. Des., 1999, 13, 1–10 CrossRef PubMed.
- R. D. Cramer, D. E. Patterson and J. D. Bunce, J. Am. Chem. Soc., 1988, 110, 5959–5967 CrossRef CAS PubMed.
- G. Klebe, U. Abraham and T. Mietzner, J. Med. Chem., 1994, 37, 4130–4146 CrossRef CAS PubMed.
- A. Xiao, Z. Zhang, L. An and Y. Xiang, J. Mol. Model., 2008, 14, 149–159 CrossRef CAS PubMed.
- J. Liu, F. Wang, Z. Ma, X. Wang and Y. Wang, Int. J. Mol. Sci., 2011, 12, 946–970 CrossRef CAS PubMed.
- A. Tropsha, P. Gramatica and V. K. Gombar, QSAR Comb. Sci., 2003, 22, 69–77 CrossRef CAS.
- G. M. Morris, R. Huey, W. Lindstrom, M. F. Sanner, R. K. Belew, D. S. Goodsell and A. J. Olson, J. Comput. Chem., 2009, 30(16), 2785–2791 CrossRef CAS PubMed.
- M. F. Sanner, Int. J. Mol. Sci., 1999, 17, 57–61 CAS.
- G. M. Morris, D. S. Goodsell, R. S. Halliday, R. Huey, W. E. Hart, R. K. Belew and A. J. Olson, J. Comput. Chem., 1998, 19, 1639–1662 CrossRef CAS.
- I. Y. B.-S. D. A. Case, S. R. Brozell, D. S. Cerutti, T. E. Cheatham III, V. W. D. Cruzeiro, T. A. Darden, R. E. Duke, D. Ghoreishi, M. K. Gilson, H. Gohlke, A. W. Goetz, D. Greene, R. Harris, N. Homeyer, S. Izadi, A. Kovalenko, T. Kurtzman, T. S. Lee, S. LeGrand, P. Li, C. Lin, J. Liu, T. Luchko, R. Luo, D. J. Mermelstein, K. M. Merz, Y. Miao, G. Monard, C. Nguyen, H. Nguyen, I. Omelyan, A. Onufriev, F. Pan, R. Qi, D. R. Roe, A. Roitberg, C. Sagui, S. Schott-Verdugo, J. Shen, C. L. Simmerling, J. Smith, R. Salomon-Ferrer, J. Swails, R. C. Walker, J. Wang, H. Wei, R. M. Wolf, X. Wu, L. Xiao, D. M. York and P. A. Kollman, AMBER 2018, University of California, San Francisco., 2018 Search PubMed.
- J. Wang, W. Wang, P. A. Kollman and D. A. Case, Int. J. Mol. Sci., 2006, 25, 247–260 CAS.
- C. I. Bayly, P. Cieplak, W. Cornell and P. A. Kollman, J. Phys. Chem., 1993, 97, 10269–10280 CrossRef CAS.
- P. Stephens, F. Devlin, C. Chabalowski and M. J. Frisch, J. Phys. Chem., 1994, 98, 11623–11627 CrossRef CAS.
- M. J. Frisch, G. W. Trucks, H. B. Schlegel, G. E. Scuseria, M. A. Robb, J. R. Cheeseman, G. Scalmani, V. Barone, B. Mennucci, G. A. Petersson, H. Nakatsuji, M. Caricato, X. Li, H. P. Hratchian, A. F. Izmaylov, J. Bloino, G. Zheng, J. L. Sonnenberg, M. Hada, M. Ehara, K. Toyota, R. Fukuda, J. Hasegawa, M. Ishida, T. Nakajima, Y. Honda, O. Kitao, H. Nakai, T. Vreven, J. A. Montgomery Jr, J. E. Peralta, F. Ogliaro, M. J. Bearpark, J. Heyd, E. N. Brothers, K. N. Kudin, V. N. Staroverov, R. Kobayashi, J. Normand, K. Raghavachari, A. P. Rendell, J. C. Burant, S. S. Iyengar, J. Tomasi, M. Cossi, N. Rega, N. J. Millam, M. Klene, J. E. Knox, J. B. Cross, V. Bakken, C. Adamo, J. Jaramillo, R. Gomperts, R. E. Stratmann, O. Yazyev, A. J. Austin, R. Cammi, C. Pomelli, J. W. Ochterski, R. L. Martin, K. Morokuma, V. G. Zakrzewski, G. A. Voth, P. Salvador, J. J. Dannenberg, S. Dapprich, A. D. Daniels, Ö. Farkas, J. B. Foresman, J. V. Ortiz, J. Cioslowski and D. J. Fox, Gaussian, Inc., Wallingford, CT, USA, 2009.
- J. Wang, R. M. Wolf, J. W. Caldwell, P. A. Kollman and D. A. Case, J. Comput. Chem., 2004, 25, 1157–1174 CrossRef CAS PubMed.
- J. A. Maier, C. Martinez, K. Kasavajhala, L. Wickstrom, K. E. Hauser and C. Simmerling, J. Chem. Theory Comput., 2015, 11, 3696–3713 CrossRef CAS PubMed.
- W. L. Jorgensen, J. Chandrasekhar, J. D. Madura, R. W. Impey and M. L. Klein, J. Chem. Phys., 1983, 79, 926–935 CrossRef CAS.
- J.-P. Ryckaert, G. Ciccotti and H. J. Berendsen, J. Comput. Phys., 1977, 23, 327–341 CrossRef CAS.
- P. A. Kollman, I. Massova, C. Reyes, B. Kuhn, S. Huo, L. Chong, M. Lee, T. Lee, Y. Duan, W. Wang, O. Donini, P. Cieplak, J. Srinivasan, D. A. Case and T. E. Cheatham 3rd, Acc. Chem. Res., 2000, 33, 889–897 CrossRef CAS PubMed.
- J. Wang, P. Morin, W. Wang and P. A. Kollman, J. Am. Chem. Soc., 2001, 123, 5221–5230 CrossRef CAS PubMed.
- B. R. Miller III, T. D. McGee Jr, J. M. Swails, N. Homeyer, H. Gohlke and A. E. Roitberg, J. Chem. Theory Comput., 2012, 8, 3314–3321 CrossRef PubMed.
- G. D. Hawkins, C. J. Cramer and D. G. Truhlar, J. Phys. Chem., 1996, 100, 19824–19839 CrossRef CAS.
- T. Hou, K. Chen, W. A. McLaughlin, B. Lu and W. Wang, PLoS Comput. Biol., 2006, 2, e1 CrossRef PubMed.
- A. Onufriev, D. Bashford and D. A. Case, J. Phys. Chem. B, 2000, 104, 3712–3720 CrossRef CAS.
- J. Weiser, P. S. Shenkin and W. C. Still, J. Comput. Chem., 1999, 20, 217–230 CrossRef CAS.
- R. B. Hermann, J. Phys. Chem., 1972, 76, 2754–2759 CrossRef CAS.
- D. Sitkoff, K. A. Sharp and B. Honig, J. Phys. Chem., 1994, 98, 1978–1988 CrossRef CAS.
- K. Onodera, K. Satou and H. Hirota, J. Chem. Inf. Model., 2007, 47, 1609–1618 CrossRef CAS PubMed.
- M. J. Abraham, T. Murtola, R. Schulz, S. Páll, J. C. Smith, B. Hess and E. Lindahl, SoftwareX, 2015, 1, 19–25 CrossRef.
- L. R. Lima, R. S. Bastos, E. F. Ferreira, R. P. Leão, P. H. Araújo, S. S. d. R. Pita, H. F. De Freitas, J. M. Espejo-Román, E. L. Dos Santos and R. d. S. Ramos, Int. J. Mol. Sci., 2022, 23, 9927 CrossRef CAS PubMed.
Footnotes |
| † Electronic supplementary information (ESI) available. See DOI: https://doi.org/10.1039/d3ra01316b |
| ‡ These authors contributed equally to this work. |
| This journal is © The Royal Society of Chemistry 2023 |


