
 Open Access Article
 This Open Access Article is licensed under a Creative Commons Attribution-Non Commercial 3.0 Unported Licence
Composite beads from chitosan and zeolitic imidazolate framework-8 for the adsorption and photocatalytic degradation of reactive red 141†
Kunlarat Phonlakana,
Benjawan Khamsuka,
Natthanicha Soontonhonga,
Chonnakarn Panawonga,
Piyawan Kongsengb,
Sirinya Chantarak *b and
Surangkhana Budsombat*a
*b and
Surangkhana Budsombat*a
aDepartment of Chemistry and Center of Excellence for Innovation in Chemistry, Materials Chemistry Research Center, Faculty of Science, Khon Kaen University, Khon Kaen 40002, Thailand. E-mail: surama@kku.ac.th
bDivision of Physical Science, Faculty of Science, Prince of Songkla University, Hat Yai, Songkhla 90110, Thailand. E-mail: sirinya.c@psu.ac.th
First published on 19th April 2023
Abstract
This study describes the fabrication of composite beads comprising chitosan and zeolitic imidazolate framework-8 (ZIF-8) as a natural biodegradable dye adsorbent and support for ZnO photocatalyst. Chitosan beads were cross-linked with trisodium citrate dihydrate to enhance the adsorption capacity for the reactive red 141 dye (RR141). The ability was further improved by adding ZIF-8. The optimum loading was 2.5%, and the adsorption equilibrium was reached within 2 h. The maximum adsorption capacity of the composite beads was 6.51 mg g−1 at pH 4 when an initial concentration of 1000 mg L−1 was used. The pseudo-second-order kinetics model and the Langmuir isotherm model best described the adsorption process. The composite beads could also adsorb dyes like reactive black, Congo red, direct yellow, reactive orange, rhodamine B, crystal violet, and methylene blue (MB). Thermal stability was significantly improved after coating the surface of the 2.5% ZIF beads with a ZnO photocatalyst. After UV irradiation for 5 h, the photocatalytic beads containing 2.59 weight percent of ZnO could decolorize 99% of MB and 90% of RR141 dyes with a degradation rate of 0.6032 h−1 and 0.3198 h−1, respectively. Furthermore, the photocatalytic beads remained effective for at least ten consecutive cycles.
1. Introduction
Dyes have broad industrial applications. However, the direct discharge of dyes into water causes environmental problems like potential toxicity and reduced photosynthetic activity.1 Reactive dyes are pigments composed of azo or phthalocyanine chromophores and aromatic rings. They are most stable to light and can biodegrade in an aerobic environment to a limited extent. Moreover, azo dyes decompose into carcinogenic aromatic amines in an anaerobic environment.2Coagulation and flocculation, reverse osmosis, oxidation or ozonation, and adsorption are some standard methods to remove dyes from water.3,4 Among these, adsorption is simple, versatile, consumes low energy, and is cost-effective. Adsorption of reactive dyes with activated carbon is very efficient but expensive, and the adsorbent is regenerated with great difficulty after use.5
Wastewater treatment with adsorbents is simple. However, this effective process only transfers contaminants from one phase to another. A post-process, such as chemical desorption, is required to eliminate toxic organic pollutants from affecting the environment indirectly. Alternatively, a more environment-friendly wastewater treatment method should be developed to remove organic compounds. Photocatalytic degradation breaks down organic compounds by oxidation in the presence of light6 and typical photocatalysts such as titanium dioxide (TiO2) and zinc oxide (ZnO) particles.7 These particles are thermally and chemically stable.8 The ZnO particles absorb higher in the UVA range of UV radiation than TiO2 particles.9 These photocatalyst particles are generally used in powder form. The discharge of particles into natural water resources raises environmental concerns. A separation process to collect the used photocatalyst particles suspended in treated wastewater adds expense and difficulty. This practical problem can be solved by fixing the photocatalyst particles on various substrates that facilitate retrieval and ensure the reusability of the photocatalyst particles.10,11
Researchers have recently developed less expensive alternatives to activated carbon sorbents. For example, chitosan is a promising alternative adsorbent material. It is the second most abundant natural polymer and is biocompatible, biodegradable, polyfunctional, and hydrophilic.12 However, chitosan is unstable in acidic conditions, and its poor mechanical stability limits its suitability in specific applications. Chitosan can overcome these disadvantages by cross-linking or compositing with inorganic materials. Stable chitosan hydrogels cross-linked with sodium citrate (CIT) exhibited a high adsorption capacity of 2066 mg g−1 toward reactive black 5.13 The mechanical and adsorption performances of cellulose nanofibers14 and chitosan15,16 have been enhanced by introducing zeolitic imidazolate framework-8 (ZIF-8), a sub-class of porous metal–organic frameworks (MOFs).
In the present study, ZIF-8 was synthesized via a green method. It was characterized and later used to fabricate composite beads for adsorbing reactive red 141 dye (RR141). Chitosan formed the polymer matrix, and trisodium citrate dihydrate (CIT) served as the ionic crosslinker. The adsorption capacity of these composite beads for the RR141 dye was compared with that of pristine chitosan and cross-linked chitosan beads. The effects of ZIF-8 concentration, contact time, pH, adsorbent dose, and initial dye concentration on RR141 adsorption were investigated. Adsorption kinetics and isotherms were discussed. The adsorption performances of the composite beads toward both cationic and anionic dye models were further explored. The utilization of chitosan/ZIF-8 composite beads was expanded by covering the ZnO heterogeneous photocatalyst particles coated with a thin layer of silica (SiO2) shell on the outer surface of the composite beads. The efficiency of ZnO/chitosan/ZIF-8 composite beads for photocatalytic dye degradation was then systematically studied under UV irradiation. To the best of our knowledge, this is the first report on utilizing lightweight ZnO-coated chitosan composite beads as a simultaneous adsorbent-photocatalyst for dye removal and degradation to overcome the limitations of practical wastewater treatment.
2. Experimental
2.1 Materials
Zinc nitrate hexahydrate (Zn(NO3)2·6H2O, 99%) and acetic acid (>99.9%) were supplied by CARLO ERBA Reagents (Italy). Chitosan (molecular weight: 50![[thin space (1/6-em)]](https://www.rsc.org/images/entities/char_2009.gif) 000–190000 Da, 75–85% deacetylated), 2-methylimidazole (Hmim, 99%), zinc oxide (ZnO, 99.0%), tetraethyl orthosilicate (TEOS, 99.0%), reactive orange (RO), direct yellow (DY), and reactive black (RB) were procured from Sigma-Aldrich (USA). Cobalt(II) nitrate hexahydrate was obtained from Guangdong Guanghua Chemical Factory Co. Ltd (China). Sodium hydroxide (NaOH, 99%) was obtained from Ajax Finechem (Australia). Trisodium citrate dihydrate (CIT, 99%), methanol (99.9%), and ethanol (99.9%) were procured from RCI Labscan (Thailand). Reactive red 141 (RR141) was obtained from DyStar Singapore Ltd (Singapore). Methylene blue (MB, 95%), crystal violet (CV, 88%), and Congo red (CR) were purchased from Loba Chemie Ltd (India). Rhodamine B (RhB) was obtained from UNILAB (United Laboratories, Philippines). Ammonium hydroxide solution (NH4OH, 25%) was procured from EMSURE (Germany). All chemicals were used as received.
000–190000 Da, 75–85% deacetylated), 2-methylimidazole (Hmim, 99%), zinc oxide (ZnO, 99.0%), tetraethyl orthosilicate (TEOS, 99.0%), reactive orange (RO), direct yellow (DY), and reactive black (RB) were procured from Sigma-Aldrich (USA). Cobalt(II) nitrate hexahydrate was obtained from Guangdong Guanghua Chemical Factory Co. Ltd (China). Sodium hydroxide (NaOH, 99%) was obtained from Ajax Finechem (Australia). Trisodium citrate dihydrate (CIT, 99%), methanol (99.9%), and ethanol (99.9%) were procured from RCI Labscan (Thailand). Reactive red 141 (RR141) was obtained from DyStar Singapore Ltd (Singapore). Methylene blue (MB, 95%), crystal violet (CV, 88%), and Congo red (CR) were purchased from Loba Chemie Ltd (India). Rhodamine B (RhB) was obtained from UNILAB (United Laboratories, Philippines). Ammonium hydroxide solution (NH4OH, 25%) was procured from EMSURE (Germany). All chemicals were used as received.
2.2 Synthesis of ZIF-8
ZIF-8 was synthesized following a reported procedure.17 First, 8.50 g of Hmim was dissolved in 100 mL of ethanol–methanol mixture (1:1 volumetric ratio). A solution of 4.20 g Zn(NO3)2·6H2O was prepared in another 100 mL of ethanol–methanol mixture (1:1 volumetric ratio). Later, the two solutions were mixed and stirred for 4 h at room temperature and then centrifuged. The resulting solid was thoroughly washed with methanol and hexane before drying at 60 °C for 24 h.
2.3 Preparation of various types of chitosan beads
Chitosan beads (CS) were prepared as follows. First, 2 g of chitosan was dissolved in 100 mL of 1% (v/v) acetic acid solution. The solution was stirred at room temperature for 2 h and then injected dropwise into a 1.25 M NaOH solution with a syringe. The drops solidified to form beads. These beads were thoroughly washed with water and freeze-dried. Chitosan beads cross-linked with CIT (CS + CIT) were prepared similarly, with slight modifications. Briefly, 2 g of chitosan was dissolved in an acetic acid solution and dropped into an aqueous solution of 1.25 M NaOH and 0.1 M CIT. The obtained beads were washed with water and freeze-dried. The chitosan/ZIF-8 composite beads were prepared by adding various amounts of ZIF-8 (2.5, 5, 7.5, or 10% by weight of chitosan) to the chitosan solution. The mixture was stirred and dropped into a solution of 1.25 M NaOH and 0.1 M CIT. The obtained composite beads were referred to as CS + CIT + x% ZIF, where x is 2.5, 5, 7.5, or 10.2.4 Synthesis of ZnO/chitosan/ZIF-8 composite beads
Following our previous work, ZnO photocatalyst particles were first coated with a thin layer of silica (SiO2).18 Briefly, 5 g of ZnO particles were suspended in 200 mL of ethanol for 30 min at room temperature. Then, 6.4 mL of ammonium hydroxide was added. This was followed by the dropwise addition of 6.4 mL of TEOS. The reaction continued for 6 h at 60 °C. The modified ZnO particles were collected by centrifugation and dried to constant weight at 60 °C. Subsequently, the particles were dispersed in water at 0.1 g per 20 mL by ultrasonication for 30 min. Next, 0.1 g of chitosan/ZIF composite beads at pre-swelling equilibrium were added to the ZnO suspension. The mixture was gently shaken at 150 rpm at room temperature for 24 h, and the beads were washed with water. Photocatalytic properties were studied without drying the beads.2.5 Batch adsorption experiment
A batch experiment was used to determine the adsorption capacity of various chitosan beads toward RR141 and other dyes. Cationic dyes included RhB, CV, and MB, and anionic dyes included RB, RO, DY, and CR.The adsorption kinetics study was performed using an initial RR141 concentration of 50 mg L−1. The dose was 0.05 g per 10 mL, and the temperature was 25 °C. A sample solution was withdrawn at the desired contact time between 0–180 min. The final concentration of the dye remaining in the solution was measured by UV-vis spectrophotometry at the specific maximum wavelength of each dye model.
The effect of the initial solution pH on the adsorption capacity was investigated from pH 4 to 8. The pH of the above RR141 solution was 6. The pH of the solution was adjusted with 0.1 M NaOH or 0.1 M HCl solution. The adsorption conditions included an initial RR141 concentration of 50 mg L−1, a dose of 0.05 g per 10 mL, a temperature of 25 °C, and a contact time of 2 h.
The adsorbent dose experiment was performed with various bead doses ranging from 0.05 to 0.15 g. The standard experimental parameters included an initial RR141 concentration of 50 mg L−1, a solution volume of 10 mL, a temperature of 25 °C, a contact time of 2 h, and a solution pH of 4.
The effect of initial RR141 concentration on the adsorption behavior and adsorption isotherm was evaluated at the dose of 0.15 g per 10 mL. The temperature was 25 °C, the contact time was 2 h, and the solution pH was 4. The initial concentration ranged from 25 to 1000 mg L−1.
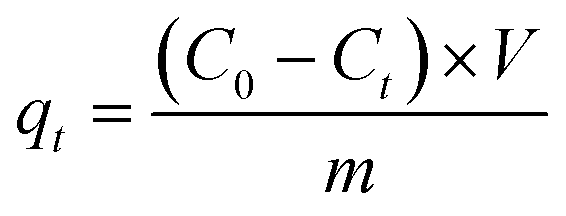
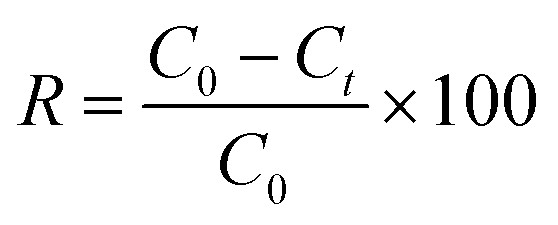
The amount of the dye adsorbed at different times (qt, mg g−1) and removal efficiency (R, %) were calculated as follows:
 | (1) |
 | (2) |
2.6 Characterization
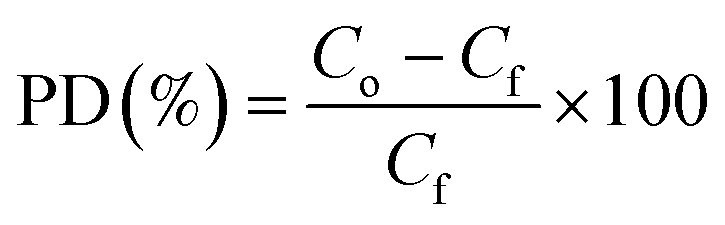
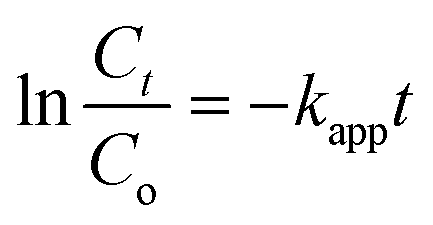
Attenuated total reflection Fourier transform infrared (ATR-FTIR) spectra were acquired between 4000 and 600 cm−1 on a Bruker Tensor 27 FT-IR Spectrometer (Bruker, Germany) using the Bruker OPUS 7.0 software. The morphology of ZIF-8 was examined on a Scanning electron microscope (SNE-4500M High-resolution SEM, SEC Co. Ltd, South Korea). The chemical composition on the surface of the ZnO/chitosan/ZIF-8 composite beads was determined using SEM (FEI Quanta 400 ESEM, FEI Company, USA) coupled with energy-dispersive X-ray spectroscopy (EDS). The crystallinity of ZIF-8 and the composite beads was determined using X-ray diffractometry (XRD, EMPYREAN, Malvern Panalytical, United Kingdom). The diffraction angle (2θ) was scanned from 5 to 80° at a rate of 0.010 min−1 with CuKα radiation at 1.54 nm. The surface areas of ZIF-8, CS + CIT beads, and CS + CIT + 2.5% ZIF beads, and the nitrogen adsorption isotherm, were investigated on a pore size distribution analyzer (BELSORP-miniX, MicrotracBEL Corp., Japan). The thermal stability of the composite beads in the temperature range of 33–650 °C with a ramp rate of 10 °C min−1 under nitrogen gas was determined by thermogravimetric-differential thermal analysis (TG-DTA, STA7200, Hitachi, Japan). Leaching behavior of Zn ion from free ZnO/SiO2 particles was assessed using inductively coupled plasma optical emission spectroscopy (ICP-OES, Avio 500, PerkinElmer, USA). Photocatalytic degradation (PD) was studied by placing a vial containing the dye solution (Co = 5 mg L−1) and ZnO/chitosan/ZIF-8 composite beads (dose = 0.006 g per 10 mL) in the dark for 2 h and then under UV-lamps (light intensity = 1.5 mW cm−2) for 5 h. The final concentration of the dye remaining in the solution was measured by UV-vis spectrophotometry (Agilent 8453, USA). The PD percentage was calculated using eqn (3), and the pseudo-first-order kinetics were plotted according to eqn (4) as follows:
 | (3) |
 | (4) |
3. Results and discussions
3.1 Characterization of ZIF-8
ZIF-8 was synthesized via a green route from zinc nitrate and Hmim, following a reported procedure.19 White crystals were produced with a yield of 36%. The chemical structure of ZIF-8 and a photograph of the obtained ZIF-8 crystals are described in Fig. S1(a) and (b),† respectively.FTIR and XRD analysis confirmed the successful synthesis of ZIF-8. The synthesized ZIF-8 exhibited the absorption bands of the functional group of imidazole units. The FTIR spectrum of ZIF-8 showed absorption bands corresponding to the C–H stretching vibrations of the methyl group and the imidazole ring at 3130 and 2925 cm−1, respectively (Fig. S1(a)†). In-plane bending vibrations of the imidazole ring were detected at 1302, 1144, and 998 cm−1.20 The band at 1580 cm−1 was related to C![[double bond, length as m-dash]](https://www.rsc.org/images/entities/char_e001.gif) N stretching. The –CH3 bending resulted in the band at 1423 cm−1. The in-plane C–N stretching contributed to the band at 1185 cm−1.21 The out-of-plane bending of the imidazole ring was represented by bands at 754 and 685 cm−1.22
N stretching. The –CH3 bending resulted in the band at 1423 cm−1. The in-plane C–N stretching contributed to the band at 1185 cm−1.21 The out-of-plane bending of the imidazole ring was represented by bands at 754 and 685 cm−1.22
The XRD pattern of ZIF-8 presented strong peaks at 2θ values of 7.3, 10.4, 12.7, 14.8, 16.4, and 18.0° that corresponded to (011), (002), (112), (022), (013), and (222), respectively (Fig. S1(b)†).21 A very sharp peak with 2θ value of 7.3° on the XRD pattern indicated that a highly crystalline material was achieved. In addition, the overall XRD patterns were in good agreement with the theoretical patterns from the single crystal data.20
The morphology of ZIF-8 was investigated using SEM (Fig. S2†). The morphology of the ZIF-8 particles was a polyhedral shape. The average particle size of ZIF-8 was 270 ± 33 nm. The porosity of ZIF particles was determined by the nitrogen adsorption/desorption isotherm at 77 K. A reversible type I isotherm was produced (Fig. S3†), indicating a microporous material. The average BET-specific surface area of ZIF-8 was 1184 m2 g−1. The obtained value agreed with the reported value.23 The micropore volume was 0.418 cm3 g−1.
3.2 Characterization of chitosan-based beads
Pale yellow beads were obtained for all compositions. A vernier caliper determined the average diameter as 1.8 mm. The SEM micrograph of CS + CIT + 2.5% ZIF composite beads showed a rough surface (Fig. 1(a)). The FTIR spectra of (I) CS beads showed a characteristic C–O bond stretching at 946, 1064, and 1315 cm−1, and C–O–C bonds at 1020 cm−1 (Fig. 1(b)).24 A shift in the N–H bond (I-order amine) from 1657 to 1651 cm−1 indicated the ionic interaction between (II) chitosan and CIT.13 The band intensity of the CS + CIT beads was higher at 1577 cm−1 compared to CS beads due to the –COO– group of CIT.25 Moreover, the intensity of this band increased upon increasing the ZIF-8 content because of the CN stretching in imidazole (III–VI). The stretching vibrations at around 2868 and 2923 cm−1 indicate the remaining C–H aliphatic bonds in the chitosan structure after the deacetylation procedure.26 Moreover, a broad band centered around 3300 cm−1 is related to the –OH and N–H functional groups in chitosan.27
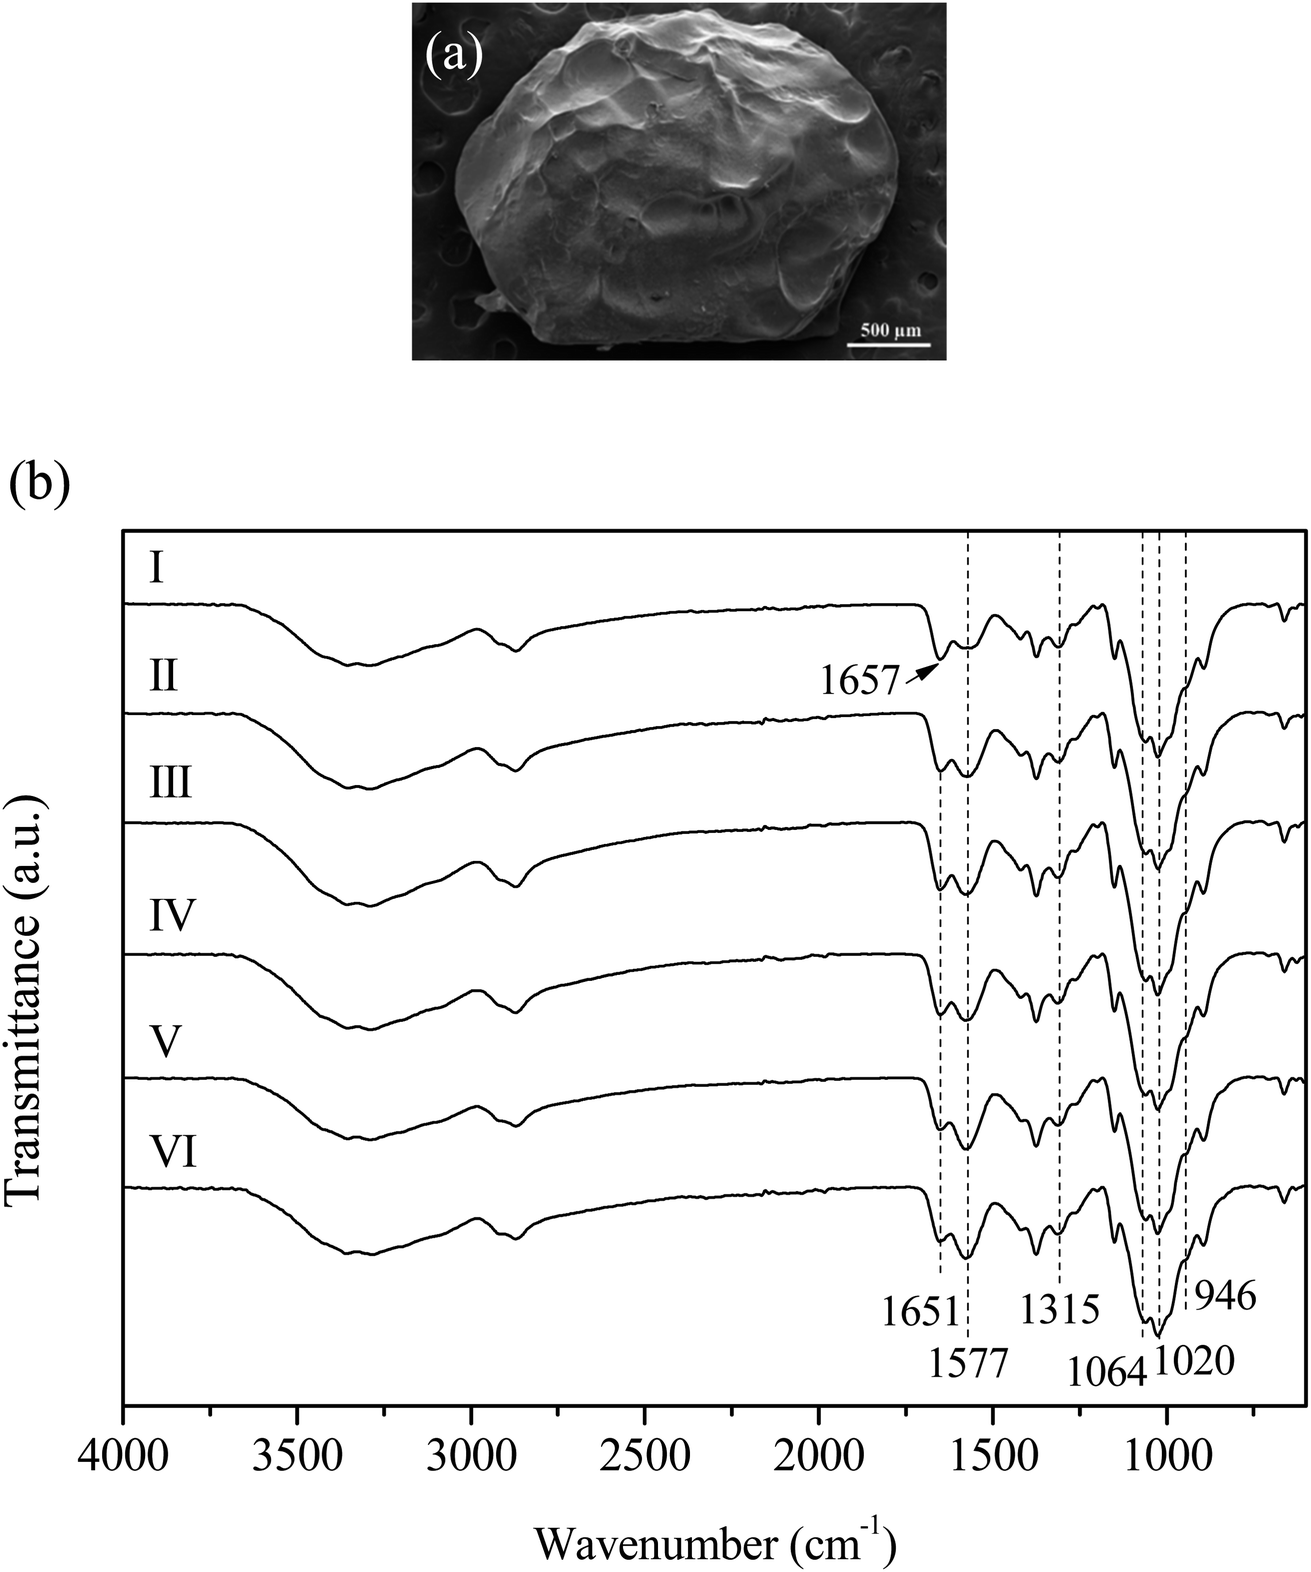 | ||
| Fig. 1 (a) SEM micrograph of CS + CIT + 2.5% ZIF. (b) FTIR spectra of (I) CS, (II) CS + CIT, (III) CS + CIT + 2.5% ZIF, (IV) CS + CIT + 5% ZIF, (V) CS + CIT + 7.5% ZIF, and (VI) CS + CIT + 10% ZIF beads. | ||
3.3 Effect of cross-linking on ZIF-8
The adsorption of RR141 on CS, CS + CIT, and CS + CIT + x% ZIF beads was compared (Fig. 2). The higher adsorption capacity of the CS + CIT beads compared to the CS beads was probably due to the increased capacity for ion exchange. Previous work suggested that a part of the cross-linking agent in the outer layers of the chitosan beads gets transferred to the reactive black 5 dye molecules during sorption.13 The addition of ZIF-8 to the cross-linked chitosan beads further improves the adsorption capacity and removal efficiency. In the present study, the effect of increasing ZIF-8 content on RR141 adsorption was insignificant. The optimum ZIF-8 loading was 2.5%, which produced an adsorption capacity of 2.31 mg g−1 and a removal efficiency of 23.3. Photographs of CS + CIT + 2.5% ZIF-8 beads before and after RR141 adsorption are presented in Fig. 2. The average BET-specific surface areas of CS + CIT beads, and CS + CIT + 2.5% ZIF-8 beads were 0.3, and 1.8 m2 g−1, respectively. The addition of ZIF-8 did not remarkably increase the surface area of CS + CIT beads. Therefore, the electrostatic interaction and π–π stacking between ZIF-8 and RR141 are possibly responsible for this improvement.28,29 Previous studies demonstrated that ZIF-8 adsorbed heavy metals,30 chloroform, dimethylformamide, methanol,31 RhB,14 malachite green,16 and CR.15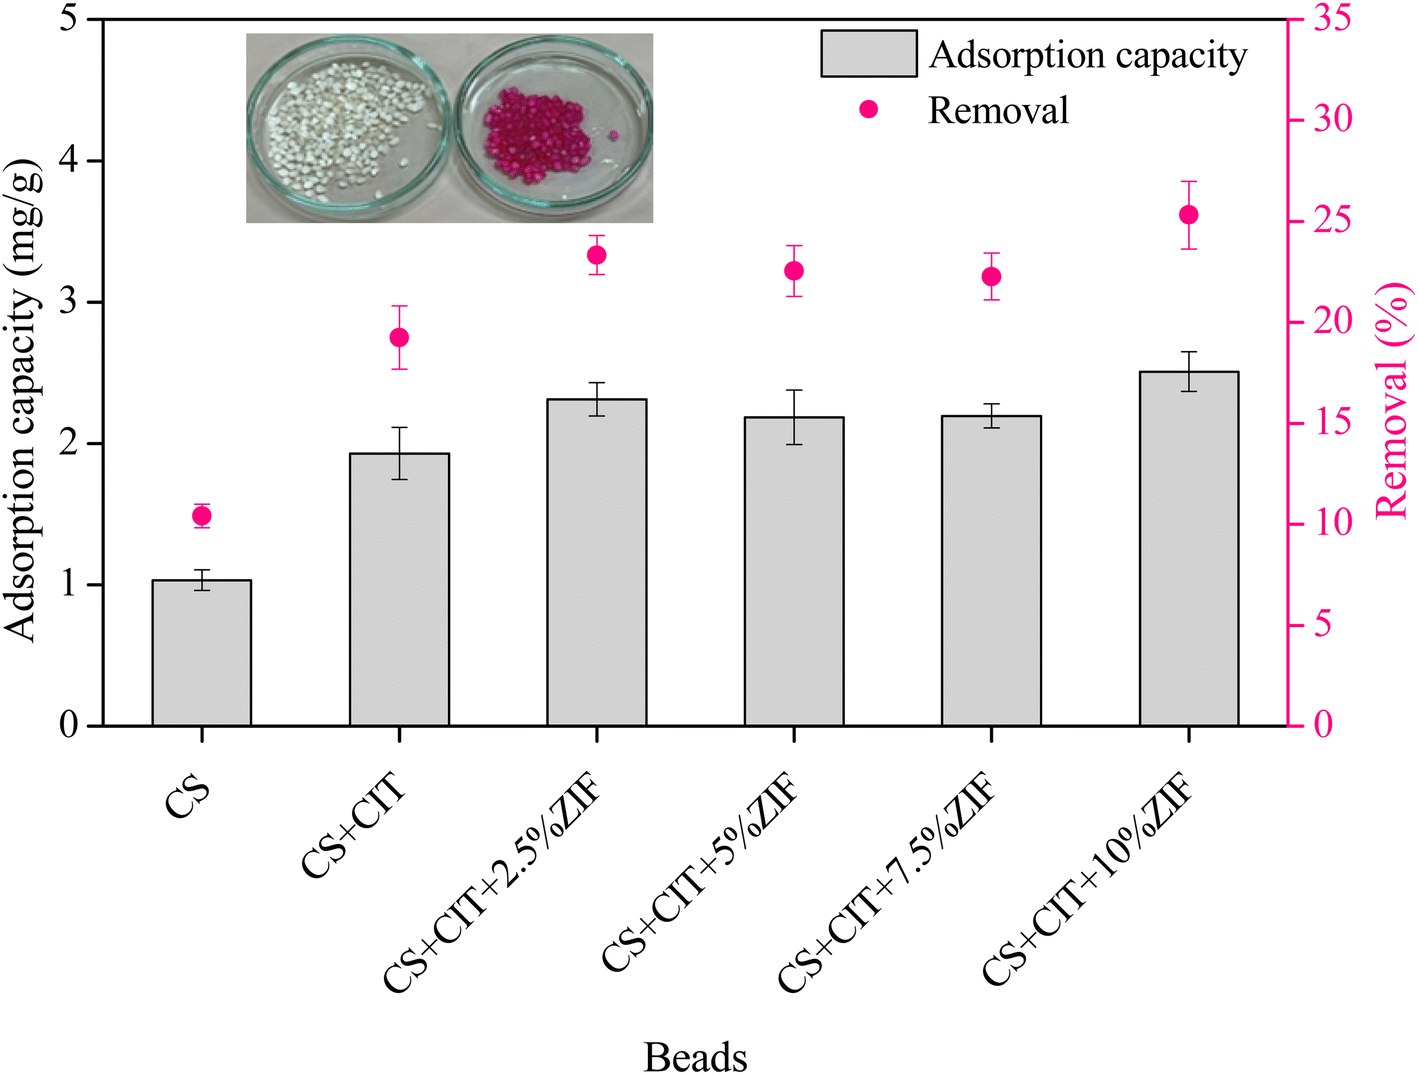 | ||
| Fig. 2 Adsorption capacities and removal efficiencies of chitosan beads (CS), cross-linked chitosan beads (CS + CIT), and composite cross-linked chitosan beads comprising various loadings of ZIF-8 (CS + CIT + x% ZIF). (Co = 50 mg L−1, dose = 0.05 g per 10 mL, T = 25 °C, contact time = 2 h). | ||
3.4 Effect of contact time and adsorption kinetics
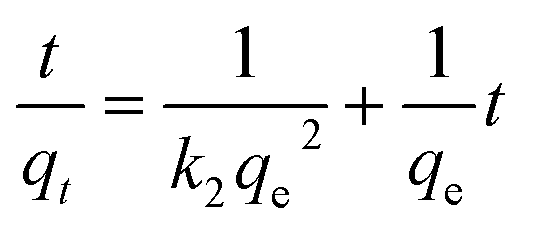
The kinetics and mechanism of adsorption of RR141 on CS + CIT + 2.5% ZIF beads were investigated over a period of 180 min. Adsorption equilibrium was reached after about 120 min (Fig. 3(a)). The kinetics of adsorption was determined by fitting the experimental data to the pseudo-first-order (PFO) and pseudo-second-order (PSO) models, as expressed in eqn (5) and (6), respectively.|
ln(qe − qt) = lnqe − k1t
| (5) |
 | (6) |
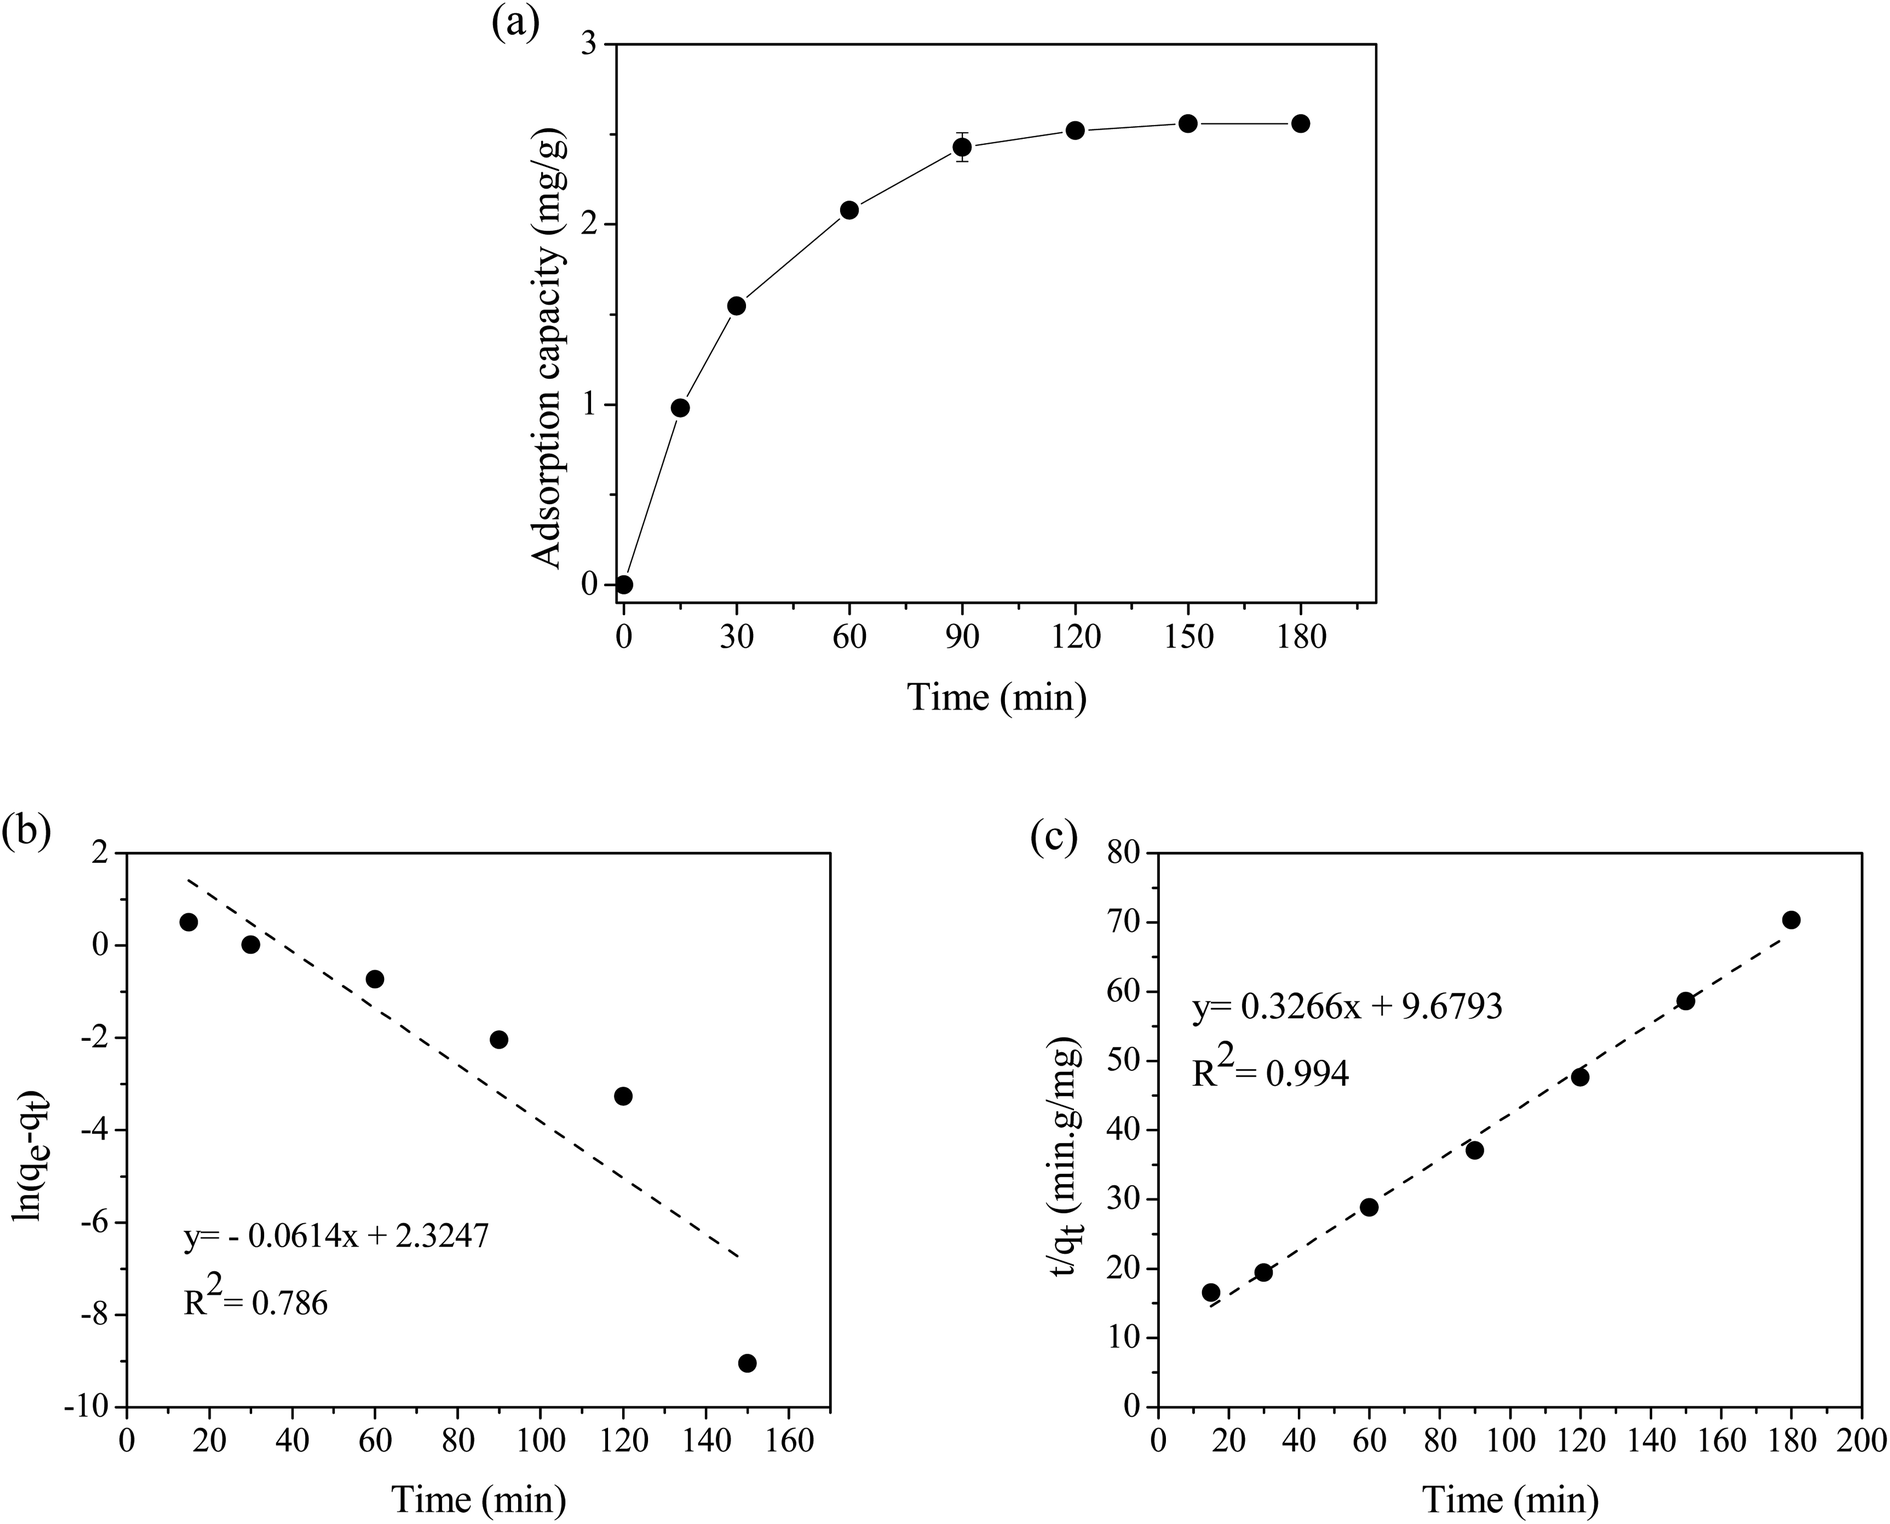 | ||
| Fig. 3 (a) Adsorption capacities of the CS + CIT + 2.5% ZIF beads for RR141 (Co = 50 mg L−1, dose = 0.05 g per 10 mL, T = 25 °C) at various contact times, (b) pseudo-first-order linear fitting and (c) pseudo-second-order linear fitting. | ||
After fitting the experimental data to the PSO model, the obtained R2 value was very close to 1; this was much higher than that yielded by the PFO model (Fig. 3(b and c)). Therefore, the PSO model was more appropriate, and the adsorption process of RR141 on the composite chitosan beads was primarily controlled by chemisorption. Moreover, the qe value calculated according to the PSO model was consistent with the experiment value (Table 1).
| Kinetic parameters | ||
|---|---|---|
| Experiment | qe, exp (mg g−1) | 2.56 |
| Pseudo-first-order | qe, cal (mg g−1) | 10.2 |
| k1 (min−1) | 6.14 × 10⁻² | |
| R2 | 0.786 | |
| Pseudo-second-order | qe, cal (mg g−1) | 3.06 |
| k2 (g mg−1 min−1) | 1.10 × 10⁻² | |
| R2 | 0.994 | |
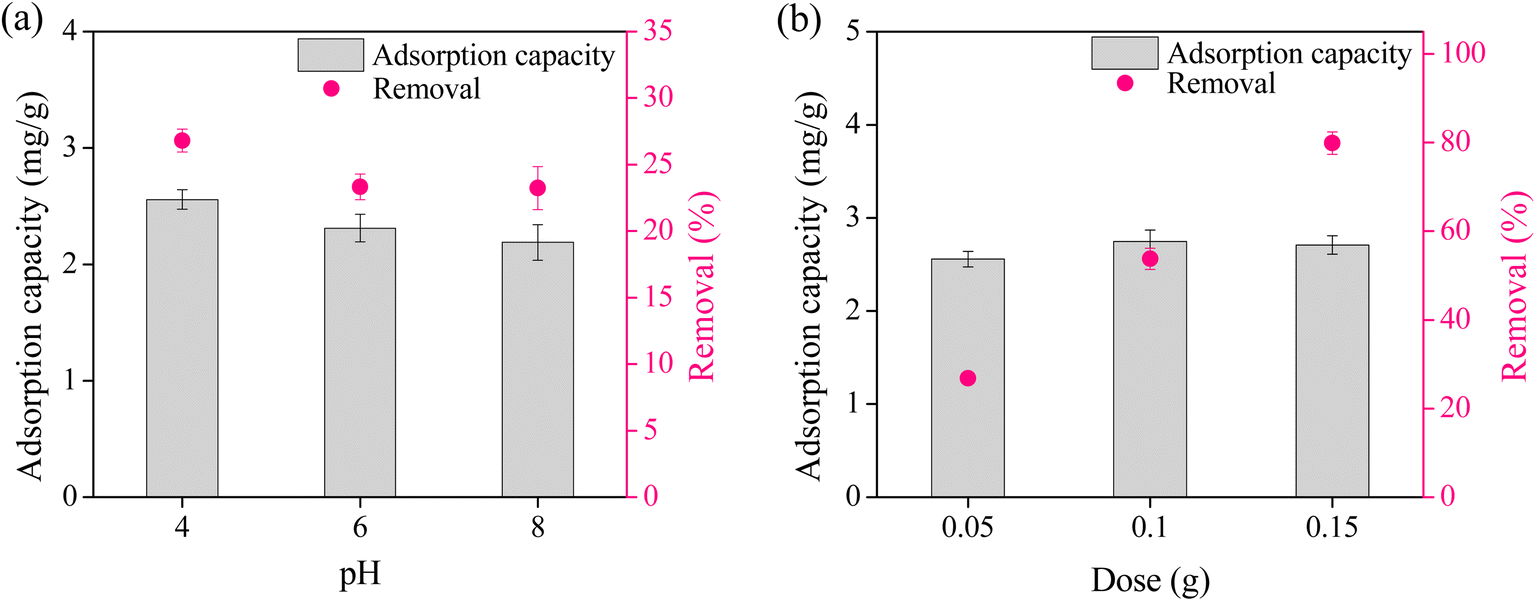
3.5 Effect of pH
The point of zero charge (pHPZC) for CS + CIT + 2.5% ZIF was 7.46, indicating that the composite bead surface was negatively charged at pH > pHPZC. The pH of the RR141 solution significantly affected the adsorption capacity of the CS + CIT + 2.5% ZIF (Fig. 4(a)). At pH 4, the chitosan amino group on the surface of the beads was protonated (–NH3+) and, therefore, positively charged. This group electrostatically attracted the negative sulfonate groups (–SO3−) of RR141 molecules (eqn (7)), maximizing the removal efficiency.33 When the solution pH was adjusted to 6, surface protonation and the adsorption capacity decreased. When the pH was above the pHPZC of CS + CIT + 2.5% ZIF (pH 8), the surface charge of CS + CIT + 2.5% ZIF was highly negative. This caused electrostatic repulsion for the RR141 molecules, thus, decreasing the adsorption capacity.34,35 Furthermore, free –OH in the basic solution caused a screening effect and competed with RR141 molecules.36 Further studies were then conducted at pH 4.| Chitosan-NH3+ + RR141-SO3− ↔ Chitosan-NH3+⋯SO3−-RR141 | (7) |
 | ||
| Fig. 4 (a) Adsorption capacity and removal efficiency of CS + CIT + 2.5% ZIF beads at various pH values (Co = 50 mg L−1, dose = 0.05 g per 10 mL, T = 25 °C, contact time = 2 h), and (b) adsorption capacity and removal efficiency of CS + CIT + 2.5% ZIF beads at various adsorbent doses (Co = 50 mg L−1, solution = 10 mL, T = 25 °C, contact time = 2 h, pH = 4). | ||
3.6 Effect of the adsorbent dose
The adsorbent dose affected the efficiency of dye removal. At a low dose of 0.05 g per 10 mL of RR141 solution, the removal efficiency at equilibrium was only about 30% (Fig. 4(b)). Upon increasing the amount to 0.10 and 0.15 g per 10 mL, the removal efficiency significantly increased to about 55% and 80%, respectively. The better availability of the active sites to the dye molecules was responsible for the increased removal efficiency. Additional increments in the adsorbent dose did not improve the adsorption capacity. Therefore, further studies were conducted with 0.15 g of CS + CIT + 2.5% ZIF per 10 mL of dye solution.3.7 Effect of initial concentration and adsorption isotherm
At a low initial dye concentration, the number of RR141 molecules in the solution was much lower than the number of free active sites on the surface of the beads. Therefore, the adsorption capacity of the beads was low. When the initial concentration was increased to 500 mg L−1, a steep increase was observed in the adsorption capacity (375%). The strong driving force and high mass transfer of the dye caused this increase (Fig. 5(a)). Consequently, the RR141 molecules diffused to a greater extent in the pores of the beads.37,38 The RR141 molecules in the solution interacted with the many available active sites on the surface of the beads, thus, achieving maximum adsorption. The maximum adsorption capacity obtained under the optimum conditions was 6.51 mg g−1.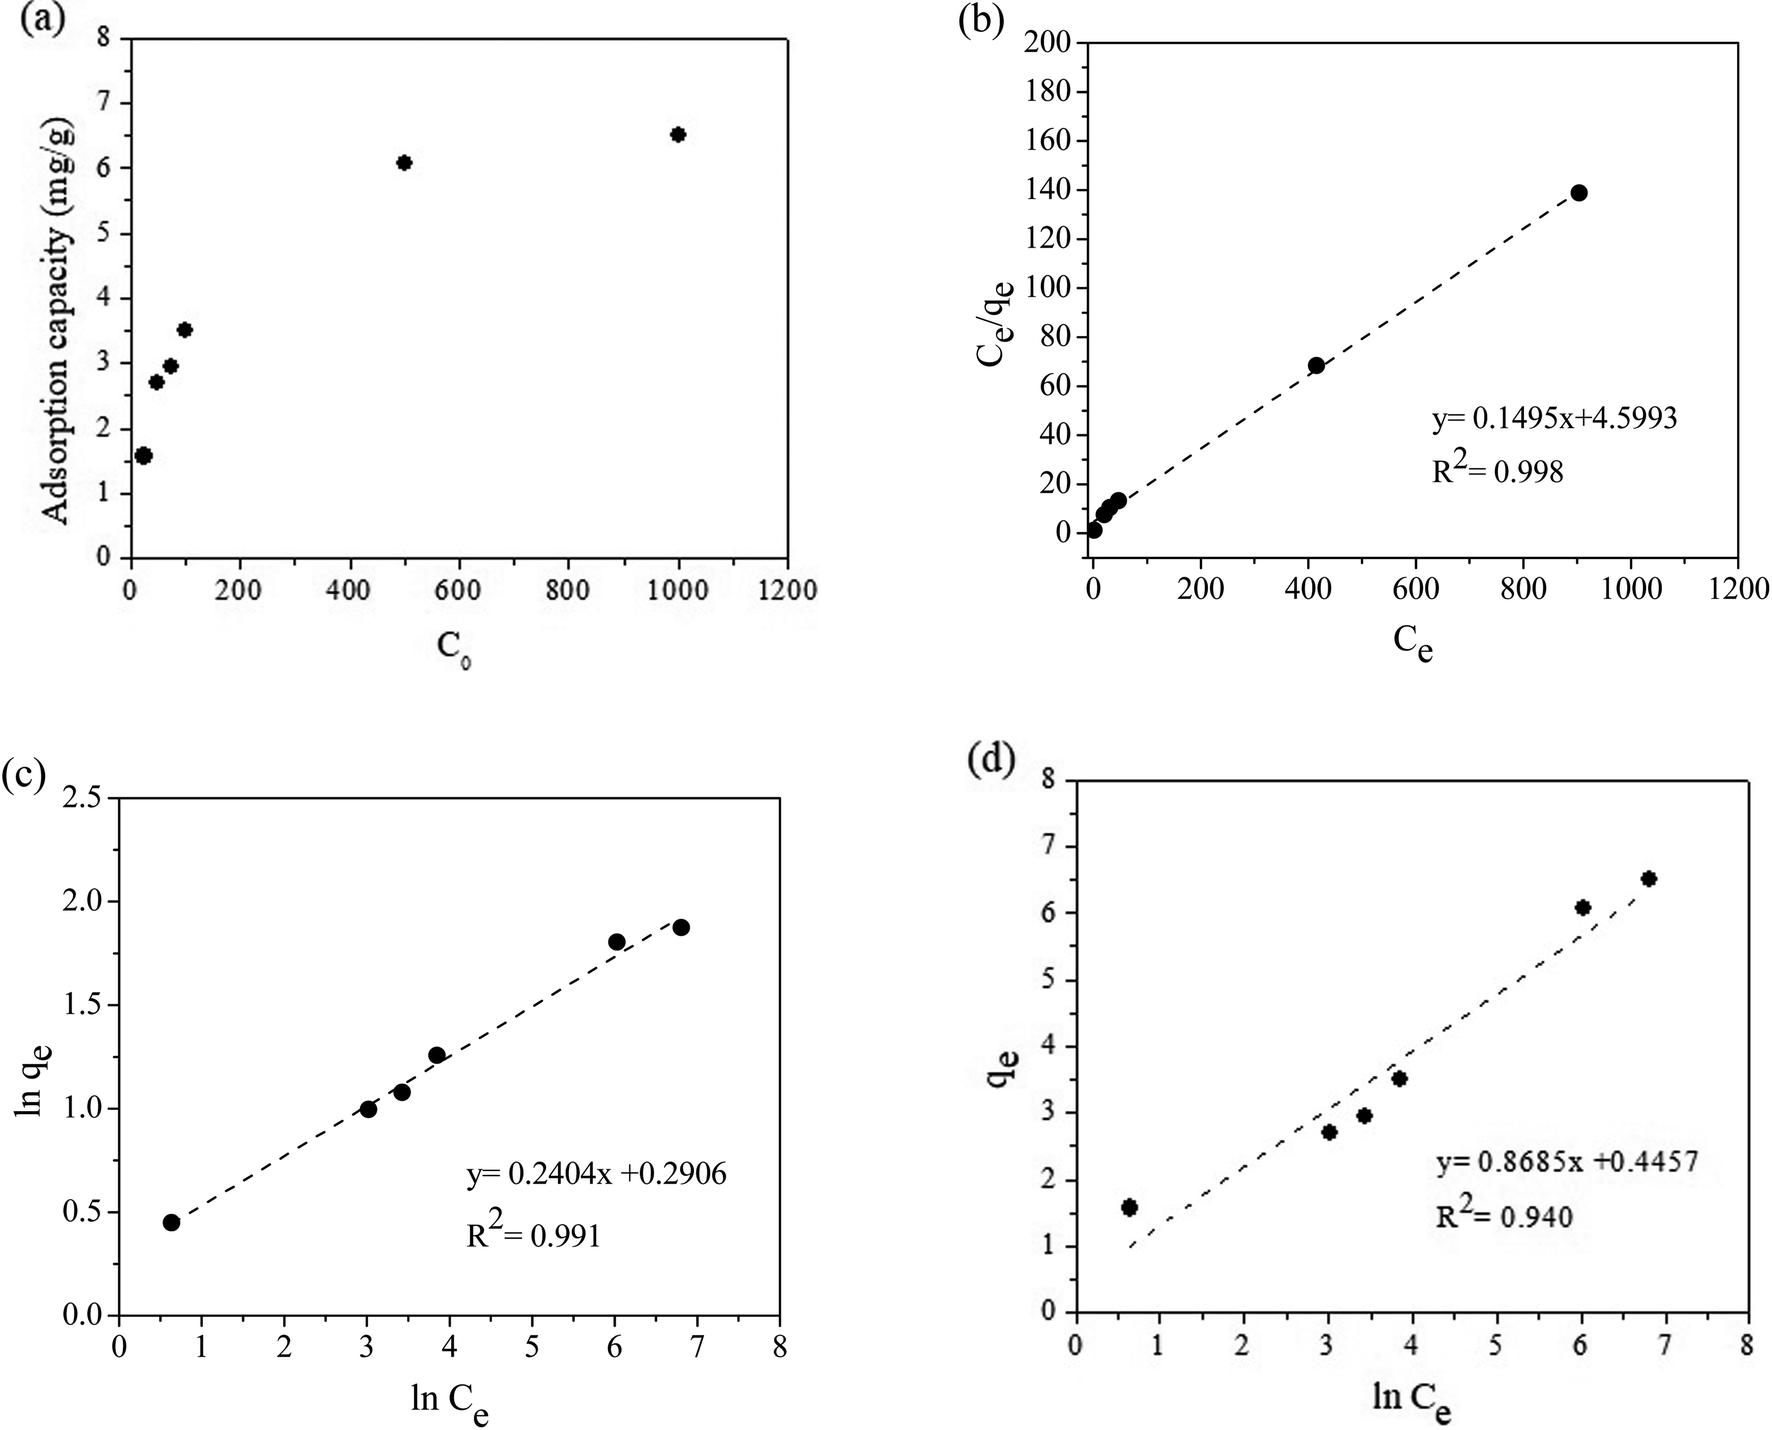 | ||
| Fig. 5 (a) Effect of initial concentration on RR141 adsorption (dose = 0.15 g per 10 mL, T = 25 °C, contact time = 2 h, pH = 4), and linear (b) Langmuir isotherm, (c) Freundlich isotherm, and (d) Temkin isotherm of RR141 adsorption on the proposed chitosan-based composite beads. | ||
The Langmuir, Freundlich, and Temkin isotherm models were applied as shown in eqn (8)–(10), respectively:
 | (8) |
| qe = KFCe1/n | (9) |
|
qe = BlnKT + BlnCe
| (10) |
 ; b is the Temkin isotherm constant; R is the gas constant; T is the temperature (K).
The Langmuir isotherm explains monolayer adsorption on homogeneous surfaces, whereas the Freundlich isotherm describes multilayer adsorption on heterogeneous surfaces.38 The Temkin isotherm assumes that free energy of sorption is a function of surface coverage of adsorbent.39 The plot gave a higher R2 very close to 1 when fitted according to the Langmuir isotherm, suggesting that the adsorption was monolayer on a homogeneous surface (Fig. 5(b–d)). Moreover, the values of qm calculated from the Langmuir equation and the experimental data were close to each other. Experimental and calculated parameters from adsorption studies are presented in Table 2. In addition, the maximum adsorption capacity of the CS + CIT + 2.5% ZIF beads toward RR141 was compared with the performances of various other reported adsorbents (Table 3).
| Adsorbent | qm (mg g−1) | Reference |
|---|---|---|
| Cattail | 1.63 | 42 |
| Water lettuce | 3.56 | 42 |
| Activated carbon | 8.52 | 42 |
| Chitin | 133.00 | 43 |
| Metal hydroxide sludge | 56.18 | 44 |
| Wood-shaving bottom ash | 24.3 | 45 |
| Palm shell powder | 13.95 | 46 |
| Magnetic chitosan | 98.8 | 47 |
| Chitosan-zirconium phosphate nanocomposite | 435.1 | 48 |
| Banana peel | 0.76 | 49 |
| Saw dust | 2.12 | 49 |
| Orange peel | 512 | 49 |
| TiO2 | 5.14 | 49 |
| Cross-linked chitosan/ZIF-8 beads | 6.69 | Present study |
The separation factor, RL, related to the Langmuir model, was also calculated using the following equation:
 | (11) |
The RL value is important. If RL = 0, the adsorption process is irreversible; if 0< RL < 1, the process is favorable; if RL = 1, the process is linear; and if RL > 1, the adsorption is unfavorable.40 The RL value of RR141 adsorption on the CS + CIT + 2.5% ZIF beads was 2.98 × 10⁻². Therefore, the adsorption process was irreversible according to the Langmuir isotherm. The KL value indicates the degree of adsorbate–adsorbent interaction. The small KL suggested a weak interaction between the chitosan-based composite beads and RR141 because the active site only adsorbs one molecule. The value of 1/n, related to the Freundlich model, was 2.40 × 10⁻¹. A value between 0 and 1 indicated that the adsorption process was favorable.41 The small KF value suggested a low adsorption capacity on heterogeneous sites level.
3.8 Types of dye
The adsorption performance of the composite chitosan beads toward other dyes was explored using anionic dyes like RB, CR, DY, and RO and cationic dyes like RhB, CV, and MB dyes. The beads adsorbed anionic dyes more strongly than cationic dyes (Fig. 6(a)). Quantitative adsorption measurements showed 99, 89, 95, and 62% removal of the RB, CR, DY, and RO dyes, and the adsorption capacity values of 10, 9, 10, and 6 mg g−1, respectively. The removal of RhB, CV, and MB dyes was much lower (Fig. 6(b)). The remaining solutions were almost colorless compared with the prepared solutions of RB, CR, DY, and RO. The protonated amine groups (–NH3+) and hydroxyl groups (–OH2+) of chitosan at pH 4 formed favorable electrostatic interactions with the anionic groups (–SO3−) of the dye molecules.50 Moreover, hydrogen bonding between oxygen, nitrogen, and hydrogen atoms on dye molecules and chitosan beads led to the chemisorption between the dye molecules and the active site of the beads (Fig. 7(a)).33 The electrostatic interaction between ZIF-8 and the negative charges of anionic dyes also contributed to this observation.29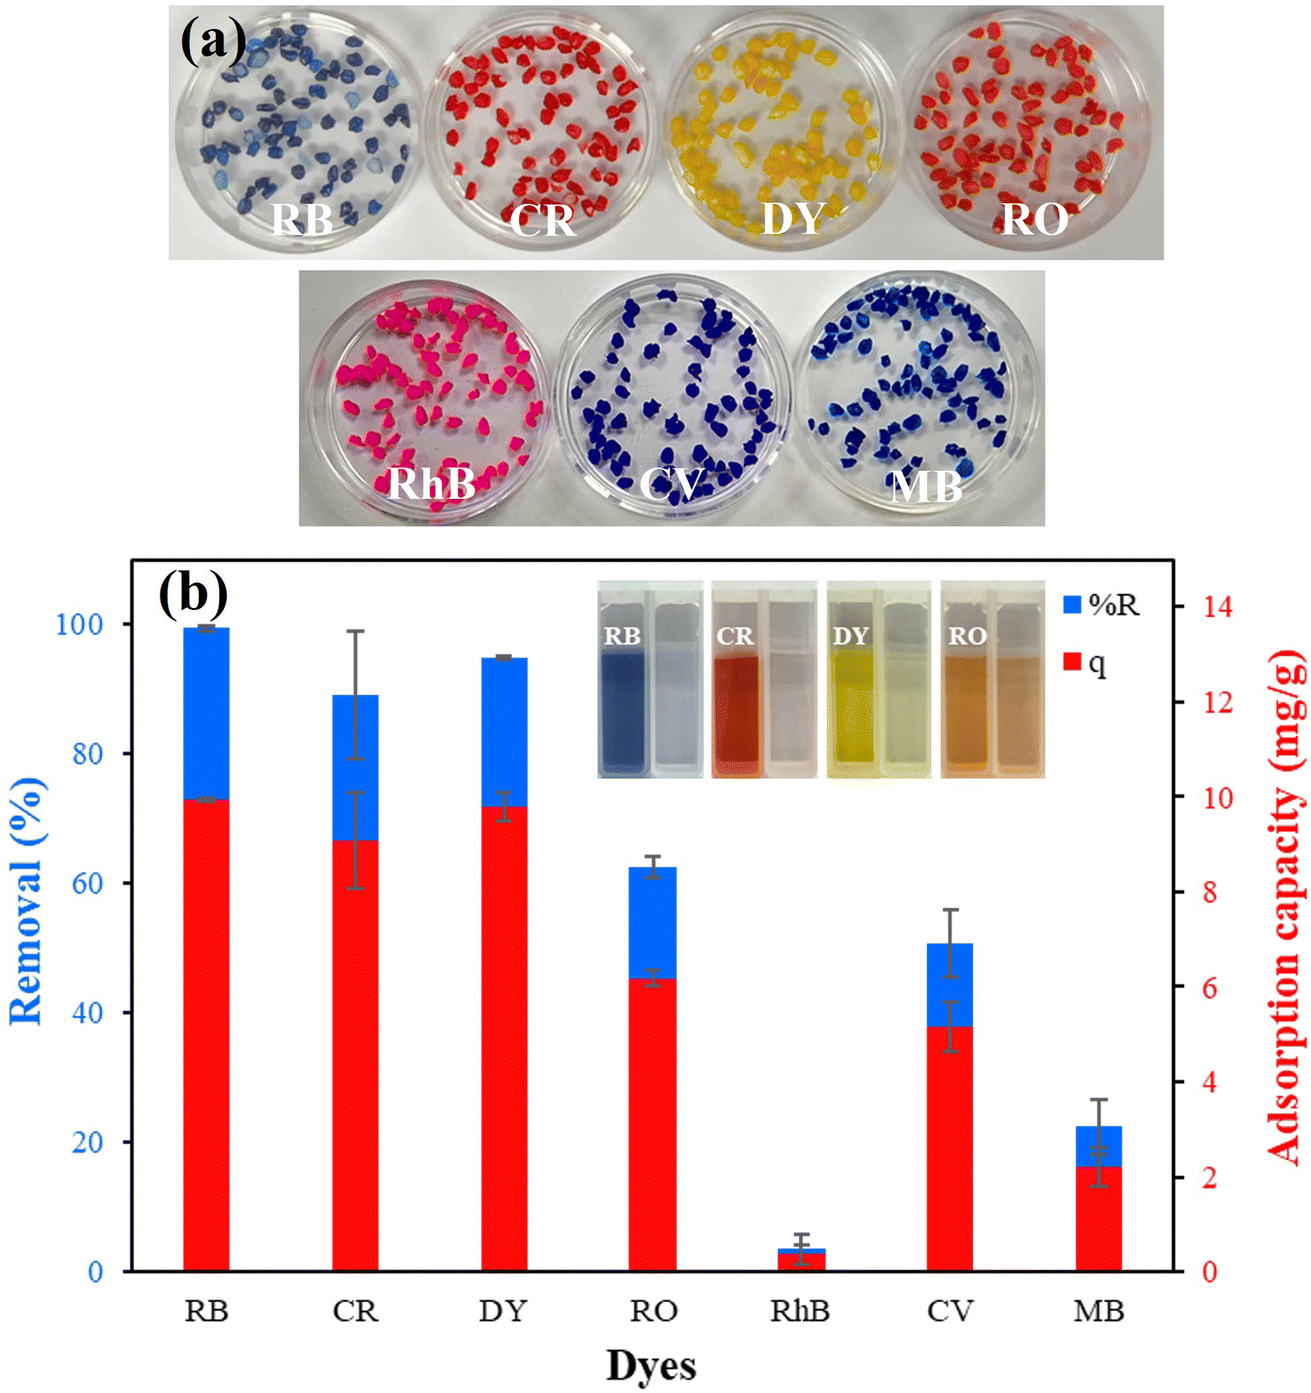 | ||
| Fig. 6 (a) Photographs of CS + CIT + 2.5% ZIF beads after testing the adsorption of reactive black (RB), Congo red (CR), direct yellow (DY), reactive orange (RO), rhodamine B (RhB), crystal violet (CV), and methylene blue (MB), and (b) the removal efficiency and adsorption capacity of CS + CIT + 2.5% ZIF beads toward different types of anionic dyes and (inset) photographs of the anionic solutions before and after adsorption (Co = 50 mg L−1, dose = 0.05 g per 10 mL, T = 25 °C, contact time = 2 h, pH = 4). | ||
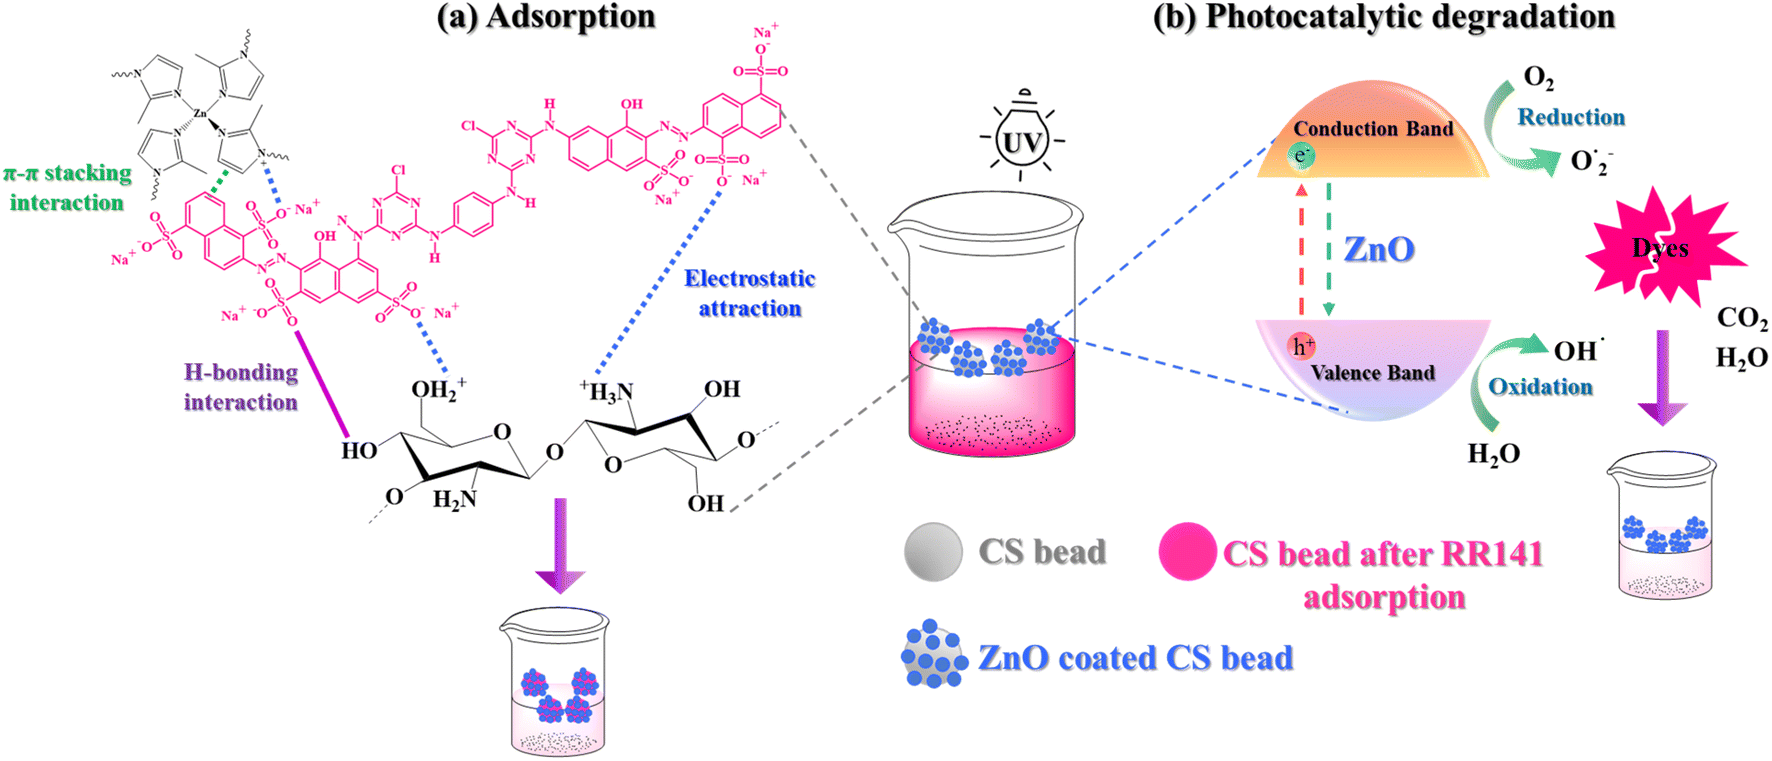 | ||
| Fig. 7 (a) The possible adsorption interactions between ZIF-8 and RR141 and CS + CIT + 2.5% ZIF beads and RR141, and (b) the mechanism of photocatalytic degradation of the dye. | ||
The thermogram of the ZnO/composite beads was slightly different from that of the composite beads between 33 to 650 °C. The surface of the ZnO/composite beads contained more bound water, probably because of the ZnO/SiO2 coating. And the greater weight loss around 100 °C was mainly due to water vaporization (Fig. S4†). At higher temperatures, the polymer backbones were thermally broken (chain scission). Hence, chitosan loses considerable weight.50 However, the onset temperature of the ZnO/composite beads in this range increased from 250 to 275 °C. Therefore, coating the composite beads with ZnO particles increased the thermal stability of the beads. ZnO particles coated with a thin layer of inorganic SiO2 are reportedly very thermally stable.51 In contrast, chitosan polymers get charred at very high temperatures (around 650 °C). Thus, the residual weight of each sample at 650 °C can indicate the ZnO content on the surface of the CS composite beads. The residual weight of the CS + CIT + 2.5% ZIF beads was 26.97%, whereas that of the ZnO/CS + CIT + 2.5% ZIF composite beads was 29.56%. The difference of 2.59% indicated the content of ZnO.
3.9 Photodegradation of ZnO/composite beads
The surface of the ZnO particles was pre-modified with TEOS to produce a thin layer of SiO2 providing silanol groups to couple with the hydroxyl groups on chitosan.52 The ability of the composite beads to support the photocatalytic ZnO particles and bridge the photocatalyst on the bead surface to the dye molecules was investigated. The presence of ZnO particles on the surface of the CS + CIT + 2.5% ZIF beads was confirmed by SEM-EDS mapping. Zn and O components were evenly distributed over the whole surface of the beads (Fig. 8). A weight percent ratio of around 83:17 was identified for C–Zn from the EDS micrographs. The micrographs were recorded at higher magnification to avoid detecting C from the carbon tape (Fig. 9). The ZnO distribution was determined only on the surface of the beads. Hence, this value did not correlate with the ZnO content estimated from the TGA analysis, which was a bulk analysis.
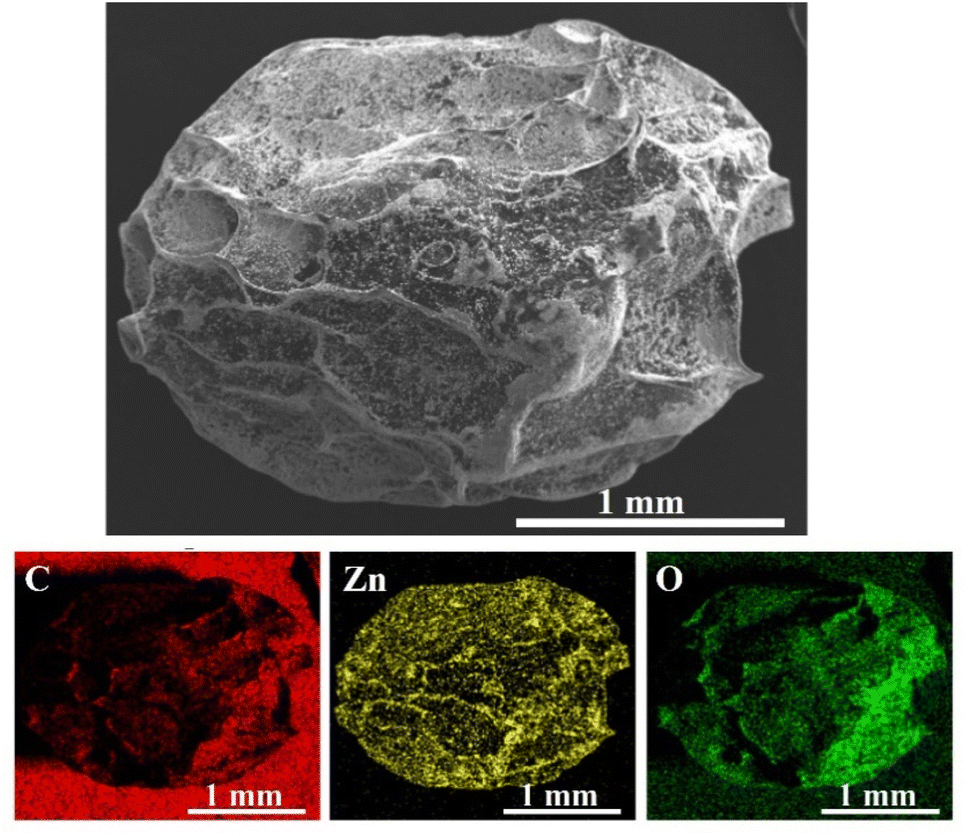 | ||
| Fig. 8 SEM-EDS micrograph and the corresponding elemental mapping of C, Zn, and O of ZnO/CS + CIT + 2.5% ZIF composite bead (magnification 50×). | ||
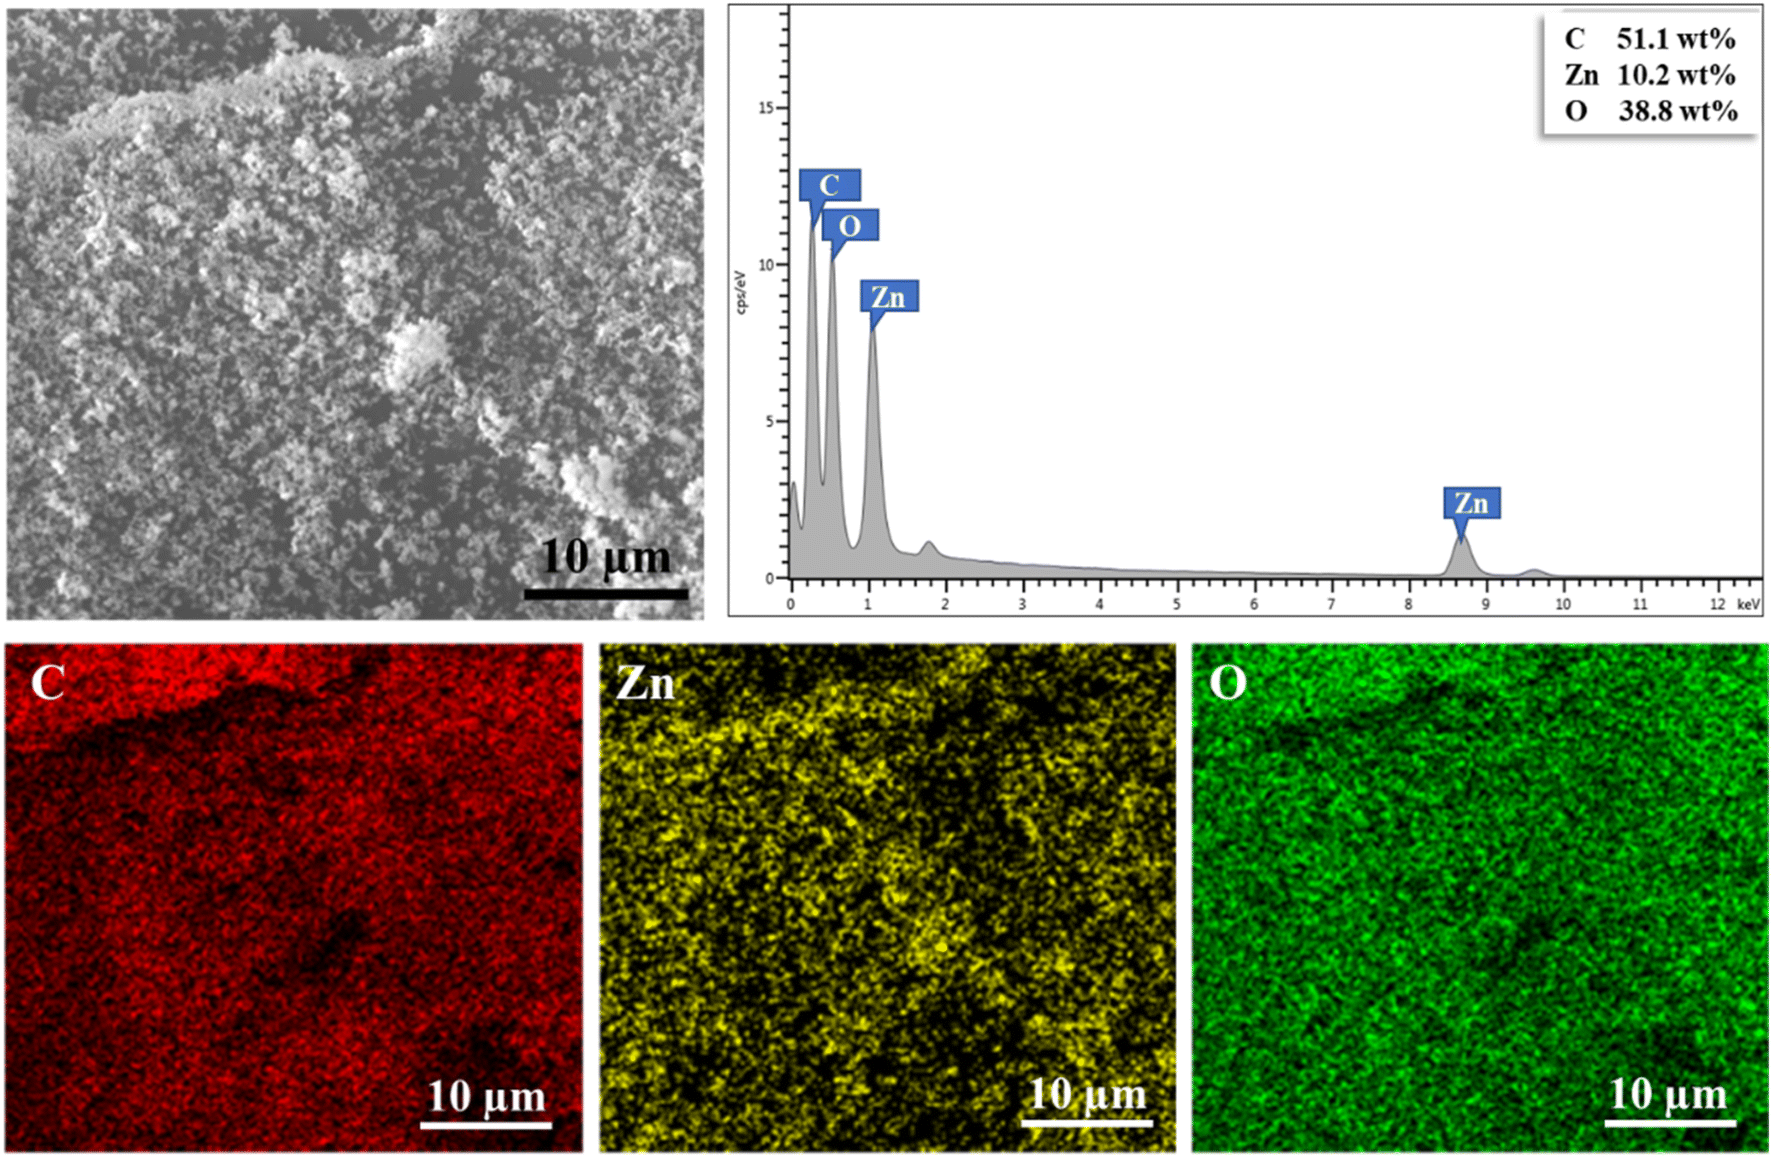 | ||
| Fig. 9 SEM-EDS micrographs showing the surface of the ZnO/CS + CIT + 2.5% ZIF bead, the corresponding EDS spectrum, and the elemental mapping of C, Zn, and O (magnification 3000×). | ||
The photocatalytic degradation (PD) of the RR141 dye on the ZnO/CS + CIT + 2.5% ZIF composite beads was studied under UV irradiation after incubation in the dark for 2 h to reach equilibrium adsorption. The PD percentage was calculated using eqn (3), and the pseudo-first-order kinetics were plotted according to eqn (4).
The color of the MB and RR141 solutions remained almost unchanged when the ZnO photocatalyst or UV irradiation was absent because no photodegradation occurred (Fig. 10(a)). The dye was removed from the solution only by adsorption. In contrast, in the presence of ZnO particles, the color of both dye solutions noticeably changed after 5 h of UV irradiation. The almost complete decolorization of the MB and RR141 solutions proved that the dye was decomposed. The PD efficiency of the other dye models is shown in Fig. 10(b). Thus, the ZnO particles were essential for the PD of the dyes. Also, the composite beads effectively supported the catalyst and provided a synergistic effect between the two materials.53
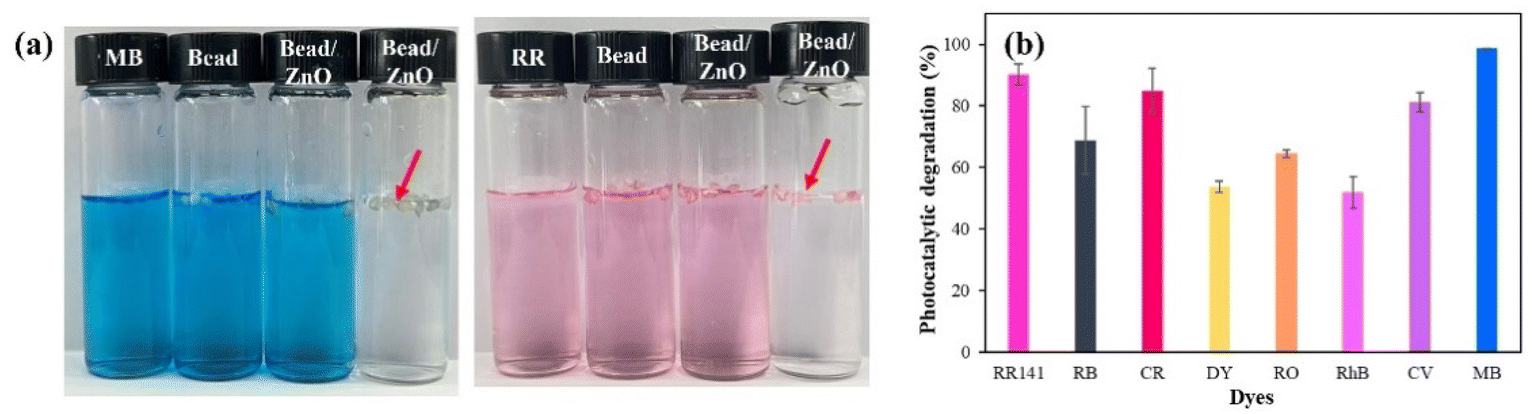 | ||
| Fig. 10 (a) Photographs of MB and RR141 solutions before (left) and after (middle-left) photocatalytic reaction with the CS + CIT + 2.5% ZIF beads and ZnO/CS + CIT + 2.5% ZIF composite beads without and with UV irradiation (middle-right and right); the red arrows indicate the floating beads. (b) The percentage of photocatalytic degradation of various dyes (Co = 5 mg L−1, dose = 0.006 g per 10 mL). | ||
The PD of cationic dyes was much higher than that of anionic dyes, probably due to the lower adsorption of cationic dyes than anionic dyes. The highest % of PD of 98.67% was toward MB. The lower the adsorption, the higher the number of dye molecules remaining in the solution for the PD reaction. In addition, the size of the molecular structure of each dye affected the PD process.11
The mechanism of photocatalytic degradation of dye molecules by ZnO/CS + CIT + 2.5% ZIF composite beads is illustrated in Fig. 7(b). The process is divided into two parts: (1) the adsorption by the beads and (2) the photocatalytic decolorization.53 Under UV irradiation, the electrons on the surface of ZnO possess energy greater than the band gap of ZnO. Hence, they are excited, and photo-excited electrons are generated in the conduction band and holes in the valence band. These electrons and holes subsequently migrate to the surface to react with the oxygen and water molecules and produce superoxide radical anions (O2˙−) and hydroxyl radicals (·OH). The reactive species are efficient oxidizers, decomposing toxic dye molecules into non-toxic final products of H2O, CO2, and other small molecules.54 In addition, the ZnO/CS + CIT + 2.5% ZIF composite beads prepared in this work floated on the surface of the dye solution. This property increased the ease of separating and collecting the photocatalyst after use. Unlike traditional powder photocatalysts, no precipitation, filtration, or centrifugation process was required to recover them.
The absorbance of both dyes at the λmax decreased slightly after adsorption in the dark for 2 h (Fig. 11(a) and (b)) when no UV light was present. Subsequently, increasing the UV exposure time from 1 h to 5 h continuously increased the PD of MB and RR141, as evidenced by a gradual reduction in the absorbance. After 5 h, the peaks of MB and RR141 were very low (especially of MB), indicating almost complete degradation of these dyes. At 5 h, 98.67% (% PD) of MB was photodegraded, while 90.38% (%PD) of RR141 was photodegraded (Fig. 11(c)). The results were fitted to the pseudo-first-order kinetics. The lines were straight with high R2 values, indicating that this heterogeneous photodegradation followed the Langmuir–Hinshelwood kinetic model.55 The slope of the linear plot indicated 0.6032 h−1 as the photodegradation rate for MB; this rate was more than twice as fast as that of RR141 (0.3198 h−1) (Fig. 11(d)).
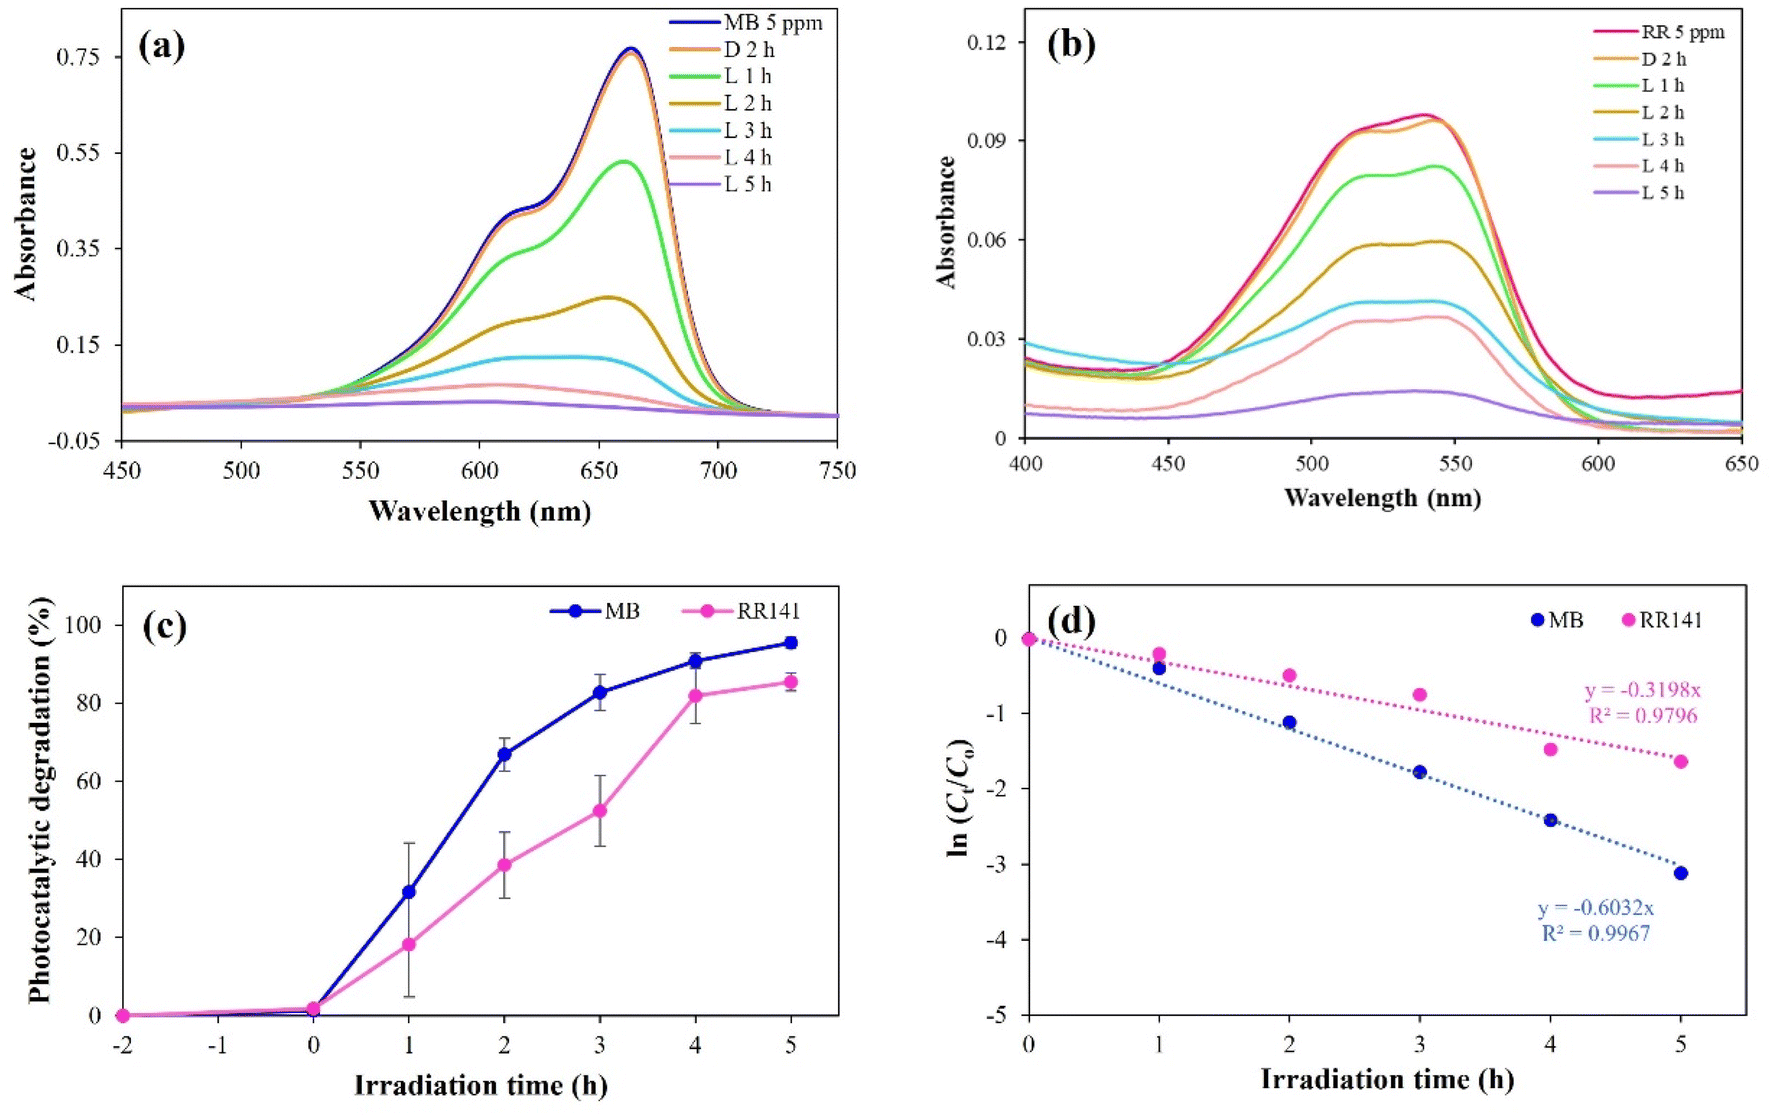 | ||
| Fig. 11 UV spectra of (a) MB and (b) RR141 solutions after UV irradiation for different times, (c) photocatalytic degradation percentage, and (d) rate of decolorization of MB and RR141 (Co = 5 mg L−1, dose = 0.006 g per 10 mL). | ||
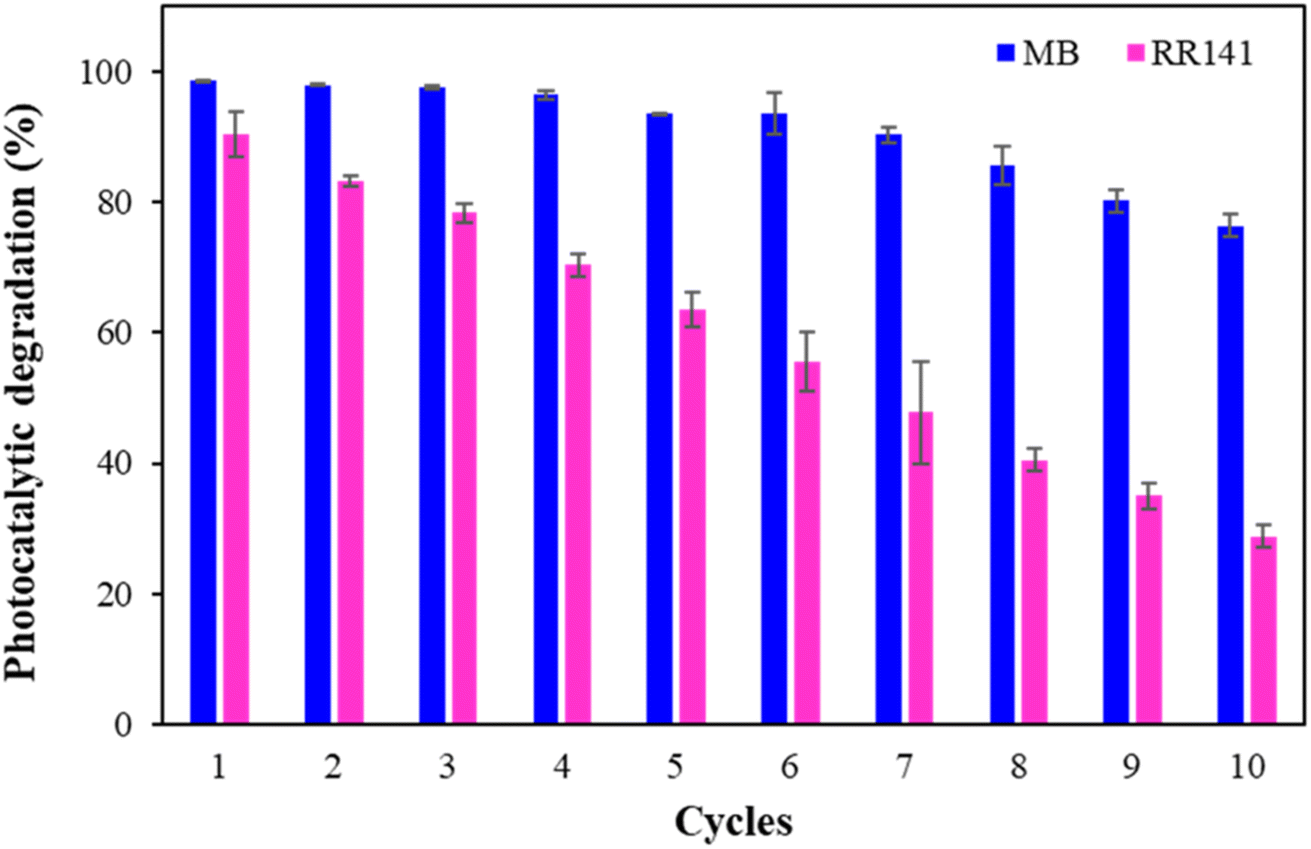
For industrial processes, the efficiency of the main functions of the materials is vital. Other factors for consideration include the feasibility of use, the stability of the material, and the ease of separation. The reusability of materials saves costs and reduces waste production. The % PD of RR141 for ten consecutive cycles decreased steadily after each cycle, probably because RR141 was favorably adsorbed on the surface of the beads (Fig. 12). However, the % PD remained effective for nearly 30% on the 10th cycle. The % PD of MB did not change on the 4th cycle. It decreased slightly but was still as high as 80% on the 10th cycle. The decomposed products and residual dyes occupy the surface, reducing the photocatalytic degradation efficiency.56
 | ||
| Fig. 12 Reusability of ZnO/CS + CIT + 2.5% ZIF composite beads for the photocatalytic degradation of MB and RR141. | ||
The photocatalytic degradation efficiency can also be reduced if ZnO is dissolved into Zn2+ or decomposed. ZnO particles are photo-decomposed under irradiation, and the decomposition increases with the irradiation time.57 Besides, the ZnO particles can be hydrolyzed, and the particles eventually solubilize to Zn2+ ions depending on the pH value of the aqueous solution. This reaction is significant in strongly acidic and basic conditions, in pH 4.4–6.4 and 8.3–10.5.58 A similar trend was observed by Malekkiani et al. when the photocatalyst reaction by ZnO was conducted in an acidic solution.59 However, at pH about 7, the particle size remained stable, indicating no dissolution at neutral pH.9 In contrast to those reports, the ZnO photocatalyst in the present study was coated with a thin layer of SiO2. The composite beads showed a remarkable potential for up to at least ten cycles despite some particles getting separated from the outer surface of the beads. Thus, the dissolution was not significant. The ICP result also showed that only 6.83% of Zn2+ leached from free ZnO/SiO2 particles after 5 h of UV irradiation. Note that, this is the leaching from free particles in water. The study by Boruah et al. reported that immobilizing nanoparticles in the composite membrane significantly reduced the leaching of Ag ions.6 In this work, the ZnO/SiO2 particles were chemically attached to the surface of the chitosan beads. This fixing would decrease the leaching of Zn2+. A similar result was observed when ZnO particles were coated with a thin shell of tin oxide (SnOx). This shell of around 3–6 nm thickness improved the chemical stability of the inner ZnO particles. In that study, only 0.4% of ZnO dissolution occurred after 2 h of the test at pH 6.60
The XRD pattern of the CS + CIT + 2.5% ZIF beads showed characteristic peaks of semicrystalline chitosan at 2θ of 9.7° and 20.1° (Fig. 13(a)).61 For fresh ZnO/CS + CIT + 2.5% ZIF composite beads, the diffraction peaks of ZnO were observed at 31.8°, 34.4°, 36.2°, 47.5°, 56.5°, 62.7°, 66.4°, 67.9°, and 69.1° corresponding to the hexagonal phase of the wurtzite structure of ZnO.62 The diffraction peaks of ZnO/CS + CIT + 2.5% ZIF composite beads after the 10th cycle matched well with those of the fresh sample. However, the peaks were very weak because of a minimal content of ZnO particles deposited on the surface of the composite beads (less than 2.59 weight % as indicated by the TGA results of the fresh composite beads) and the loss of particles during each cycle. In addition, a comparison of the SEM cross-sectional micrographs of a fresh bead and a 10-cycle composite bead (Fig. 13(b) and (c)) revealed that the internal pores of the bead remained after 10 cycles of adsorption-photocatalytic degradation although the surface of the cell wall was less rough after 10 cycles probably due to the accumulation of adsorbed dye molecules.63 The unchanged XRD pattern and the pore morphology indicated the superior stability of the CS + CIT + 2.5% ZIF beads and the stability of the ZnO–SiO2 coating core–shell particles. These advantages reduced the overall cost of wastewater treatment. Noteworthily, the composite beads developed in this work were reusable without requiring a regeneration process during each adsorption–photocatalytic degradation cycle. These materials were prepared from 100% natural biodegradable polymer; thus, no toxic traces were produced and released to the environment after utilization.
 | ||
| Fig. 13 (a) XRD patterns of (A) CS + CIT + 2.5% ZIF beads and ZnO/CS + CIT + 2.5% ZIF composite beads (B) before and (C) after reuse for 10 cycles and SEM cross-sectional micrographs of composite bead (b) before and (c) after reuse for 10 cycles; (b’) and (c’) are corresponding cell-wall surface morphology. | ||
4. Conclusions
Low-cost chitosan composite beads were prepared for the adsorption of the RR141 dye. ZIF-8 was successfully synthesized and confirmed by FTIR spectroscopy and XRD analysis. The average particle size was 270 nm, and the typical BET-specific surface area was 1184 m2 g−1. Cross-linked composite beads with ZIF-8 demonstrated superior adsorption capacity compared to pristine chitosan beads and cross-linked chitosan beads without ZIF-8. The optimum ZIF-8 loading was 2.5%. A maximum adsorption capacity of 6.51 mg g−1 was achieved at a contact time of 2 h, a pH of 4, a dose of 0.15 g per 10 mL, and an initial concentration of 1000 mg L−1. The pseudo-second-order kinetics model and the Langmuir isotherm model best described the adsorption process. The composite beads effectively removed several dyes, including the anionic dyes RB, CR, DY, and RO, and the cationic dyes RhB, CV, and MB. The possibility of using the composite beads to support a photocatalyst was studied by coating the surface of the composite beads with ZnO particles. The photocatalytic beads were thermally stable up to 275 °C. The presence of only 2.59 weight percent of ZnO in the beads was sufficient to degrade MB and RR141 under UV irradiation for 5 h with a degradation rate of 0.6032 h−1 and 0.3198 h−1, respectively. The photocatalytic beads were stable and reusable for up to ten cycles. This work presented an environment-friendly material for the simultaneous application as an adsorbent and photocatalyst support.Conflicts of interest
There are no conflicts to declare.Acknowledgements
This research was supported by Materials Chemistry Research Center, Research and Graduate Studies, Khon Kaen University, and the Center of Excellence for Innovation in Chemistry (PERCH-CIC), Ministry of Higher Education, Science, Research and Innovation (MHESI). The preliminary work on the ZIF synthesis by Thiyaporn Anochadet and Sawanya Tamarin is gratefully acknowledged.References
- M. Mathur, D. Gola, R. Panja, A. Malik and S. Z. Ahammad, Environ. Sci. Pollut. Res., 2018, 25, 345–352 CrossRef CAS PubMed.
- T. Panswad and W. Luangdilok, Water Res., 2000, 34, 4177–4184 CrossRef CAS.
- T. Robinson, G. McMullan, R. Marchant and P. Nigam, Bioresour. Technol., 2001, 77, 247–255 CrossRef CAS PubMed.
- P. C. Vandevivere, R. Bianchi and W. Verstraete, J. Chem. Technol. Biotechnol., 1998, 72, 289–302 CrossRef CAS.
- M. M. Nassar and M. S. El-Geundi, J. Chem. Technol. Biotechnol., 1991, 50, 257–264 CrossRef CAS.
- B. Boruah, P. K. Samantaray, G. Madras, J. M. Modak and S. Bose, Chem. Eng. J., 2020, 394, 124777 CrossRef CAS.
- J. S. Im, B. C. Bai, S. J. In and Y. S. Lee, J. Colloid Interface Sci., 2010, 346, 216–221 CrossRef CAS PubMed.
- F. Mohd Omar, H. Abdul Aziz and S. Stoll, Sci. Total Environ., 2014, 468–469, 195–201 CrossRef CAS PubMed.
- T. Meißner, K. Oelschlägel and A. Potthoff, Int. Nano Lett., 2014, 4(3), 1–13 Search PubMed.
- M. Thomas, G. A. Naikoo, M. U. D. Sheikh, M. Bano and F. Khan, J. Photochem. Photobiol. A, 2016, 327, 33–43 CrossRef CAS.
- Y. Ma, J. Wang, S. Xu, Z. Zheng, J. Du, S. Feng and J. Wang, RSC Adv., 2017, 7, 15077–15083 RSC.
- G. Crini and P. M. Badot, Prog. Polym. Sci., 2008, 33, 399–447 CrossRef CAS.
- T. Jóźwiak and U. Filipkowska, J. Environ. Chem. Eng., 2020, 8, 103564 CrossRef.
- S. Ma, M. Zhang, J. Nie, J. Tan, S. Song and Y. Luo, Carbohydr. Polym., 2019, 208, 328–335 CrossRef CAS PubMed.
- Y. Wang, X. Dai, Y. Zhan, X. Ding, M. Wang and X. Wang, Int. J. Biol. Macromol., 2019, 137, 77–86 CrossRef CAS PubMed.
- S. B. Zadvarzi, M. Khavarpour, S. M. Vahdat, S. M. Baghbanian and A. S. Rad, Int. J. Biol. Macromol., 2021, 168, 428–441 CrossRef CAS PubMed.
- C. Panawong, S. Tasarin, K. Phonlakan, J. Sumranjit, P. Saejueng and S. Budsombat, Polymer, 2022, 244, 124666 CrossRef CAS.
- P. Kongseng, P. Amornpitoksuk and S. Chantarak, React. Funct. Polym., 2022, 172, 105207 CrossRef CAS.
- Y. Wang, X. Dai, Y. Zhan, X. Ding, M. Wang and X. Wang, Int. J. Biol. Macromol., 2019, 137, 77–86 CrossRef CAS PubMed.
- J. Cheng, D. Ma, S. Li, W. Qu and D. Wang, Polymers, 2020, 12(2), 347 CrossRef PubMed.
- M. Barooah and B. Mandal, J. Membr. Sci., 2019, 572, 198–209 CrossRef CAS.
- S. Tasarin, C. Panawong, J. Sumranjit and S. Budsombat, Int. J. Hydrogen Energy, 2021, 46, 36969–36981 CrossRef CAS.
- P.-H. Chang, Y.-T. Lee and C.-H. Peng, Materials, 2020, 13(21), 5009 CrossRef CAS PubMed.
- D. T. Mitra, G. Sailakshmi, A. Gnanamani and A. Mandal, Mater. Res., 2013, 16, 755–765 CrossRef.
- M. Mizuguchi, M. Nara, K. Kawano and K. Nitta, FEBS Lett., 1997, 417, 153–156 CrossRef CAS PubMed.
- D. A. Patiño-Ruiz, G. De Ávila, C. Alarcón-Suesca, Á. D. González-Delgado and A. Herrera, ACS Omega, 2020, 5, 26463–26475 CrossRef PubMed.
- X. Sun, C. Liu, A. M. Omer, L.-Y. Yang and X. Ouyang, Int. J. Biol. Macromol., 2019, 132, 487–494 CrossRef CAS PubMed.
- V. A. Tran and S.-W. Lee, RSC Adv., 2021, 11, 9222–9234 RSC.
- Y. Liu, D. Lin, W. Yang, X. An, A. Sun, X. Fan and Q. Pan, Microporous Mesoporous Mater., 2020, 303, 110304 CrossRef CAS.
- M. Jian, B. Liu, G. Zhang, R. Liu and X. Zhang, Colloids Surf. A Physicochem., 2015, 465, 67–76 CrossRef CAS.
- H. Zhu, Q. Zhang, B.-G. Li and S. Zhu, Adv. Mater. Interfaces, 2017, 4, 1700560 CrossRef.
- E. D. Revellame, D. L. Fortela, W. Sharp, R. Hernandez and M. E. Zappi, Clean. Eng. Technol., 2020, 1, 100032 CrossRef.
- A. H. Jawad, A. S. Abdulhameed, N. N. A. Malek and Z. A. Alothman, Int. J. Biol. Macromol., 2020, 164, 4218–4230 CrossRef CAS PubMed.
- S. Sohni, R. Hashim, H. Nidaullah, J. Lamaming and O. Sulaiman, Int. J. Biol. Macromol., 2019, 132, 1304–1317 CrossRef CAS PubMed.
- R. Huang, Q. Liu, J. Huo and B. Yang, Arab. J. Chem., 2017, 10, 24–32 CrossRef CAS.
- K. Gayathri and N. Palanisamy, Sep. Sci. Technol., 2020, 55, 266–277 CrossRef CAS.
- H. Hosseinzadeh and S. Ramin, Int. J. Biol. Macromol., 2018, 106, 101–115 CrossRef CAS PubMed.
- R. F. Gomes, A. C. N. de Azevedo, A. G. B. Pereira, E. C. Muniz, A. R. Fajardo and F. H. A. Rodrigues, J. Colloid Interface Sci., 2015, 454, 200–209 CrossRef CAS PubMed.
- M. Ajmal, S. Demirci, M. Siddiq, N. Aktas and N. Sahiner, J. Appl. Polym. Sci., 2016, 133(7), 43032 CrossRef.
- B. Xu, C. Zheng, H. Zheng, Y. Wang, C. Zhao, C. Zhao and S. Zhang, RSC Adv., 2017, 7, 47029–47037 RSC.
- K. Y. Foo and B. H. Hameed, Chem. Eng. J., 2010, 156, 2–10 CrossRef CAS.
- S. Laowansiri, Res. J. Appl. Sci., 2011, 6, 15–19 CrossRef CAS.
- R. Dolphen, N. Sakkayawong, P. Thiravetyan and W. Nakbanpote, J. Hazard. Mater., 2007, 145, 250–255 CrossRef CAS PubMed.
- S. Netpradit, P. Thiravetyan and S. Towprayoon, Water Res., 2003, 37, 763–772 CrossRef CAS PubMed.
- P. Leechart, W. Nakbanpote and P. Thiravetyan, J. Environ. Manage., 2009, 90, 912–920 CrossRef CAS PubMed.
- G. Sreelatha, V. Ageetha, J. Parmar and P. Padmaja, J. Chem. Eng. Data, 2011, 56, 35–42 CrossRef CAS.
- J. Jaafari, H. Barzanouni, S. Mazloomi, N. Amir Abadi Farahani, K. Sharafi, P. Soleimani and G. A. Haghighat, Int. J. Biol. Macromol., 2020, 164, 344–355 CrossRef CAS PubMed.
- R. Bhatt, V. Ageetha, S. B. Rathod and P. Padmaja, Carbohydr. Polym., 2019, 208, 441–450 CrossRef CAS PubMed.
- B. Tanwar, S. Goyal and P. K. Patnala, J. Appl. Chem., 2012, 1, 505–511 Search PubMed.
- L. Raju, A. R. Stesho Crystalin Lazuli, N. K. Udaya Prakash and E. Rajkumar, Materialia, 2021, 16, 101082 CrossRef CAS.
- Z. Sekhavat Pour and M. Ghaemy, RSC Adv., 2015, 5, 64106–64118 RSC.
- S. L. Chia and D. T. Leong, Heliyon, 2016, 2(10), e00177 CrossRef PubMed.
- K. Pandiselvi and S. Thambidurai, Desalin. Water Treat., 2015, 57, 8343–8357 CrossRef.
- S. Sarkar, N. T. Ponce, A. Banerjee, R. Bandopadhyay, S. Rajendran and E. Lichtfouse, Environ. Chem. Lett., 2020, 18, 1569–1580 CrossRef CAS PubMed.
- A. El-Hag Ali, A. I. Raafat, G. A. Mahmoud, N. A. Badway, M. A. El-Mottaleb and M. F. Elshahawy, J. Inorg. Organomet. Polym. Mater., 2016, 26(3), 606–615 CrossRef.
- D. Xu, Q. Kong, X. Wang and T. Lou, Carbohydr. Polym., 2022, 291, 119630 CrossRef CAS PubMed.
- J. Doménech and A. Prieto, J. Phys. Chem., 1986, 90, 1123–1126 CrossRef.
- M. O. Fatehah, H. A. Aziz and S. Stoll, J. Colloid Sci. Biotechnol., 2014, 3, 75–84 CrossRef CAS.
- M. Malekkiani, A. Heshmati Jannat Magham, F. Ravari and M. Dadmehr, Sci. Rep., 2022, 12(1), 5927 CrossRef CAS PubMed.
- S. Kumar, F. Ye, B. Mazinani, S. Dobretsov and J. Dutta, Int. J. Mol. Sci., 2021, 22(9), 4513 CrossRef CAS PubMed.
- D. Xu, Q. Kong, X. Wang and T. Lou, Carbohydr. Polym., 2022, 291, 119630 CrossRef CAS PubMed.
- S. Li, P. C. Chiang, L. Ding, K. J. Shah, Q. Chen and S. Chen, J. Wuhan Univ. Technol., 2020, 35, 310–319 CrossRef CAS.
- A. Dalalibera, P. B. Vilela, T. Vieira, V. A. Becegato and A. T. Paulino, J. Environ. Chem. Eng., 2020, 8, 104465 CrossRef CAS.
Footnote |
| † Electronic supplementary information (ESI) available. See DOI: https://doi.org/10.1039/d3ra01187a |
| This journal is © The Royal Society of Chemistry 2023 |