
 Open Access Article
 This Open Access Article is licensed under a
 Creative Commons Attribution 3.0 Unported Licence
Synthesis of transition metal doped lanthanum silicate oxyapatites by a facile co-precipitation method and their evaluation as solid oxide fuel cell electrolytes†
Henri Joel Mbah Ngantchouab,
Rizwan Raza *c,
Edwin Akongnwi Nfornad,
John Lambi Ngoluie and
Tauqir A. Sherazi‡
*a
*c,
Edwin Akongnwi Nfornad,
John Lambi Ngoluie and
Tauqir A. Sherazi‡
*a
aDepartment of Chemistry, COMSATS University Islamabad, Abbottabad Campus, Abbottabad, 22060, Pakistan. E-mail: sherazi@cuiatd.edu.pk
bDepartment of Chemistry, Faculty of Sciences, University of Douala, P.O Box 24157 Douala, Cameroon
cDepartment of Physics, COMSATS University Islamabad, Lahore Campus, Lahore 54000, Pakistan. E-mail: razahussaini786@gmail.com
dDepartment of Fundamental Science, Higher Technical Teacher Training College, The University of Bamenda, P.O. Box 39 Bambili, Cameroon
eChemistry Department, Higher Teacher Training College, University of Yaoundé I, Yaoundé 47, Cameroon
First published on 19th April 2023
Abstract
Transition metal doped apatite La10Si6−xCoxO27−δ (x = 0.0; 0.2; 0.8) and La10Si5.2Co0.4Ni0.4O27−δ are synthesized by co-precipitation method followed by sintering. The precursor precipitates and apatite products are characterized by XRD, FTIR, TGA/DTA, Raman Spectroscopy, SEM-EDX and electrochemical impedance spectroscopy. The presence of apatite phase with hexagonal structure is confirmed through the XRD results. The conductivity measurements of the samples sintered at 1000 °C show that the ionic conductivity increases with increasing content of Co2+ doping into apatite that is further increased by co-doping of Ni2+. The Co doped apatite (La10Si5.2Co0.8O27−δ) exhibited conductivity of 1.46 × 10⁻³ S cm−1 while Co–Ni co-doped sample (La10Si5.2Co0.4Ni0.4O27−δ) exhibited highest conductivity of 1.48 × 10⁻³ S cm−1. The maximum power density achieved is also for Co, Ni co-doped sample i.e., 0.65 W cm−2 at 600 °C. The results represented show that Co and Ni enhances the SOFC performance of apatite and makes it potential electrolyte candidate for solid oxide fuel cell application.
1. Introduction
The advancement of industrial technology and rapid growth of world population has resulted in a high demand for energy. The increase in the demand for energy has generated a great interest to develop the devices which will provide cheap, renewable energy. One of such devices is the solid oxide fuel cells (SOFCs), an electrochemical device that is an efficient source of electrical energy to comply with the future energy demand 1–3. The SOFC is made up of the electrodes, electrolyte, and interconnect materials all in the solid state. The electrolyte materials for SOFCs must have a wide range of characteristics including negligible electronic conductivity, high ionic conductivity (oxide ion or proton), high ion transport numbers in a wide range of oxygen partial pressures, and chemical stability at high temperatures under partially reducing/oxidizing conditions.4 The stabilized zirconia, which has the fluorite structure, was first used in SOFC in 1937, although it had previously been employed as the electrolyte in the Nerst-lamp 5. The most widely used stabilizers are yttrium (YSZ) or scandium (SSZ).6 The conductivities of these solid solutions increase with the degree of substitution to an optimum 8% for Y2O3 and 11% for Sc2O3,7 and this maximum conductivity is reached at a degree of substitution close to the minimum that stabilizes the cubic fluorite phase.8 The scandium stabilized zirconia (SSZ) experiences higher ionic conductivities than Yttrium stabilized zirconia (YSZ) but the SSZ is relatively much expensive.9 Consequently, YSZ has become the electrolyte most widely used in SOFCs that shows good properties as an electrolyte material. However, the major drawback is its high working temperatures (800–1000 °C) depending on the thickness of the electrolyte that is required to achieve sufficient ionic conductivity. This high temperature requirement limits the use of other cell components to have high temperature resistance in order to be compatible with the electrolyte material and also high temperature sealing must be used, which causes additional cost increase of the SOFC system. One of the focus areas of SOFCs research is the development of the electrolyte material that would operate at relatively lower temperatures. In this research, we exploit the lanthanum silicate apatites as electrolyte material for SOFCs. Nakayama et. al., were the first to discover oxyapatite-structured materials with the general formula RE9.33+xSi6O26+1.5x (where RE represents rare earth elements) 10. Since then, they have attracted particular attention because of their high oxide ion conductivity and low activation energies. An interesting aspect in materials science is the modification of properties of materials through doping. This is the approach utilized in this research to seek superior ionic conductivity of lanthanum silicate oxyapatites. These studies showed that non-stoichiometry in the form of either cationic vacancies or excess oxygen is required to achieve good oxide ion conductivities 11,12. Different types of doping on the lanthanum site or on the silicon site, or on the both have been studied. Some studies of the Co-doped lanthanum silicate oxyapatite systems, La10Si6−xCoxO27−x/2, synthesized by the sol–gel method have been reported by Qingle et. al.13 The results showed that as the Co level increased, an initial increase in conductivity was observed, reaching a maximum value for x = 0.8 (La10Si5.2Co0.8O26.6). Higher Co3+ concentrations (0.8 < x < 1.5) results in a decrease in the conductivity of La10Si6−xCoxO27−x/2 because of the lower concentration of interstitial oxide ions and greater stoichiometry. Therefore, excess Co3+ dopant is unfavorable for high oxide conductivity. The doping results as shown above indicate clearly that oxygen over-stoichiometry is responsible for the good oxide-ion conductivity.The level and doping site both are important to improve the conductivity. In general, it has been shown that the ionic conductivity decreases when doping is carried out at the lanthanum site, such that the conductivity of La8.67SrSi6O26 is found to be 8.3 × 10⁻⁵ S cm−1 at 500 °C that is lower than 1.1 × 10⁻⁴ S cm−1 for La9.33Si6O26 (ref. 14) because of decrease in the number of cationic vacancies.
Different synthesis methods have been reported for the nanocrystalline lanthanum silicate powders, distinguished according to preparation temperature as solid state reaction and solution synthesis.15 The high preparation temperature methods have the common problem that precursors do not properly mix on a large scale.
Low-temperature preparation methods have greatly overcome the problem of precursor contact; however, side products are still detected in the compounds obtained with these methods. Recently, some authors have16,22 reported a facile co-precipitation method to synthesize nano-sized LSO powders, where La(NO3)3·6H2O and tetraethyl orthosilicate (TEOS) are dissolved in water and ethanol to precipitate well-mixed precursors under dilute ammonia solution. Qingle et. al.13 used the sol–gel method for the synthesis of La10Si6−xCoxO27−x/2, with starting Co3+ ions. While the present work reports the modified co-precipitation method based on a single source metal–organic precursor, that is, the metal octanoate to synthesize fine powders of apatite La10CoxSi6−xO27−δ, where x is maintained as 0.0, 0.2 and 0.8. In addition to doping with Co2+, co-doping with Co and Ni in the sample (La10Si5.2Co0.4Ni0.4O27−δ) is also synthesized in this work, which have not yet been reported. The synthesized samples were calcined at different temperatures and characterized by TG/DTA, XRD, FT-IR, Raman spectra and SEM-EDX to identify the pure phase formation and the morphologies. The effect of partial substitution of silicon by divalent cobalt, Co2+ and Ni2+ on the structure and grain morphology are examined. Electrical conductivity properties as a function of temperature under air by electrochemical impedance spectroscopy are investigated to determine the application of material as an electrolyte for SOFC.
2. Experimental method
2.1. Synthesis of apatites
La(NO3)3·6H2O, Co(NO3)2·6H2O, Ni(NO3)·6H2O of analytical grade were purchased from Sigma-Aldrich. The tetraethyl orthosilane (98%, Acros Organics), octanoic acid (99.99%, Merck), sodium hydroxide (98%, BIOCHEM Chemopharma United Kingdom), absolute ethanol (Baker) were used as received without further purification. De-ionized (DI) water was used throughout the study.The cobalt-doped lanthanum silicate of the general formula La10Si6−xCoxO27−δ (where x = 0.0; 0.2; and 0.8) were synthesized in this work. For each composition, the required stoichiometric amounts of lanthanum nitrate, cobalt(II) nitrate, nickel nitrate and tetraethyl orthosilicate (TEOS) were dissolved in DI water along with continuous stirring to obtain a homogeneous solution. The sodium octanoate was used as precipitating agent that was prepared by mixing the solutions of octanoic acid and sodium hydroxide. The solutions containing the metal salts (La3+, Co2+, Ni2+and Si4+) and sodium octanoate were mixed with continuous stirring for about 1 hour at room temperature. The resulting precipitates of precursor (La–Si–Co or La–Si–Co–Ni octanoate) were then filtered to remove the NaNO3, followed by washing with ethanol and drying in an oven for 12 hours at 80 °C. The as-prepared precursor powder was sintered for 4 h in air at different temperatures in a tubular furnace in air (heating rate 10 °C min−1).
The cobalt-doped lanthanum silicate of the general formula La10Si6−xCoxO27−δ with x = 0.0; 0.2 and 0.8 are assigned the codes LSCO-0, LSCO-2 and LSCO-8 respectively, while the various precursors from which they are derived are labelled with the codes P-00, P-02, P-08. The compound La10Si5.2Co0.4Ni0.4O27−δ is assigned the code LSCNO and its precursor PCN-04.
2.2. Characterizations
In order to determine the calcination temperature, the precursors were analysed by thermogravimetric analysis (TGA). The TGA measurements were performed using DTA 1600 TA Instruments, USA, under oxygen flow rate of 100 ml min−1, up to a temperature of 900 °C, with a heating rate of 20 °C min−1. The crystalline phases were identified by X-ray diffraction (XRD) analysis (Bruker AXS D8 Focus) using Co Kα radiation (λ = 1.78901 Å). The angular scan range is 20°–100° and the scan increment is 0.02° per step for all samples. The microstructure characterization of the obtained powders is carried out by scanning electron microscope (JSM5800LV, JEOL, Japan) combined with an EDX holder. The FTIR spectra of samples were recorded using IR Fourier spectrometer Nicolet 6700 equipped with Smart Orbit™ diamond ATR accessory (Thermo Scientific, USA). The FTIR Spectra were obtained in the range of 400–4000 cm−1. Electrical conductivity measurements as a function of temperature were performed by the complex impedance spectroscopy technique, using a Solartron 1260A frequency response analyser (FRA) over the frequency range 5 Hz to 15 MHz, under static air. The measurements were made in open circuit and with an applied AC voltage of 100 mV. Impedance diagrams are recorded from 450 to 750 °C with thermal steps of about 25 °C and settling times of 20 minutes. The fuel cell performance were performed with hydrogen fuel. The measurments were performed at 600 °C.3. Results and discussion
3.1. Characterization of precursors
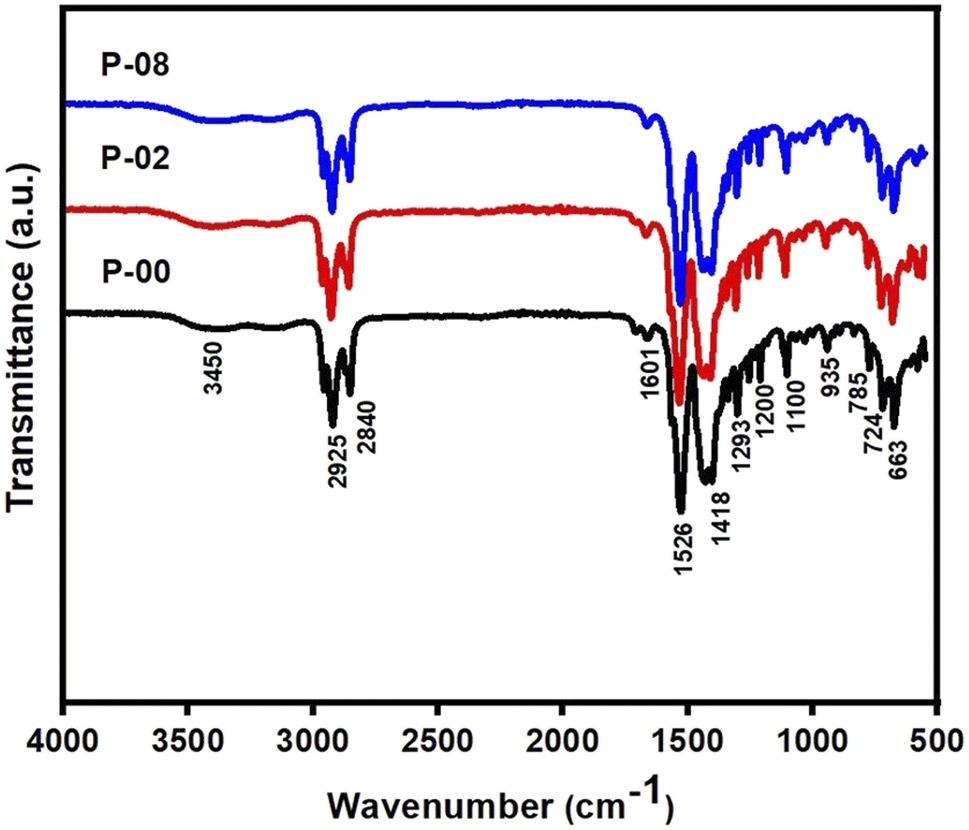 | ||
| Fig. 1 Fourier transform infrared (FTIR) spectra of precursors of the samples LSCO-0, LSCO-2, and LSCO-8. | ||
The absence of vibration of the free carbonyl (C![[double bond, length as m-dash]](https://www.rsc.org/images/entities/char_e001.gif) O) around 1720 cm−1 and 1740 cm−1 is an indication that the carboxylate group of the octanoate has fully engaged in the coordination bond. From Fig. 1, the intense peaks at 2925 and 2840 cm−1 are typical of symmetric and asymmetric stretching vibrations of C–H in the –CH3 and –CH2 groups respectively.17 The peaks at 1418 cm−1 and 1200 cm−1 are attributed to the scissors deformation and wagging vibrations of C–H, respectively. Although the characteristic band of the CO group of carbonyl compounds and carboxylic acids is missing due to the coordination bond formation but the two CO groups in the octanoate ligands give rise to asymmetric and symmetric frequencies at 1601 and 1526 cm−1, respectively.17
O) around 1720 cm−1 and 1740 cm−1 is an indication that the carboxylate group of the octanoate has fully engaged in the coordination bond. From Fig. 1, the intense peaks at 2925 and 2840 cm−1 are typical of symmetric and asymmetric stretching vibrations of C–H in the –CH3 and –CH2 groups respectively.17 The peaks at 1418 cm−1 and 1200 cm−1 are attributed to the scissors deformation and wagging vibrations of C–H, respectively. Although the characteristic band of the CO group of carbonyl compounds and carboxylic acids is missing due to the coordination bond formation but the two CO groups in the octanoate ligands give rise to asymmetric and symmetric frequencies at 1601 and 1526 cm−1, respectively.17
This is evidence of the presence of carboxylate groups in the samples. It can be demonstrated that the value of the separation between the asymmetric and symmetric stretching of COO, i.e., Δν (υCOOasy – υCOOsym) can be used to determine the binding mode between the carboxylate group (COO) of the ligand and the metal. The value of Δν below 140 cm−1 is attributable to the bidentate chelating mode while Δν between 140 cm−1 and 200 cm−1 is attributed to the bridged bidentate binding mode and Δν above 200 cm−1 is attributed to monodentate binding mode.18 From the spectra, it is observed that the octanoate ligands exhibit bidentate chelating effect to the metal in all the compounds. These results are similar to those reported in the literature for similar compounds.19 These results confirm the presence of the expected functional groups in the precursors: P-00, P-02, and P-08.
 | ||
| Fig. 2 Thermogravimetric curve and DTA of sample P-02 synthesized by co-precipitation method. | ||
3.2. Analysis of the apatites
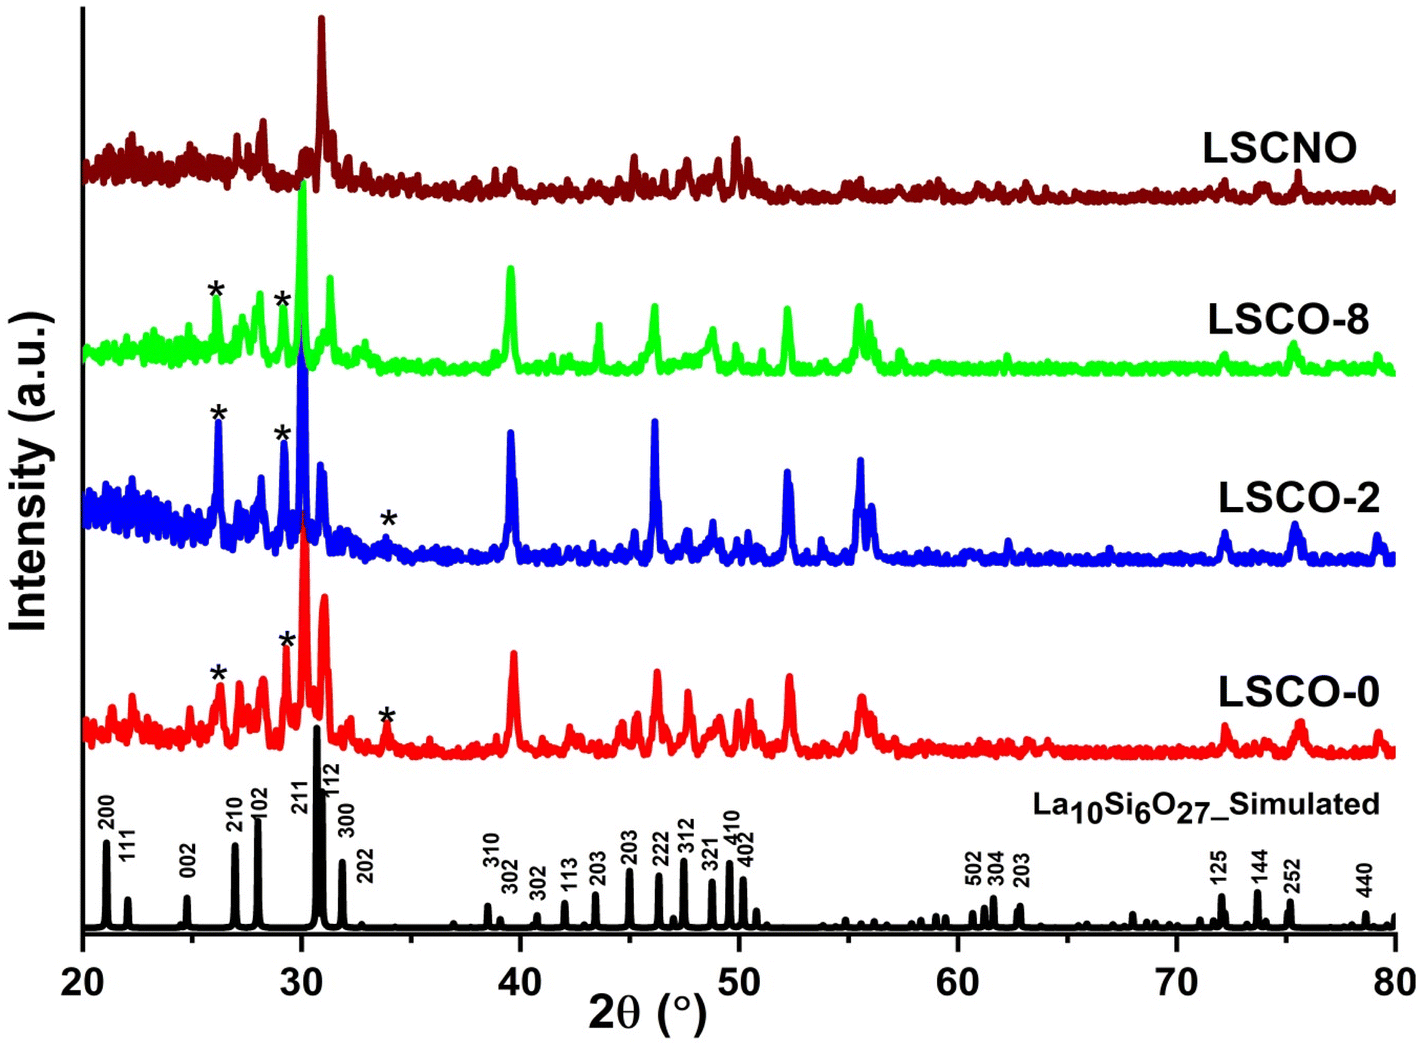 | ||
| Fig. 3 XRD patterns of simulated La10Si6O27 (ICDD Card No. 053-0291), La10Si6−xCoxO27−δ and La10Si5.2Co0.4Ni0.4O27−δ calcined at 1000 °C. | ||
Lattice parameters and unit cell volume for the hexagonal structure were calculated from the X-ray diffraction data and are presented in Table 1 along with some values from the literature. It is observed that there is a general increase in the unit cell volume and lattice parameters with increasing dopant content. This can be explained by the fact that larger Co2+ (0.58 Å) and Ni2+ ions (0.55 Å) are substituting smaller Si4+ ions (0.26 Å). The expansion of the lattice is evidently seen with the XRD peaks shifting to the left towards lower angles (and higher d-spacings). The lattice parameters are very close to those reported in the literature as can be seen in Table 1.13,16
The particle size was calculated from the line broadening of the most intense peak using the Scherer formula (D = 0.9λ/β![[thin space (1/6-em)]](https://www.rsc.org/images/entities/char_2009.gif) cosθ), where D is the particle size, λ is the wavelength of the radiation, β is the full width at half maximum, FWHM and θ is the diffraction angle. All the particles are observed to fall in the nanometer range.
cosθ), where D is the particle size, λ is the wavelength of the radiation, β is the full width at half maximum, FWHM and θ is the diffraction angle. All the particles are observed to fall in the nanometer range.
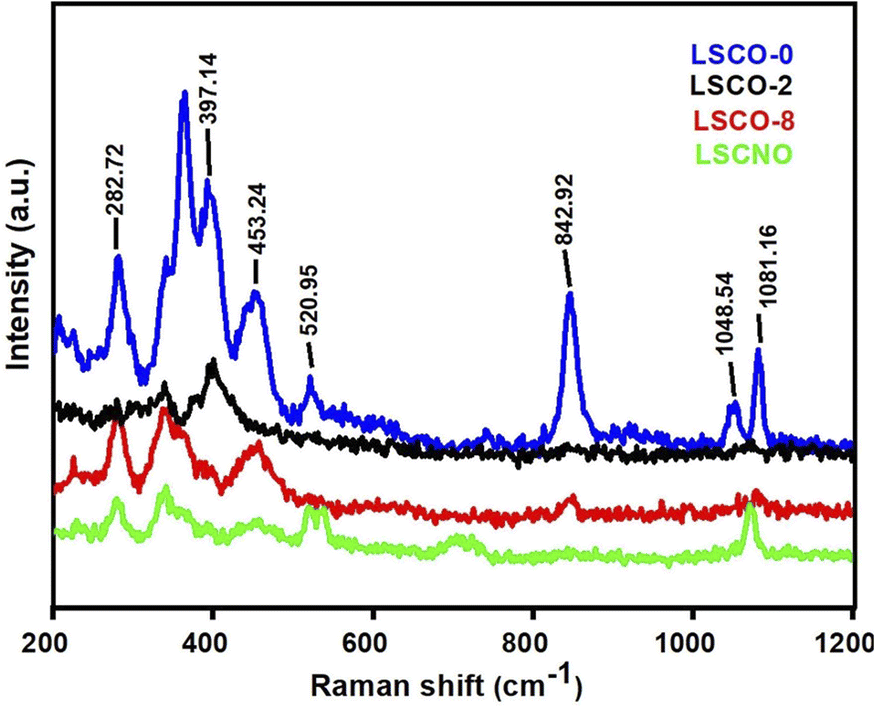 | ||
| Fig. 4 Raman spectrum of the La10Si5.2Co0.4Ni0.4O27−δ sample, calcined at 1000 °C. | ||
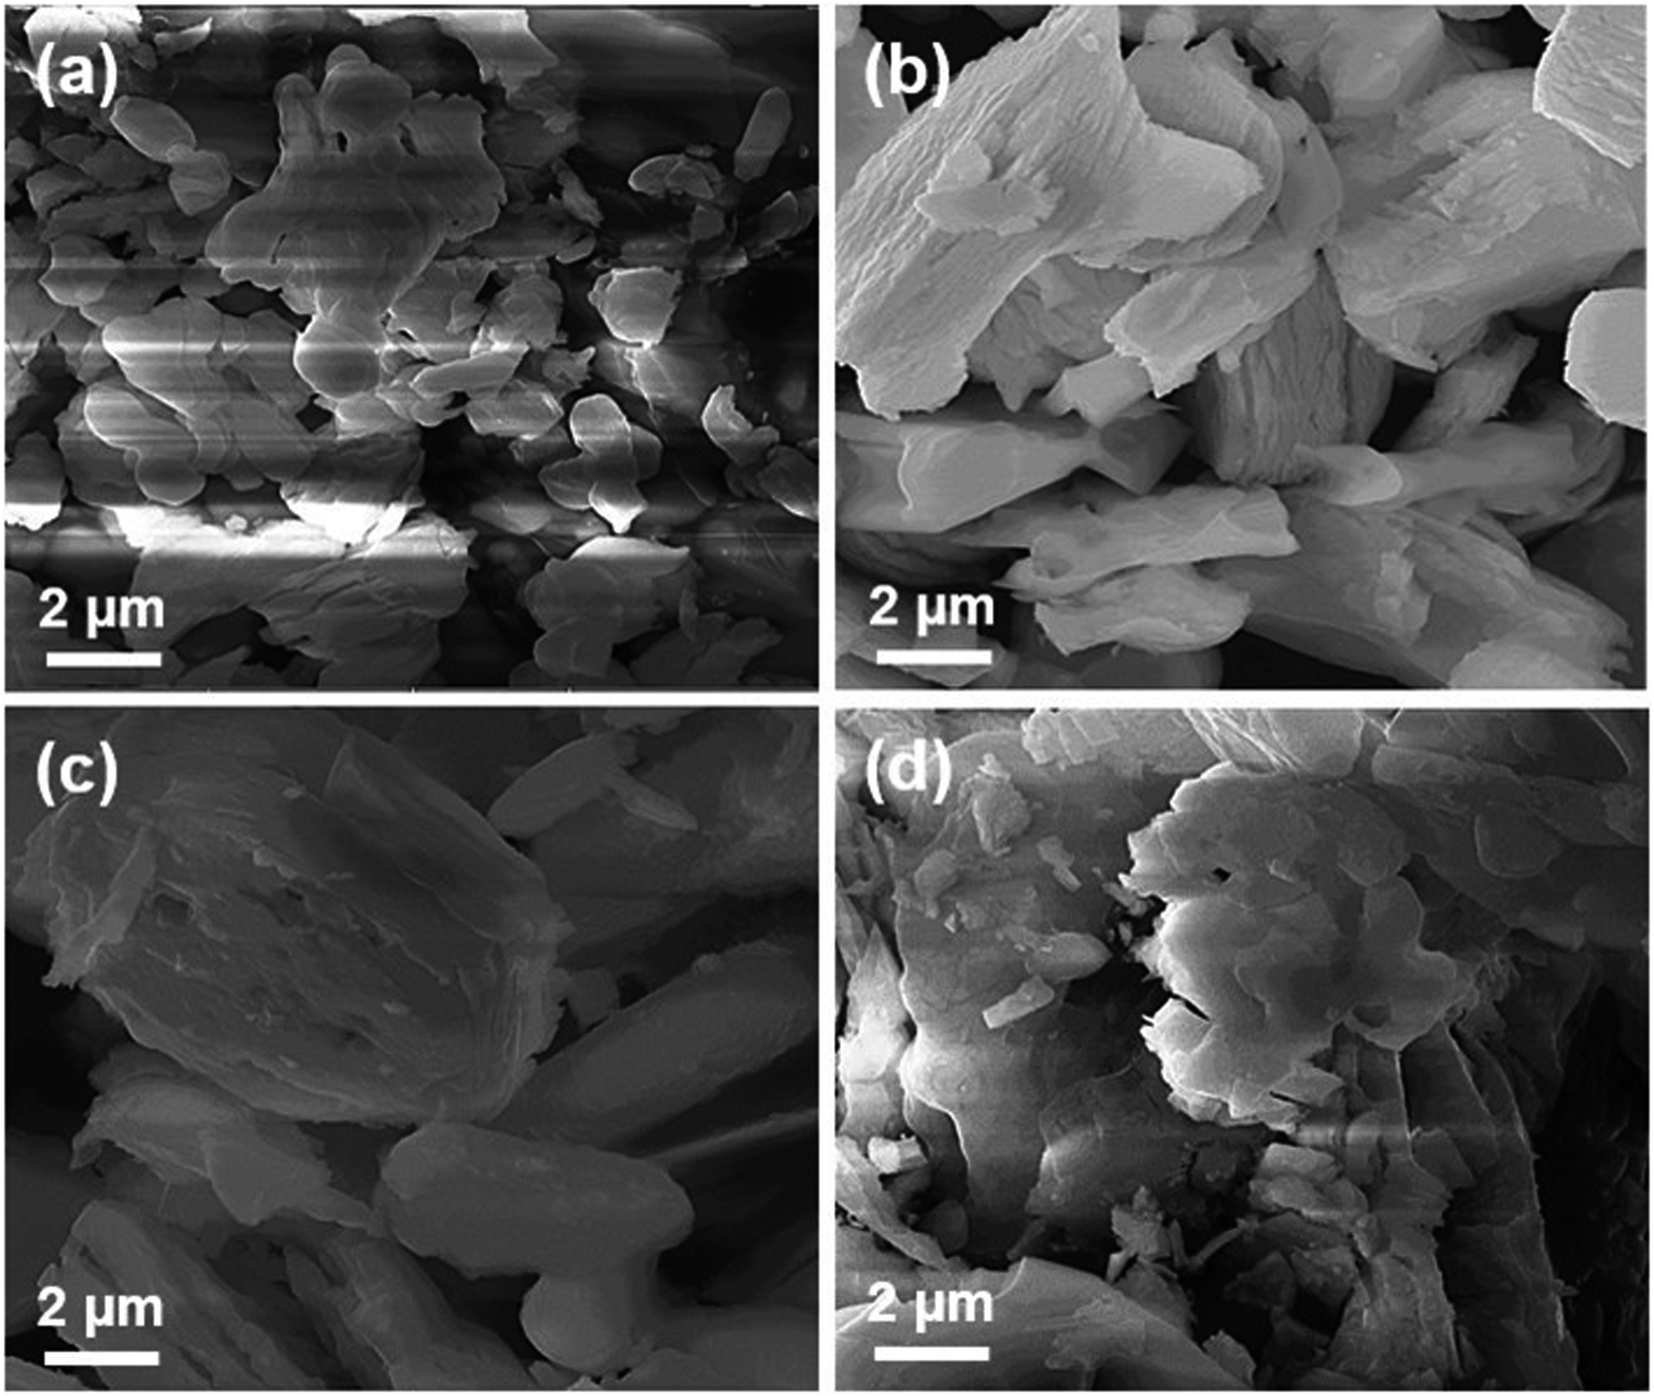 | ||
| Fig. 5 SEM images of La10Si6−xCoxO27−δ calcined at 1000 °C: (a) x = 0.0; (b) x = 0.2; (c) x = 0.8 and (d) La10Si5.2Co0.4Ni0.4O27−δ calcined at 1000 °C. | ||
The SEM was coupled to Energy Dispersive X-ray Spectroscopy (EDX) technique. Fig. 6 shows EDX pattern of La10Si6−xCoxO27−δ and La10Si5.2Co0.4Ni0.4O27−δ. The EDX being a qualitative and a semi-quantitative technique indicated the presence of La, Si and O for the x = 0.0 sample while additional Co is also detected for the cobalt doped samples. La10Si5.2Co0.4Ni0.4O27−δ detected the presence of all the expected elements, that is, La, Si, Co, Ni and O.
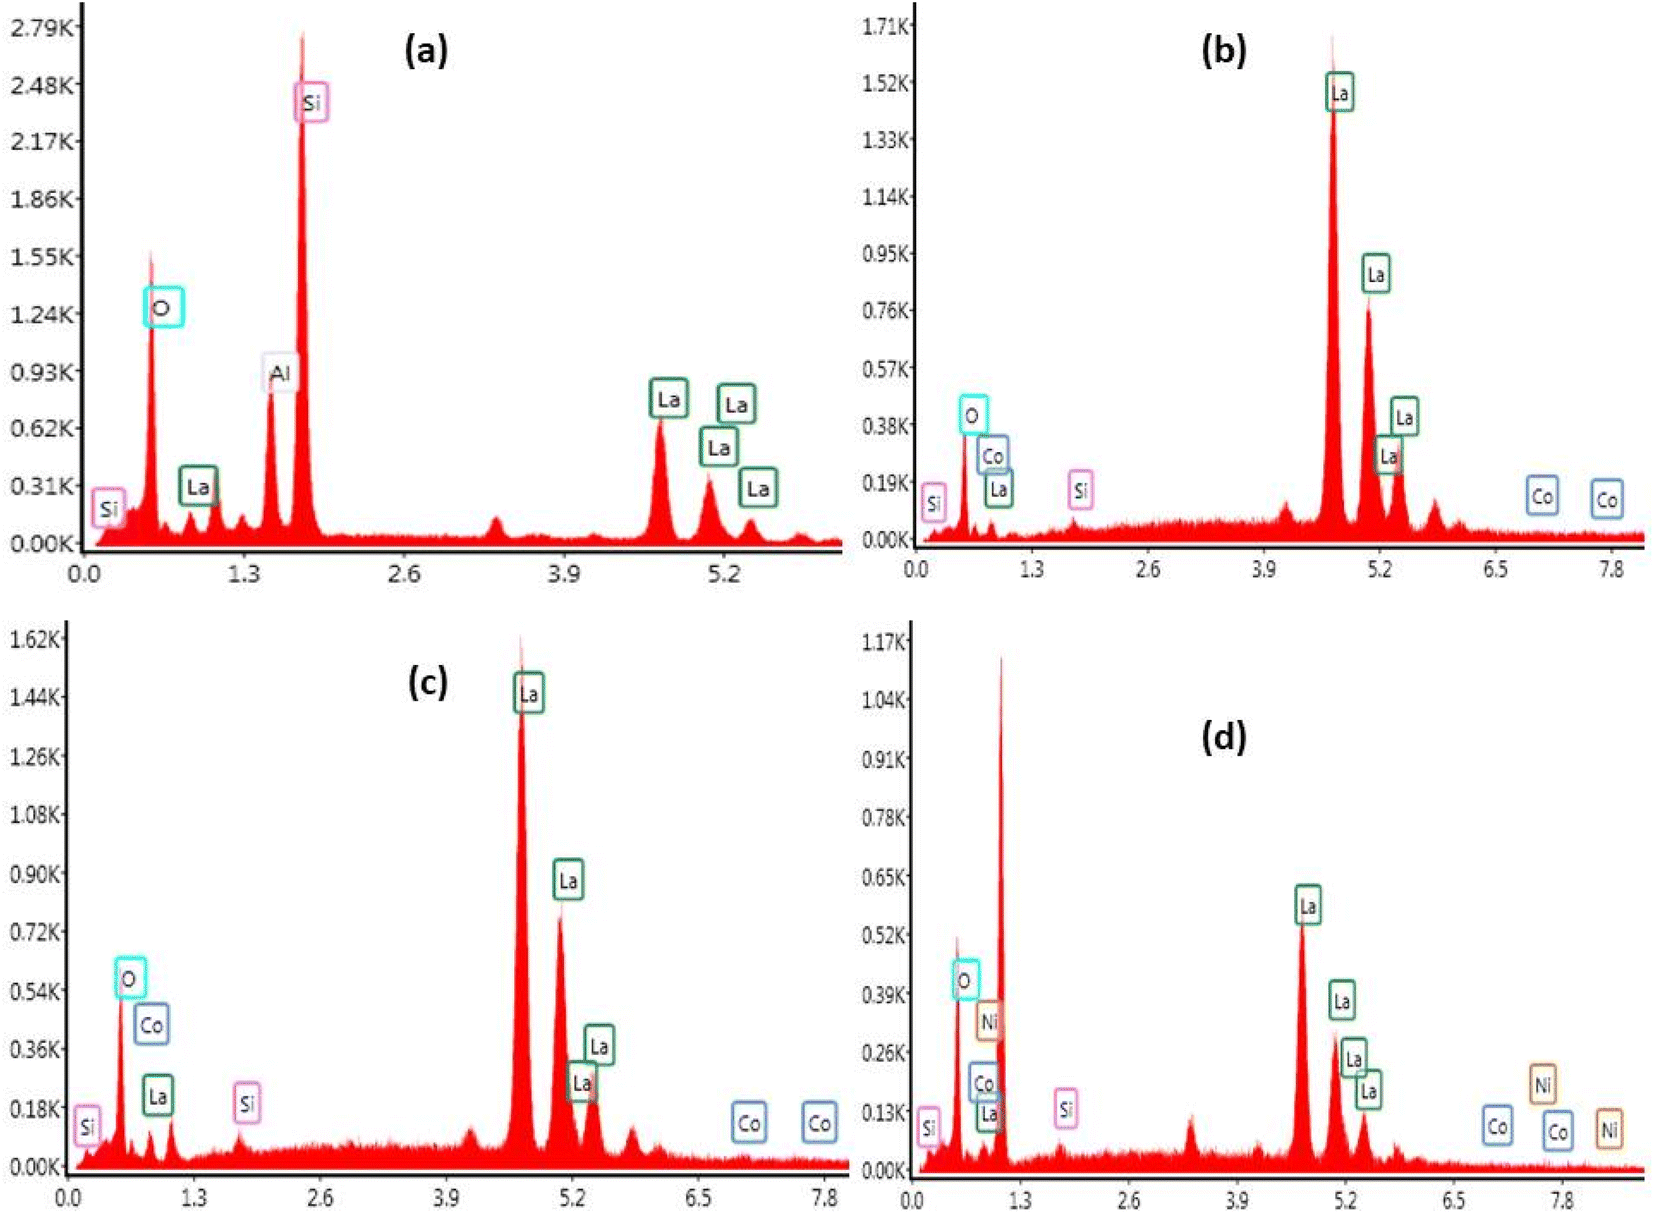 | ||
| Fig. 6 EDX of La10Si6−xCoxO27−δ calcined at 1000 °C: (a) x = 0.0; (b) x = 0.2; (c) x = 0.8 and (d) La10Si5.2Co0.4Ni0.4O27−δ calcined at 1000 °C. | ||
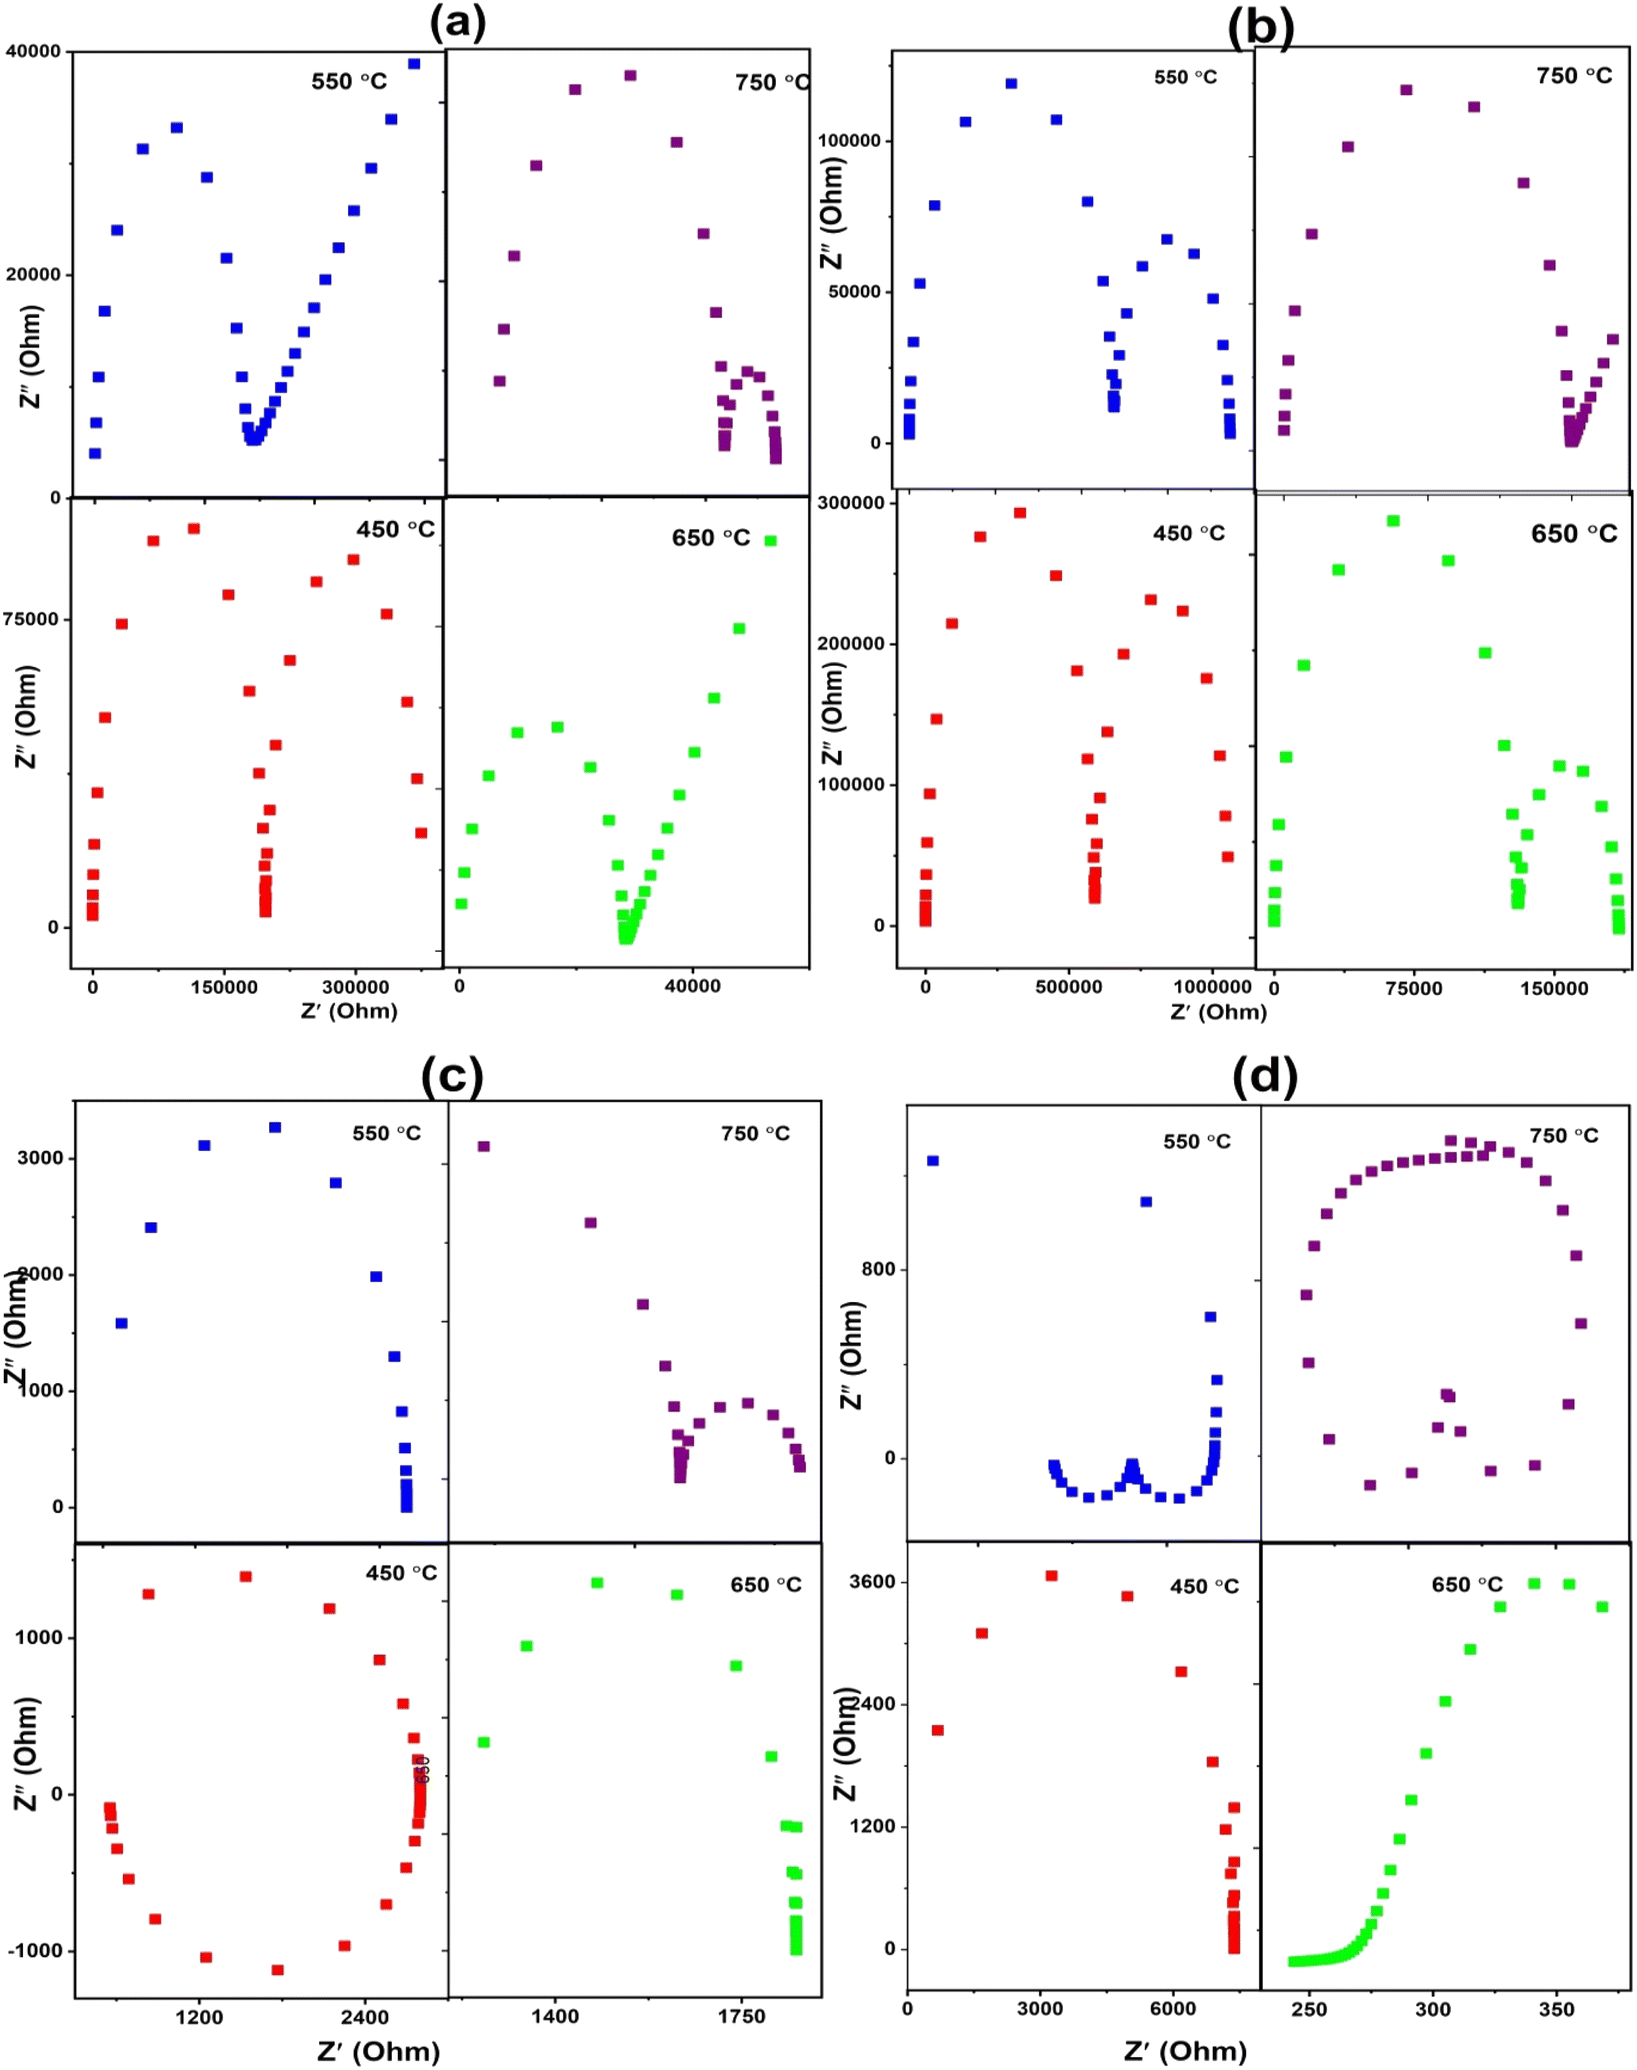 | ||
| Fig. 7 Complex impedance plots of apatite samples (a), LSCO-0, (b) LSCO-2, (c) LSCO-8, and (d) LSCNO-8 measured at different temperatures. | ||
The total oxygen ion conductivity of the samples operating at different temperatures was calculated using the following equation:
| σ = L (R·A) | (1) |
| σ(T) = σ0Exp(−Ea/KT) | (2) |
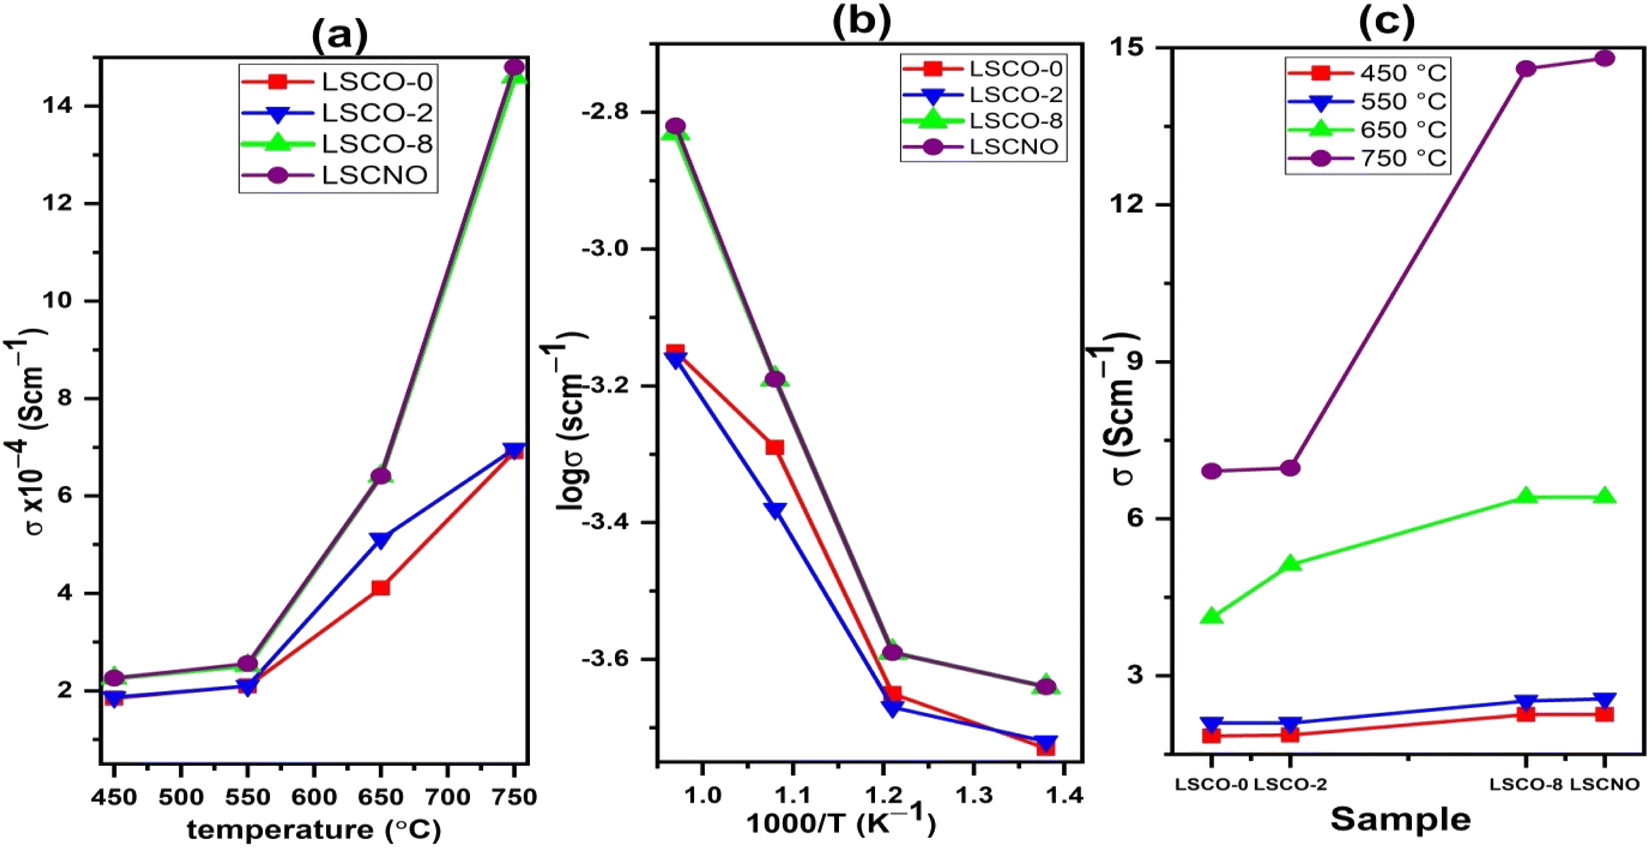 | ||
| Fig. 8 (a) Evolution of conductivity with temperature (b) Arrhenius plot of ionic conductivity and (c) dependence of conductivity with Co and Ni contents. | ||
The Arrhenius diagram in Fig. 8(b) shows us a linear evolution of the ionic conductivity. The linear evolution of ionic conductivity indicate that the conductivity is thermally activated, and the activation energy is 0.30, 0.28, 0.39, 0.40 eV for sample LSCO-0, LSCO-2, LSCO-8, and LSCNO, respectively. The values are relatively less in comparison with the literature data (0.5–0.9 eV without impurity phase).29
It is also observed that the effect of Co2+ doping increases the conductivity of the different materials. This effect is shown in Fig. 8(c). The best value obtained in the case of our work is for x = 0.8 at 750 °C with a value of 1.48 × 10⁻³ S cm−1. These results are similar to those obtained by Qingle et al. 13 who also showed that the conductivity increased with the doping level of cobalt up to a certain threshold and then decreased beyond x = 0.8. The sample that was co-doped with nickel and cobalt, La10Si5.2Co0.4Ni0.4O27−δ has conductivities at temperatures 550 °C and 750 °C very slightly higher than the x = 0.8 sample. However, the conductivity of these sample increases exponentially with temperature increase from 550 °C to 650 °C and then even higher conductivity values achieved at 750 °C. Ni doped lanthanum silicate oxyapatite, La9.33Si6−xNixO26−x (x = 1.0) showed conductivity of 1.21 × 10⁻³ S cm−1 at 700 °C 30 while the Co and Ni co-doped sample, La10Si5.2Co0.4Ni0.4O27−δ in this work showed a higher value of 1.48 × 10⁻³ S cm−1 at 750 °C.
The La10(SiO4)6O3 compound is made up of isolated SiO4 units forming two distinct types of interstices parallel to the c-axis. The smaller insterstice contains La3+ cations while the larger one is occupied by La3+ and O2− ions.31 Conduction is through the interstitial oxide ions. Co doping at the Si sites creates cation vacancies. The oxide ions can hop through these vacant sites,14 which results in increase in the ionic conductivity as shown with higher Co doping content.
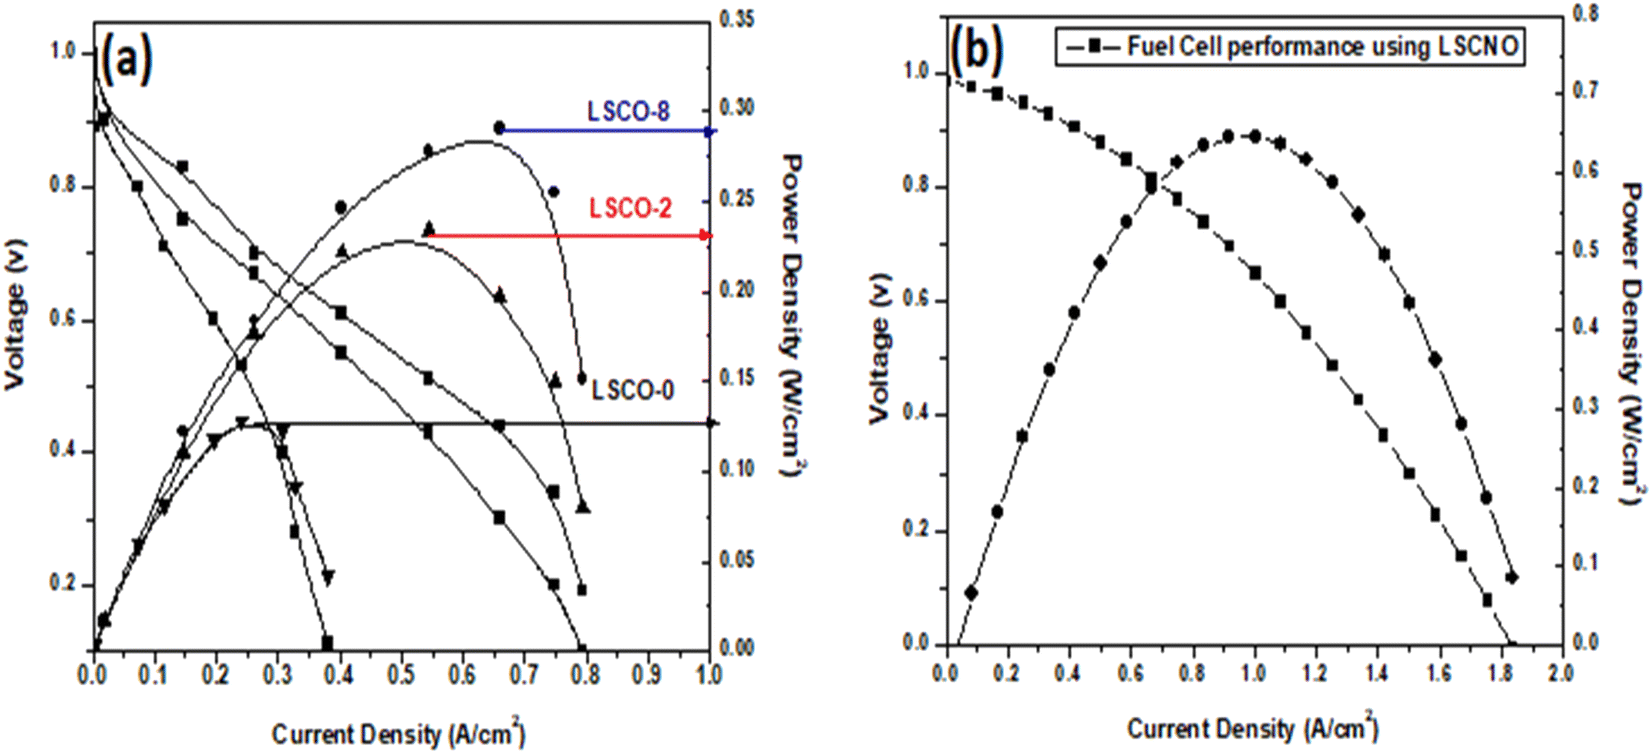 | ||
| Fig. 9 Fuel cell performance of (a) LSCO-0, LSCO-2, LSCO-8, and (b) LSCNO-8 using hydrogen as fuel. | ||
4. Conclusion
Samples of La10Si6−xCoxO27−δ (x = 0.0; 0.2; 0.8) and La10Si5.2Co0.4Ni0.4O27−δ were successfully synthesized by the co-precipitation method. Compared to the solid state reaction, the apatite phase was obtained at a lower temperature of 1000 °C with the co-precipitation method. The XRD and Raman spectra confirmed the presence of the apatite phase in the samples. The Co2+ doping increases the conductivity of the samples. The co-doping of Co2+ and Ni2+ in the apatite sample “La10Si5.2Co0.4Ni0.4O27−δ” further improved the conductivity as compared to “La10Si5.2Co0.8O27−δ sample, that may be attributed to the minimal difference of ionic radii between Co2+ and Ni2+ ions. The reported procedure offered the lower temperature sintering without compromising the ionic conductivities. The ionic conductivity for LSCO-8 is achieved as 1.46 × 10⁻³ S cm−1 at 750 °C, which is comparable conductivities in the literature at temperatures around 800 °C. These compounds have good ionic conductivities which can have application as electrolyte material in solid oxide fuel cells. The maximum power density with sample LSCNO is 0.65 W cm−2 at 600 °C that is much better than the other three samples LSCO-O, LSCO-2, LSCO-8. Therefore, LSCNO is the best potential electrolyte candidate for solid oxide fuel cell owing to its better conductivity and fuel cell performance.Conflicts of interest
The authors declare no competing financial interest.Acknowledgements
The authors gratefully acknowledge the financial support of Higher Education Commission of Pakistan (20–3684/R&D/HEC/14), Pakistan Science Foundation (PSF/NSFC-Eng/KP-COMSATS-ABT-04), and CUI-TWAS fellowship program. Tauqir A. Sherazi acknowledges the financial support from the Alexander von Humboldt Foundation.References
- A. B. Stambouli and E. Traversa, Solid oxide fuel cells (SOFCs): a review of an Environmentally clean and efficient source of energy, Renewable Sustainable Energy Rev., 2002, 6(5), 433–455 CrossRef CAS.
- R. Gadsbøll, J. Thomsen and C. BangMøller, Solid oxide fuel cells powered by biomass gasification for high efficiency power generation, Energy, 2017, 131, 198–206 CrossRef.
- R. M. Ormerod, Solid oxide fuel cells, Chem. Soc. Rev., 2003, 32(1), 17–28 RSC.
- J. B. Goodenough, Annu. Rev. Mater. Res., 2003, 33(1), 91 CrossRef CAS.
- E. Baur and H. Preis, Fuel Cell with Rigid Conductors, Elktrochem, 1937, 43, 727–732 CAS.
- S. P. S. Badwal, F. T. Ciacchiand and D. Milosevic, Solid State Ionics, 2000, 136, 91 CrossRef.
- V. V. Kharton, F. M. B. Marques and A. Atkinson, Solid State Ionics, 2004, 174, 13 CrossRef.
- V. P. Gorelov and S. F. Palguev, Dokl. Akad. Nauk SSSR, 1979, 248(6), 1356–1359 CAS.
- O. Yamamoto, Y. Arachi, H. Sakai, Y. Takeda, N. Imanishi, Y. Mizutani, M. Kawai and Y. Nakamaru, et al., Ionics, 1998, 4, 403 CrossRef CAS.
- S. Nakayama, T. Kageyama, H. Aono and Y. Sadaoka, J. Mater. Chem., 1995, 5, 1801–1805 RSC.
- R. Tolchard, M. S. Islam and P. R. Slater, J. Mater. Chem., 2003, 13, 1956–1961 RSC.
- P. R. Slater and J. E. H. Sansam, in Solid State Chemistry V, ed. P. Sajgalik, M. Drabik and S. Varga, 2003, vol. 90–91, pp. 195– 200 Search PubMed.
- Q. Shi, L. Lu, H. Jin, H. Zhang and Y. Zeng, Electrical properties and thermal expansion of cobalt doped apatite- type lanthanum silicates based electrolytes for IT-SOFC, Mater. Res. Bull., 2012, 47, 719–723 CrossRef CAS.
- J. E. H. Sansom, E. Kendrick, J. R. Tolchard, M. S. Islam and P. R. Slater, J. Solid State Electrochem., 2006, 10, 562–568 CrossRef CAS.
- S. Tao and T. S. John Irvine, Mater. Res. Bull., 2001, 36, 1245 CrossRef CAS.
- T. R. Yang, H. L. Zhao, J. H. Han, N. S. Xu, Y. N. Shen and Z. H. Du, et al., Synthesis and densification of lanthanum silicate apatite electrolyte for intermediate temperature solid oxide fuel cell via coprecipitation method, J. Eur. Ceram. Soc., 2014, 34, 156 Search PubMed.
- N. L. Alpert, W. E. Keiser and H. A. Szymanski, IR Theory and Practice of Infrared Spectroscopy, Plenum Press, New York, 2nd edn, 2012 Search PubMed.
- J. Lambi, A. Nsehyuka, N. Egbewatt, L. Cafferata and A. Arvia, Thermochim. Acta, 2003, 398, 145–151 CrossRef CAS.
- C. N. Yonti, P. K. Tsobnang, R. L. Fomekong, F. Devred, E. Mignolet, Y. Larondelle, S. Hermans, A. Delcorte and J. L. Ngolui, Green Synthesis of Iron-Doped Cobalt Oxide Nanoparticles from Palm Kernel Oil via Co-Precipitation and Structural Characterization, Nanomaterials, 2021, 11(11), 2833 CrossRef PubMed.
- M. S. Niasari, F. Davar and Z. Fereshteh, Synthesis of nickel and nickel oxide nanoparticles via heat-treatment of simple octanoate precursor, J. Alloys Compd., 2010, 494, 410–414 CrossRef.
- D. dov, Infrared Spectroscopy of Adsorbed Species on the Surface of Transition Metal Oxides, Wiley, England, UK, 1990 Search PubMed.
- B. Li, X. Wang, J. Ma and L. Huang, Preparation of Phosphorylated Chitosan/Chitosan/Hydroxyapatite Composites by Co-Precipitation Method, Adv. Mater. Res., 2009, 79–82, 401–404 CAS.
- E. Rodríguez-Reyna, et al., Structural, microstructural and vibrational characterization of apatite type lanthanum silicates prepared by mechanical milling, J. Solid State Chem., 2006, 179, 522–531 CrossRef.
- G. Lucazeau, et al., Raman spectra of apatites: La10-xSi6-y(Al,Fe)yO26+-&, J. Raman Spectrosc., 2007, 38, 21–33 CrossRef CAS.
- Y. Zhang, Z. Su, A. K. Azad, W. Zhou and J. T. S. Irvine, Directly imaging Interstitial oxygen in silicate apatite, Adv. Energy Mater., 2012, 2, 316–321 CrossRef CAS.
- K. Fukuda, et al., Solid State Ionics, 2012, 217, 40–45 CrossRef CAS.
- H. Yoshioka, Enhancement of ionic conductivity of apatite type lanthanum silicates doped with cations, J. Am. Ceram. Soc., 2007, 90(10), 3099–3105 CrossRef CAS.
- H. Yoshioka, Y. Nojiri and S. Tanase, Ionic conductivity and fuel cell properties of apatite-type lanthanum silicates doped with Mg and containing excess oxide ions, Solid State Ionics, 2008, 179, 2165–2169 CrossRef CAS.
- P. Briois, C. Mazataud, S. Fourcade, F. Mauvy, J.-C. Grenier and A. Billard, Synthesis and characterization of apatite structure sputter deposited coatings dedicated to intermediate temperature solid oxide fuel cells, J. Electrochem. Soc., 2011, 158, B1479–B1484 CrossRef CAS.
- S. Chen, Z. Huang, C. Chen, P. Hu, J. Huang, Y. Jiang, L. Lu and Y. Xia, Analysis of the conduction mechanisms of the Ni doped apatite-Type lanthanum silicate electrolyte ceramics synthesized by the combustion method, Int. J. Appl. Ceram. Technol., 2021, 19, 1736–1745 CrossRef.
- O. Masson, A. Berghout, E. Béchade, J. Jouin, P. Thomas, T. Asaka and K. Fukua, Local structure and oxide-ion conduction mechanism in apatite-type lanthanum silicates, Sci. Technol. Adv. Mater., 2017, 18, 644–653 CrossRef CAS PubMed.
Footnotes |
| † Electronic supplementary information (ESI) available. See DOI: https://doi.org/10.1039/d2ra07088j |
| ‡ Current address: INM – Leibniz Institute for New Materials, 66123 Saarbrücken, Germany. |
| This journal is © The Royal Society of Chemistry 2023 |