
 Open Access Article
 This Open Access Article is licensed under a Creative Commons Attribution-Non Commercial 3.0 Unported Licence
Removal of trichloroethene by glucose oxidase immobilized on magnetite nanoparticles†
Mengyang Wanga,
Yao Huang *a and
Hui Liuab
*a and
Hui Liuab
aHubei Key Laboratory of Yangtze Catchment Environmental Aquatic Science, School of Environmental Studies, China University of Geosciences, Wuhan 430078, China. E-mail: huangyao@cug.edu.cn; Tel: +86-15972160186
bState Key Laboratory of Biogeology and Environmental Geology, China University of Geosciences, Wuhan 430078, China
First published on 18th April 2023
Abstract
To overcome the safety risks and low utilization efficiency of H2O2 in traditional Fenton processes, in situ production of H2O2 by enzymatic reactions has attracted increasing attention recently. In this study, magnetite-immobilized glucose oxidase (MIG) was prepared to catalyze the heterogeneous Fenton reaction for the removal of trichloroethene from water. The successful immobilization of glucose oxidase on magnetite was achieved with a loading efficiency of 70.54%. When combined with substrate glucose, MIG could efficiently remove 5–50 mg L−1 trichloroethene from water with a final removal efficiency of 76.2% to 94.1% by 192 h. This system remained effective in the temperature range of 15–45 °C and pH range of 3.6–9.0. The removal was slightly inhibited by different cations and anions (influencing degree Ca2+ > Mg2+ > Cu2+ and H2PO4− > Cl− > SO42−) and humic acid. Meanwhile, the MIG could be recycled for 4 cycles and was applicable to other chlorinated hydrocarbons. The results of reactive oxidative species generation monitoring and quenching experiments indicated that H2O2 generated by the enzymatic reaction was almost completely decomposed by magnetite to produce ·OH with a final cumulative concentration of 129 μM, which played a predominant role in trichloroethene degradation. Trichloroethene was almost completely dechlorinated into Cl−, CO2 and H2O without production of any detectable organic chlorinated intermediates. This work reveals the potential of immobilized enzymes for in situ generation of ROS and remediation of organic chlorinated contaminants.
1. Introduction
Trichloroethene (TCE) is a prevalent chemical substance that has diverse applications in industry, agriculture, medicine and other domains.1 However, due to unreasonable disposal and discharge, TCE has become one of the most commonly detected pollutants in aquatic environments2 TCE is highly toxic, suspiciously carcinogenic and has been reported to increase the risk of Parkinson's disease,1 which poses great jeopardizes to human health and the ecological environment.3Chemical oxidation has been successfully applied for the in situ and ex situ treatment of chlorinated organic solvents contaminated sites.4–6 Fenton oxidation using ferrous salts to catalyze the generation of ·OH from H2O2 has been extensively utilized for remediation of chlorinated hydrocarbons in water bodies due to its eco-friendliness and high removal efficiency.7,8 While traditional homogeneous Fenton oxidation process typically requires an acidic pH of approximately 3.0–4.0 and the efficiency diminished in near neutral water bodies.9 Meanwhile, H2O2 is caustic and explosive, posing a relatively large safety hazard in the process of storage, transportation and application.10 Besides, H2O2 is highly unstable and readily decomposes in the environment, resulting in low utilization in practice. Therefore, the actual amount of H2O2 added is usually much higher than the theoretical amount calculated based on the stoichiometric ratio.11
In recent years, in situ generation of H2O2 by electrochemical, photochemical and biological methods has garnered attention in water pollution remediation.11 Among them, bio-enzymatic methods exemplified by glucose oxidase (GOD) can be used for in situ generation of H2O2 under mild conditions with high efficiency.12,13 GOD can catalyze the reaction between oxygen molecules and substrate glucose to produce gluconic acid and H2O2, which would further form bio-Fenton systems with iron catalyst to efficiently degrade organic pollutants.14 Due to the iron-chelating effect of gluconic acid, it can enhance the efficiency of Fenton processes at neutral pH.15 In our previous work,12 Fenton-like system composed of glucose oxidase and ferrous salt has been used to effectively catalyze the degradation of aqueous TCE. We have also demonstrated that GOD/magnetite system efficiently improved the utilization efficiency of H2O2 when compared to the H2O2/magnetite Fenton system.16 However, the activity and stability of glucose oxidase in the free state are vulnerable to environmental factors (temperature, pH, etc.), limiting its practical application.
Enzyme immobilization has been demonstrated as one of the most direct and effective way to improve the activity and stability of enzymes.13,17 Among the immobilization carriers for enzymes, magnetite nanoparticles have attracted a lot of attention because of their convenience in preparation, modification and recycling as well as their low cost, large surface area and good environmental compatibility.18–20 Meanwhile, magnetite has also been used as a catalyst in heterogeneous Fenton to remove organic pollutants including TCE.21 The use of magnetite particles immobilized with glucose oxidase has been reported for catalyzing the Fenton reaction to remove yellow 12.22 However, magnetite nanoparticles are prone to aggregation and easily oxidized in air, leading to the loss of reaction activity.23,24 Meanwhile, the lack of functional groups on magnetite led to relatively low enzyme immobilization efficiency by simply physical adsorption.22 Chitosan is a polysaccharide with abundant amino groups derived from natural resources, which has been intensively studied for many industrial and biomedical applications.25 The modification of magnetite nanoparticles by coating with chitosan can not only protect magnetite particles from aggregation and oxidation but also provide abundant amino groups as functional sites for the immobilization of glucose oxidase via chemical crosslinking.26 However, the use of glucose oxidase immobilized on chitosan coated magnetite particles for the removal of chlorinated organic compounds has not been reported yet, and the mechanism involving generation and contribution of reactive oxidative species (ROS) remains unknown.
In this work, we established chitosan coated magnetite-immobilized glucose oxidase (MIG) as a heterogeneous Fenton system for the degradation of chlorinated organic compound with TCE as a model pollutant. We aimed to improve the utilization efficiency of H2O2 and avoid its safety risks of traditional Fenton system by in situ generation of H2O2, and improve the stability and activity of glucose oxidase under different environment conditions by immobilization on magnetite, which played double role as both immobilization matrix and Fenton catalyst. The TCE degradation efficiency and kinetics, as well as the influences of different environmental factors were investigated. In addition, the generation and contribution of various reactive oxidative species (ROS) for TCE degradation were investigated and possible degradation pathways were proposed. This work presents a potentially simple, efficient and sustainable method for in situ ROS generation and oxidative degradation of TCE, which would hopefully provide new ideas and technical support for remediation of organic pollutants.
2. Experimental
2.1 Materials
Chitosan (food grade, DAC degree: 86%, viscosity: 296 mPa s) was supplied by Zhejiang Golden-Shell Pharmaceutical Co., Ltd. Glutaraldehyde (25%), trichloroethylene and glucose oxidase (from Aspergillus niger, 100 U mg−1) were supplied by Shanghai Macklin Biochemical Co., Ltd. Ammonium ferrous sulfate dodecahydrate (NH4Fe(SO4)2·12H2O), ammonium ferrous sulfate hexahydrate ((NH4)2Fe(SO4)2·6H2O), glucose, 4-hydroxybenzoic acid, hydrogen peroxide (30% w/w), ammonium hydroxide (25%), sodium benzoate and other chemicals were purchased from Sinopharm Chemical Reagent Co., Ltd, China. All chemicals used were of analytical grade or above.2.2 MIG preparation and characterization
The preparation of magnetite nanoparticles and glucose oxidase immobilized on chitosan-coated magnetite (MIG) was based on previously reported works with minor modifications.26,27 The specific experimental details are provided in the ESI.† The loading amount of immobilized glucose oxidase was determined by measuring the concentration of glucose oxidase in the initial solution and all the rinsing solutions by using the Komas Brilliant Blue method.28X-ray crystal diffractometer (Bruker D8 Advance, Germany) was used to analyze the crystal structure of the material with a scanning speed of 2° min−1 and a scanning angle of 10°–80°. The chemical structure of MIG samples were analyzed by Fourier transform infrared (FT-IR) (Nicolet iS50 Thermo Fisher, Japan) spectroscopy using the KBr compression method. The test wavelength range was 4000–500 cm−1 with a resolution of 4 cm−1. Before test, the samples were ground into powder and vacuum-dried at 45 °C for 48 h. Two-dimensional morphology of the material was observed by a Scanning Electron Microscope (SEM) (SU8100 Hitachi, Japan). The freeze-dried MIG samples were sprayed with a thin layer of gold and the morphological structure was observed under an accelerating voltage of 10 kV.
2.3 Experimental method
The contribution of ROS was analyzed by quenching experiments following the fundamental parameters of the degradation experiments, except that different ROS quenchers of 50 U mL−1 superoxide dismutase (SOD) (for quenching O2˙−), 50 U mL−1 catalase (CAT) (for quenching hydrogen peroxide), 10 mM methanol (for quenching ·OH), 10 mM ethanol (for quenching ·OH and Fe(IV)30,31 was added separately before TCE solution was added. The TCE degradation kinetics in different ROS quenchers were then investigated.
To further examine the effect of degradation effect of MIG on other chlorinated hydrocarbons, experiments were conducted by substituting TCE in the reaction system with dichloromethane (DCM), 1,2-dichloroethane (1,2-DCA), 1,1,2-trichloroethane (1,1,2-TCA), trans-dichloroethylene (t-DCE), cis-dichloroethylene (c-DCE), tetrachloroethylene (PCE) and carbon tetrachloride (CT), respectively, with the same initial concentrations of 10 mg L−1.
2.4 Analytical methods
TCE concentrations and its possible degradation intermediates were determined and analyzed by gas chromatography-mass spectrometry with purge trap PT-GC-MS (PT: Atomx, Teledyne Tekmar, USA; GC-MS: Thermo Fisher Scientific Inc., USA). The purge program was set as the purge flow of 40 mL min−1, 11 min, 2 minutes thermal analysis, the analytical temperature at 190 °C. GC-MS was carried out with a capillary column DB-624 (30 m in length; 0.25 mm o.d.; 1.4 μm film thickness). The chromatographic conditions were as follows: 2 min at 35 °C, 5 °C min−1 to 100 °C, 10 °C min−1 to 200 °C, and 1 min at 200 °C. Helium was supplied as carrying gas at a flow rate of 1 mL min−1. The total analysis time was 26 min. Detection was performed with the mass spectrometer operating in scan mode, at 2.6 scan per s, with an ionization energy of 70 eV and source and quadrupole temperatures of 280 and 230 °C, respectively.For the determination of chloride ions in water, 1 mL of water sample was filtered through a 0.22 μm membrane and then mixed with 0.5 mL of methanol 0.5 m, which was filtered and injected into an ion chromatograph (925 Eco IC; Metrohm) for determination.
The determination of hydrogen peroxide concentration was performed by an I3− based spectrophotometric method.32 Solution A was a mixture of 400 mM potassium iodide, 50 mM sodium hydroxide and 170 μM ammonium molybdate tetrahydrate; solution B was 100 mM potassium hydrogen phthalate. In a 96-well plate, 10 μL of the sample to be measured was added to 100 μL of solution A and 100 μL of c solution B. The absorbance was measured at 350 nm on a microplate reader (Tecan, Infinite 200 PRO Nano Quant, Germany) within one minute, and the results were the average of five determinations.
To determine the concentration of ρ-HBA, the liquid samples were filtered through a 0.22 μm filter membrane. ρ-HBA concentration was determined by high performance liquid chromatography (Shimadzu LC-20AT, Japan) with a mobile phase of 0.1% aqueous trifluoroacetic acid and acetonitrile (65![[thin space (1/6-em)]](https://www.rsc.org/images/entities/char_2009.gif) :35, v/v) at a flow rate of 1 mL min−1 and a detection wavelength of 255 nm. The detection limit of p-HBA was 0.1 μM.
:35, v/v) at a flow rate of 1 mL min−1 and a detection wavelength of 255 nm. The detection limit of p-HBA was 0.1 μM.
3. Results and discussion
3.1 Fabrication and characterization of MIG
In the present work, a heterogeneous Fenton system composed of magnetite and the in situ generated H2O2 through the reaction between glucose and glucose oxidase was applied to eliminate chlorinated organic pollutant TCE. To optimize this system, we fabricated MIG material by immobilizing glucose oxidase on chitosan-coated magnetite through chemical crosslinking to enhance the enzyme activity under different environmental conditions. After crosslinking, the MIG material was separated from the initial solution by repeated rinsing in distilled water followed by centrifugation. The concentration of the glucose oxidase in the solution before and after immobilization as well as in the rinsing solutions was determined using the Komas Brilliant Blue method28 and a loading efficiency of 70.54% was achieved, corresponding to a GOD/magnetite ratio of 7.05 U mg−1. The residual enzyme content in the last rinsing solution was below 0.1% of the initial amount, indicating that most of the enzyme molecules existed as immobilized form.Fig. 1 depicts the XRD patterns of pristine GOD, the synthesized magnetite particles, chitosan-coated magnetite and MIG material. The magnetite, chitosan-coated magnetite and MIG all showed characteristic diffraction peaks at 18.3°, 30.4°, 35.6°, 43.49°, 53.9°, 57.4°, 63.0°, corresponding to the (111), (220), (311), (400), (422), (511) and (440) crystal planes of the magnetite crystal (standard card PDF 01-1111), respectively.33 The narrow and sharp peaks with high intensity and good crystallinity proved that the crystal structure of the synthesized material was mainly magnetite. Modification with chitosan and enzyme immobilization did not alter the magnetite crystal structure. In addition to the characteristic peak of magnetite, the diffraction peak of GOD also appeared at near 31.1° in the MIG sample, confirming the presence of GOD in MIG material.
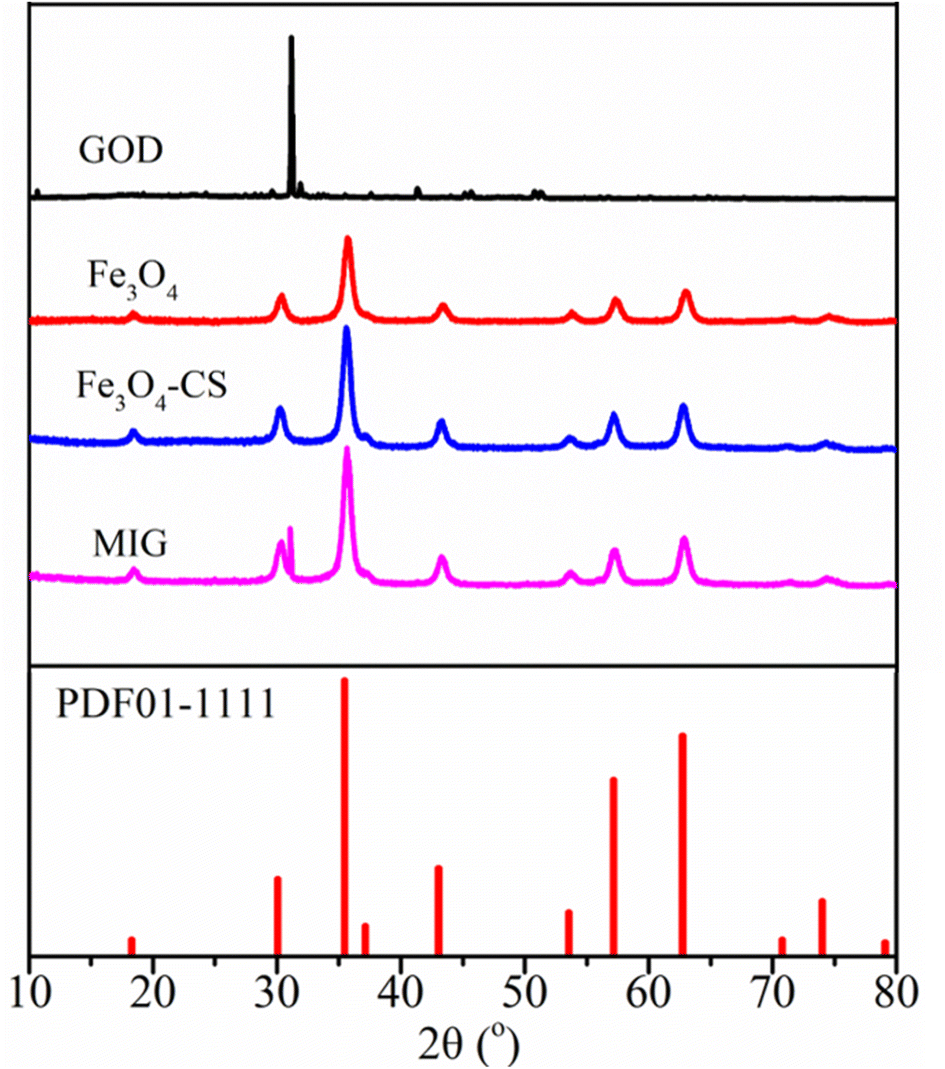 | ||
| Fig. 1 XRD patterns of free GOD, prepared magnetite, chitosan-coated magnetite and MIG. | ||
The chemical structure of the samples was also characterized by FT-IR spectra. As shown in Fig. 2, for magnetite, chitosan-coated magnetite and MIG, the characteristic absorption bands of Fe–O vibrations and surface hydroxyl functional groups of magnetite particles appeared at 582 cm−1 and 3420 cm−1, respectively. The characteristic bands of GOD at 3406 cm−1, 1641 cm−1 and 1156 cm−1 corresponded to the signals of hydroxyl functional group, amide I and carboxyl functional group, respectively.34 In the MIG sample, the characteristic peaks of magnetite and enzyme coexisted, verifying that GOD was successfully immobilized on the magnetite particles.
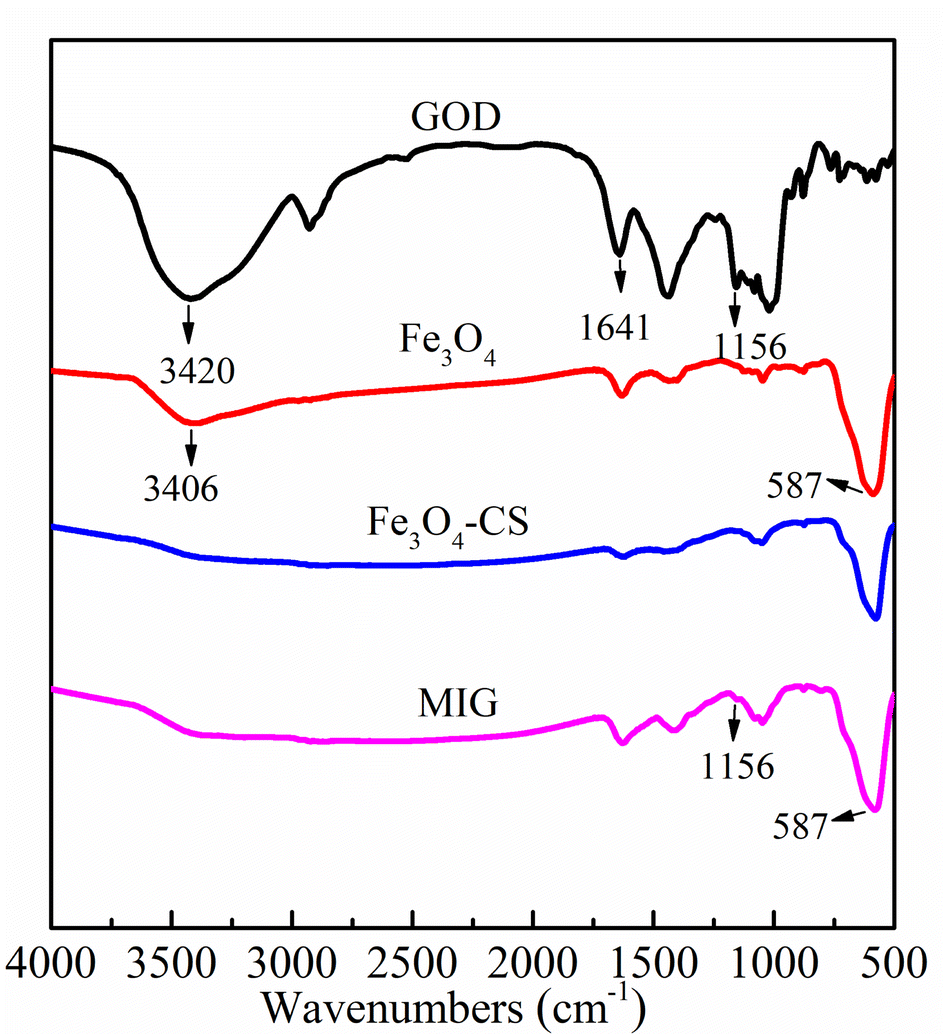 | ||
| Fig. 2 FT-IR spectra of free GOD, prepared magnetite, chitosan-coated magnetite and MIG. | ||
Fig. 3 shows the SEM photographs of magnetite particles and MIG. The magnetite particles prepared by the co-precipitation method appeared as irregularly spherical shape with a particle size of about 20–30 nm (Fig. 3a). The morphological specifications of magnetite particles after being modified by chitosan and immobilized with glucose oxidase did not change significantly (Fig. 3b), but the surface roughness of the particles decreased substantially, which may be caused by the surface of magnetite particles being wrapped by organic substances such as chitosan and enzymes, resulting in a decrease in the surface electrical conductivity.
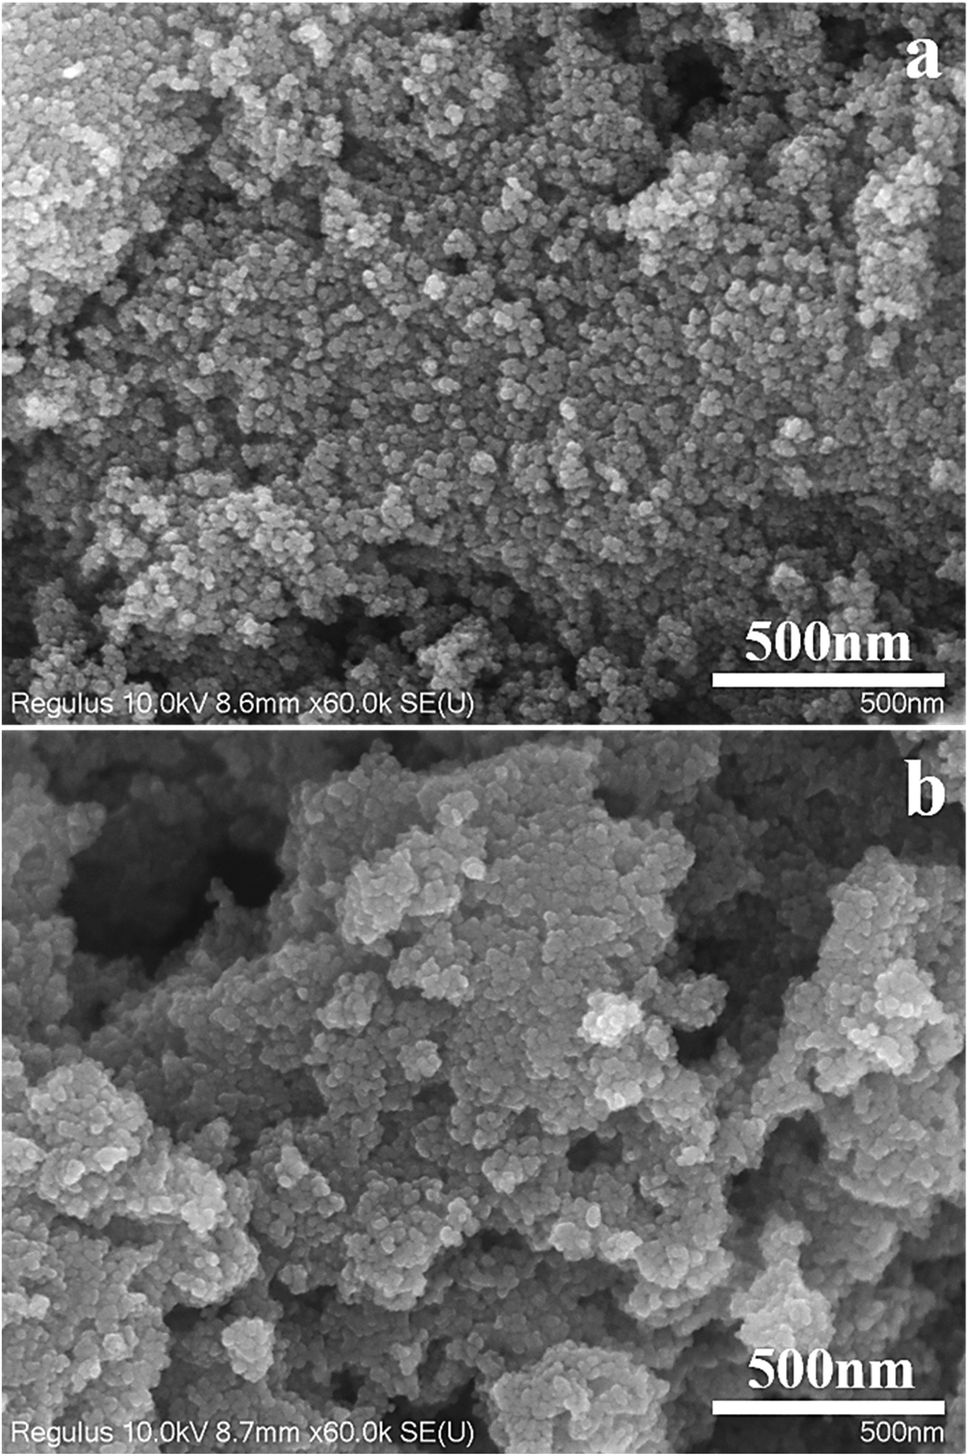 | ||
| Fig. 3 SEM images of prepared magnetite particles (a) and MIG (b). Scale bars are 500 nm. | ||
3.2 TCE degradation kinetics and influences of environmental factors
The kinetics of TCE degradation could be further described by a pseudo-first-order kinetic model as eqn (1) and (2).35
| ln(Ct/C0) = −kt | (1) |
|
t1/2 = ln2/k
| (2) |
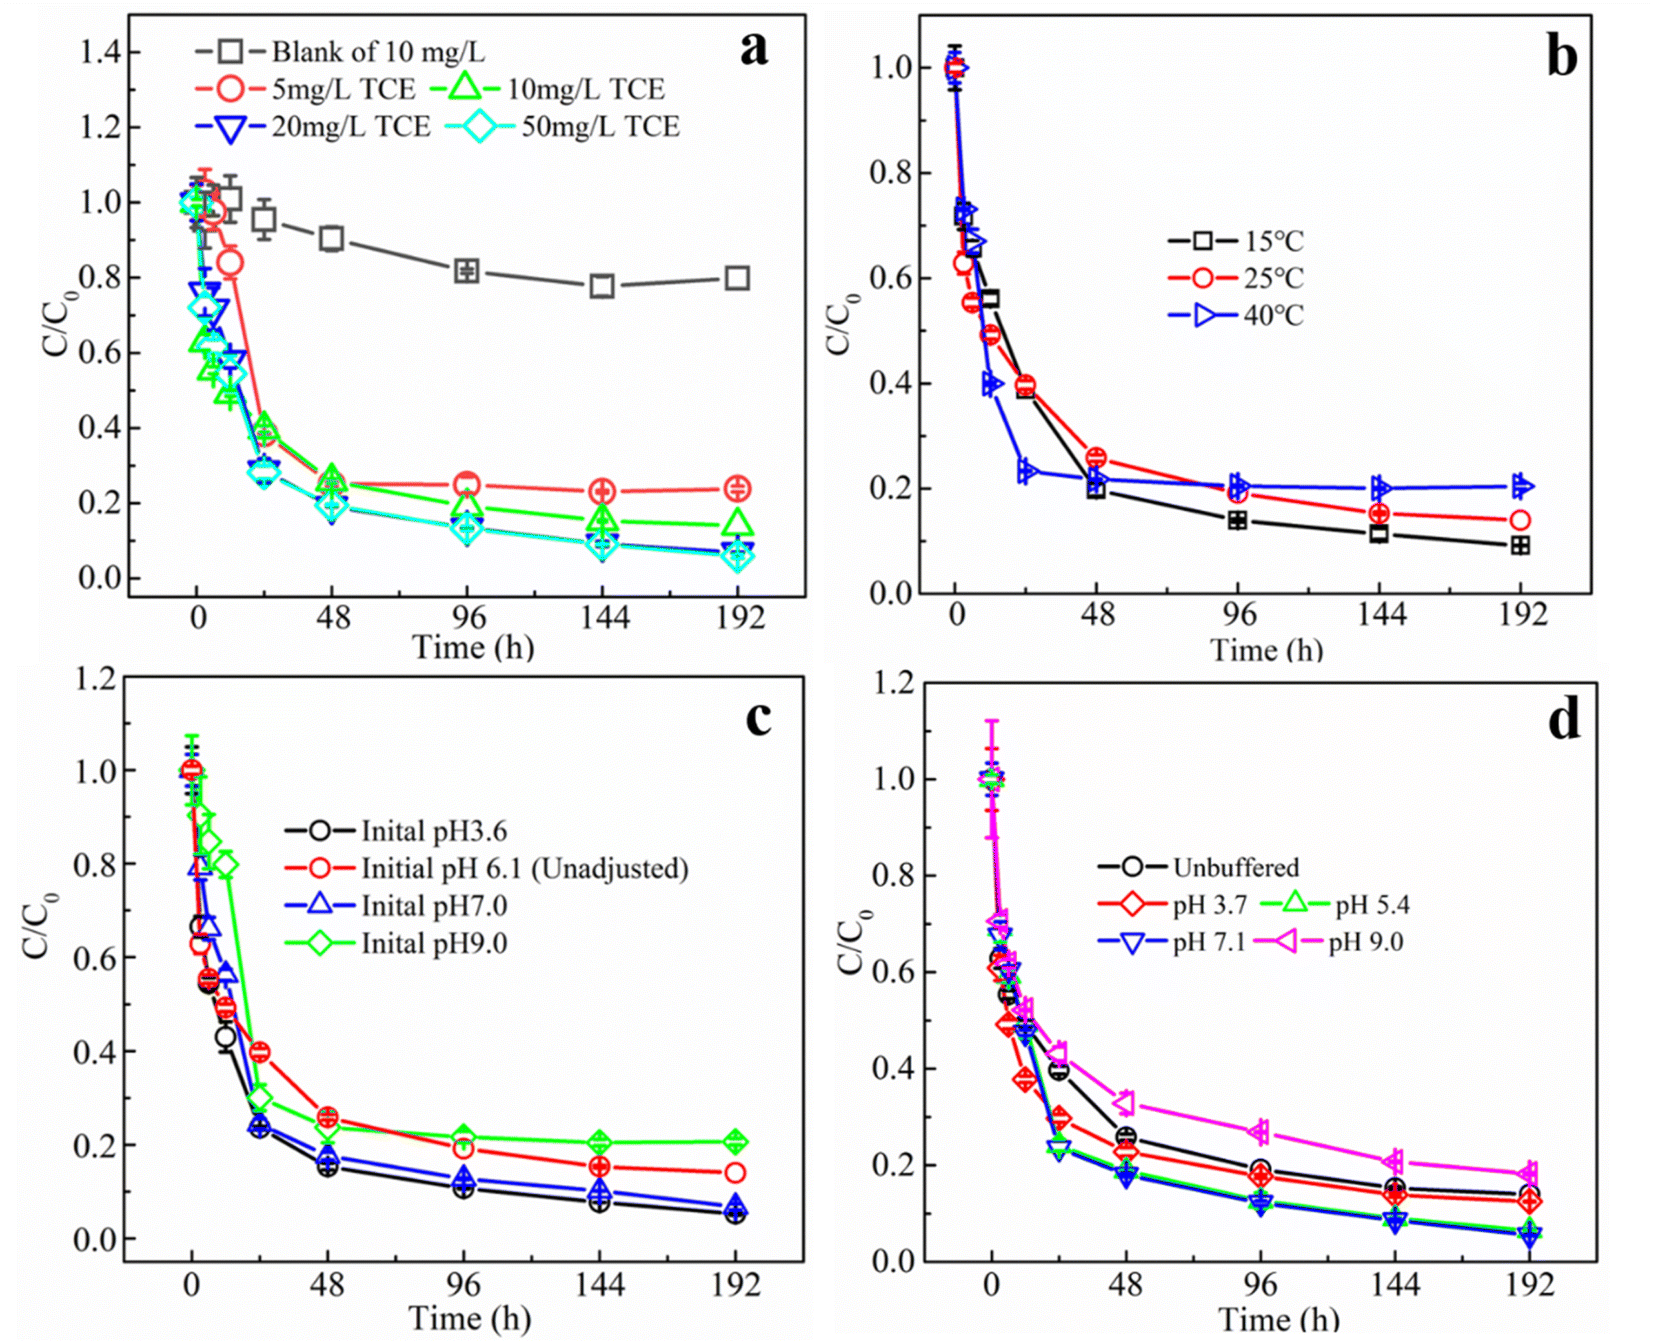 | ||
| Fig. 4 Degradation of TCE under different TCE initial concentrations (a), different temperatures (b) different initial pH (c) and in different pH buffering system (d). (SD, n = 3). | ||
As a biological agent, the stability and activity of glucose oxidase is strongly affected by environmental factors, especially pH and temperature. The optimum pH of GOD has been reported to be between 5.0 and 7.0 and the optimum temperature is between 25 and 60 °C, depending on the source of the enzyme. Meanwhile, the storage stability as well as efficient temperature and pH ranges would be significantly extended after proper immobilization.36,37 Fig. 4b shows the TCE degradation kinetics in MIG–glucose system at different temperatures. The removal rate of TCE increased slightly when the temperature was increased from 15 °C to 25 °C and 40 °C, and the reaction rate constant increased slightly from 50.34 × 10⁻³ h−1 to 62.62 × 10⁻³ h−1 and 71.54 × 10⁻³ h−1, respectively. The reaction reached equilibrium in almost 24 hours or so at 40 °C, while it took about 96 h at 15 °C. However, the overall differences in reaction rates and final removal efficiency were not significant. In general, the enzyme activity in the organism greatly increases with temperature within a suitable range, but over a certain temperature, the enzyme would be significantly inactivated due to thermal denaturation.13 While in the present work, during the temperature range of 15 to 40 °C, the performances of MIG in TCE removal were not significantly influenced, indicating its applicability in most environmental waters.
To investigate the effect of pH on the removal of TCE using MIG materials, degradation experiments were first conducted at different initial pH (3.6, 7.0 and 9.0), and the results are shown in Fig. 4c. Compared with other groups, the experimental group with pH 9.0 showed a slower rate of TCE degradation in the first 12 h, since Fenton reaction was favored in acidic conditions especially between 3 to 4.38 The TCE degradation rate constant decreased from 82.4 × 10⁻³ h−1 to 35.62 × 10⁻³ h−1 when initial pH increased from 3.6 to 9.0 (Table S1†) while the final removal efficiency was not significantly influenced. It is noteworthy that the initial pH of the reaction solution in the control group (pH unadjusted) was 6.1 and at the end of the reaction the pH dropped to 3.8. Also, the pH in all the groups gradually decreased to around 4 after reaction, resulting in little differences in the later degradation stages. This gradual decrease of the solution pH was ascribed to the accumulation of gluconic acid as an oxidative product of glucose in the presence of glucose oxidase.
To exclude the interference of gluconic acid, pH buffering solutions were used to further evaluate the influences of pH and the results are shown in Fig. 4d. TCE solutions with acetate buffered at pH = 3.7 and pH = 5.4 as well as with borate buffered at pH = 7.1 and pH = 9.0 were prepared for degradation, and the pH variations throughout the reaction were measured to be below 0.5. Similar to the unbuffered results in Fig, 4c, at initial degradation stages within 12 h, the degradation rate was slightly higher at pH buffered at 3.7 than other groups with a highest rate constant of 90.41 × 10⁻³ h−1 (Table S1†), but in the later stages the differences became smaller and the final removal efficiencies of TCE by 192 h at pH 3.7, 5.4, 7.1 and 9.0, were 87.5%, 93.5%, 94.4% and 81.8%, respectively. Compared to the unbuffered system (removal efficiencies of 86.0%), the TCE removal efficiencies at pH 5.4 and 7.1 were slightly higher, which was possibly due to the pH values were close to the optimum pH (5.5) of GOD from Aspergillus niger.39 When pH values deviate from optimum pH, the activity of enzymes would decrease gradually and eventually denature in extreme acidic and basic conditions.40 Many proteins are only active within a narrow pH ranges (usually 5–9).13 However, the applicable pH ranges of enzymes can be improved to some extent by proper immobilization. In the present study, the immobilized GOD demonstrated its applicability in TCE removal during the pH range of 3.7 to 9.0, which was suitable for most environmental waters.
Oxygen molecule is also one of the important substrates of the glucose oxidase reaction. 1 mol of glucose and 1 mol of oxygen are produced in equal ratio to 1 mol of H2O2 under the catalytic effect of GOD.13 In our previous study, we have found that the GOD-modified Fenton reaction is most effective for TCE degradation when the glucose concentration is close to the system O2 concentration.12 In the present study, the dissolved oxygen in this reaction system consisting of 25 mL headspace and 100 mL aqueous solution (O2 concentration calculated as 8.25 mg L−1 at 25 °C) was converted to a total oxygen concentration of about 2.7 mM in the aqueous phase. Therefore, the glucose concentration was set at a similar concentration of 2.5 mM. To evaluate the influence of DO values on the degradation of TCE, the aqueous medium was first anaerobically treated and then exposed to air for different time to achieve different DO values of 0, 3.45, 5.85, and 6.01 mg L−1. The DO value of 6.01 mg L−1 was the control group adopted in other experiments where additional air was injected at every sampling point. It can be seen from Fig. 5a that both the degradation rates and removal efficiencies of TCE increased significantly with the increase of initial DO. The rate constants were 20.97 × 10⁻³ h−1 when initial DO was 0, which increased to 62.62 × 10⁻³ h−1 at DO value of 6.01 mg L−1, while removal efficiencies at 192 h increased from 43.8% to 86%, correspondingly. The above results indicated that the concentration of oxygen played an important role in the TCE degradation. The reason why no higher initial DO values were achieved in this experiment was that the reaction between glucose and O2 was immediate in the presence of MIG, therefore by the time TCE was added, the DO value of the solution had already started to decrease. Fig. 5b shows the variations of DO values in the reaction vessels. In the experimental groups with initial DO of 0, 3.45 and 5.85 mg L−1, the DO value in the system dropped rapidly to 0 mg L−1 within 12 h due to its consumption by the enzyme reaction and did not rise any more since the molecular oxygen in the headspace can be used directly by GOD before being dissolved. The exhaustion of O2 would terminate the enzyme reaction which would produce H2O2 to be catalyzed by magnetite to degrade TCE. While in the group with initial DO of 6.01 mg L−1, additional air supply can maintain the DO value in the reaction vessels at around 1.5 mg L−1.
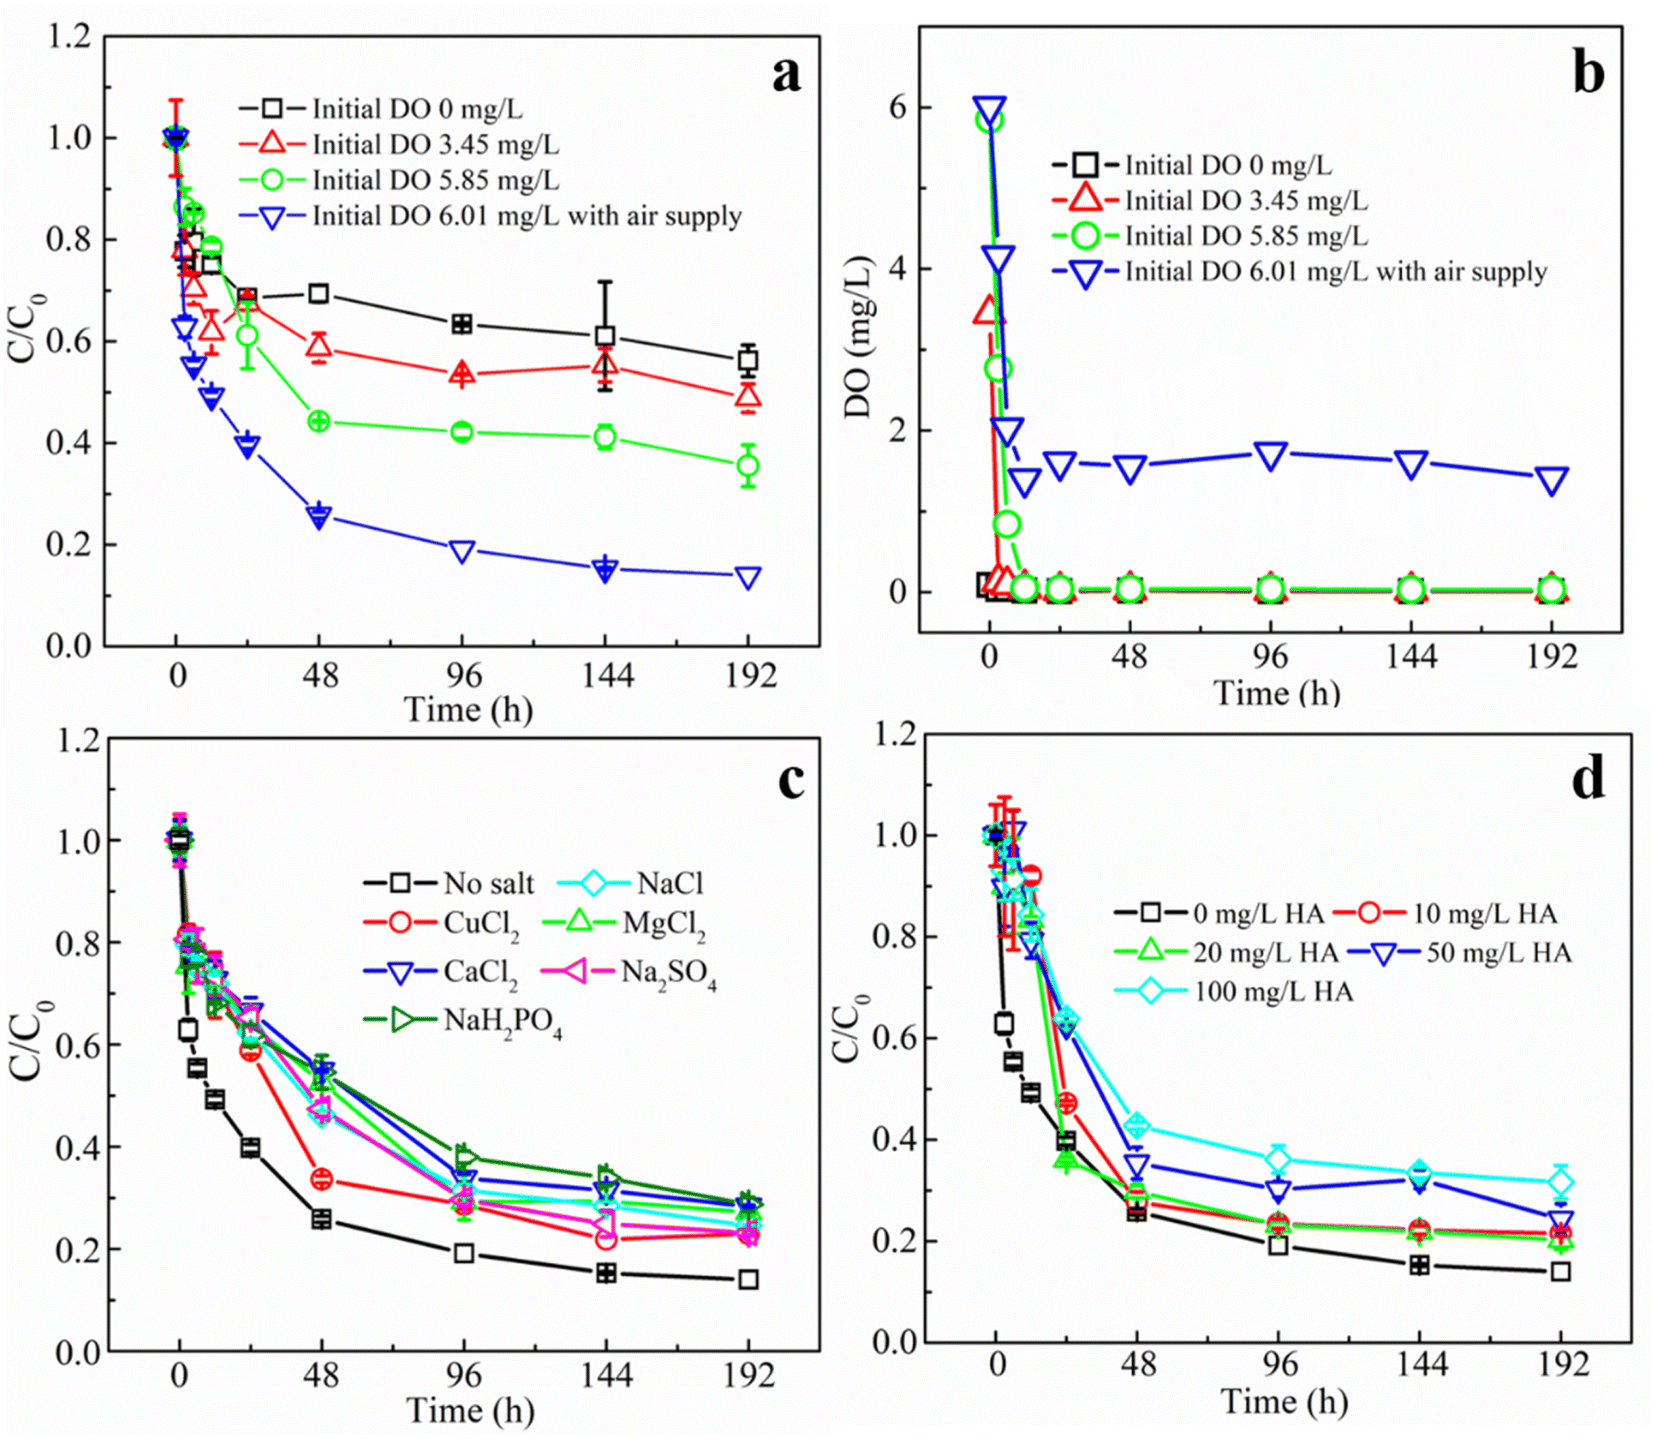 | ||
| Fig. 5 Degradation of TCE under different initial DO values (a) and variations of DO values over time (b); degradation of TCE in the presence of different anions and cations at a concentration of 2 mM (c) and the presence of HA at different concentrations (d). (SD, n = 3). | ||
Fig. 5c shows the effect of different species of anions and cations (including Cu2+, Mg2+, Ca2+, Cl−, SO42− and H2PO4− at a concentration of 2 mM) on the degradation of TCE by the MIG–glucose system. From the figure, it can be seen that the addition of different salts all showed slight inhibition effect on the degradation rates and final removal efficiencies of TCE. The degree of influence of cations on the degradation effect was Ca2+ > Mg2+ > Cu2+. Although Cu2+ has been reported to inhibit the activity of GOD significantly while Ca2+ and Mg2+ showed no effect.41 According to literature, Cu2+ can react with hydrogen peroxide, thus reducing the production of hydroxyl radicals.42 It has also been shown that Mg2+ has a significant inhibitory effect on the Fenton reaction.43 The effect of Ca2+ on the Fenton reaction has not been reported, and it was speculated that the precipitation may occur with the gluconic acid generated by the enzyme reaction, and the resulting precipitation might cover the surface of MIG and hinder its contact with TCE and therefore affecting its degradation. And the degree of influence of anions on the degradation of TCE is H2PO4− > Cl− > SO42−. It has been shown that the Fe(III)/H2O2 oxidation process is significantly weakened in the presence of Cl− and SO42− ions,44 because the formation of Cl− and sulfonyl–Fe(III) complexes reduces the rate of Fe(II) production. While H2PO4− reacts with iron ions to form FeH2PO4+ complexes, which are more stable and do not react with H2O2, thus reducing ·OH production and affecting the degradation of TCE.42
Apart from the above conditions, natural organic matter is another factor that may influence the TCE degradation. Fig. 5d shows the effect of different concentrations of humic acid (as a representative for natural organic matter) on the degradation of TCE using MIG. Obviously, the degradation rates and removal efficiencies of TCE gradually decreased with the increase of humic acid concentration. As the humic acid concentration increased from 0 mg L−1 to 100 mg L−1, the degradation rate constants decreased from 62.62 × 10⁻³ h−1 to 17.39 × 10⁻³ h−1 (Table S1†) and the final removal efficiencies decreased from 86.01% to 68.35%. It is generally believed that humic acid as an organic matter plays an important role as ·OH scavenger.45 Therefore, it may competitively consume ·OH and inhibit the degradation of TCE by ·OH and this inhibitory effect showed concentration dependence.
In summary, the MIG–glucose system could remain relatively high efficiency in degrading TCE under various conditions. Table 1 illustrates parallel comparison of the MIG–glucose system with other relevant Fenton systems regarding TCE degradation. The MIG–glucose system showed relatively high TCE removal efficiency at wider application pH due to the benefit of enzyme immobilization and iron-chelation capacity of the by-product gluconic acid.12 Moreover, to achieve similar TCE removal efficiency it significantly reduced the required amount of H2O2 by in situ generation through enzymatic reaction between GOD and glucose. Similar conclusions have also been reported by Chen et al.46 by discovering that multiple injections of low concentration H2O2 are more conducive to TCE degradation than directly adding high concentration of H2O2, since high concentration H2O2 decomposes rapidly in the environment before its full contact with the pollutant. Therefore, the MIG-system showed promising advantages over other analogues by significantly improving the H2O2 utilization efficiency to avoid waste and potential safety risks, which would possibly reduce the technical costs of Fenton oxidation for in-site remediation.
| Components | Catalyst dosage (g L−1) | H2O2 conc. (mM) | Initial TCE conc. | pH | Removal efficiency (%) | Ref. |
|---|---|---|---|---|---|---|
| Sewage sludge biochar/H2O2 | 0.5 g L−1 | 20 | 10 mg L−1 | 3.1–6.8 | 24–83% | 61 |
| Pyrite/H2O2 | 0.21–12.82 g L−1 | ≥125 | 0.53 mM | 3 | 97 | 62 |
| Magnetite/H2O2 | 1 g L−1 | 10–100 | 10 mg L−1 | Non-adjusted | 47.4–75.0 | 16 |
| Fe2+/GOD-glucose | 0.5 mM | 2.5 (glucose) | 10 mg L−1 | 3.6–6.0 | 40–70 | 12 |
| MIG-glucose | 2 g L−1 | 2.5 (glucose) | 10 mg L−1 | 3.7–9.0 | 81.8–94.4 | This work |
To further study the effect of degradation effect of MIG on other chlorinated hydrocarbons, experiments were conducted by substituting TCE in the reaction system with DCM, 1,2-DCA, 1,1,2-TCA, t-DCE, c-DCE, PCE and CT, respectively. Fig. S2† shows the degradation efficiency of MIG on different chlorinated hydrocarbon pollutants. As shown, the residual concentrations of pollutants in the blank group with only chlorinated hydrocarbon pollutants were above 80% after 48 h, which was caused by the loss of volatilization and re-equilibration after sampling. Previous studies showed that apart from TCE, Fenton oxidation was also effective for other chlorinated ethylene including PCE,47 t-DCE48 and c-DCE.49 In the present work, their removal efficiencies were 82.30%, 74.86% and 95.90%, respectively. CT can also be degraded by the superoxide produced during the Fenton reaction.50 The removal efficiency of CT by the MIG–glucose system at 48 h was 51.49%. It has been shown that the magnetite-catalyzed Fenton reaction has a good degradation effect on DCM but is strongly influenced by pH.51 The removal efficiency of DCM in the present reaction system was 41.63%, probably due to the effect of the initial pH in the system. The removal efficiency of 1,1,2-TCA and 1,2-DCA was negligible. As reported, Fenton oxidation is not efficient for some chlorinated alkane, such as tetrachloroethane and trichloroethane like 1,1,2-TCA.52,53 Although conventional Fenton reaction has been reported to effectively degrade 1,2-DCA, the degradation requires a large number of hydroxyl radicals and the degradation efficiency is highly dependent on the ratio of hydrogen peroxide to iron salts.54 In the present work, H2O2 generated in situ by enzyme system considerably reduced the required H2O2 amount for conventional Fenton oxidation, resulting in a low ratio of H2O2 to catalytic iron, leading to a negligible removal efficiency for 1,2-DCA. Overall, MIG–glucose system showed good ability to degrade PCE, t-DCE and c-DCE, moderate ability to degrade CT and DCM, but limited ability to degrade 1,1,2-TCA and 1,2-DCA.
3.3 Mechanisms of TCE degradation by MIG
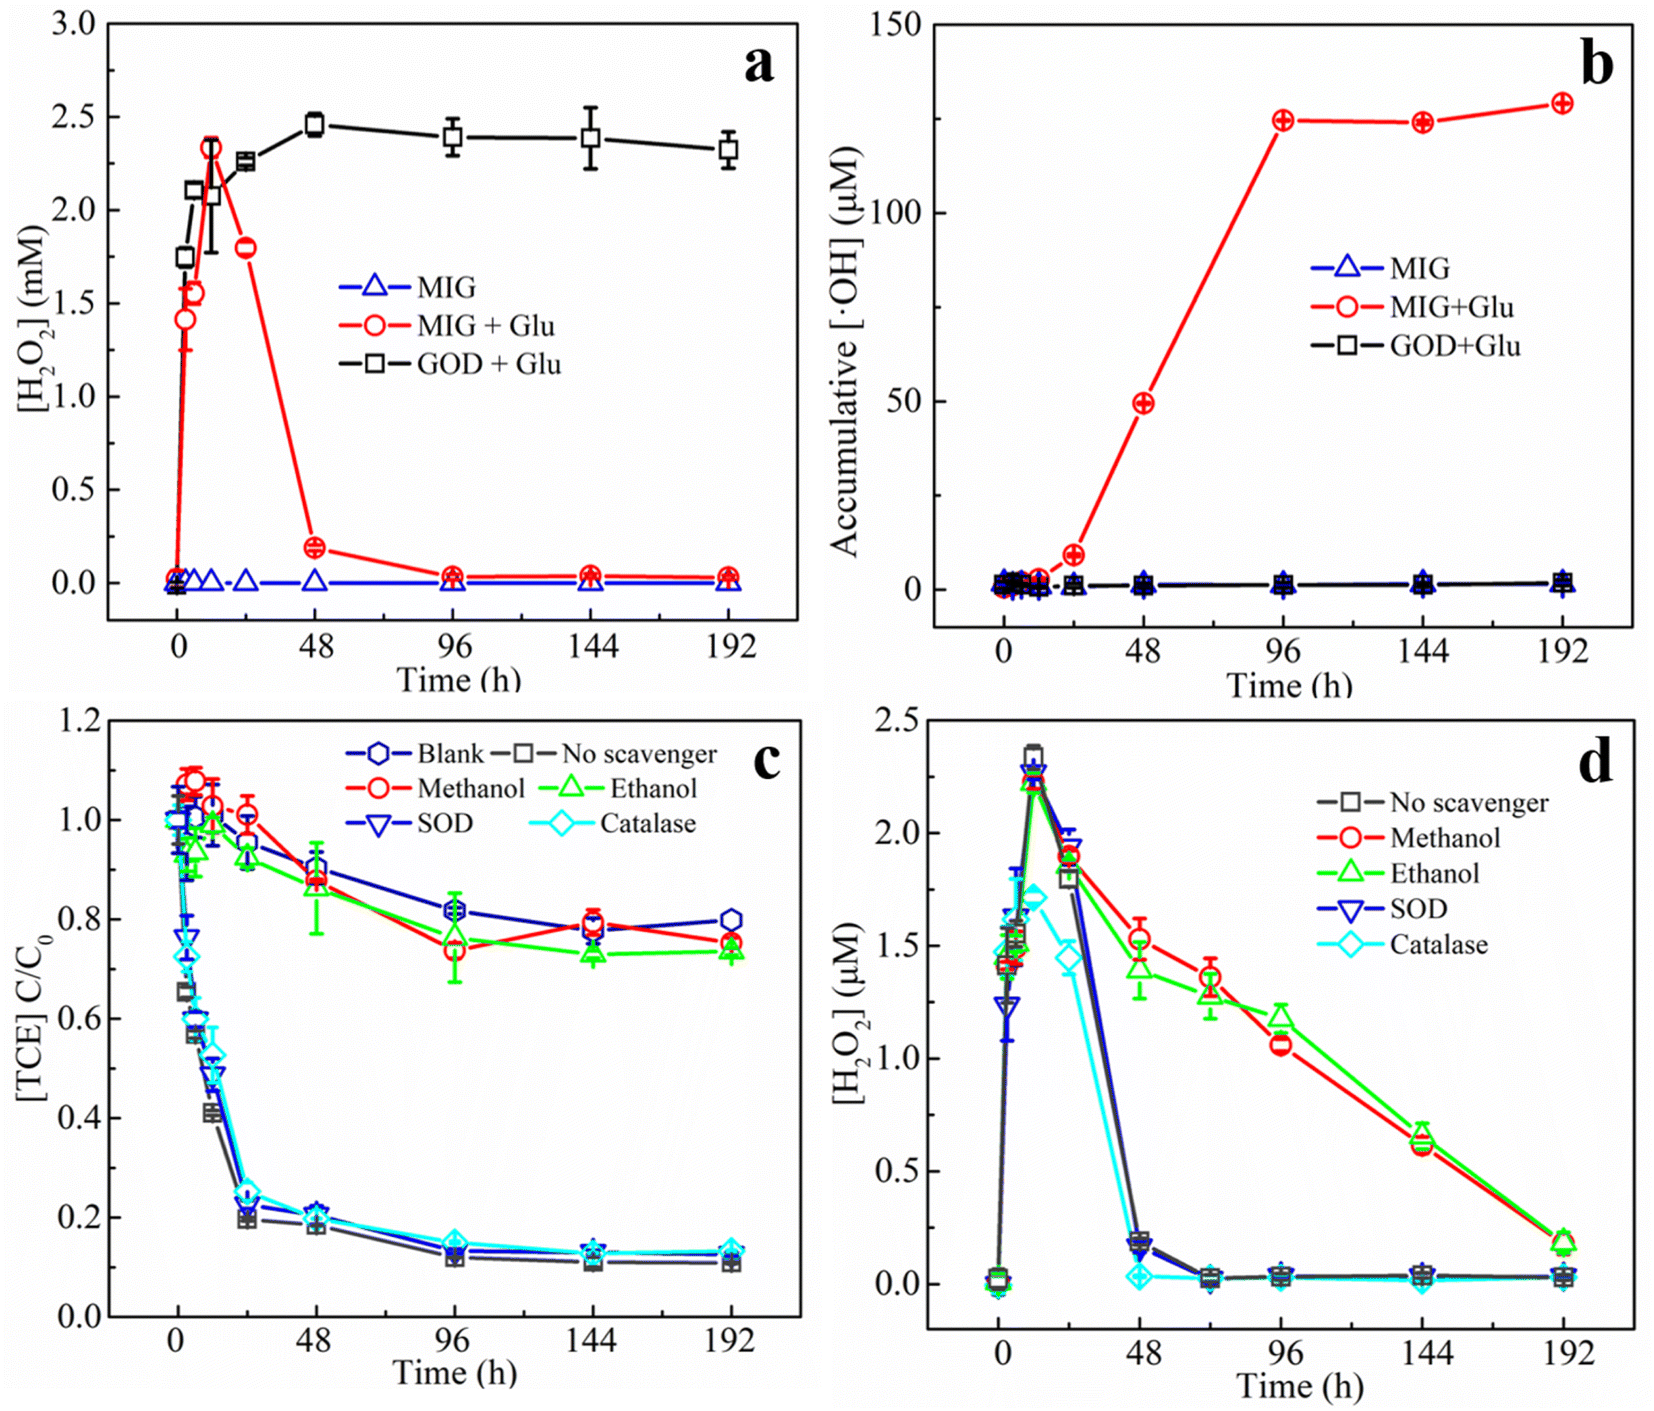 | ||
| Fig. 6 The production of H2O2 (a) and the cumulative production of ·OH (b); the influences of different ROS quenchers on the degradation of TCE (c) and the influences of different quenchers on H2O2 production (d). (SD, n = 4). | ||
In order to further verify the contribution of various possible ROS generated in the system to the degradation of TCE, superoxide dismutase (SOD), catalase (CAT), methanol, and ethanol were added as quenchers of superoxide anion (O2−), H2O2, ·OH, and ·OH + Fe(IV), respectively31 in the degradation experiments. Fig. 6c shows the effect of different quenching agents on the degradation of TCE. It can be seen that the addition of methanol and ethanol caused similarly significant inhibitory effect on the TCE degradation and the removal efficiency was almost the same as the blank group, while other quenchers hardly influenced the degradation process, suggesting that ·OH played the leading role in degrading TCE. This finding was consistent with TCE degradation reported in classical Fenton reaction.55 Considering that the addition of the above quenchers might influence the activity of GOD and therefore interfere the result of quenching experiments, we also monitored the H2O2 production in the presence of different quenchers (results shown in Fig. 6d). The generation of H2O2 within 12 h was not significantly influenced by the addition of different quenchers except that CAT slightly reduced the maximum concentration of H2O2 since CAT could catalyze the decomposition of H2O2. After 12 h, CAT accelerated the H2O2 decomposition and reached a zero point at 48 h while methanol and ethanol slowed down H2O2 decomposition and zero point was unreached by 192 h. Possible reasons are that methanol and ethanol played roles as ·OH scavengers, which is an important H2O2 consumer in Fenton oxidation process.55 In summary, the quenching agents resulted negligible influence on enzyme activity and therefore the quenching experiments could prove that ·OH played leading role for TCE degradation in the MIG–glucose system.
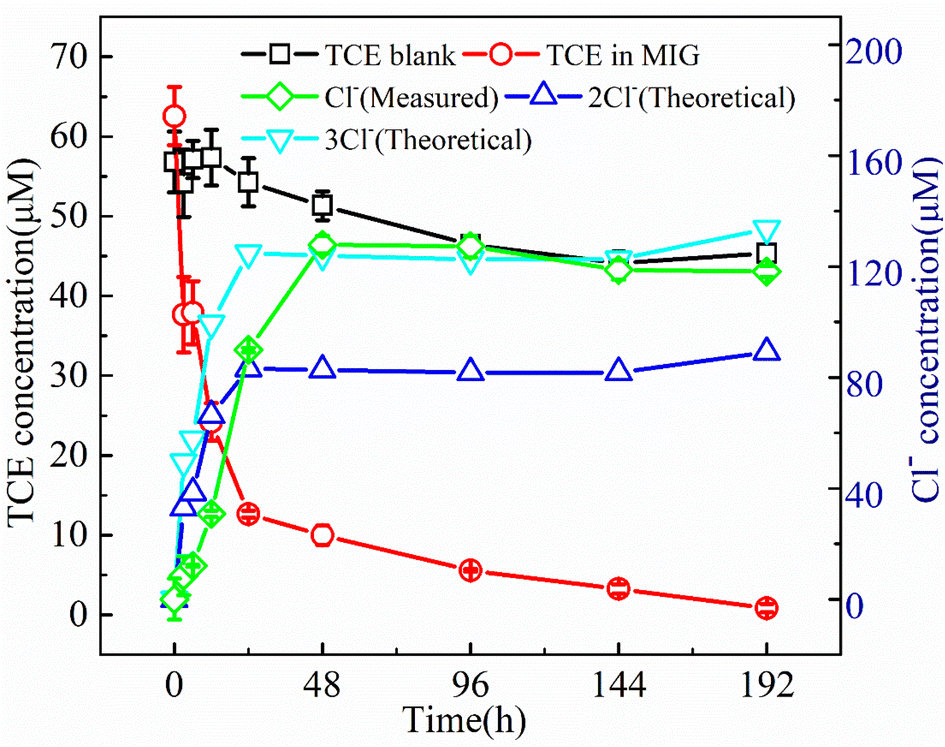 | ||
| Fig. 7 TCE degradation curve (red) and corresponding Cl− release curve (green), the theoretical 2-fold and 3-fold Cl− release curves (blue and cyan, respectively) were calculated based on the Cl− content of degraded TCE, which was determined by the difference between the degradation curve (red) and the blank control of TCE in water (black). (SD, n = 2). | ||
It should be noted that, in the present work, no volatile chlorinated byproducts were detected according to the results of GC-MS. Apart from the liquid phase, we also used GC-MS to detect the volatile compounds in the headspace of the reaction system and the corresponding chromatogram results are shown in Fig. 8. In the MIG–glucose system (Fig. 8a), a significant amount of CO2 was generated in the headspace over time. The peak intensity of CO2 increased slowly in the first 12 h and then increased rapidly from 12 to 48 h and changed hardly afterwards, corresponding to the rapid decrease of TCE during 12 to 48 h. As a result of TCE degradation in the liquid phase, the concentration of TCE in the headspace also decreased significantly as time proceeded and resulting in decreased peak signal in Fig. 8a. In the control group with only TCE added (Fig. 8b), the TCE peak intensity showed slight decrease at 192 h due to headspace volume change caused by sampling while the peak intensity of CO2 hardly changed over time. These results indicated that the biological Fenton reaction occurring in this system was able to degrade TCE to non-toxic and non-hazardous CO2, which was consistent with the reported degradation of TCE by Fenton reaction.7 According to literature, the degradation of TCE by ·OH was initiated by an addition of ·OH to a carbon–carbon double bond and formation of ·CCl2–CHClOH, followed by the formation of intermediate products such as small molecule organic acids, which eventually decomposed into CO2 and Cl−.7,59,60
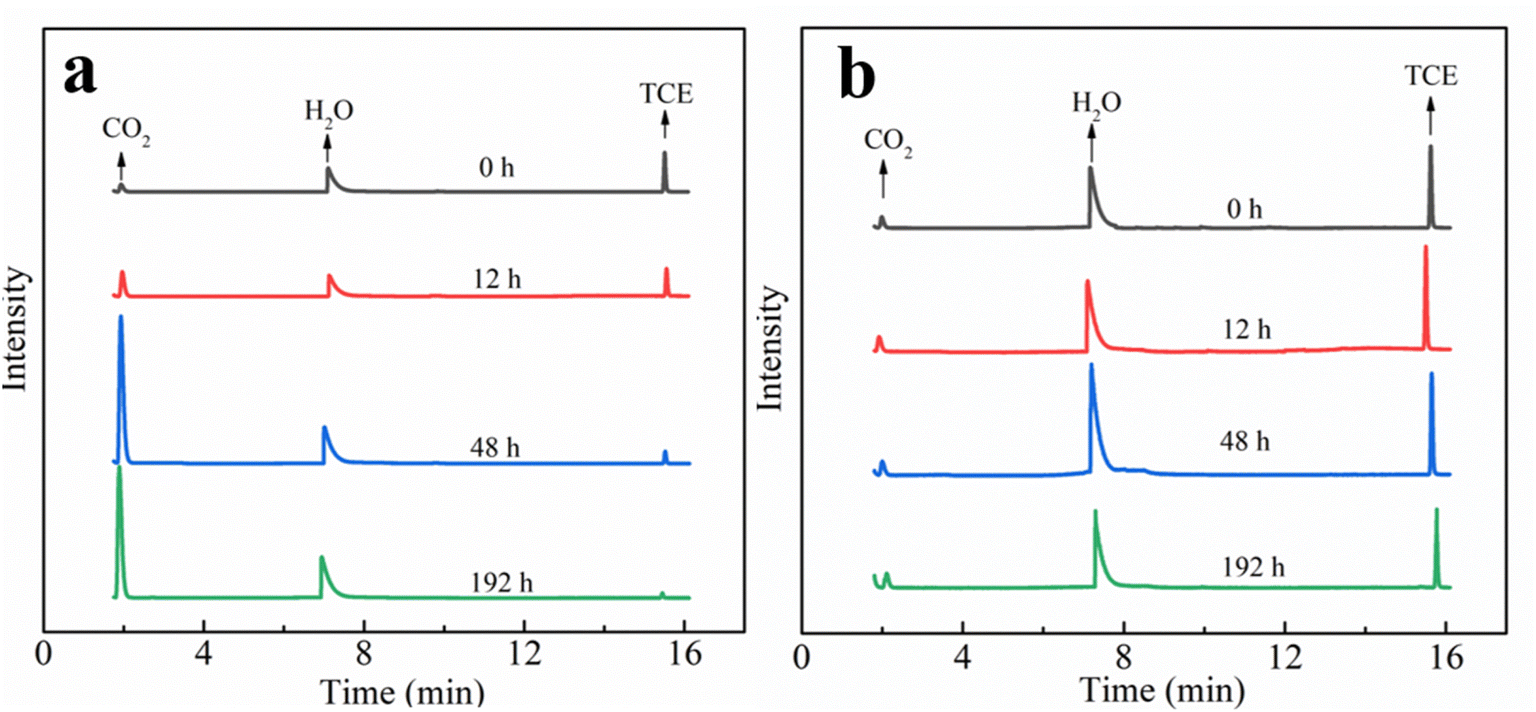 | ||
| Fig. 8 GC-MS chromatograms of the headspace sample in the TCE degradation vessel (a) and in the blank control of TCE in water (b). | ||
4. Conclusions
In this study, magnetite particles immobilized GOD was prepared by using chitosan as a coupling agent and its application in catalyzing Fenton oxidation to remove TCE by association with glucose was investigated. Characterization by XRD, FTIR, and SEM characterization showed that GOD was successfully loaded onto the magnetite particles. The GOD loading efficiency was about 70.54%. Batch experiments indicated that TCE was removed rapidly by the MIG–glucose system in the first 48 h, and about 86.01% of 10 mg L−1 TCE was removed by 192 h. The MIG remained effective in the temperature range of 15–45 °C and pH range of 3.6–9.0 for the degradation of TCE, and the influences of common ions and organic matter were investigated. Meanwhile, the recycling ability and applicability of MIG to other chlorinated hydrocarbons were also verified. The generation of H2O2 and ·OH confirmed the capability of in situ generation of ROS by this heterogeneous Fenton system. The ROS scavenging experiment indicated that ·OH played a major role in TCE degradation. The results of intermediates analysis revealed that this system was able to oxidize TCE almost completely into Cl−, CO2 and water without generation of other chlorinated intermediates. In summary, this work provides a sustainable technology for in situ ROS generation by using magnetite as both enzyme immobilization matrix and heterogeneous Fenton oxidation catalyst, which hopefully suggests new thoughts for remediation of chlorinated organic pollutants from environmental waters. However, in future work, the long-term stability under different environmental conditions needs to be further assessed and optimized to improve the technical and economic feasibility of the MIG–glucose system for practical application potential.Author contributions
Mengyang Wang: writing-original draft, investigation, data curation, methodology. Yao Huang: funding acquisition, conceptualization, supervision, writing-review & editing. Hui Liu: project administration, writing-review& editing.Conflicts of interest
There are no conflicts to declare.Acknowledgements
This work was supported by the National Natural Science Foundation of China (52103130) and the Natural Science Foundation of Hubei Province, China (2020CFB460).References
- B. R. De Miranda and J. T. Greenamyre, Environ. Sci. Processes Impacts, 2020, 22, 543–554 RSC.
- X. Yang, J. Cai, X. Wang, Y. Li, Z. Wu, W. D. Wu, X. D. Chen, J. Sun, S. P. Sun and Z. Wang, Environ. Sci. Technol., 2020, 54, 3714–3724 CrossRef CAS PubMed.
- P. Soderland, S. Lovekar, D. E. Weiner, D. R. Brooks and J. S. Kaufman, Advances in Chronic Kidney Disease, 2010, 17, 254–264 CrossRef PubMed.
- M. R. West, G. P. Grant, J. I. Gerhard and B. H. Kueper, Adv. Water Resour., 2008, 31, 324–338 CrossRef CAS.
- H. Weiying, L. Fei, L. Anhuai and L. Ximing, Disaster Adv., 2012, 5, 1179–1182 Search PubMed.
- A. Aranzabal, B. Pereda-Ayo, M. González-Marcos, J. González-Marcos, R. López-Fonseca and J. González-Velasco, Chem. Pap., 2014, 68, 1169–1186 CAS.
- G. Chen, G. E. Hoag, P. Chedda, F. Nadim and G. M. Dobbs, J. Hazard. Mater., 2001, 87, 171–186 CrossRef CAS PubMed.
- N. N. Mahamuni and Y. G. Adewuyi, Ultrason. Sonochem., 2010, 17, 990–1003 CrossRef CAS PubMed.
- S. Ravi, L. Lonappan, I. Touahar, E. Fonteneau, V. K. Vaidyanathan and H. Cabana, J. Environ. Manage., 2020, 270, 110899 CrossRef CAS PubMed.
- K. Xiao, K. Pei, H. Wang, W. Yu, S. Liang, J. Hu, H. Hou, B. Liu and J. Yang, Water Res., 2018, 140, 232–242 CrossRef CAS PubMed.
- A. Asghar, A. A. Abdul Raman and W. M. A. Wan Daud, J. Clean. Prod., 2015, 87, 826–838 CrossRef CAS.
- Y. Huang, H. Liu, S. Liu, C. Li and S. Yuan, Chemosphere, 2020, 253, 126648 CrossRef CAS PubMed.
- S. B. Bankar, M. V. Bule, R. S. Singhal and L. Ananthanarayan, Biotechnol. Adv., 2009, 27, 489–501 CrossRef CAS PubMed.
- K. Atacan, N. Güy, S. Çakar and M. Özacar, J. Photochem. Photobiol., A, 2019, 382, 111935 CrossRef CAS.
- D. K. Ahuja, L. G. Bachas and D. Bhattacharyya, Chemosphere, 2007, 66, 2193–2200 CrossRef CAS PubMed.
- W. Mengyang, H. Yao and L. Hui, Environ. Sci. Technol., 2022, 45, 124–129 Search PubMed.
- A. A. Homaei, R. Sariri, F. Vianello and R. Stevanato, J. Chem. Biol., 2013, 6, 185–205 CrossRef PubMed.
- M. Bilal, Y. Zhao, T. Rasheed and H. M. N. Iqbal, Int. J. Biol. Macromol., 2018, 120, 2530–2544 CrossRef CAS PubMed.
- K. Atacan and M. Özacar, Colloids Surf., B, 2015, 128, 227–236 CrossRef CAS PubMed.
- K. Atacan, B. Çakıroğlu and M. Özacar, Food Chem., 2016, 212, 460–468 CrossRef CAS PubMed.
- R. Matta, K. Hanna and S. Chiron, Sci. Total Environ., 2007, 385, 242–251 CrossRef CAS PubMed.
- S. Aber, E. Mahmoudikia, A. Karimi and F. Mahdizadeh, Water Air Soil Pollut., 2016, 227 CrossRef CAS.
- J. Xu, J. Sun, Y. Wang, J. Sheng, F. Wang and M. Sun, Molecules, 2014, 19, 11465–11486 CrossRef PubMed.
- W. Wu, Q. He and C. Jiang, Nanoscale Res. Lett., 2008, 3, 397 CrossRef CAS PubMed.
- H. Yi, L. Q. Wu, W. E. Bentley, R. Ghodssi, G. W. Rubloff, J. N. Culver and G. F. Payne, Biomacromolecules, 2005, 6, 2881–2894 CrossRef CAS PubMed.
- M. J. Chaichi and M. Ehsani, Sens. Actuators, B, 2016, 223, 713–722 CrossRef CAS.
- S. Naqvi, M. Samim, M. Abdin, F. J. Ahmed, A. Maitra, C. Prashant and A. K. Dinda, Int. J. Nanomed., 2010, 5, 983–989 CrossRef CAS PubMed.
- M. Saleemuddin, H. Ahmad and A. Husain, Anal. Biochem., 1980, 105, 202–206 CrossRef CAS PubMed.
- M. Tong, S. Yuan, S. Ma, M. Jin, D. Liu, D. Cheng, X. Liu, Y. Gan and Y. Wang, Environ. Sci. Technol., 2016, 50, 214–221 CrossRef CAS PubMed.
- C. R. Keenan and D. L. Sedlak, Environ. Sci. Technol., 2008, 42, 6936–6941 CrossRef CAS PubMed.
- M. Huang, T. Zhou, X. Wu and J. Mao, Water Res., 2017, 119, 47–56 CrossRef CAS PubMed.
- R. Sekar and T. J. DiChristina, Environ. Sci. Technol., 2014, 48, 12858–12867 CrossRef CAS PubMed.
- K. Yu, M. Zeng, Y. Yin, X. Zeng, J. Liu, Y. Li, W. Tang, Y. Wang, J. An, J. He and R. Yu, Adv. Eng. Mater., 2018, 20, 1700543 CrossRef.
- J. Lović, S. Stevanović, B. D. Anđelković, S. Petrović, D. Vuković, N. Prlainović, D. Mijin, N. Nikolić and M. Avramov-Ivić, Int. J. Electrochem. Sci., 2018, 13, 12340–12348 CrossRef.
- H. Che, S. Bae and W. Lee, J. Hazard. Mater., 2011, 185, 1355–1361 CrossRef CAS PubMed.
- M. Abbasi, R. Amiri, A.-K. Bordbar, E. Ranjbakhsh and A.-R. Khosropour, Appl. Surf. Sci., 2016, 364, 752–757 CrossRef CAS.
- H. Zhu, R. Srivastava, J. Q. Brown and M. J. McShane, Bioconjugate Chem., 2005, 16, 1451–1458 CrossRef CAS PubMed.
- Y. S. Jung, W. T. Lim, J. Y. Park and Y. H. Kim, Environ. Technol., 2009, 30, 183–190 CrossRef CAS PubMed.
- H. N. Bhatti, M. Madeeha, M. Asgher and N. Batool, Can. J. Microbiol., 2006, 52, 519–524 CrossRef CAS PubMed.
- S. Shoaebargh and A. Karimi, J. Environ. Chem. Eng., 2014, 2, 1741–1747 CrossRef CAS.
- Y.-h. Wu, L. Chu, W. Liu, L. Jiang, X.-y. Chen, Y.-h. Wang and Y.-l. Zhao, RSC Adv., 2017, 7, 47309–47315 RSC.
- L. Mingyu, W. Kunkun, T. Yilin, R. Gang and S. Lin, presented in part at the 2011 International Conference on Computer Distributed Control and Intelligent Environmental Monitoring, Changsha, February, 2011 Search PubMed.
- A. A. Vitale, E. A. Bernatene, M. G. Vitale and A. B. Pomilio, J. Phys. Chem. A, 2016, 120, 5435–5445 CrossRef CAS PubMed.
- J. D. Laat, G. T. Le and B. Legube, Chemosphere, 2004, 55, 715–723 CrossRef PubMed.
- M. Lindsey, Water Res., 2000, 34, 2385–2389 CrossRef CAS.
- G. Chen, G. E. Hoag, P. Chedda, F. Nadim, B. A. Woody and G. M. Dobbs, J. Hazard. Mater., 2001, 87, 171–186 CrossRef CAS PubMed.
- S. W. Leung, R. J. Watts and G. C. Miller, J. Environ. Qual., 1992, 21, 377–381 CrossRef CAS.
- M. Tobiszewski and J. Namiesnik, Environ. Sci. Pollut. Res., 2012, 19, 1994–2006 CrossRef CAS PubMed.
- Z. Qiang, W. Ben and C.-P. Huang, Front. Environ. Sci. Eng. China, 2008, 2, 397–409 CrossRef.
- Y. Lee, S. Bae and W. Lee, Korean J. Chem. Eng., 2012, 29, 769–774 CrossRef CAS.
- X. Jin, J. Su and Q. Yang, Environ. Technol., 2022, 43(28), 4504–4514 CrossRef CAS PubMed.
- L. Jiménez, R. Alzaga and J. M. Bayona, Int. J. Environ. Anal. Chem., 2002, 82, 415–430 CrossRef.
- R. J. Bigda, Chem. Eng. Prog., 1995, 91, 62–66 CAS.
- W. G. Jeong, J. G. Kim and K. Baek, J. Hazard. Mater., 2022, 428, 128253 CrossRef CAS PubMed.
- A. L. Teel, C. R. Warberg, D. A. Atkinson and R. J. Watts, Water Res., 2001, 35, 977–984 CrossRef CAS PubMed.
- S. Yuan, X. Mao and A. N. Alshawabkeh, Environ. Sci. Technol., 2012, 46, 3398–3405 CrossRef CAS PubMed.
- H. T. Pham, K. Suto and C. Inoue, Environ. Sci. Technol., 2009, 43, 6744–6749 CrossRef CAS PubMed.
- N. Kang, I. Hua and P. S. Rao, Chemosphere, 2006, 63, 1685–1698 CrossRef CAS PubMed.
- Y. Liu, Y. Gan, A. Zhou, C. Liu, X. Li and T. Yu, Chemosphere, 2014, 107, 94–100 CrossRef CAS PubMed.
- D. Jia, S. P. Sun, Z. Wu, N. Wang, Y. Jin, W. Dong, X. D. Chen and Q. Ke, J. Hazard. Mater., 2018, 346, 124–132 CrossRef CAS PubMed.
- Y.-F. Huang, Y.-Y. Huang, P.-T. Chiueh and S.-L. Lo, Chemosphere, 2020, 249, 126139 CrossRef CAS PubMed.
- H. Che, S. Bae and W. Lee, J. Hazard. Mater., 2011, 185, 1355–1361 CrossRef CAS PubMed.
Footnote |
| † Electronic supplementary information (ESI) available. See DOI: https://doi.org/10.1039/d3ra01168b |
| This journal is © The Royal Society of Chemistry 2023 |