DOI:
10.1039/D3RA01155K
(Paper)
RSC Adv., 2023,
13, 11967-11981
Periodic and quasi-periodic one-dimensional phononic crystal biosensor: a comprehensive study for optimum sensor design
Received
20th February 2023
, Accepted 10th April 2023
First published on 17th April 2023
Abstract
The resonant acoustic band gap materials have introduced an innovative generation of sensing technology. Based on the local resonant transmitted peaks, this study aims to comprehensively investigate the use of periodic and quasi-periodic one-dimension (1D) layered phononic crystals (PnCs) as a highly sensitive biosensor for the detection and monitoring of sodium iodide (NaI) solution. Meanwhile, a defect layer is introduced defect layer inside the phononic crystal designs to be filled with NaI solution. The proposed biosensor is developed based on the periodic PnCs structure and quasi-periodic PnCs structure. The numerical findings demonstrated that the quasi-periodic PnCs structure provided a wide phononic band gap and a large sensitivity compared to the periodic one. Moreover, many resonance peaks through the transmission spectra are introduced for the quasi-periodic design. The results also show that the resonant peak frequency changes effectively with varying NaI solution concentrations in the third sequence of the quasi-periodic PnCs structure. The sensor can differentiate between concentrations ranging from 0 to 35% with a 5% step, which is extremely satisfying for precise detection and can contribute to a variety of issues in medical applications. Additionally, the sensor provided excellent performance for all the concentrations of the NaI solution. For instance, the sensor has a sensitivity of 959 MHz, a quality factor of 6947, a very low damping factor of 7.19 × 10⁻⁵, and a figure of merit of 323.529.
1. Introduction
PnCs are artificial periodic structures that are applied to regulate sound wave propagation.1,2 The phononic band gap, which prevents sound waves from passing through the lattice, represents the most significant feature of PnCs.3,4 The tunability of the phononic band gaps (PnBGs) is significantly connected with the mechanical properties of the PnCs constituent materials.5,6 Therefore, these innovative structures have recently received a lot of attention due to the structures' capability of controlling sound waves.7,8 For example, PnCs are utilized in different applications in engineering, including liquid sensors, waveguides seismic wave reflection, acoustic cloaking, sensors, temperature sensors, filter multiplexer devices, actuators, systems of heat isolation, and the creation of acoustic metamaterials.9–12
Nowadays, the creation of acoustic sensors as a special framework for liquid sensing purposes is one of the most fundamental uses of PnCs. The use of PnCs-based sensors, liquid types, concentrations, and physical features can be identified and sensed. For example, a sensitive biosensor, which measures the temperature of methyl nonafluorobutyl ether (MNE) in the range of 10 to 40 °C utilizing a two-dimensional triangular lattice solid/fluid phononic crystal (PnCs), is demonstrated.13,14 A new sensor platform based on a PnCs cavity is created by R. Lucklum et al. to identify the qualities of gasoline.13,14 Sensors, in general, represent an integral part of all technological applications. Conducting an interdisciplinary study is, therefore, essential to develop sensors in engineering, physics, chemistry, and biology. A unique sensor platform is the creation of sensors based on the changes in the acoustic properties of liquids, such as density and sound speed. These properties vary more significantly than other properties like the refractive index in photonic crystals and plasmonic sensors.15,16 Physically, acoustic properties change more than the refractive index in photonic crystals and plasmonic sensors as the sound waves have longer wavelengths compared with visible light, allowing them to interact on larger scales with the material. The mechanical characteristics of the material, such as density, ultrasonic velocity, elasticity, and porosity, have a significant impact on these interactions.16–18 In contrast, the refractive index mainly depends on the material's electronic properties, which are less sensitive to changes in composition or structure. Hence, acoustic properties are more sensitive to changes in the material's composition or structure, leading to more significant changes in photonic crystals and plasmonic sensors.16–18 The term “biosensor” refers to a device that transforms biological signals into electronic or mechanical impulses. Based on the ongoing changes in their physical properties, many liquids, and biomaterials, such as acidity, hydrogen peroxide, blood glucose, as well as heavy metals pollution in water, can be examined and detected by using various types of biosensors.19,20 Sensors are produced based on the modification of several physical properties, such as sound speed and viscosity to achieve these sensing applications. The ability to produce a sensor based on its acoustic properties has recently attracted considerable attention in various fields.3,4 Different types of structures and designs were introduced to create acoustic sensors. For example, Zubtsov et al. have developed a PnCs sensor, which is capable of detecting the level of a water/1-propanol solution.21 In this regard, a 1D PnC structure is designed as a biosensor for estimating acetone concentrations in water.22 Also, a novel design for a very sensitive water–ethanol mixture sensor based on PnCs is proposed.23 A sensor, which is effective in identifying and measuring the physical characteristics of biodiesel is also proposed. Another sensor for the detection of an ethanol–water mixture, as well as 1D biosensors, a 2D PnCs sensor is described.23
Recently, the inclusion of quasiperiodic arrangements inside PnC designs received significant interest. In this context, the utilization of quasiperiodic sequences through PnC structures has attracted more attention in different experimental and theoretical PnCs studies due to their remarkable effects, such as their extended and multiple PnBGs.22–24 In addition, the appearance of strong resonances is highly expected, unlike the periodic PnCs that need for breaking the structure periodicity to generate such resonance.24–26 For instance, by adding a cavity inside the PnCs, the periodicity of the structure was broken, and some resonance modes could be introduced through the PnBGs. Quasiperiodic structures lack translational symmetry with special ordering patterns that provide more design flexibility and control of the features of the structure. Several different rules, including Cantor, Dodecanacci, Fibonacci, Rudin Shapiro, and others, can be applied to create quasiperiodic sequences.27,28 To create wide PnBGs, quasiperiodic structures may be more efficient than periodic ones. Moreover, it also possible to introduce waveguides and cavities in the quasiperiodic PnCs to generate and modify the characteristics of the resonant modes. So far, solid–solid and solid–fluid combinations have been considered through the designs of quasiperiodic structures in 1D and 2D PnCs.27–30 Therefore, the quasi-periodic PnCs seem to be attractive candidates for overcoming the low-frequency restrictions of acoustic structures. Meanwhile, the Fibonacci sequence is considered one of the most significant and well-known contributors in quasiperiodic PnCs structures27,28 These quasi-periodic PnCs offer self-likeness energy spectrum, localization, as well as efficient and tunable PnBGs.27,28
Therefore, we aim in this study to investigate the sensing of the NaI solution based on the localization of some resonance frequencies in 1D defective quasiperiodic PnC structures. We believe that this strategy could provide some considerable advantages compared to the periodic PnC structures. This study focuses on a NaI solution as a sensing liquid, which is an essential bio-liquid. It is perhaps worth mentioning that NaI solutions are utilized in a variety of medical and industrial settings because they prevent and treat iodine insufficiency brought on by inadequate nutrition or absorption in the body.31–34 Additionally, they can be utilized to treat a few physiological conditions, such as thyroid problems. Iodine is necessary for the body to develop more healthfully. Also, NaI may be recommended for people who cannot acquire enough iodine from their typical diet or who require extra iodine. The thyroid gland needs iodine to operate properly.34–37 Iodine deficiency can cause thyroid issues, mental health issues, hearing loss, and goitre. Iodine deficiency instances can present as goitre in adults and adolescents, as well as subclinical hypothyroidism in newborns. In addition to goitre, a lack of iodine can result in mental underdevelopment, hearing loss, and other neurological abnormalities, as well as short stature from thyroid insufficiency throughout fetal and early development.34,38,39 Accordingly, the slightest variation in the concentration of the NaI solution must be measured. Thus, this study aims to develop an acoustic NaI solution sensor based on a unique PnCs quasi-periodic structure with excellent performance.
In this study, the transmission spectra of a 1D PnCs sensor are considered to determine how the variations in the NaI solution concentration have an impact on them. To this end, the transfer matrix method (TMM) is adopted. To accurately differentiate between the NaI solution concentrations, a periodic and quasi-periodic multilayer PnCs structure has been introduced. For each concentration, the sensitivity (S), quality factor (QF), and figure of merit (FOM) sensor performance metrics were evaluated and recorded. The results are expected to provide a simple method to identify varying NaI solution concentrations using inexpensive, flexible components with no lead time sensing application. The proposed sensors are ideal compared to electrical or optical sensors because they do not have any electronic components in their structure and can operate in extreme conditions at high temperatures.
2. Structure's design and methods
2.1. 1D-DPC liquid sensing design
In this work, the periodic and quasi-periodic PnCs structures are investigated as a biosensor to the NaI solution. With the development of the resonance peaks mode inside the PnBG, the detection procedure could be verified. In this regard, the construction of the periodic PnCs structure is essentially based on two layers of lead and epoxy, that are repeated N times, then a defect layer is inserted in the center of the structure such that, [(lead/epoxy)2(NaI solution)(lead/epoxy)2]. Then, the defect layer is filled with the NaI solution. As illustrated in Fig. 1(a), the length of each unit cell, or the lattice constant, is given as a = d1 + d2, where d1 and d2 are the corresponding thicknesses of the first and second layers i.e., lead and epoxy, respectively. Here, lead and epoxy have thicknesses of 1 μm and 0.5 μm, respectively. Table 1 lists the acoustic properties of the construction materials.40,41 Due to the large acoustic mismatch between lead and epoxy, a wide PnBG can be produced.40,41 At the interface between each pair of layers in the structure, the incident acoustic waves are dispersed accordingly. In the case of constructive interference, the PnBGs are created.42,43 On the contrary, in the case of destructive interference, a transmission band is formed.44,45 The utilized factors as input variables, which were employed to illustrate an attempt of sensing NaI solution, are the acoustic properties of the built layers and the solution-filled layer. The PnCs structure, as depicted in Fig. 1(a), is periodic, causing regular variations in the acoustic properties of the structural layers, i.e., acoustic sound speed and density. The second design is a quasiperiodic 1D PnCs structure. It consists of a multilayer stack made of epoxy and lead, as depicted in Fig. 1(b). The stacking rule, which is discussed in detail in the structure analysis section, is used to create the quasiperiodic PnCs structure. To introduce periodic structures with extraordinary ordering patterns and an additional degree of freedom in the construction and control of the structure's properties, quasiperiodic structures must be lacking translational symmetry.46,47 Therefore, the acoustic wave has more freedom inside these structures, and its ability to travel through them is, thus, increasingly attenuated.46,48 The quasiperiodic PnCs design is configured as [ABADABA], where (A) refers to lead, (B) denotes epoxy, then (D) denotes the defect layer. To study the quasiperiodic PnCs structure as a biosensor to NaI solution, the NaI solution's defect layer is required to be surrounded by Fibonacci quasi-periodic structures from both sides.
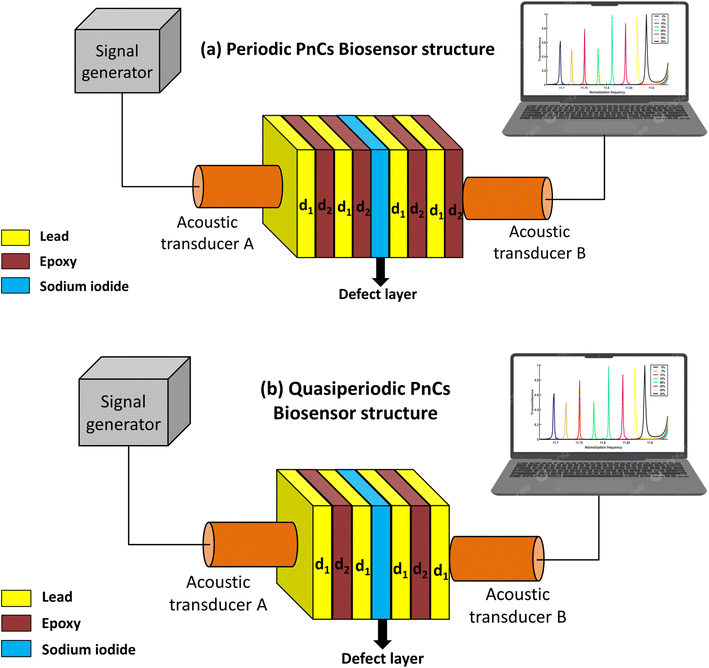 |
| | Fig. 1 Schematic representation of the experimental setup of the designed PnC biosensor for both, (a) the 1D periodic PnC biosensor and (b) the 1D quasiperiodic PnC biosensor. | |
Table 1 Mass densities and sound speeds of the suggested materials for the PnCs structure's construction
| Material |
Mass density ρ × 103 (kg m−3) |
Sound speed c (m s−1) |
| Lead |
11.400 |
1960.12 |
| Epoxy |
1.18 |
2539.518 |
| Water |
0.998 |
1483 |
| NaI |
Concentration-dependent |
Concentration-dependent |
2.2. Materials, fabrication considerations, and experimental setup
This subsection introduces a brief survey of the experimental setup of the designed sensors. The PnC micro periodic structures have received considerable attention, particularly in relation to their fabrication techniques during the last three decades. Photopolymerization, photo-lithographic, material jetting, powder bed fusion, and filament extrusion have been widely considered for the fabrication of PnC structures.49–54 More specifically, the photo-lithographic procedure is a simple and accurate technique, which is used to substantiate the experimental verifications of the 1D PnC structures.50 In this regard, Malfanti et al. have experimentally investigated the propagation of acoustic surface waves through 1D PnCs.50 They utilized the photo-lithographic procedure for the grooving of the PnC constituent layers on a substrate of fused silica. Then, the transmissivity of the structure is obtained with the help of two acoustic transducers, as shown in Fig. 1. In this context, a signal generator, which can pass on a power amplifier, is attached to the first transducer before the arrival of the electric signal through the transducer. Finally, the second transducer plays the role of the transmitter to record the structure's transmittivity with the help of a computing system.
2.3. Transfer matrix method (TMM)
Periodic and quasiperiodic PnCs structures have recently attracted considerable attention due to their efficient performance in sensing applications.47,55,56 Acoustic sound waves are passed through the multilayer PnCs structures. Some acoustic sound waves are reflected, while others are transmitted to the output of PnCs. The transfer matrix method (TMM) is used for calculating the transmission spectra of the propagated acoustic waves through the proposed dosing. In general, three methods are used for determining the transmission of acoustic waves through phononic crystals, including the Plane Wave Method (PWM),57–60 the Finite Difference Time Domain Method (FDTD),61–63 and the Transfer Matrix Method (TMM).64–67 Each method accurately measures and solves the mechanical wave propagation in the PnCs based on the structure and type of the elastic wave. The PWM method mainly depends on a linear combination of plane waves to solve these equations on an established lattice. However, convergence problems are encountered in structures with a significant elastic mismatch.57–60 On the other hand, FDTDM is used to calculate the phononic band gaps and acoustic properties, which proved to be accurate for simulating finite or infinite crystals with internal or external mechanical sources. However, it struggles with band bending for supercells, requires large memory storage, and lacks a precise mechanical model for some objects.61–63 TMM is the most frequently used method. It mainly depends on the continuity conditions at interfaces between materials and the Bloch/Floquet theorems to determine the band structure of dispersive materials. TMM accurately determines band structures, reflectivity, and transmission factors. However, it is not easy to use it for non-cubic geometry.64–67
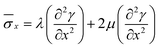
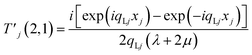
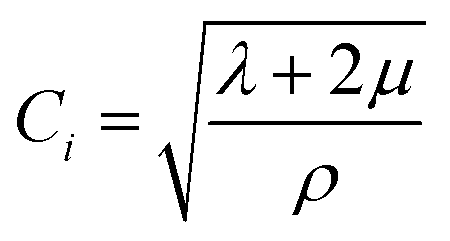
In this section, a brief description of this technique is provided to show how the proposed structure interacts with incident acoustic waves through its transmission spectrum. First, the examination was carried out on a single unit cell of an exposed 1D PnCs structure to the incident acoustic waves, as shown in Fig. 1. Then, the entire structure can be liberated from a generalized formalism. Only the x-axis is involved in this interaction, and every unit cell contains two layers of epoxy and lead, each having a thickness of d1 and d2. The following equation represents the form of the governing equation for the normal incidence of the acoustic wave on the PnCs structure:
| |
∇2γ = Cj2![[greek gamma with two dots above]](https://www.rsc.org/images/entities/i_char_e19e.gif)
| (1) |
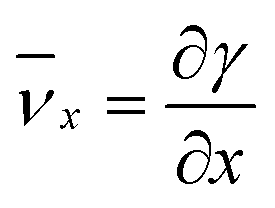
In this case,
γ indicates the displacement potential and

indicates the acoustic wave velocity within every layer, such as the lead and epoxy layers,
λ,
μ are the coefficients of Lamé, and the subscript
j = 1, 2 indicates the layer number in PnCs.
Eqn (1) might, therefore, be resolved as follows:
| |
γ = X![[thin space (1/6-em)]](https://www.rsc.org/images/entities/char_2009.gif) ei(ωt−kjx) + Yei(ωt+kjx) ei(ωt−kjx) + Yei(ωt+kjx)
| (2) |
In this case,
i2 = −1,

indicates the wavenumber in every layer,
ρj indicates the mass density,
ω indicates the angular frequency,
Cxxxj describes the elastic stiffness constant of a distinct layer
j.
X and
Y represent two arbitrary coefficients.
68,69 The incident acoustic wave's stress components and dimensionless displacement can, therefore, be expressed as follows:
| |
 | (3) |
| |
 | (4) |
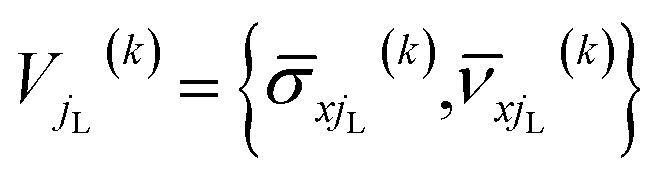
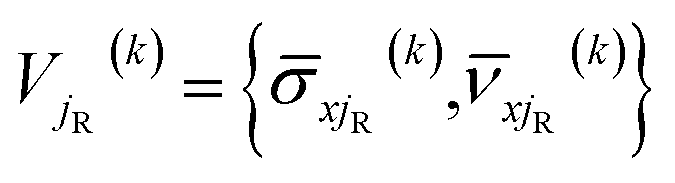
Thus, the two-state vectors, indicating the whole acoustic wave propagation at the right and left sides of the layer j in the kth unit cell will be as follows:
| |
 | (5) |
| |
 | (6) |
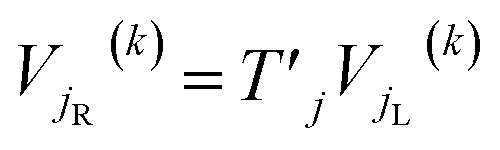
The right and left sides of layer j are identified here by the subscripts R and L. The right and left state vectors of the layer j in the kth unit cell can, thus, be related as follows:
| |
 | (7) |
where

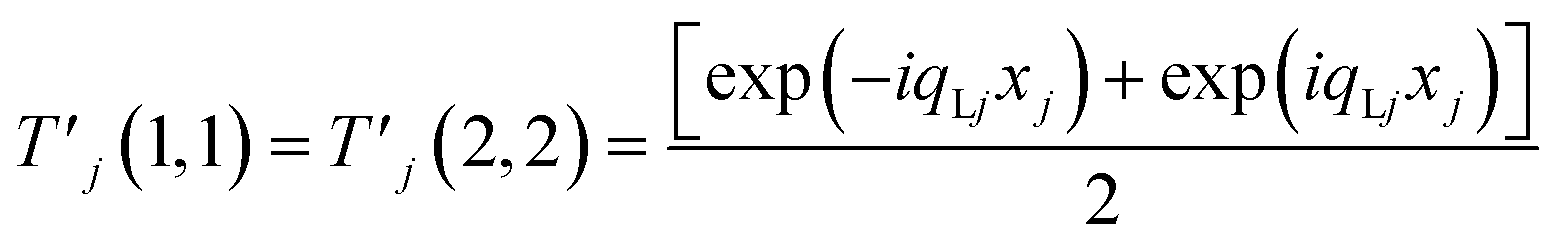
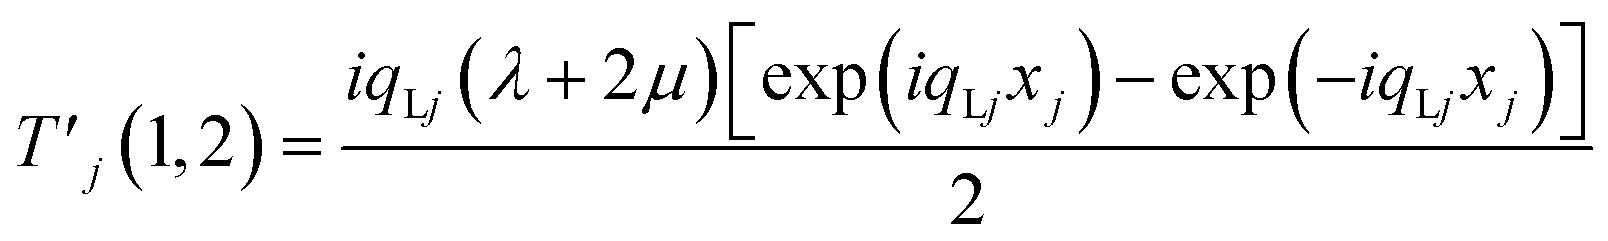
indicates a 2 × 2 transfer matrix, and its elements are described as follows:
| |
 | (8) |
| |
 | (9) |
| |
 | (10) |
The following formula describes the relationship between two consecutive state vectors in the kth and (k − 1)th unit cells:
Consequently, Tk is a transfer matrix, which links two subsequent unit cells and may be expressed as follows:
| |
 | (12) |
As a result, the incident acoustic wave's transmission coefficient through the PnCs structure can be expressed as follows:68,69
| |
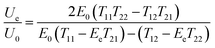 | (13) |
where
E0 and
Ee indicate Young's moduli of the two semi-infinite solids at the left and right of the structure, respectively, while
U0 are
Ue indicate the amplitudes of the transmitted and incident acoustic wave, and
Tij indicates the elements of the total transfer matrix
T =
TnTn−1…
Tk…
T1.
2.4. Analysis of the quasi structures
In this study, the propagation of an acoustic wave across binary periodic and Sn quasiperiodic structures has been established. The Fibonacci sequence can be employed to introduce the quasiperiodic PnCs structures, which are utilized in this work. A Fibonacci structure can be created by aligning the two fundamental parts A and B side by side following the recursive rule, as shown in the following equation:70,71| | |
Sn = Sn−1Sn−2, for n ≥ 2
| (14) |
We start with S0 = B and S1 = A. So, the Fibonacci sequences are generated like S2 = AB; S3 = ABA; S4 = ABAAB, etc. Therefore, by putting a defect layer in the center of two sequences of layers that have the same Fibonacci sequence pattern as in Fig. 1(b), a defective quasi-periodic PnCs structure as a liquid sensor can be created. Here, the S3 quasi-periodic PnCs structure [(S3) (NaI solution) (S3)] has been examined in comparison with the periodic PnCs structure as a liquid sensor.
3. Results and discussion
3.1. The acoustic properties of NaI solution
This section describes how to prepare aqueous electrolytic solutions, such as the NaI solution, and how to obtain the solutions' acoustic properties, which are the main target of the present study. In previous studies, aqueous electrolytic solutions of NaI can be prepared by doubly distilled water, while the dilution method is used to prepare higher concentrations of this solution. With a precision of ±0.1 kg m−3, densities are calculated using specific gravity bottles by the relative measuring method.72 Viscosity is measured using an Ostwald's viscometer. Velocity is measured using an ultrasonic interferometer with a frequency of 2 MHz and an accuracy of ±0.1%.72 With a precision of ±0.1 K, a constant digital temperature water bath has been utilized to keep the temperature. By using this method, the acoustic properties of the NaI solution can be obtained, such as mass density, ultrasonic velocity, and viscosity.20,72,73
Previous experimental studies were considered to obtain further data on the different concentrations of the NaI solution as opposed to its acoustic properties (density and sound velocity)73–76 as shown in Table 2. Thus, the relationship between the concentrations and acoustic properties might be generalized by quantitatively fitting the data. For the mass density of NaI, the experimental data were fitted using the following equation:73,74,76,77
| | |
ρ (kg m−3) = β1 − β2 × C (%) + β3 × C2
| (15) |
where
ρ refers to density,
C refers to concentration, and
β1,
β2, and
β3 are the coefficients of the fitting relationship. The values of the fitting coefficients are as follows:
β1 = 1081.57532,
β2 = −7.16582, and
β3 = 0.32285. According to the previous equation,
Fig. 2 demonstrates that when the concentration increases, the density increases as well. It is generally known that a solution's density directly relates to its concentration. Therefore, when a solution's concentration increases, its density increases, too. The quantity of solute molecules, which dissolve in the solvent, increases with an increase in the concentration of a solution. As a result, it can be predicted that the mass per unit volume of the solution will be larger. Thus, the relationship between mass and density has been identified.
73–77 Therefore, density rises as mass rises. As a result, it can be concluded that a solution's density is inversely correlated with its concentration. Then, the experimental data for the NaI solution's sound speed are fitted using the equation below :
74,77| | |
v (m s−1) = α + b × C (%)
| (16) |
where
v is density,
α and
b are the coefficients of the fitting relationship. The following are the values of fitting coefficients:
α = 1476.06608 and
b = 1.16673.
Fig. 2 demonstrates how sound velocity rises with concentration, which fits the previous equation linearly. The ultrasonic velocity of NaI rises linearly with concentration. Therefore, the presence of many ions in the solution is assumed to be caused by this feature. With the square root of the concentration, NaI apparent molar compressibility decreases linearly.
74,77,78 In summary, the density of the medium determines the speed of sound. When the medium is dense, the molecules are strongly linked together, allowing sound to travel more quickly. As a result, the sound speed increases with increasing the medium density.
74,75,77
Table 2 Experimental data of NaI solution's acoustic properties20,72,73
| Concentration (%) |
Mass density ρ × 103 (kg m−3) |
Sound speed (m s−1) |
| 7.5 |
1045.991 |
1484.817 |
| 12.5 |
11042.448 |
1490.65 |
| 15 |
1046.729 |
1493.567 |
| 22.5 |
1083.787 |
1502.318 |
| 25 |
1104.211 |
1505.234 |
| 30 |
1157.166 |
1511.068 |
| 32.5 |
1189.696 |
1513.985 |
| 35 |
1226.262 |
1516.901 |
| 40 |
1311.502 |
1522.735 |
| 44.5 |
1402.02 |
1527.986 |
| 45 |
1412.885 |
1528.569 |
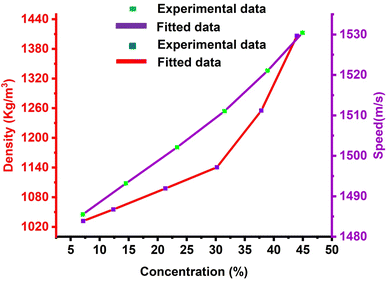 |
| | Fig. 2 A plot of NaI concentration versus its acoustic properties. | |
3.2. Comparison between the defective periodic structure and S3 quasi-periodic structure
In this section, the acoustic response of two PnC designs (periodic and quasiperiodic phononic crystal structures) are examined to generate different PnCs biosensor designs and obtain the highest sensitivity for these designs. The periodic PnCs liquid sensor is composed of four-unit cells and intermediated with the NaI solution as follows: [(A/B)2(NaI solution)(A/B)2], the schematic diagram is shown in Fig. 1(a). The second structure is two Fibonacci quasicrystals with the sequence S3 and intermediated with the NaI solution as follows: [ABADABA]. A/B is a duplication of two solid layers, i.e., lead and epoxy, as shown in Fig. 1(b). The periodic and S3 quasiperiodic structures have different numbers of layers, but they have the same thickness for the defect layer. Lead and epoxy have values of 1 μm, and 0.1 μm, respectively, while the defect layer has a thickness of 0.5 μm. The second sensor structure (1D quasiperiodic PnCs) is constructed according to the basis of Fibonacci sequences. These sequences successfully provided attractive properties that cannot be provided by the periodic PnCs or defective crystals. The Fibonacci sequence consists of a number of arranged stacks according to the rule, which is written in eqn (14) as follows: Sn = Sn−1Sn−2, for n ≥ 2. As demonstrated previously, for the 1D PnCs, this structure is made up of a number of layers of varying thicknesses, which are arranged in the Fibonacci pattern.29,79,80 Each layer has different acoustic properties, which can create multiple phononic band gaps and resonant modes as well in the transmission spectrum. Quasicrystals based on Fibonacci sequences enhanced the field of PnCs for various applications.29,79,80 The physical aspects of quasi-crystals are involved in the continuous breaking of the crystal periodicity based on the layers' alteration. Therefore, it is highly possible to produce more than one resonant mode and, hence, the displacement of these modes has become much easier by using the quasicrystals compared with the use of the periodic ones.
As demonstrated in Fig. 1(a) and (b), the periodic and quasiperiodic PnCs are introduced to identify the most effective sensor structure performance. For this purpose, the transmission spectrum is calculated versus the normalized frequency for each PnC design at two NaI concentrations: 0% and 10%, as shown in Fig. 3. All calculations are assumed at room temperature. In the case of the periodic PnCs structure, a resonance peak appeared in the transmission spectrum at a normalized frequency value of 0.3636 with a transmitted intensity of 93% for the concentration of 0%. The position of this peak is shifted to 0.3669 with an intensity of 86% as the concentration of NaI solution changed to 10%. Therefore, the periodic PnCs structure provides a sensitivity of 55 MHz. In contrast, in the case of the S3 quasi-periodic PnCs structure, the resonance peak was introduced at a normalized frequency value of 11.7 with a transmitted intensity of 61% for 0% concentration of NaI solution, then it shifted to 11.72 in the normalized frequency with an intensity of 49% when the concentration changed to 10%. Meanwhile, the quasiperiodic PnCs structure provides a sensitivity of 846 MHz. To sum up, the highest peak displacement occurred in the case of the S3 quasiperiodic structure compared to the periodic PnCs sensor, as observed in Fig. 3. This high disappearance between the two designs is due to the disorder that occurred in the periodicity of the S3 quasiperiodic structure, which is greater compared with the periodic PnCs sensor. As a result, a large attenuation occurred for the acoustic waves inside the structure as the number of layers increased with increasing the heterogeneity of the quasicrystal. Based on the previous results, it can be established that the S3 quasiperiodic structure is the most optimum design as a sensor with relatively high sensitivity and performance for the proposed PnC biosensor. Therefore, this study has further considered the quasiperiodic PnCs structure for other applications. The quasi-periodic structures in phononic crystal sensors offer several advantages compared with the periodic structures. These advantages include the lack of translational symmetry with special ordering patterns that provide more design flexibility and control of the structure's features.48,71,81 The existence of robust resonance modes is, therefore, highly expected unlike the periodic PnCs, which require breaking of the structure's periodicity to generate such resonance. Also, quasi-periodic structures are sensitive to a wide range of frequencies due to the continuous distribution of band gaps they can have.48,71,81 This may increase the sensor's sensitivity and adaptability in sensing environmental changes. The quasi-periodic structures showed enhanced sensitivity of the designed PnCs sensor to changes in the environment because of the special characteristics of their band gap distribution. As a result, the sensor may be highly sensitive and capable of detecting even minute concentration variations. Overall, phononic crystal sensors with quasi-periodic structures represent a promising choice for a variety of applications, such as environmental sensing, medical diagnostics, and structural health monitoring. To obtain the desired level of sensitivity and performance, the specific design parameters of the structure must be optimized for a particular sensing application, which is carried out in the subsequent section.
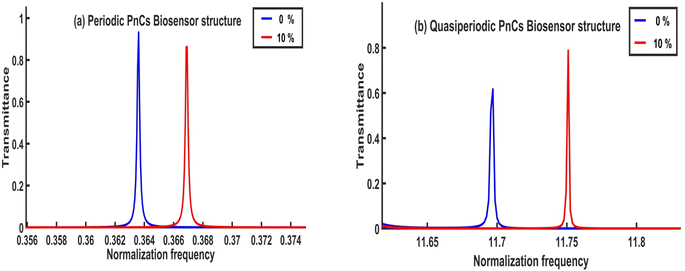 |
| | Fig. 3 The transmission spectrum versus normalized frequency at different concentrations of NaI solution for (a) the periodic PnCs structure and (b) the S3 quasiperiodic PnCs structure. | |
3.3. Optimization of S3 quasiperiodic PnCs structure
Based on the obtained results, it can be concluded that the S3 quasiperiodic structure has achieved the highest performance, characterized by the highest sensitivity for NaI solution. The following subsections discuss the optimization for the input parameters, such as the NaI layer's thickness and the number of layers in the sequence (Sn) to obtain the optimum values of these parameters and to achieve the highest performance for the proposed sensor in this study.
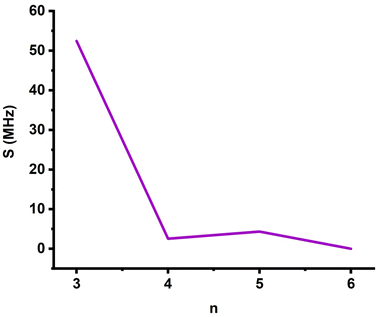
3.3.1. Optimization of the sequence number (Sn). This section investigates how the number of layers (Sn) affects the sensitivity of the built sensor in this study, as depicted in Fig. 4. First, an arbitrary assumption has been made that the thicknesses of the constituent materials are d1 = 1 μm, d2 = 0.5 μm, and df = 1 μm. According to the Fibonacci structure, the defect layer is placed between two identical sequences (Sn). The sensitivity decreases when the number of the layers of sequence (Sn) increases to 6. As the number of the layers of sequence (Sn) rises from 3 to 6, the values of sensitivity significantly declined from 52 to 0 MHz, as shown in Fig. 4. This can be attributed to the large number of layers that enhance wave losses or attenuation.56 Consequently, there is very little contact between these waves and the 1D-PnC, and no resonant peaks are formed. To stimulate the resonant peaks, a low value for the number of layers is, therefore, necessary. Thus, when selecting sequence (S3), the sensitivity can reach a maximum of 52 MHz. Hence, the S3 sequence is selected from among the Fibonacci sequences to achieve further improvements in the performance of the proposed sensor.
 |
| | Fig. 4 Dependence of the proposed sensor's sensitivity on the number of periods of quasiperiodic 1D-PnCs. | |
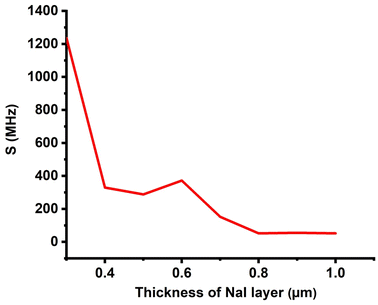
3.3.2. Optimization of the thickness of the NaI layer. Fig. 5 shows the relationship between the sensitivity of the proposed design and the thickness of the NaI solution layer as the concentration of the NaI solution varies from 0 to 10%. Fig. 5 illustrates a dramatic drop in the sensitivity values from 1200 to 150 MHz as the NaI solution layer thickness rises from 0.3 μm to 1 μm, respectively. This reaction was necessary because the thick NaI solution layer increased wave damage or distortion.56 As a result, there is very little interaction between these waves and the 1D-PnCs, and no resonant peaks are formed. Therefore, the minimal NaI solution layer thickness of 0.3 μm is required to activate the resonant peaks. To further improve the performance of this sensor, the minimal value of the NaI solution layer is chosen.
 |
| | Fig. 5 Sensitivity of the designed sensor at different thicknesses of the NaI layer. | |
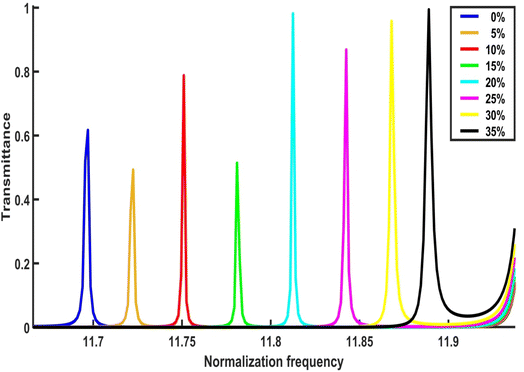
3.3.3. The effect of NaI solution concentrations. In this subsection, the effect of increasing NaI solution concentrations on the properties of the resonant peak at the optimal values is discussed. In Fig. 2, different concentrations against the sound speed and density of NaI solution are discussed. The effect of these concentrations (0, 5, 10, 15, 20, 25, 30, and 35%) on the PnCs structure is, therefore, considered. Fig. 6 illustrates how the resonance peak moved to new positions when varying NaI solution concentrations are considered. As shown in Fig. 6, as NaI solution concentrations varied between 0 and 35%, the frequency of the resonant peaks varied accordingly from 19804 to 20125 MHz. This is because any increase in NaI solution concentration leads to an increase in the density of the NaI solution, increasing its sound speed as demonstrated in Fig. 2. The location of the resonant peaks varied as well. It has also been observed that sensitivity increased from 677 to 918 MHz with a gradual increase of the concentration between 0 and 35%, respectively.
 |
| | Fig. 6 The transmission spectrum of the 1D PnCs quasiperiodic structure at different concentrations of NaI solution. | |
3.4. Analysis of the sensor performance
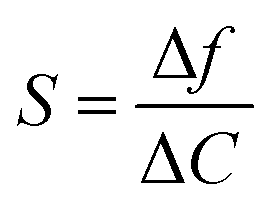
The obtained results exhibited that the S3 quasiperiodic structure is the optimum sensor structure for NaI solution, showing excellent sensitivity. Therefore, the efficiency of the proposed sensing device is examined by using some related parameters, such as sensitivity (S), quality factor (QF), and figure of merit (FOM). These parameters are believed to be relevant for describing the sensor's performance. The defect mode features have the most influence on their values. The sensor sensitivity is defined as the shift in the defect model's location in response to a change in the concentration level. The values can, therefore, be calculated using the following relationship, as shown below:82,83| |
 | (17) |
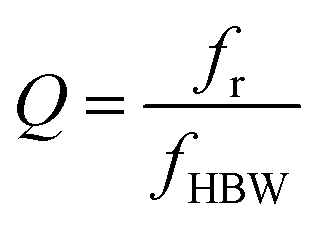
where ΔC denotes the change in NaI solution concentration and Δf denotes the resonance peak or transmitted frequency with each concentration. The quality factor, which is greatly influenced by the location of the resonant peak, is one of the additional performance characteristics that is calculated. The quality factor is calculated using the following formula:82,83| |
 | (18) |
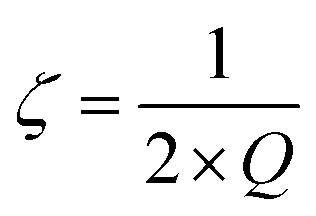
where the resonant peak frequency is given by fr, and its half bandwidth frequency is given by fHBW. A high-quality factor, which improves frequency resolution, indicates sharp resonant peaks. Additionally, a figure of merit (FOM) parameter has been obtained, which describes how effectively and accurately the sensor can track any resonant frequency shift. The following formula is used to determine FOM:84–86| |
 | (19) |
FOM increases as the half bandwidth frequency decreases. As a last performance indicator, the damping rate was examined. The damping, which defines how the acoustic waves in the designed PnCs decay after a disturbance across the structure, controls the sharpness of resonance-transmitted peaks.5,87–89
| |
 | (20) |
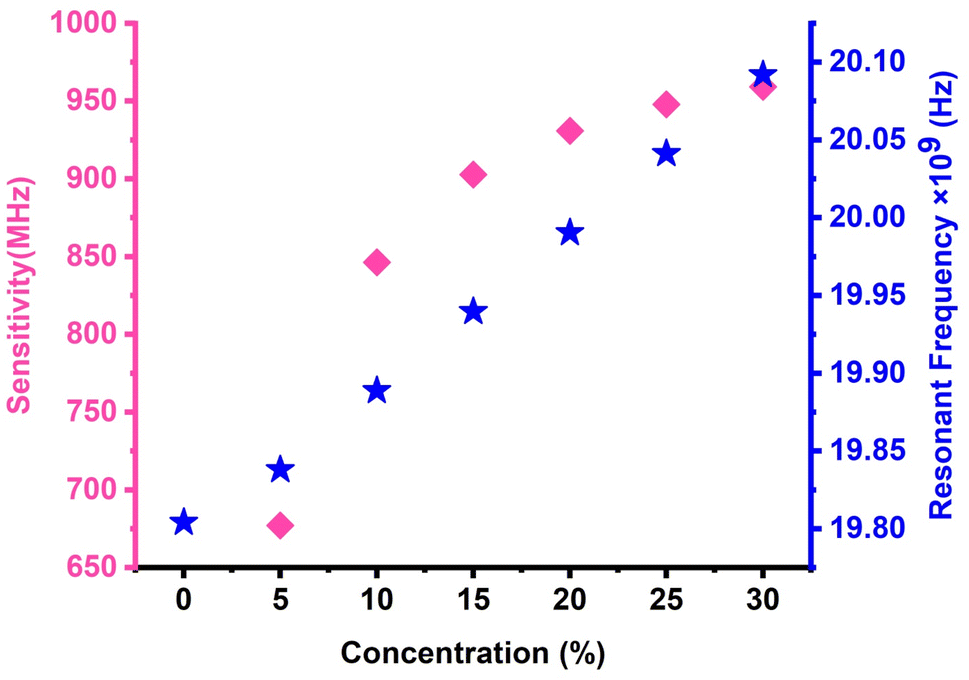
Fig. 7 shows how different concentrations modified the resonance peaks of the NaI solution sensor, which affected the sensitivity. The resonant modes move linearly towards higher frequencies when the NaI solution concentration increases, and the sensor sensitivity increases as well. Therefore, the results confirmed that the proposed PnCs sensor performed efficiently and achieved great sensitivity for the concentration range of 0 to 20%. The suggested design, according to Fig. 8, can provide a high sensitivity of 677 MHz when the NaI concentration rises from 0 to 5%. As the concentration of NaI rises, this number gradually rises until it reaches 925 MHz at 20%. However, the sensitivity of the designed sensor after 20% concentration is saturated. The saturation of sensitivity can be attributed to several factors. Firstly, the relationship between the NaI concentrations and the acoustic properties (especially the mass density) of the NaI solution has become nonlinear, as shown in Fig. 2 after the concentration of 20%, resulting in the saturation of sensitivity. In addition, the saturation of sensitivity is related to the sensitivity eqn (17). The magnitude of the displacement in resonance frequency (in the numerator) is very close to the change in concentration (in the denominator), especially at higher NaI concentrations, thereby leading to sensitivity saturation. Moreover, acoustic damping can limit the sensitivity of the sensor at high concentrations of NaI solution. This can occur due to the high absorption of the acoustic waves by the NaI solution at higher concentrations. The sensors, which are presented by,90,91 provided sensitivity with values of 1833 Hz and 1275 Hz. The sensitivity of the designed sensor in this study seems promising when compared to the results of previous studies.90,91
 |
| | Fig. 7 The effect of different concentrations on the resonance peaks and the sensitivity of the NaI solution sensor. | |
 |
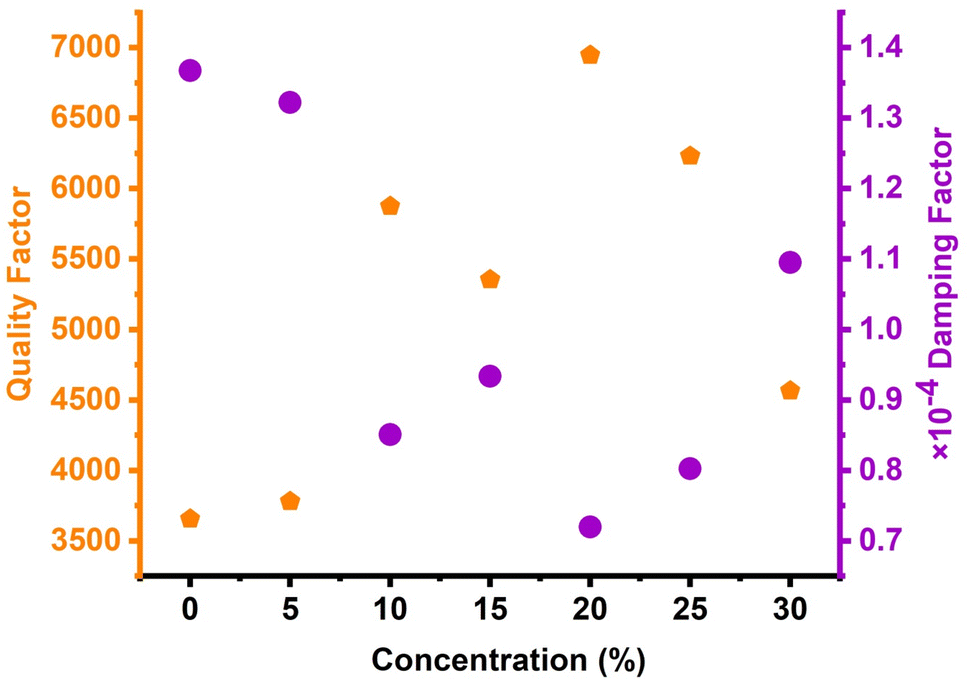
| | Fig. 8 The effect of different concentrations on the quality factor and damping rate of the NaI solution sensor. | |
Fig. 8 shows the influence of the acoustic waves' damping rate and the quality factor of the designed sensor. As observed, the minimum damping rate value is investigated when the highest value of QF is obtained. Notably, eqn (20) establishes an inverse proportion between QF and the damping rate. Due to the smaller values of FWHM in this condition, greater values of QF are achieved. Due to these small values of the FWHM, small values of the damping rate are investigated. On the other hand, lower values of FWHM indicated that the intended structure has a restricted ability to absorb the incident acoustic waves. The resonance peak becomes sharper as the damping rate decreases. As seen in Fig. 8, the resonance peak has the highest sharpness when the concentration is equal to 20% since it has the lowest damping rate (0.7 × 10⁻⁴), as indicated by the Q factor of 6947. However, when the concentration is equal to 0%, the peak's sharpness (QF) is at a value of 3656, and its damping rate is at a value of 1.35 × 10⁻⁴, which is the highest one. The quality factor, however, remains extremely high throughout all NaI solution concentrations as it shifts from 6947.059 to 3656.249. This showed that all resonant peaks are distinct, which improved the suggested sensor's frequency resolution. In comparison with the findings of the S3 quasiperiodic PnCs sensor with previous 1D PnCs sensors,56,90 it can be concluded that the quality factor of the designed sensor can achieve around 6947.059 and this value is acceptable in comparison to other sensors. The numerical results, as exhibited in Fig. 8, showed certain unique characteristics of the proposed sensor in comparison to its analogs in 1D PnCs designs,56,90 thereby distinguishing the designed sensor in this study apart from other liquid sensors.
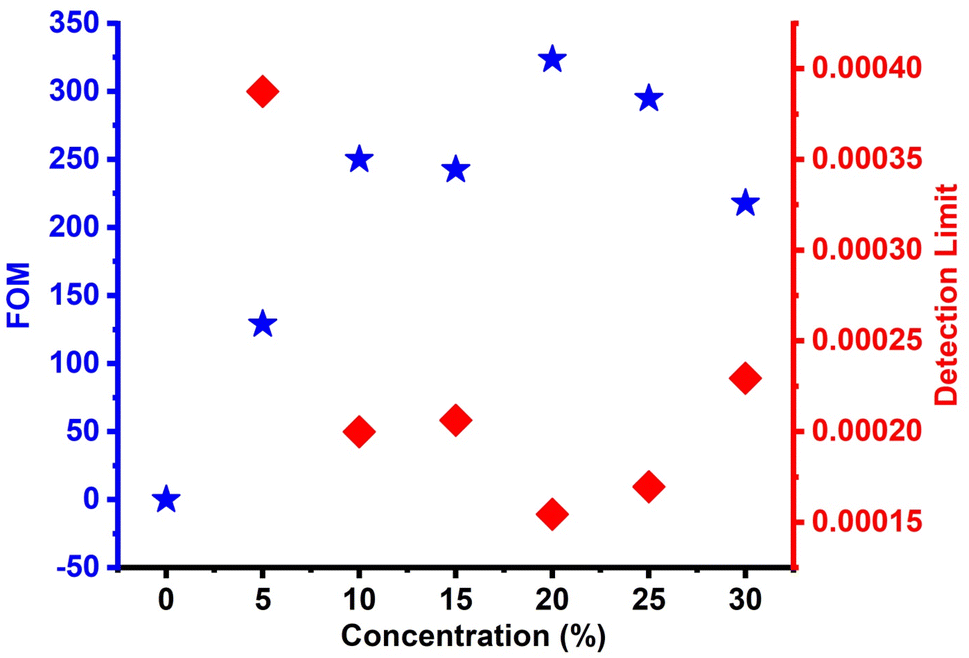
Fig. 9 displays how different concentrations affect the NaI solution sensor's detection limit and FOM. Fig. 9 illustrates how the figure of merit rises as NaI solution concentration rises. The values of the figure of merit fluctuate from 0 to 323.529 when concentrations varied from 0 to 20%. In this instance, the qualities of a figure of merit are promising because they are acceptable at the concentration scale as a percentage. Additionally, considering that this parameter is also known as reduced sensitivity, FOM exhibits a response that is comparable to that seen in the case of sensitivity. The relationship between different concentrations and the NaI solution sensor's detection limit is also shown in Fig. 9. The limit of detection (LOD) refers to all concentrations of such an analyte in a sample that can be detected with a specific probability.88 As the concentrations rise from 0 to 30%, the detection limit drops from 0.0003874 to 0.0001696. These results are favorably acceptable as they distinguish the designed sensor in this study apart from previous liquid sensors of different types.40,56,90
 |
| | Fig. 9 The effect of different concentrations on the figure of merit and detection limit of the NaI solution sensor. | |
3.5. Comparison between the suggested PnC sensor for the NaI detection with other sensors
This subsection introduces a brief comparison between the features of the proposed sensor with the features of other PnCs sensors of similar type and dimension, as shown in Table 3. A. Mehaney et al. introduced a one-dimensional (1D) phononic crystal (PnCs), which is used as a biomarker for measuring the concentrations of acetone in water.92 In the same vein, F. Khateib et al. introduced a defective 1D-PnC from a lead–epoxy multilayer with a central defect layer filled with glycine.93 In addition, Hamed Gharibi et al. introduced a local resonant two-dimensional solid–liquid phononic crystal (PnCs) design to detect the NaI (sodium iodide)–water concentration but with a sensitivity of just 1714 Hz.94 This study primarily aims to improve the detection of NaI concentrations based on the resonance phenomenon and through the quasi-periodic PnCs sensor structures. The 1D PnC designs achieved higher sensitivity and better performance compared with the designs in the previous studies, as reported in Table 3. Therefore, the suggested sensor has higher sensitivity of (677:959 MHz) than many PnCs liquid sensors, which were previously reported in the literature.92–94 Furthermore, it can be observed that the designed sensor in this study exhibited a quality factor of 6947, which is higher than the quality factor of other PnC sensors.56,90 Additionally, this sensor has a very low damping factor (7.19 × 10⁻⁵) and a high figure of merit (323.529) compared with other sensors.56,90 Other performance characteristics of the designed sensor are also very promising and distinctive, as shown in the previous performance figures. Besides, this sensor can differentiate between concentrations that range from 0 to 35% with a 5% step, which is particularly useful for precise detection in medical applications. Because the proposed sensor can function by using different concentrations, it is believed that the proposed sensor can be used more efficiently for detecting various liquids. Moreover, it is expected that the developed sensor is superior to other sensor types with short or limited shelf lives, including electrochemical sensors. The proposed phononic sensor has advantageous aspects, including the ease of construction and cost-effectiveness, as well as the readily available materials without the use of electronic components. Table 3 illustrates a comparison between the designed sensor's outputs with other PnC sensors' outputs.
Table 3 A comparison of the proposed design's sensitivity with previous works
| Type of sensor |
Sensing material |
Sensitivity |
Reference |
| Acetone sensor-based 1D defective phononic crystal as a highly sensitive biosensor application |
Acetone |
Low concentrations 43 MHz, high concentration 20.4 MHz |
95 |
| Two-dimensional phononic crystal sensor based on a cavity mode |
Propanol |
500 kHz |
21 |
| 3D-printed phononic-fluidic cavity sensor |
NaCl |
(Experimentally) 1.4 kHz |
96 |
| High-performance design for detecting NaI–water concentrations using a two-dimensional phononic crystal biosensor |
NaI–water |
1833 Hz |
90 |
| Four-channel ultrasonic demultiplexer based on two-dimensional phononic crystal towards the highly efficient liquid sensor |
The acidity of natural and industrial vinegar |
1275 Hz |
91 |
| Glycine sensor based on the 1D defective phononic crystal structure |
Glycine liquid at molar ratio range from 0 to 2 mol L−1 |
969, 973 Hz |
84 |
| High-performance design for detecting NaI–water concentrations using a one-dimensional phononic crystal biosensor |
NaI solution |
677:959 MHz |
The present work |
4. Conclusion
This work investigated the performance of the periodic and quasi-periodic PnC sensor structures for the purpose of bio-liquid sensing. The study used an aqueous solution from a biomaterial, i.e., sodium iodide (NaI) with a wide range of concentrations (0–35%). The detection is based on the shift in the transmitted resonant peaks through the phononic band gaps. Fibonacci sequences were used to generate the quasi-periodic structure. The results showed that the S3 quasi-periodic PnC provided a promising sensitivity of 959 MHz, which is considered the maximum obtained sensitivity for the NaI solution and biomaterials for a PnC structure. The results also showed that the designed sensor provided high QF and FOM values of 6947.059 and 323.5, respectively. The S3 quasiperiodic structure can, therefore, be introduced as the most optimum sensor structure that is characterized by high performance for the NaI solution. The transmittance spectra have been theoretically determined by using the transfer matrix method (TMM). Accordingly, the results provided a simple biosensor design for determining the NaI solution, various liquids, and biofluids. The advantages of the designed PnCs sensor in this study can be manifested by its construction simplicity and cost-effectiveness, in addition to the utilization of readily available materials.
Author contributions
Project administration, A. H. M. A., G. A. A., M. I., H. M. F., H. A. E., and A. M.; supervision, A. H. M. A., G. A. A., M. I., H. M. F., H. A. E., and A. M.; software, A. H. M. A., and G. A. A.; visualization, A. M., and H. M. F.; writing – review & editing, A. H. M. A., H. M. F., H. A. E., and A. M.; writing – original draft, H. M. F.; methodology, A. M., and H. M. F.; data curation, A. M., and H. M. F; all authors have read and agreed to the published version of the manuscript.
Data availability
Requests should be addressed to corresponding author.
Conflicts of interest
The authors declare no conflict of interest.
Acknowledgements
The authors are thankful to the Deanship of Scientific Research at Najran University for funding this work, under the General Research Funding program grant code (NU/DRP/SERC/12/6).
References
- A. N. Darinskii and A. L. Shuvalov, Surface acoustic waves in one-dimensional piezoelectric phononic crystals with symmetric unit cell, Phys. Rev. B, 2019, 100, 184303, DOI:10.1103/PHYSREVB.100.184303/FIGURES/8/MEDIUM.
- A. Mehaney, A. A. Shehatah and A. M. Ahmed, Modeling of phononic crystal cavity for sensing different biodiesel fuels with high sensitivity, Mater. Chem. Phys., 2021, 257, 123774, DOI:10.1016/J.MATCHEMPHYS.2020.123774.
- Y. Sun, Y. Yu, Y. Zuo, L. Qiu, M. Dong and J. Ye, et al., Band gap and experimental study in phononic crystals with super-cell structure, Results Phys., 2019, 13, 102200, DOI:10.1016/J.RINP.2019.102200.
- G. Wang, L. H. Shao, Y. Z. Liu and J. H. Wen, Accurate evaluation of lowest band gapsin ternary locally resonant phononic crystals, Chin. Phys., 2006, 15, 1843, DOI:10.1088/1009-1963/15/8/036.
- S. E. Zaki, A. Mehaney, H. M. Hassanein and A. H. Aly, High-performance liquid sensor based one-dimensional phononic crystal with demultiplexing capability, Mater. Today Commun., 2021, 26, 102045, DOI:10.1016/J.MTCOMM.2021.102045.
- M. Maldovan, Sound and heat revolutions in phononics, Nat, 2013, 503, 209–217, DOI:10.1038/nature12608.
- J. O. Vasseur, P. A. Deymier, B. Djafari-Rouhani, Y. Pennec and A. C. Hladky-Hennion, Absolute forbidden bands and waveguiding in two-dimensional phononic crystal plates, Phys. Rev. B: Condens. Matter Mater. Phys., 2008, 77, 085415, DOI:10.1103/PHYSREVB.77.085415/FIGURES/15/MEDIUM.
- Y. Pennec, B. Djafari-Rouhani, J. O. Vasseur, A. Khelif and P. A. Deymier, Tunable filtering and demultiplexing in phononic crystals with hollow cylinders, Phys. Rev. E: Stat., Nonlinear, Soft Matter Phys., 2004, 69, 046608, DOI:10.1103/PhysRevE.69.046608.
- C. He, X. Ni, H. Ge, X. C. Sun, Y. B. Chen and M. H. Lu, et al., Acoustic topological insulator and robust one-way sound transport, Nat. Phys., 2016, 12, 1124–1129, DOI:10.1038/nphys3867.
- Z. Yang, F. Gao, X. Shi, X. Lin, Z. Gao and Y. Chong, et al., Topological Acoustics, Phys. Rev. Lett., 2015, 114, 114301, DOI:10.1103/PHYSREVLETT.114.114301/FIGURES/3/MEDIUM.
- Y. Pennec, B. Djafari Rouhani, H. Larabi, A. Akjouj, J. N. Gillet and J. O. Vasseur, et al., Phonon transport and waveguiding in a phononic crystal made up of cylindrical dots on a thin homogeneous plate, Phys. Rev. B: Condens. Matter Mater. Phys., 2009, 80, 144302, DOI:10.1103/PHYSREVB.80.144302/FIGURES/8/MEDIUM.
- S. C. S. Lin, T. J. Huang, J. H. Sun and T. T. Wu, Gradient-index phononic crystals, Phys. Rev. B: Condens. Matter Mater. Phys., 2009, 79, 094302, DOI:10.1103/PHYSREVB.79.094302/FIGURES/5/MEDIUM.
- M. Zaremanesh, L. Carpentier, H. Gharibi, A. Bahrami, A. Mehaney and A. Gueddida, et al., Temperature biosensor based on triangular lattice phononic crystals, APL Mater., 2021, 9, 061114, DOI:10.1063/5.0054155.
- A. Oseev, M. Zubtsov and R. Lucklum, Octane Number Determination of Gasoline with a Phononic Crystal Sensor, Procedia Eng., 2012, 47, 1382–1385, DOI:10.1016/J.PROENG.2012.09.414.
- K. Kustanovich, V. Yantchev, V. Kirejev, G. D. M. Jeffries, T. Lobovkina and A. Jesorka, A high-performance lab-on-a-chip liquid sensor employing surface acoustic wave resonance, J. Micromech. Microeng., 2017, 27, 114002, DOI:10.1088/1361-6439/AA8F21.
- A. Oseev, M. Zubtsov and R. Lucklum, Gasoline properties determination with phononic crystal cavity sensor, Sens. Actuators, B, 2013, 189, 208–212, DOI:10.1016/J.SNB.2013.03.072.
- S. Wu, H. Xia, J. Xu, X. Sun and X. Liu, Manipulating Luminescence of Light Emitters
by Photonic Crystals, Adv. Mater., 2018, 30, 1803362, DOI:10.1002/ADMA.201803362.
- K. Kustanovich, V. Yantchev, V. Kirejev, G. D. M. Jeffries, T. Lobovkina and A. Jesorka, A high-performance lab-on-a-chip liquid sensor employing surface acoustic wave resonance, J. Micromech. Microeng., 2017, 27, 114002, DOI:10.1088/1361-6439/AA8F21.
- V. Naresh and N. Lee, A Review on Biosensors and Recent Development of Nanostructured Materials-Enabled Biosensors, Sensors, 2021, 21, 1109, DOI:10.3390/S21041109.
- H. Gharibi, A. Mehaney and A. Bahrami, High performance design for detecting NaI–water concentrations using a two-dimensional phononic crystal biosensor, J. Phys. D: Appl. Phys., 2020, 54, 015304, DOI:10.1088/1361-6463/ABB729.
- R. Lucklum, M. Ke and M. Zubtsov, Two-dimensional phononic crystal sensor based on a cavity mode, Sens. Actuators, B, 2012, 171–172, 271–277, DOI:10.1016/J.SNB.2012.03.063.
- A. Mehaney and I. I. Ahmed, Acetone sensor based 1D defective phononic crystal as a highly sensitive biosensor application, Opt. Quantum Electron., 2021, 53, 1–15, DOI:10.1007/S11082-021-02737-X/TABLES/5.
- H. Gharibi, A. Khaligh, A. Bahrami and H. B. Ghavifekr, A very high sensitive interferometric phononic crystal liquid sensor, J. Mol. Liq., 2019, 296, 111878, DOI:10.1016/J.MOLLIQ.2019.111878.
- W. Steurer and D. Sutter-Widmer, Photonic and phononic quasicrystals, J. Phys. D: Appl. Phys., 2007, 40, R229, DOI:10.1088/0022-3727/40/13/R01.
- P. D. C. King and T. J. Cox, Acoustic band gaps in periodically and quasiperiodically modulated waveguides, J. Appl. Phys., 2007, 102, 014902, DOI:10.1063/1.2749483.
- S. E. Svyakhovskiy, I. V. Timofeev, A. M. Vyunishev, S. Y. Vetrov and P. S. Pankin, Quasiperiodic one-dimensional photonic crystals with adjustable multiple photonic bandgaps, Opt. Lett., 2017, 42(18), 3602–3605, DOI:10.1364/OL.42.003602.
- G. N. Aliev and B. Goller, Quasi-periodic Fibonacci and periodic one-dimensional hypersonic phononic crystals of porous silicon: Experiment and simulation, J. Appl. Phys., 2014, 116, 094903, DOI:10.1063/1.4894620.
- E. MacIá, Exploiting aperiodic designs in nanophotonic devices, Rep. Prog. Phys., 2012, 75, 036502, DOI:10.1088/0034-4885/75/3/036502.
- S. E. Zaki and M. A. Basyooni, Ultra-sensitive gas sensor based fano resonance modes in periodic and fibonacci quasi-periodic Pt/PtS2 structures, Sci. Rep., 2022, 12, 1–14, DOI:10.1038/s41598-022-13898-4.
- K. S. Pérez, J. O. Estevez, A. Méndez-Blas, J. Arriaga, G. Palestino and M. E. Mora-Ramos, Tunable resonance transmission modes in hybrid heterostructures based on porous silicon, Nanoscale Res. Lett., 2012, 7, 1–8, DOI:10.1186/1556-276X-7-392/FIGURES/7.
- S. Ravera, A. Reyna-Neyra, G. Ferrandino, L. M. Amzel and N. Carrasco, The Sodium/Iodide Symporter (NIS): Molecular Physiology and Preclinical and Clinical Applications, Annu Rev Physiol, 2017, 79, 261–289, DOI:10.1146/ANNUREV-PHYSIOL-022516-034125.
- F. Delange and H. Burgi, Iodine deficiency disorders in Europe, Bull. W. H. O., 1989, 67, 317, DOI:10.1079/phn2001138.
- W. Yu, J. Chen, S. Zhang, Y. Zhao, M. Fang and Y. Deng, et al., Extraction of biodegradable microplastics from tissues of aquatic organisms, Sci. Total Environ., 2022, 838, 156396, DOI:10.1016/J.SCITOTENV.2022.156396.
- M. B. Zimmermann, The role of iodine in human growth and development, Semin. Cell Dev. Biol., 2011, 22, 645–652, DOI:10.1016/J.SEMCDB.2011.07.009.
- A. M. Leung and L. E. Braverman, Consequences of excess iodine, Nat. Rev. Endocrinol., 2013, 10, 136–142, DOI:10.1038/nrendo.2013.251.
- B. De Groef, B. R. Decallonne, S. Van der Geyten, V. M. Darras and R. Bouillon, Perchlorate versus other environmental sodium/iodide symporter inhibitors: potential
thyroid-related health effects, Eur. J. Endocrinol., 2006, 155, 17–25, DOI:10.1530/EJE.1.02190.
- J. A. Paulson, C. Baum, A. C. Brock-Utne, H. L. Brumberg, C. C. Campbell and B. P. Lanphear, et al., Iodine Deficiency, Pollutant Chemicals, and the Thyroid: New Information on an Old Problem, Pediatrics, 2014, 133, 1163–1166, DOI:10.1542/PEDS.2014-0900.
- V. Triggiani, E. Tafaro, V. A. Giagulli, C. Sabba, F. Resta and B. Licchelli, et al., Role of Iodine, Selenium and Other Micronutrients in Thyroid Function and Disorders, Endocr. Metab. Immune. Disord. Drug Targets, 2009, 9, 277–294, DOI:10.2174/187153009789044392.
- C. J. Eastman and M. B. Zimmermann, The Iodine Deficiency Disorders, Endotext, 2018 Search PubMed.
- A. H. M. Almawgani, H. M. Fathy, G. A. Ali, H. A. Elsayed and A. Mehaney, One-Dimensional Phononic Crystals: A Simplified Platform for Effective Detection of Heavy Metals in Water with High Sensitivity, Micromachines, 2023, 14, 204, DOI:10.3390/MI14010204.
- A. Mehaney, A. M. Ahmed, H. A. Elsayed, A. H. Aly and W. Sabra, Hydrostatic pressure effects for controlling the phononic band gap properties in a perfect phononic crystal, Opt. Quantum Electron., 2022, 54, 1–14, DOI:10.1007/S11082-021-03484-9/FIGURES/10.
- M. Maldovan and E. L. Thomas, Periodic Materials and Interference Lithography: For Photonics, Phononics and Mechanics. Period Mater Interf Lithogr Photonics, Phononics Mech, 2009, pp. 1–313. DOI:10.1002/9783527625390.
- A. H. Aly and A. Mehaney, Enhancement of phononic band gaps in ternary/binary structure, Phys. B, 2012, 407, 4262–4268, DOI:10.1016/J.PHYSB.2012.07.014.
- A. H. Aly, A. Mehaney and E. Abdel-Rahman, Study Of Physical Parameters On The Properties Of Phononic Band Gaps, Int. J. Mod. Phys. B, 2013, 27(11), 1350047 CrossRef.
- A. Mehaney and A. M. Ahmed, Locally Resonant Phononic Crystals at Low frequencies Based on Porous SiC Multilayer, Sci. Rep., 2019, 9, 1–12, DOI:10.1038/s41598-019-51329-z.
- G. N. Aliev and B. Goller, Quasi-periodic Fibonacci and periodic one-dimensional hypersonic phononic crystals of porous silicon: Experiment and simulation, J. Appl. Phys., 2014, 116, 094903, DOI:10.1063/1.4894620.
- E. MacIá, Exploiting aperiodic designs in nanophotonic devices, Rep. Prog. Phys., 2012, 75, 036502, DOI:10.1088/0034-4885/75/3/036502.
- A. L. Chen, Y. S. Wang and C. Zhang, Wave propagation in one-dimensional solid–fluid quasi-periodic and aperiodic phononic crystals, Phys. B, 2012, 407, 324–329, DOI:10.1016/J.PHYSB.2011.10.041.
- A. Bertsch, P. Bernhard, C. Vogt and P. Renaud, Rapid prototyping of small size objects, Rapid Prototyp. J., 2000, 6, 259–266, DOI:10.1108/13552540010373362/FULL/XML.
- I. Malfanti, A. Taschin, P. Bartolini, B. Bonello and R. Torre, Propagation of acoustic surface waves on a phononic surface investigated by transient reflecting grating spectroscopy, J. Mech. Phys. Solids, 2011, 59, 2370–2381, DOI:10.1016/J.JMPS.2011.07.010.
- N. Li, C. R. Lowe and A. C. Stevenson, One-step polymeric phononic crystal manufacture, Ultrasonics, 2019, 94, 376–381, DOI:10.1016/J.ULTRAS.2018.07.001.
- M. P. Schmidt, A. Oseev, R. Lucklum, M. Zubtsov and S. Hirsch, SAW based phononic crystal sensor, technological challenges and solutions, Microsyst. Technol., 2016, 22, 1593–1599, DOI:10.1007/S00542-015-2781-3/FIGURES/8.
- M. Vaezi, H. Seitz and S. Yang, A review on 3D micro-additive manufacturing technologies, Int. J. Adv. Manuf. Technol., 2013, 67, 1721–1754, DOI:10.1007/S00170-012-4605-2/METRICS.
- F. Lucklum and M. J. Vellekoop, Design and Fabrication Challenges for Millimeter-Scale Three-Dimensional Phononic Crystals, Cryst, 2017, 7, 348, DOI:10.3390/CRYST7110348.
- P. Wasmer, J. Bulling and J. Prager, Ultrasonic sensor based on phononic crystals, Proc Int Congr Acoust, 2019; pp. 969–976, DOI:10.18154/RWTH-CONV-239749.
- Z. A. Alrowaili, H. Makhlouf Fathy, H. A. Elsayed, M. Aouassa, M. H. Mahmoud and K. S. El-Nasser, et al., Heavy metals biosensor based on defective one-dimensional phononic crystals, Ultrasonics, 2023, 130, 106928, DOI:10.1016/J.ULTRAS.2023.106928.
- Y. Tanaka and S. I. Tamura, Two-dimensional phononic crystals: surface acoustic waves, Phys. B, 1999, 263–264, 77–80, DOI:10.1016/S0921-4526(98)01197-1.
- T. T. Wu, Z. G. Huang and S. Lin, Surface and bulk acoustic waves in two-dimensional phononic crystal consisting of materials with general anisotropy, Phys. Rev. B, 2004, 69, 094301, DOI:10.1103/PhysRevB.69.094301.
- J. O. Vasseur, B. Djafari-Rouhani, L. Dobrzynski and P. A. Deymier, Acoustic band gaps in fibre composite materials of boron nitride structure, J. Phys.: Condens. Matter, 1997, 9, 7327, DOI:10.1088/0953-8984/9/35/008.
- X. Zhang, Y. Liu, F. Wu and Z. Liu, Large two-dimensional band gaps in three-component phononic crystals, Phys. Lett. A, 2003, 317, 144–149, DOI:10.1016/J.PHYSLETA.2003.08.032.
- R. N. Schneider, L. E. Turner and M. M. Okoniewski, Application of FPGA technology to accelerate the Finite-Difference Time-Domain (FDTD) method, ACM/SIGDA Int Symp F Program Gate Arrays - FPGA, 2002, pp. 97–105, DOI:10.1145/503048.503063.
- F. Wu, Z. Liu and Y. Liu, Splitting and tuning characteristics of the point defect modes in two-dimensionalphononic crystals, Phys. Rev. E: Stat. Phys., Plasmas, Fluids, Relat. Interdiscip. Top., 2004, 69, 4, DOI:10.1103/PHYSREVE.69.066609/FIGURES/6/MEDIUM.
- J. O. Vasseur, P. A. Deymier, A. Khelif, P. Lambin, B. Djafari-Rouhani and A. Akjouj, et al., Phononic crystal with low filling fraction and absolute acoustic band gap in the audible frequency range: A theoretical and experimental study, Phys. Rev. E: Stat., Nonlinear, Soft Matter Phys., 2002, 65, 056608, DOI:10.1103/PhysRevE.65.056608.
- J. B. Pendry and A. MacKinnon, Calculation of photon dispersion relations, Phys. Rev. Lett., 1992, 69, 2772, DOI:10.1103/PhysRevLett.69.2772.
- F. Kobayashi, S. Biwa and N. Ohno, Wave transmission characteristics in periodic media of finite length: multilayers and fiber arrays, Int. J. Solids Struct., 2004, 41, 7361–7375, DOI:10.1016/J.IJSOLSTR.2004.06.017.
- A. Mehaney, Phononic crystal as a neutron detector, Ultrasonics, 2019, 93, 37–42, DOI:10.1016/J.ULTRAS.2018.10.012.
- L. Han, Y. Zhang, Z. Q. Ni, Z. M. Zhang and L. H. Jiang, A modified transfer matrix method for the study of the bending vibration band structure in phononic crystal Euler beams, Phys. B, 2012, 407, 4579–4583, DOI:10.1016/J.PHYSB.2012.08.022.
- A. L. Chen and Y. S. Wang, Study on band gaps of elastic waves propagating in one-dimensional disordered phononic crystals, Phys. B, 2007, 392, 369–378, DOI:10.1016/J.PHYSB.2006.12.004.
- M. I. Hussein, G. M. Hulbert and R. A. Scott, Dispersive elastodynamics of 1D banded materials and structures: analysis, J. Sound Vib., 2006, 289, 779–806, DOI:10.1016/J.JSV.2005.02.030.
- A. Abbasiyan, M. Noori and H. Baghban, Investigation of quasi-periodic structures to increase the efficiency of thin-film silicon solar cells: A comparative study, Sol. Energy Mater. Sol. Cells, 2019, 202, 110129, DOI:10.1016/J.SOLMAT.2019.110129.
- H. Imanian, M. Noori and A. Abbasiyan, Highly efficient gas sensor based on quasi-periodic phononic crystals, Sens. Actuators, B, 2021, 345, 130418, DOI:10.1016/J.SNB.2021.130418.
- M. K. Praharaj, A. Satapathy and P. R. Mishra, Study of Acoustical and Thermodynamic Properties of Aqueous Solution of NaCl at different Concentrations and Temperatures through Ultrasonic Technique ARCHIVES OF APPLIED, Sci. Res., 2012, 4, 837–845 CAS.
- Q. Lin, F. Cai, F. Li, D. Zhao, X. Xia and W. Zhou, et al., The compact acoustic liquid sensor based on the circumferential modes of a cylindrical shell, Sens. Actuators, A, 2020, 304, 111843, DOI:10.1016/j.sna.2020.111843.
- H. Gharibi, A. Mehaney and A. Bahrami, High performance design for detecting NaI–water concentrations using a two-dimensional phononic crystal biosensor, J. Phys. D: Appl. Phys., 2020, 54, 015304, DOI:10.1088/1361-6463/ABB729.
- M. L. Miller and M. Doran, Concentrated salt solutions. II. Viscosity and density of sodium thiocyanate, sodium perchlorate and sodium iodide, J. Phys. Chem., 1956, 60, 186–189, DOI:10.1021/J150536A012/ASSET/J150536A012.
- A. S. Dukhin and P. J. Goetz, Bulk viscosity and compressibility measurement using acoustic spectroscopy, J. Chem. Phys., 2009, 130 DOI:10.1063/1.3095471.
- Q. Lin, F. Cai, F. Li, D. Zhao, X. Xia and W. Zhou, et al., The compact acoustic liquid sensor based on the circumferential modes of a cylindrical shell, Sens. Actuators, A, 2020, 304, 111843, DOI:10.1016/J.SNA.2020.111843.
- Z. A. Alrowaili, H. Makhlouf Fathy, H. A. Elsayed, M. Aouassa, M. H. Mahmoud and K. S. El-Nasser, et al., Heavy metals biosensor based on defective one-dimensional phononic crystals, Ultrasonics, 2023, 130, 106928, DOI:10.1016/J.ULTRAS.2023.106928.
- A. C. Hladky-Hennion, J. O. Vasseur, S. Degraeve, C. Granger and M. De Billy, Acoustic wave localization in one-dimensional Fibonacci phononic structures with mirror symmetry, J. Appl. Phys., 2013, 113, 154901, DOI:10.1063/1.4801890.
- G. N. Aliev and B. Goller, Quasi-periodic Fibonacci and periodic one-dimensional hypersonic phononic crystals of porous silicon: Experiment and simulation, J. Appl. Phys., 2014, 116, 094903, DOI:10.1063/1.4894620.
- W. Steurer and D. Sutter-Widmer, Photonic and phononic quasicrystals, J. Phys. D: Appl. Phys., 2007, 40, R229, DOI:10.1088/0022-3727/40/13/R01.
- Y. Chen, J. Dong, T. Liu and Q. Zhu, Refractive index sensing performance analysis of photonic crystal containing graphene based on optical Tamm state, Mod. Phys. Lett. B, 2016, 30 DOI:10.1142/S0217984916500305.
- R. Lucklum, M. Zubtsov and S. V. Arango, Cavity Resonance Biomedical Sensor, ASME Int Mech Eng Congr Expo Proc, 2015, 13, DOI:10.1115/IMECE2014-38222.
- F. Khateib, A. Mehaney and A. H. Aly, Glycine sensor based on 1D defective phononic crystal structure, Opt. Quantum Electron., 2020, 52, 1–16, DOI:10.1007/S11082-020-02599-9/TABLES/4.
- A. A. Shehatah and A. Mehaney, Temperature influences on the performance of biodiesel phononic crystal sensor, Mater. Res. Express, 2020, 6, 125556, DOI:10.1088/2053-1591/AB7404.
- J. Hu, X. Sun, A. Agarwal and L. C. Kimerling, Design guidelines for optical resonator biochemical sensors, J. Opt. Soc. Am. B, 2009, 26(5), 1032–1041, DOI:10.1364/JOSAB.26.001032.
- Z. A. Alrowaili, M. Aouassa, M. H. Mahmoud, K. S. El-Nasser, H. A. Elsayed and T. A. Taha, et al., Locally resonant porous phononic crystal sensor for heavy metals detection: A new approach of highly sensitive liquid sensors, J. Mol. Liq., 2023, 369, 120964, DOI:10.1016/J.MOLLIQ.2022.120964.
- H. A. Elsayed and A. Mehaney, Theoretical verification of photonic crystals sensor for biodiesel detection and sensing, Phys. Scr., 2020, 95, 085507, DOI:10.1088/1402-4896/ABA2B1.
- A. Mehaney, Z. A. Alrowaili, H. A. Elsayed, T. A. Taha and A. M. Ahmed, Theoretical investigations of Tamm plasmon resonance for monitoring of isoprene traces in the exhaled breath: Towards chronic liver fibrosis disease biomarkers, Phys. Lett. A, 2021, 413, 127610 CrossRef CAS.
- H. Gharibi, A. Mehaney and A. Bahrami, High performance design for detecting NaI–water concentrations using a two-dimensional phononic crystal biosensor, J. Phys. D: Appl. Phys., 2020, 54, 015304, DOI:10.1088/1361-6463/ABB729.
- P. Moradi, H. Gharibi, A. M. Fard and A. Mehaney, Four-channel ultrasonic demultiplexer based on two-dimensional phononic
crystal towards high efficient liquid sensor, Phys. Scr., 2021, 96, 125713, DOI:10.1088/1402-4896/AC2C23.
- A. Mehaney and I. I. Ahmed, Acetone sensor based 1D defective phononic crystal as a highly sensitive biosensor application, Opt. Quantum Electron., 2021, 53, 1–15, DOI:10.1007/S11082-021-02737-X/TABLES/5.
- F. Khateib, A. Mehaney and A. H. Aly, Glycine sensor based on 1D defective phononic crystal structure, Opt. Quantum Electron., 2020, 52, 1–16, DOI:10.1007/S11082-020-02599-9/TABLES/4.
- H. Gharibi, A. Mehaney and A. Bahrami, High performance design for detecting NaI–water concentrations using a two-dimensional phononic crystal biosensor, J. Phys. D: Appl. Phys., 2020, 54, 015304, DOI:10.1088/1361-6463/ABB729.
- A. Mehaney and I. I. Ahmed, Acetone sensor based 1D defective phononic crystal as a highly sensitive biosensor application, Opt. Quantum Electron., 2021, 53, 1–15, DOI:10.1007/S11082-021-02737-X/TABLES/5.
- F. Lucklum, Phononic-fluidic cavity sensors for high-resolution measurement of concentration and speed of sound in liquid solutions and mixtures, Meas. Sci. Technol., 2021, 32, 085108, DOI:10.1088/1361-6501/ABFDE0.
|
| This journal is © The Royal Society of Chemistry 2023 |
Click here to see how this site uses Cookies. View our privacy policy here. 
 Open Access Article
 This Open Access Article is licensed under a Creative Commons Attribution-Non Commercial 3.0 Unported Licence
 *b
*b

 indicates the acoustic wave velocity within every layer, such as the lead and epoxy layers, λ, μ are the coefficients of Lamé, and the subscript j = 1, 2 indicates the layer number in PnCs. Eqn (1) might, therefore, be resolved as follows:
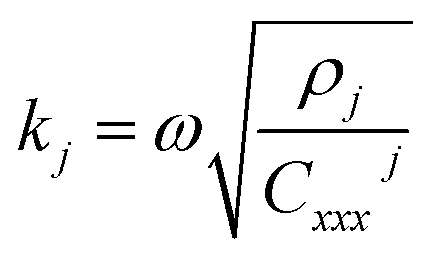 indicates the wavenumber in every layer, ρj indicates the mass density, ω indicates the angular frequency, Cxxxj describes the elastic stiffness constant of a distinct layer j. X and Y represent two arbitrary coefficients.68,69 The incident acoustic wave's stress components and dimensionless displacement can, therefore, be expressed as follows:
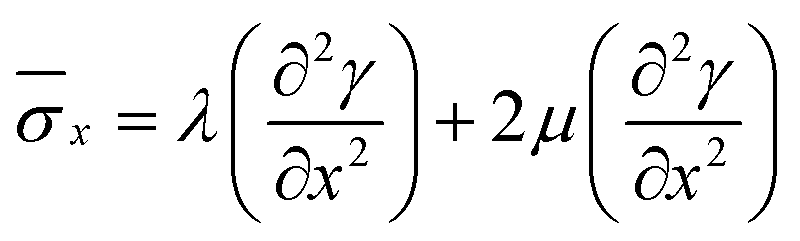
 indicates a 2 × 2 transfer matrix, and its elements are described as follows: