
 Open Access Article
 This Open Access Article is licensed under a Creative Commons Attribution-Non Commercial 3.0 Unported Licence
CeO2–Co3O4 nanocomposite with oxidase-like activity for colorimetric detection of ascorbic acid†
Jin Yang,
Shiqi Cheng,
Shangying Qin,
Li Huang,
Yuanjin Xu and
Yilin Wang *
*
College of Chemistry and Chemical Engineering, Guangxi Key Laboratory of Electrochemical Energy Materials, Guangxi University, Nanning 530004, China. E-mail: theanalyst@163.com
First published on 28th March 2023
Abstract
A CeO2–Co3O4 nanocomposite (NC) was prepared and characterized by scanning electron microscopy, transmission electron microscopy, X-ray photoelectron spectroscopy and X-ray diffraction. The obtained CeO2–Co3O4 NC displayed biomimicking oxidase-like activity, which can catalytically oxidize the 3, 3′, 5, 5′-tetramethylbenzidine (TMB) substrate from colorless to the blue oxidized TMB (ox-TMB) product with a characteristic absorption peak at 652 nm. When ascorbic acid (AA) was present, ox-TMB would be reduced, resulting in a lighter blue and lower absorbance. On the basis of these facts, a simple colorimetric method for detection of AA was established with a linear relationship ranging from 1.0 to 500 μM and a detection limit of 0.25 μM. When this method was used to detect AA in human serum and commercially available vitamin C tablet samples, a good recovery of 92.0% to 109.0% was obtained. Besides, the catalytic oxidation mechanism was investigated, and the possible catalytic mechanism of CeO2–Co3O4 NC can be described as follows. TMB is adsorbed on the CeO2–Co3O4 NC surface and provides lone-pair electrons to the CeO2–Co3O4 NC, leading to an increase in electron density of the CeO2–Co3O4 NC. An increased electron density can improve the electron transfer rate between TMB and the oxygen absorbed on its surface to generate O2˙− and ˙O2, which further oxidize TMB.
1. Introduction
Ascorbic acid (AA), also known as vitamin C, is one of the essential micronutrients in the human body because of its anti-oxidant properties. Although AA protects the body from the harmful effects of reactive oxygen and nitrogen species and plays a primary role in preventing cancer, scurvy, and cardiovascular diseases,1 it cannot be synthesized in the body. AA required by the human body can only be taken from the outside, such as through food or drugs. Therefore, the determination of AA content is very important in disease prevention, food and drug quality assurance. Up to now, various analytical techniques, such as colorimetry,2,3 fluorescence,4,5 high-performance liquid phase chromatography,6,7 capillary electrophoresis,8,9 electrochemical methods,10,11 and so on, have been used for AA detection. Because of its fast response, low cost, high sensitivity and good practicability, colorimetry has been preferred. With the development of nanotechnology, various nanomaterials12–15 have been found to possess peroxidase-like activity. Colorimetry based on the inhibitory effect of AA on peroxidase mimic catalyzed oxidation of 3, 3′, 5, 5′-tetramethylbenzidine (TMB) by H2O2 has been widely used in the determination of AA.12,13 For example, Ji et al.12 established a colorimetric method for the detection of AA by employing CoOOH nanoflake as peroxidase mimic. Using Co3O4@CeO2 nanotubes as peroxidase mimic, Lu et al.16 carried out colorimetric determination of AA. Although these methods utilizing peroxidase mimic exhibited high sensitivity, they were limited by the use of unstable H2O2 as an oxidant.Recent studies have shown that some nanomaterials have oxidase-like activity, which can catalyze the oxidation of TMB by adsorbed oxygen on the material surface or dissolved oxygen in the water. For instance, Co3O4 nanoparticles (NPs) possess oxidase-like activity and can catalytically oxidize TMB in the absence of H2O2. However, the presence of SO32− can inhibit the Co3O4 NPs-catalyzed TMB oxidation and cause an absorbance decrease. Based on this, a colormetric method for detection of SO32− was reported by Chen's group.17 Both SO42− ion-treated CeO2 nanorods18 and polyacrylic acid-coated CeO2 NPs19 exhibit oxidase-like catalytic activity and have been applied for colorimetric detection of glutathione and organophosphorus pesticides respectively. Similarly, Ag NPs-single walled carbon nanotube nanocomposite with oxidase-like activity has been used for the colorimetric detection of AA.20 Compared with the peroxidase mimic, the oxidation of TMB catalyzed by the oxidase mimic does not use H2O2, which simplifies the determination process.
Although the colorimetric approach based on CeO2–Co3O4 composite as a peroxidase mimic has been used to determine AA16 and glucose,21,22 the research on CeO2–Co3O4 composite material as an oxidase mimic has not been reported. In this work, CeO2–Co3O4 nanocomposite (NC) with oxidase-like activity was prepared by spontaneous precipitation of inorganic precursors. This could provide enough active sites to effectively catalyze the O2 adsorbed on its surface and accelerate electron transfer in TMB, resulting in the formation of blue oxidized TMB (ox-TMB). As a reductant, AA caused the reduction of ox-TMB, resulting in the blue color fading and absorbance decreasing. Therefore, by measuring the change of absorbance of the CeO2–Co3O4 NC-TMB system before and after adding AA, a colorimetric method for AA detection was established (Scheme 1). It exhibited the advantages of simple material preparation, fast detection speed, high sensitivity, and accuracy.
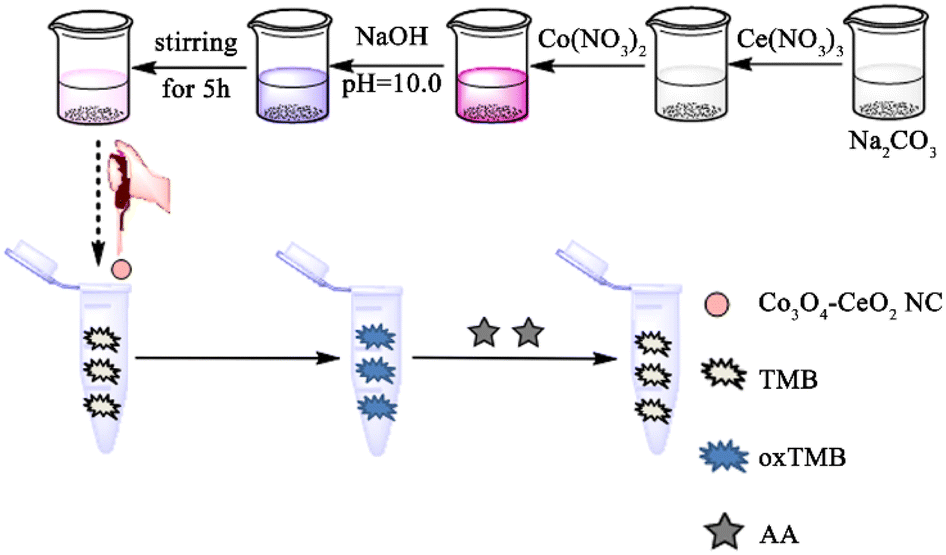 | ||
| Scheme 1 Schematic illustration of CeO2–Co3O4 NC preparation and AA detection. | ||
2. Experimental
2.1 Reagents and instrumentation
Cerium nitrate hexahydrate (Ce(NO3)3·6H2O), TMB, cobalt nitrate hexahydrate (Co(NO3)2·6H2O) and glucose were purchased from Shanghai Maclean Biochemical Co., Ltd. Sodium hydroxide (NaOH), sodium carbonate (Na2CO3), sodium acetate (NaAc), acetic acid (HAc), ascorbic acid (AA), urea, dopamine (DA) and 2-propanol (IPA) were obtained from Guangdong Guanghua Technology Co., Ltd. p-Benzoquinone (PBQ), glutamine (Gln), serine (Ser), histidine (His), and isoleucine (Ile). Phenylalanine (Phe), lactose (Lac), starch, alanine (Ala), arginine (Arg), glutamic acid (Glu), rhamnose (Rha), fructose (Fru), glycine (Gly), uric acid (UA) and lysine (Lys) were obtained from Tianjin Damao Chemical Reagent Factory.UV-Vis spectra were obtained from a UV-4802 (Shimadzu, China). The scanning electron microscopy (SEM) images were obtained on a S-3400N microscopy system (Hitachi Co., Japan). Transmission electron microscopy (TEM) images were obtained using a Tecnai G2 F20 S-TWIN (FEI Co., USA). X-ray diffraction (XRD) was determined by a D8 ADVANCE instrument (Bruker AXS Co., Ltd., Germany). X-ray photoelectron spectroscopy (XPS) measurements were implemented with an Escalab 250Xi apparatus (Thermo Fisher Scientific Inc., USA). Electrochemical measurement was carried out on a CHI600D electrochemical workstation (Shanghai, China).
2.2 Preparation of CeO2–Co3O4 NC
CeO2–Co3O4 NC with oxidase-like activity was prepared by spontaneous precipitation of inorganic precursors. First, 2.649 g Na2CO3 and 100 mL of double deionized water (DDW) were mixed in a 250 mL beaker which was placed in a 60 °C water bath. Then, 5 mL of Ce(NO3)3 (0.5 M) was slowly added to the beaker with stirring to get a milky turbid solution. After that, 15 mL of Co(NO3)2 (0.5 M) was added drop by drop to the turbid solution, and the color of the solution gradually changed to taro purple. Followed by adjusting the pH to 10.0 with a NaOH solution of 0.5 M. The reaction continued at this temperature for 5 h, the obtained pink-purple precipitate was transferred to a beaker and washed with DDW several times until the washing solution was neutral. Finally, the washed precipitate was dried at 60 °C for 12 h in a vacuum oven. Before the experiment, 15 mg CeO2–Co3O4 NC was dispersed in 10 mL DDW, and ultrasonic treatment was carried out for 30 min. For comparative study, the pure Co3O4 and CeO2 were also prepared in a similar way.2.3 Procedures for AA determination
In a series of centrifugal tubes, 200 μL of 1.5 mg mL−1 CeO2–Co3O4 NC, 200 μL of TMB (10 mM), 1400 μL of HAc-NaAc buffer (pH = 4.0) and 200 μL of AA with different concentration were added in turn. The well-mixed solutions were then incubated at room temperature for 8 min prior to absorption spectra measurement. The decrease of absorbance at 652 nm defined as ΔA (ΔA = A0 − A, in which A0 and A represent the absorbance in the absence and presence of AA, respectively) was employed to optimize the detection conditions and establish the calibration curve.3. Results and discussion
3.1 Characterization of CeO2–Co3O4 NC
The SEM (Fig. 1A) and TEM (Fig. S1†) images indicate that the as-prepared composite is in cluster structure. The HRTEM image (Fig. 1B) shows three lattice spacings of 0.27, 0.31, and 0.29 nm, corresponding to the (200), (111) crystal planes of CeO2 (ref. 23 and 24) and (220) crystal lattice plane of Co3O4,21,25 respectively. The elemental composition of as-prepared CeO2–Co3O4 NC was obtained by utilizing EDX spectroscopy and displayed in Fig. 1C and D. The presence of O, Co, and Ce in the sample is evident. Moreover, their atomic percentages of them are 73.01, 19.63, and 7.36%, respectively. The atomic ratio of Co and Ce is 2.7![[thin space (1/6-em)]](https://www.rsc.org/images/entities/char_2009.gif) :1, which is very close to the feeding ratio of 3:1. All these confirm that Co3O4 nanolayer was successfully grown on the surface of CeO2 NPs, and the nanocomposite was prepared as expected.
:1, which is very close to the feeding ratio of 3:1. All these confirm that Co3O4 nanolayer was successfully grown on the surface of CeO2 NPs, and the nanocomposite was prepared as expected.
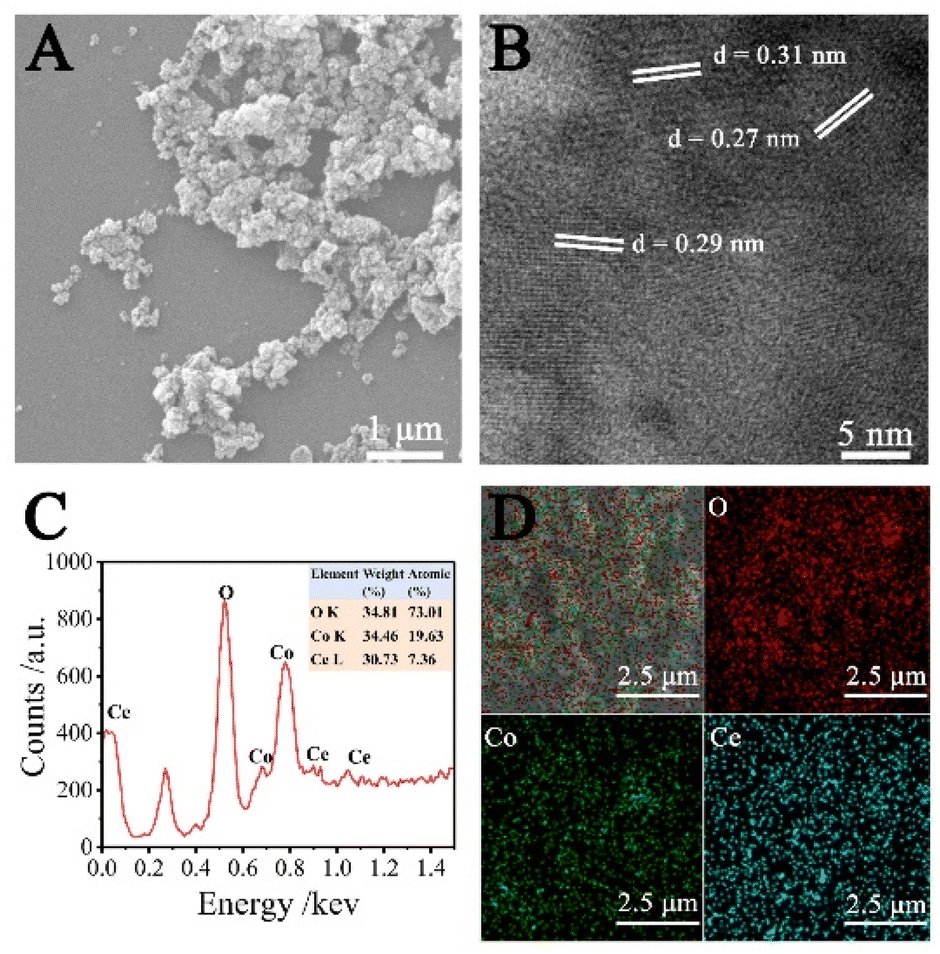 | ||
| Fig. 1 (A) SEM and (B) HRTEM images of CeO2–Co3O4 NC, (C) EDX spectrum of CeO2–Co3O4 NC, (D) EDX element mapping images of O, Co, and Ce. | ||
To investigate the crystal structure and chemical composition, the XRD and XPS spectra of CeO2–Co3O4 NC were obtained. As shown in Fig. 2A, the characteristic peaks (2θ) are observed at 19°, 31°, 36°,38°,45°, 55°and 59°, corresponding to (111), (220), (311), (222), (400), (422) and (511) crystal planes of the cubic Co3O4, respectively, and well-matched with JCPD no. 42-1467. Moreover, the diffraction peaks corresponding to CeO2 (JCPD No.34-0394), including 28° (111), 33° (200), 47° (220), 56° (311), and 59° (222), can also be observed from the XRD pattern. As can be seen, the obtained CeO2–Co3O4 NC exhibits a weak diffusion peak, indicating the low crystallinity of the sample. Moreover, as seen in Fig. S2A,† both CeO2 and Co3O4 crystalline phases are present in the CeO2–Co3O4 NC, which further confirms the formation of CeO2–Co3O4 NC. Compared with the crystalline phase, low crystallinity possesses rich surface defects and lattice dislocations, which can provide more catalytic sites.26
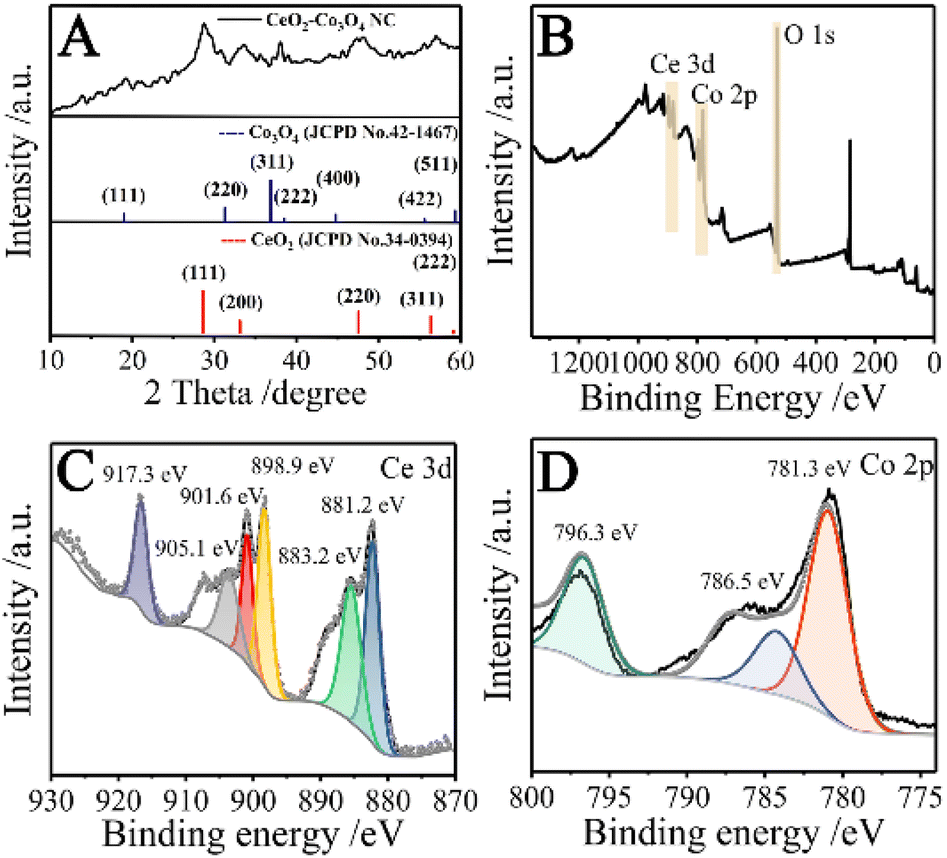 | ||
| Fig. 2 (A) XRD and (B) XPS spectra of CeO2–Co3O4 NC; (C) XPS of Ce 3d; (D) XPS of Co 2p. | ||
As displayed in Fig. 2B, the existence of Ce, Co, and O elements can be demonstrated in the XPS spectrum of CeO2–Co3O4 NC. To further identify the oxidation state of Ce, the 3d XPS spectrum of Ce was investigated (Fig. 2C). The peaks located at 883.2, 898.9, 901.6, and 917.3 eV are related to Ce4+,26 while the peaks at 881.2 and 905.1 eV correspond to Ce3+.27,28 These results reveal the existence of mixed valence cerium (Ce4+/Ce3+) in the ceria lattice. The Co 2p spectrum (Fig. 2D) was fitted into three peaks. The peaks at 781.3 and 796.3 eV belong to Co 2p3/2 and Co 2p1/2, respectively, indicating the presence of Co3+ ions.29,30 The peak at 786.5 eV can be attributed to 2p3/2 of Co2+ ions.31 The coexistence of Co2+ and Co3+ is favorable evidence of the Co3O4 phase in CeO2–Co3O4 NC. The spectrum of O 1s (Fig. S2B†) consists of three peaks at 529.9, 531.2 and 532.7 eV, which can be attributed to the lattice oxygen (529.9 eV), defective oxygen (531.2 eV) and chemisorbed oxygen (532.7 eV),26,29 respectively. The relative content of defective oxygen on the surface of CeO2–Co3O4 NC was calculated to be 38.34%. It should be noted that sufficient surface defects (Ce3+) and high defective oxygen content can improve the catalytic performance of oxidase.26,32
3.2 Oxidase-like catalytic activity of CeO2–Co3O4 NC and kinetic analysis
In order to explore the oxidase-like activity of CeO2–Co3O4 NC toward TMB, various chemicals, including H2O, Ce(NO3)3, Co(NO3)2 and CeO2–Co3O4 NC, were mixed with 1600 μL of HAc-NaAc buffer (pH = 4.0, hereinafter referred to as a buffer) containing 200 μL of TMB (10 mM), respectively. Then, the photos of the solution were taken and the corresponding absorption spectra were recorded. As displayed in Fig. 3A, TMB in the buffer is colorless without absorption at 652 nm. TMB in the buffer involving cerium ions and cobalt ions are also colorless, indicating that no oxidation reaction occurs. However, TMB in the buffer containing CeO2–Co3O4 NC results in a blue solution, and strong absorbance at 652 nm is observed, which is similar to MnO2 NSs,33 Pd cube@CeO2 (ref. 34) and Co@N-CNTs35 catalyzed TMB oxidation. All these results reveal that the obtained CeO2–Co3O4 NC exhibits oxidase-like catalytic activity toward TMB oxidation.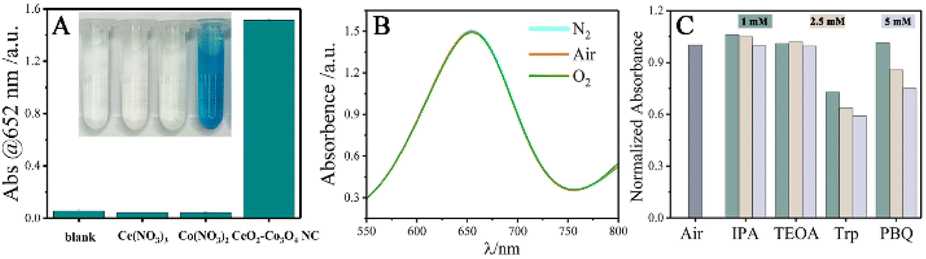 | ||
| Fig. 3 (A) Absorbance of TMB in different solutions and digital photos of corresponding solutions; (B) absorption spectra of CeO2–Co3O4 NC-TMB systems under air, O2-saturated and N2-saturated conditions; (C) control experiment in the oxidation of TMB in the presence of reactive oxygen species scavengers, in which the three colors represent the effect of different concentrations of reactive oxygen scavenger on absorbance (from left to right, the concentration is 1 mM, 2.5 mM, and 5 mM). | ||
The oxidation of TMB involves electron transfer, and the electron transfer ability of CeO2–Co3O4 NC modified glassy carbon electrode (GCE) toward the electrochemical oxidation of TMB was investigated by cyclic voltammetry (CV). The CV responses of TMB at bare GCE and the CeO2–Co3O4 NC-modified GCE are shown in Fig. S3.† Two pairs of well-defined redox peaks of TMB can be observed on all electrodes. Compared with bare GCE, the current of CeO2–Co3O4 NC-modified GCE is significantly enhanced. Suggesting that CeO2–Co3O4 NC shows electrocatalytic activity for the oxidation of TMB and has the ability to promote electron transfer rates between the conductive interlayers.
Generally, the substrate of oxidase mimics-catalyzed TMB oxidation is dissolved oxygen or adsorbed oxygen.17,36 To identify whether the oxidant for oxidizing TMB was dissolved oxygen or adsorbed oxygen, the CeO2–Co3O4 NC-catalyzed TMB oxidation was first investigated under the conditions of air, N2, and O2 saturation, respectively. As shown in Fig. 3B, compared with the air-saturated solution, the activity of CeO2–Co3O4 NC is not inhibited in N2 saturated solution and not enhanced in O2 saturated atmosphere, implying that the dissolved oxygen has no effect on TMB oxidation. The O 1s peak at 532.7 eV in the XPS spectrum (Fig. S2B†) reveals the existence of chemisorption oxygen17 on the surface of CeO2–Co3O4 NC. It has been demonstrated that the chemisorption oxygen on the surface of nanomaterials could lead to the oxidation of TMB.17 Accordingly, we believe that CeO2–Co3O4 NC catalyzes the chemisorbed oxygen on its surface to oxidize TMB for color development. To identify the reactive oxygen species (ROS) associated with the catalytic reaction, four scavengers, including tryptophan (Trp),36 p-Benzoquinone (PBQ),37 2-propanol (IPA),38 and triethanolamine (TEOA)39 were used as the quenchers for detecting singlet oxygen (˙O2), superoxide anion (O2˙−), hydroxyl radical (˙OH), and photogenerated holes (h+), respectively. As displayed in Fig. 3C, the absorbance of the obtained solution hardly changes with IPA and TEOA scavengers and their concentrations, but decreases with the increase in PBQ and Trp scavenger concentrations. Indicating that the catalytic activity of CeO2–Co3O4 NC is attributed to the generation of O2˙− and ˙O2. Based on the above observations, the possible catalytic mechanism of CeO2–Co3O4 NC can be described as follows. TMB is adsorbed on CeO2–Co3O4 NC surface and provides lone-pair electrons to CeO2–Co3O4 NC, leading to an increase in the electron density of CeO2–Co3O4 NC. An increased electron density can improve the electron transfer rate between TMB and the oxygen absorbed on its surface to the generation of O2˙− and ˙O2, which further oxidize TMB. Thus, the oxidation rate of TMB by O2 is accelerated.
To further understand the kinetic mechanism of the oxidase-like activity of CeO2–Co3O4 NC, the apparent kinetic parameters of the catalytic oxidation reaction were measured by varying TMB concentrations. Kinetic parameters were calculated using the double reciprocal of the Michaelis–Menten equation. 1/V = (Km/Vmax) × (1/[S]) + 1/Vmax, in which Vmax and V are the maximal and initial reaction velocity, respectively, [S] refers to the substrate concentration, Michaelis–Menten constant (Km) indicates the affinity of the enzyme to its substrate. A typical Michaelis–Menten model for CeO2–Co3O4 NC is exhibited in Fig. S4.† The Km value for CeO2–Co3O4 NC toward TMB was calculated to be 0.15 mM, which is lower than that of most oxidase mimics (Table S1†), indicating that CeO2–Co3O4 NC possesses a greater catalytic activity toward TMB.
3.3 Application of CeO2–Co3O4 NC in AA detection
Under the catalysis of CeO2–Co3O4 NC, colorless TMB can be oxidized by adsorption oxygen to form blue ox-TMB with an absorption peak at 652 nm. The addition of AA results in color fading and an absorbance decrease. Thus, an analytical method for the colorimetric detection of AA can be established. For the best response, the reaction conditions, including pH, incubation time, and the concentrations of TMB, CeO2–Co3O4 NC, which may affect the change of absorbance, were optimized at room temperature. As illustrated in Fig. S5,† the favourable pH, incubation time, TMB and CeO2–Co3O4 NC concentrations for the CeO2–Co3O4 NC – catalyzed TMB oxidation are 4.0, 8 min, 1.0 mM and 0.15 mg mL−1, respectively. Under the above conditions, the effect of AA concentration on the absorption spectrum of CeO2–Co3O4 NC -TMB system was investigated. As shown in Fig. 4A, the absorbance at 652 nm decreases with the increase of AA concentration. Furthermore, the decrease of absorbance (ΔA) is linear to AA concentration from 1.0 to 500 μM (Fig. 4B) with a regression equation ΔA = 0.0016C + 0.0257 and a correlation coefficient R2 of 0.9945. A low detection limit of 0.25 μM was obtained based on 3δ/k. Compared with existing AA colorimetric detection (Table S2†), this method exhibits a wide linear range and a low detection limit, demonstrating a sensitive method for AA determination.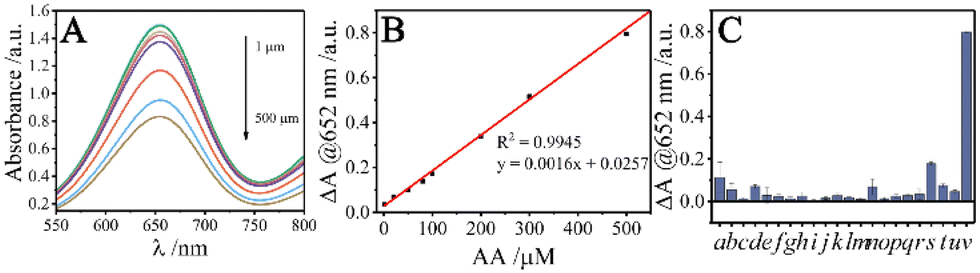 | ||
| Fig. 4 (A) Absorption spectra of CeO2–Co3O4 NC-TMB in the presence of AA at different concentrations; (B) linear curve formed by fitting ΔA and AA concentration; (C) selectivity of AA assay (From left to right: (a) K+, (b) Mg2+, (c) Ca2+, (d) starch, (e) glucose, (f) Lac, (g) Fru, (h) Rha, (i) Lys, (j) Phe, (k) Ala, (l) Arg, (m) Glu, (n) Gln, (o) Ser, (p) His, (q) Gly, (r) Ile, (s) UA, (t) DA, (u) urea, and (v) AA). | ||
The selectivity for AA detection was evaluated by using K+, Mg2+, Ca2+, common sugars (starch, Lac, glucose, Fru, Rha), a series of amino acids (Lys, Phe, Ala, Arg, Glu, Gln, Ser, His, Gly, and Ile), and reducing substances (UA, DA, and urea) as the interferences. The concentration of interfering substances is 20-fold to AA except for UA, DA, and urea which have the same concentration as AA respectively. As shown in Fig. 4C, the ΔA of AA is greater than that of most interferents, implying that the influence of interferents on AA detection can be almost neglected.
To evaluate the feasibility of the method in practical application, the concentration of AA in commercial vitamin C tablets and human serum samples was determined. The vitamin C tablet was purchased from a drugstore in Nanning. A certain quality of tablet powder was dissolved, filtered, and diluted to prepare the solution to be tested. The serum sample from a healthy adult was provided by volunteer in our team and extracted by Guangxi University Affiliated Hospital (Nanning, China). The serum was 2-fold diluted with BR (pH = 6) buffer. 200 ell of the pre-treated solution was taken, and the detection of AA was performed according to the procedure described in Section 2.3. For standard addition measurement, a certain amount of AA was spiked into the pre-treated sample. As shown in Table 1, the recoveries of AA in two samples are between 92.0% and 109.0%, with the relative standard deviation (RSD) less than 3.0%. The AA concentration was determined to be 311.6 μM in a 110-fold dilution vitamin C tablet sample. Considering the sample weight, the content of AA in vitamin C tablet was calculated to be 92.3 mg g−1, which was consistent with the quantity indicated on the package (91.7 mg g−1). These results demonstrated the CeO2–Co3O4 NC-TMB based colorimetric method is of high accuracy and precision when applied to the measurement of AA in practical samples.
| Samples | Added (μM) | Measured (μM) | Recovery (%) | RSD (%) |
|---|---|---|---|---|
| Vitamin C tablet | 0.0 | 311.6 | 100.5 | 0.5 |
| 30.0 | 339.2 | 97.3 | 0.6 | |
| 50.0 | 364.5 | 109.0 | 2.1 | |
| Human serum | 30.0 | 31.7 | 105.6 | 3.0 |
| 50.0 | 46.0 | 92.0 | 2.6 |
4. Conclusions
We have established a colorimetric method for AA detection based on the oxidase-like activity of CeO2–Co3O4 NC. The proposed method exhibited good selectivity and high sensitivity, which was applied in the determination of AA in actual samples with satisfactory results. The research not only provided a new idea for the construction of nanoenzyme with oxidase-like activity, but also broadened the application range of oxidase mimics. The limitation of the method was that it was not suitable for continuous and in situ analysis.Conflicts of interest
There are no conflicts of interest to declare.Acknowledgements
The authors thank the Innovation Project of Guangxi Graduate Education (YCSW2021050) and the Opening project of Guangxi Key Laboratory of Electrochemical Energy Materials (KF2020012) for its financial support.Notes and references
- Y. Guo, J. Du, J. Li, R. Yang, P. d. B. Harrington and Z. Li, New J. Chem., 2021, 45, 6301–6307 RSC.
- Q. Gao, J. Wan, X. Chen, X. Mo, Y. Sun, J. Zou, J. Nie and Y. Zhang, RSC Adv., 2021, 11, 39306–39310 RSC.
- X. Shu, Y. Chang, H. Wen, X. Yao and Y. Wang, RSC Adv., 2020, 10, 14953–14957 RSC.
- K. Xing, J. Ge, W. Wang, X. Geng, X. Shen, J. Tang, L. Qu, Y. Sun and Z. Li, New J. Chem., 2019, 43, 9466–9471 RSC.
- C. Tang, R. Long, X. Tong, Y. Guo, C. Tong and S. Shi, Microchem. J., 2021, 164, 106000 CrossRef CAS.
- N. Baenas, F. J. Salar, R. Domínguez-Perles and C. García-Viguera, Molecules, 2019, 24, 1632–1642 CrossRef CAS PubMed.
- R. Zuo, S. Zhou, Y. Zuo and Y. Deng, Food Chem., 2015, 182, 242–245 CrossRef CAS PubMed.
- M. M. A. C. Ribeiro, A. A. Prado, A. Domingues Batista, R. Alejandro Abarza Munoz and E. Mathias Richter, J. Sep. Sci., 2019, 42, 754–759 CrossRef CAS PubMed.
- B. M. C. Costa, A. A. Prado, T. C. Oliveira, L. P. Bressan, R. A. A. Munoz, A. D. Batista, J. A. F. da Silva and E. M. Richter, Talanta, 2019, 204, 353–358 CrossRef CAS PubMed.
- A. Ali, R. Jamal and T. Abdiryim, RSC Adv., 2021, 11, 33425–33430 RSC.
- S. Cheng, J. Yang, S. Qin, L. Huang, Y. Xu and Y. Wang, New J. Chem., 2023, 47, 3361–3367 RSC.
- D. Ji, Y. Du, H. Meng, L. Zhang, Z. Huang, Y. Hu, J. Li, F. Yu and Z. Li, Sens. Actuators, B, 2018, 256, 512–519 CrossRef CAS.
- H. Sun, X. Liu, X. Wang, Q. Han, C. Qi, Y. Li, C. Wang, Y. Chen and R. Yang, Microchim. Acta, 2020, 187, 110 CrossRef CAS PubMed.
- X. Shu, D. Wang, C. Yuan, X. Qin and Y. Wang, Chem. J. Chin. Univ., 2021, 42, 1761–1767 CAS.
- R. Shi, S. Wei, S. Cheng, J. Zeng, Y. Wang and X. Shu, Chem. Res. Chin. Univ., 2022, 38, 985–990 CrossRef CAS.
- Y. Zhu, Z. Yang, L. Song, M. Chi, M. Li, C. Wang and X. Lu, Part. Part. Syst. Charact., 2018, 35, 1800049 CrossRef.
- X. Zhang, F. W. Qin, L. Su, C. Yang, Y. Ma, H. Zhang and X. Chen, J. Agric. Food Chem., 2014, 62, 5827–5834 CrossRef PubMed.
- L. Huang, W. Zhang, K. Chen, W. Zhu, X. Liu, R. Wang, X. Zhang, N. Hu, Y. Suo and J. Wang, Chem. Eng. J., 2017, 330, 746–752 CrossRef CAS.
- S. Zhang, S. Xue, J. Deng, M. Zhang, G. Shi and T. Zhou, Biosens. Bioelectron., 2016, 85, 457–463 CrossRef CAS PubMed.
- F. Li, Y. Yu, F. Xiao, H. Liang, C. Liu, P. Fan and S. Yang, Luminescence, 2020, 35, 1084–1091 CrossRef CAS PubMed.
- D. Jampaiah, T. Srinivasa Reddy, V. E. Coyle, A. Nafady and S. K. Bhargava, J. Mater. Chem. B, 2017, 5, 720–730 RSC.
- N. Alizadeh, A. Salimi and R. Hallaj, Sens. Actuators, B, 2019, 288, 44–52 CrossRef CAS.
- Y. Lei, W. Li, Q. Liu, Q. Lin, X. Zheng, Q. Huang, S. Guan, X. Wang, C. Wang and F. Li, Fuel, 2018, 233, 10–20 CrossRef CAS.
- W. Wang, W. Yu, P. Du, H. Xu, Z. Jin, R. Si, C. Ma, S. Shi, C. Jia and C. Yan, ACS Catal., 2017, 7, 1313–1329 CrossRef CAS.
- J. Liu, H. Xia, L. Lu and D. Xue, J. Mater. Chem., 2010, 20, 1506–1510 RSC.
- J. Lian, P. Liu, C. Jin, Q.-Y. Liu, X. Zhang and X. Zhang, ACS Sustainable Chem. Eng., 2020, 8, 17540–17550 CrossRef CAS.
- D. Jampaiah, T. Srinivasa Reddy, A. E. Kandjani, P. R. Selvakannan, Y. M. Sabri, V. E. Coyle, R. Shukla and S. K. Bhargava, J. Mater. Chem. B, 2016, 4, 3874–3885 RSC.
- D. Deng, N. Chen, Y. Li, X. Xing, X. Xiao and Y. Wang, Catal. Lett., 2015, 145, 1344–1350 CrossRef CAS.
- H. Liu, Y. Ding, B. Yang, Z. Liu, Q. Liu and X. Zhang, Sens. Actuators, B, 2018, 271, 336–345 CrossRef CAS.
- X. Liu, L. Yan, H. Ren, Y. Cai, C. Liu, L. Zeng, J. Guo and A. Liu, Biosens. Bioelectron., 2020, 165, 112342 CrossRef CAS PubMed.
- L. Xu, Q. Jiang, Z. Xiao, X. Li, J. Huo, S. Wang and L. Dai, Angew. Chem., Int. Ed., 2016, 55, 5277–5281 CrossRef CAS PubMed.
- D. Jampaiah, S. J. Ippolito, Y. M. Sabri, J. Tardio, P. R. Selvakannan, A. Nafady, B. M. Reddy and S. K. Bhargava, Catal. Sci. Technol., 2016, 6, 1792–1803 RSC.
- N. Alam, C. H. Ravikumar, M. Sreeramareddygari, M. Somasundrum and W. Surareungchai, Anal. Bioanal. Chem., 2022, 415, 703–713 CrossRef PubMed.
- J. Wang, P. Ni, C. Chen, Y. Jiang, C. Zhang, B. Wang, B. Cao and Y. Lu, Microchim. Acta, 2020, 187, 115 CrossRef CAS PubMed.
- T. Chen, J. Cao, X. Bao, Y. Peng, L. Liu and W. Fu, RSC Adv., 2021, 11, 39966–39977 RSC.
- M. Wang, X. Zhou, S. Wang, X. Xie, Y. Wang and X. Su, Anal. Chem., 2021, 93, 3130–3137 CrossRef CAS PubMed.
- C. Jin, J. Lian, Y. Gao, K. Guo, K. Wu, L. Gao, X. Zhang, X. Zhang and Q. Liu, ACS Sustainable Chem. Eng., 2019, 7, 13989–13998 CrossRef CAS.
- F. Li, N. Li, C. Xue, H. Wang, Q. Chang, H. Liu, J. Yang and S. Hu, Chem. Eng. J., 2020, 382, 122484 CrossRef CAS.
- M. Chen, R. Lu and A. Yu, Mater. Lett., 2020, 263, 127253 CrossRef CAS.
Footnote |
| † Electronic supplementary information (ESI) available. See DOI: https://doi.org/10.1039/d3ra01074k |
| This journal is © The Royal Society of Chemistry 2023 |