
 Open Access Article
 This Open Access Article is licensed under a Creative Commons Attribution-Non Commercial 3.0 Unported Licence
Exploring the chemical composition and coloring qualities of cacao fruit epicarp extracts†
Jesús A. Oñate-Gutiérrez,
Luis M. Díaz-Sánchez,
Diana L. Urbina,
Julio R. Pinzón,
Cristian Blanco-Tirado and
Marianny Y. Combariza *
*
Escuela de Química, Universidad Industrial de Santander, Bucaramanga, Santander, Colombia. E-mail: marianny@uis.edu.co
First published on 24th April 2023
Abstract
Cacao pod husks (CHs), the most abundant by-product of cacao beans production, can potentially become a source of functional ingredients for the food, cosmetic, and pharmaceutical industries. Three pigment samples (yellow, red, and purple) from lyophilized and ground cacao pod husk epicarp (CHE), were isolated by ultrasound-assisted solvent extraction, with yields between 11 and 14 wt%. The pigments exhibited UV-Vis flavonoid-related absorption bands at 283 nm and 323 nm and, only for the purple extract, reflectance bands in the 400–700 nm range. As per the Folin–Ciocalteu method, the CHE extracts contain high yields of antioxidant phenolic compounds amounting to 161.6, 153.9, and 167.9 mg GAE per g extract for the yellow, red, and purple samples, respectively. Phloretin, quercetin, myricetin, jaceosidin, and procyanidin B1 were among the main flavonoids identified by MALDI-TOF MS. A biopolymeric bacterial–cellulose matrix can effectively retain up to 541.8 mg of CHE extract per g of cellulose in dry weight. Also, MTT assays revealed that CHE extracts are non-toxic and increase viability in cultured VERO cells.
1. Introduction
Cacao crops represent an important and growing agricultural commodity in the global outlook.1,2 Worldwide cacao beans production reached 5226 thousand tonnes in 2021, with Ivory Coast, Ghana, Ecuador, and Cameroon as leading producers.3 Colombia ranks tenth on the list with a yearly production of 69![[thin space (1/6-em)]](https://www.rsc.org/images/entities/char_2009.gif) 040 tonnes, representing a participation of 1.35% in the global market.4 Colombia's geo-climatic conditions, with plentiful and well-distributed rainfall and relatively high temperature and humidity, are ideal for cacao crops. Ninety-five percent of Colombia's cacao bean exports belong to the “fine of flavor” category.5 Also, the Colombian cacao supply chain includes industrial processes that transform cacao beans into intermediate and final products, such as cacao liquor, butter, cacao, couverture, and chocolate confectionary.6
040 tonnes, representing a participation of 1.35% in the global market.4 Colombia's geo-climatic conditions, with plentiful and well-distributed rainfall and relatively high temperature and humidity, are ideal for cacao crops. Ninety-five percent of Colombia's cacao bean exports belong to the “fine of flavor” category.5 Also, the Colombian cacao supply chain includes industrial processes that transform cacao beans into intermediate and final products, such as cacao liquor, butter, cacao, couverture, and chocolate confectionary.6
One problem affecting the cacao industry in producing countries is the disposal and treatment of organic by-products generated during cacao fruit processing. Material's circularity in cacao beans (CB) production is only 8 to 10 wt% of the fruit, with the remaining percentage represented by cacao pod husk (CH), cacao mucilage exudate (CME), cacao placenta (CP), and cacao bean shell (CBS).7,8 CH makes up 67 to 76 wt% of the fruit;9 in other words, 10 tonnes of CH are produced for each tonne of dry CBs.10 Cacao bean harvesting is manually intensive, involving opening the cacao fruit, extracting the beans, and discarding the CH right by the crop. This common practice creates appropriate conditions for pathogenic microorganisms' proliferation, mainly fungi, and bacteria.11 Thus, sanitary practices suggest harvesting the whole fruits and extracting the beans far from the crop. This notion has forced farmers to find alternative uses for cacao fruit residues. Fueled by the farmers need, new technological uses for cacao fruit by-products are flourishing. CH mainly contains moisture (up to 85 wt%), followed by fibrous materials (cellulose, hemicellulose, lignin, pectin) and ash.11 Structurally, CH comprises three layers: epicarp, mesocarp, and endocarp. The epicarp is the fruit's outermost layer, rich in waxes, pigments, hemicellulose, and minerals. The mesocarp contains mainly cellulose and fiber and the endocarp is rich in protein, crude fat, and pectin. As with any agro-industrial residue, chemical composition determines applications/uses. CH currently finds uses, among many others, as animal feed,12 soap making,13 nanoparticle synthesis,14 activated carbon,15 paper making,16 and biofuels (bio-gas, bio-oils).17 For human food applications, pectin in CH can be a source of xylitol.18,19
Increasing material circularity in agroindustry and a natural ingredient boom are strong drivers in food, cosmetics, and pharma (nutraceutical) consumption trends nowadays.20,21 Coloring food/cosmetics/pharma products has a long history of synthetic additive use due to the low cost and astounding color range of artificial dyes.22 However, synthetic dyes, even those vetted for food/cosmetics/pharma applications, exhibit a broad spectrum of adverse health effects from genotoxicity and allergic reactions (asthma, hives, rhinitis), to hyperactivity in children.23–25 As a consequence, using natural pigments for coloring is an essential topic in the modern chemistry toolbox for designing natural products. Fascinatingly, cacao fruits, with their broad color range-determined primarily by the clone type and fruit maturity stage26 could be a potential source of healthy and functional coloring materials.27 Previous studies show flavonoids as responsible for the red, orange, maroon, and yellow hues in cacao fruits epicarp.28
Flavonoids are low molecular weight molecules, widely distributed in nature, with a C6–C3–C6 carbon architecture belonging to the group of polyphenolic compounds.29 Considered secondary metabolites, together with terpenoids and alkaloids, nearly 10000 flavonoids have been identified in plants. Flavonoid protective functions include fending plants against fungi, herbivores, pathogens attacks, and cellular oxidative stress.30 The biosynthesis of flavonoids in plants involves the phenylpropanoids pathway. Various enzyme-catalyzed reactions lead to the formation of p-coumaroyl-CoA from phenylalanine; the reaction continues by condensation with malonyl-CoA to generate a chalcone, which further transforms into the various flavonoid classes.31,32 Flavonoids and their glycoside derivatives play a vital role in the human diet; their regular consumption has proven antibacterial, antioxidant, antiviral, cytotoxic, anti-inflammatory, anti-allergic, and vasodilator effects.30,33 The many advantages of flavonoids, such as dyes and biologically-beneficial ingredients, make them the topic of active research. Thus, flavonoids from cacao pod husk epicarp could serve as food coloring ingredients, provide health benefits, and generate agro-based derivates from cacao fruits by-products, increasing the economic profitability of the crop. This work studies the chemical, spectroscopic, and toxicological properties of three flavonoid-rich extracts isolated by solid/liquid extraction from cacao pod husk epicarp. The color retention/fastness of the CHE extracts were tested using bacterial cellulose produced using residual sugars from the cacao fruit. The cytotoxic activity of the CH epicarp extracts was measured by the MTT assay.
2. Materials and methods
2.1. Cacao pod husk samples
Ripe cacao fruits were gathered in cacao plantations located in the rural area of San Vicente de Chucurí (Santander – Colombia) from mature trees (clone CCN-51) during the high harvest season of 2021. The fruits were processed in the lab to obtain cacao pod husks (CHs), cacao beans (CBs), cacao mucilage exudate (CME), and cacao placenta (CP) as previously described.7 The epicarp, corresponding to a 2–5 mm thick outer layer of the fruit, was immediately removed from the fresh CHs. The epicarp samples were placed in cold water (10 °C), frozen, lyophilized and ground in a ball mill. The cacao pod husk epicarp (CHE) powder was sieved (particle size <250 μm) and stored in amber bottles at room temperature. This methodology was repeated for cacao fruits exhibiting three distinctive epicarp colors (yellow, red, and purple).2.2. Ultrasound-assisted solvent extraction
An ultrasound-assisted solvent extraction protocol was performed to obtain the flavonoid-rich fractions. This method was previously reported for the extraction of secondary metabolites from cacao pod husks.34 10 g of CHE powder (yellow, red, or purple) were mixed with 200 mL of solvent EtOH/H2O (80:20). The powder/solvent mixture was placed in an ultrasonic bath (Branson CPX2800, Brookfield, USA) at 30 °C for 20 minutes. The mixture was filtered through filter paper (dia. 125 mm) discarding the solid residue, and the EtOH was extracted from the filtrate using a rotary evaporator at 50 °C and 175 mbar (Hei-VAP Core, Schwabach, Germany). The aqueous solution was lyophilized (Labconco, Kansas, USA) to remove water. The three solid CHE extracts were stored in sealed amber bottles at 4 °C. The CHE extract yields were calculated based on the dry epicarp weight.
2.3. UV-vis and diffuse reflectance spectroscopy
A Genesys 10S spectrophotometer (Thermo Scientific, Billerica, MA, USA) was used to perform UV-Vis spectroscopy measurements. Solutions of 1 mg CHE extract in 3 mL of methanol were used to obtain the UV-Vis spectra from 200 to 800 nm. A UV-Vis 2600 spectrophotometer (Shimadzu, Kyoto, Japan) equipped with an integrating sphere was used for diffuse reflectance measurements of the solid CHE extracts (1 g). Barium sulfate was used as a standard to adjust the 100% of reflectance.2.4. CIELAB color coordinates
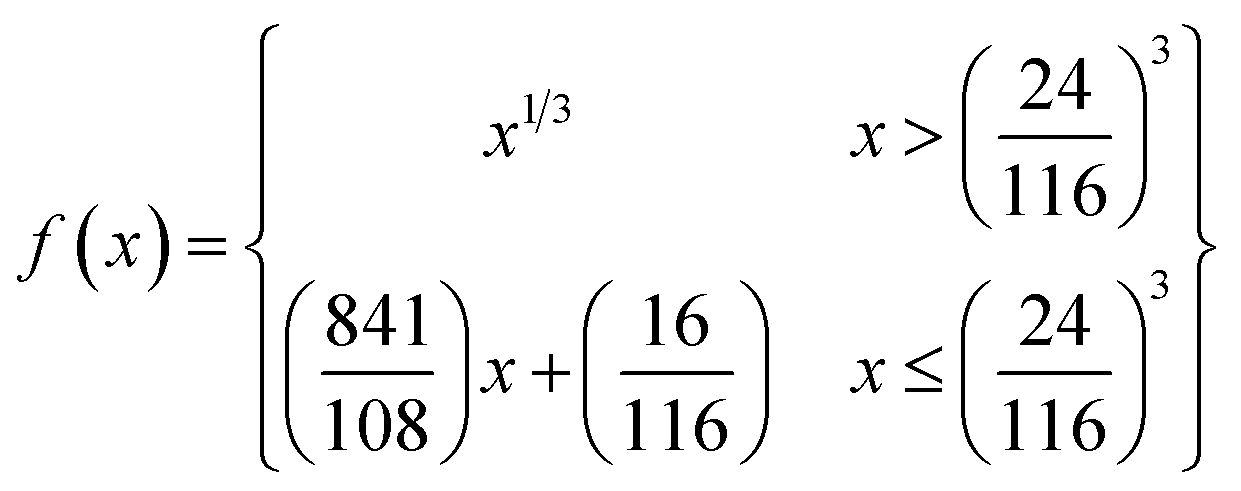
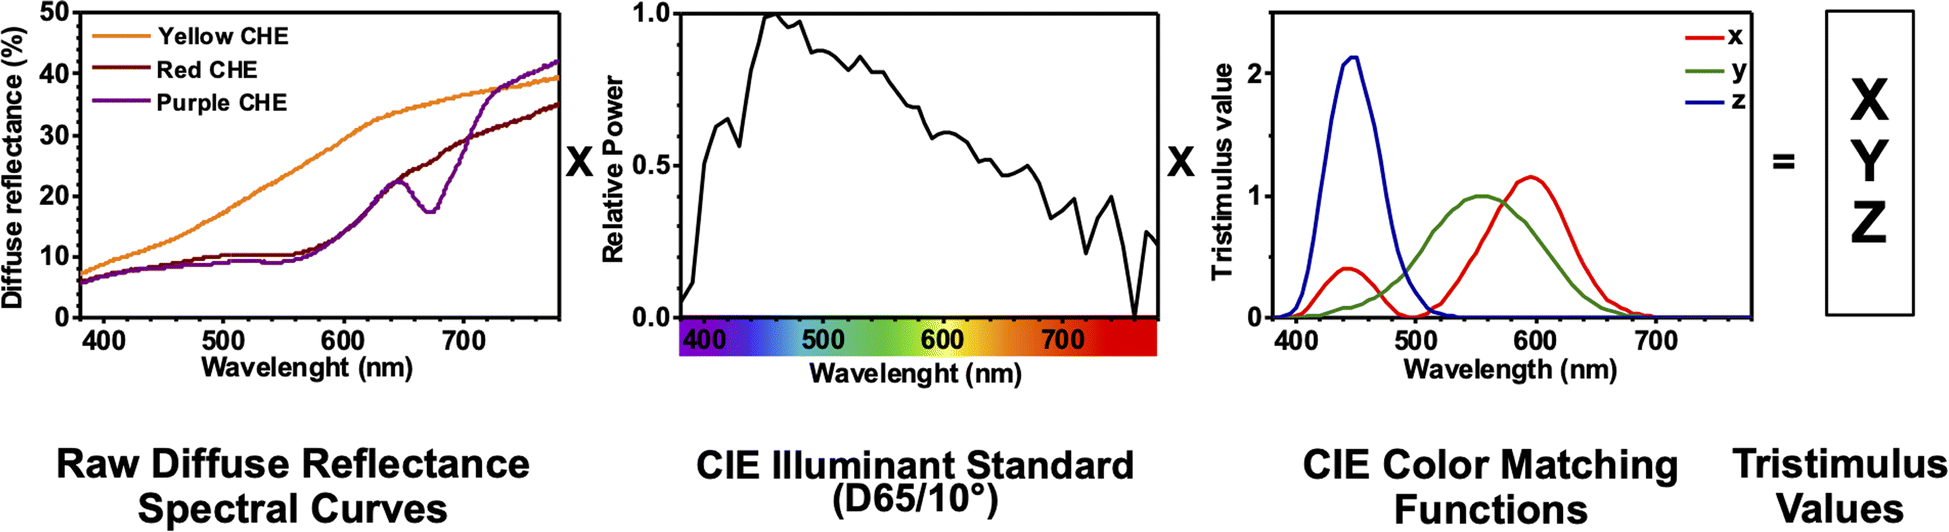
The color coordinates of the CHE extracts L*, a*, and b* were determined from the raw diffuse reflectance spectral data. Fig. 1 summarizes the calculation protocol. First, the raw diffuse reflectance profile of each CHE extract was multiplied by the normalized CIE (Comission Internationale de l'Eclairage) standard illuminant D65/10° (Where D65 corresponds to the sun's spectral power and 10° corresponds to the CIE standard observer).35 We used CHE profiles with wavelengths ranging from 380 to 780 nm, which were acquired with a 5 nm increment. The resultant profile was multiplied by the three color-matching functions (red, green, and blue) used to describe chromatic stimuli in humans, which are also ISO standards.35 Subsequently, the resultant functions were numerically integrated and the areas normalized to obtain the tristimulus values X, Y, and Z. From these values, the color coordinates L*, a*, and b* are calculated using eqn (1)–(4) as previously reported in the literature:36
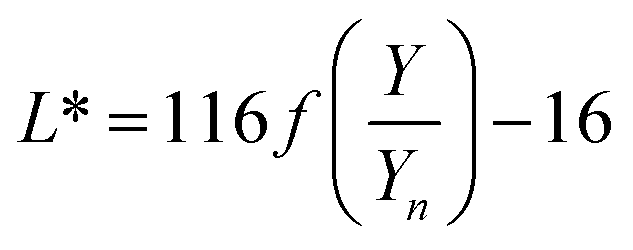 | (1) |
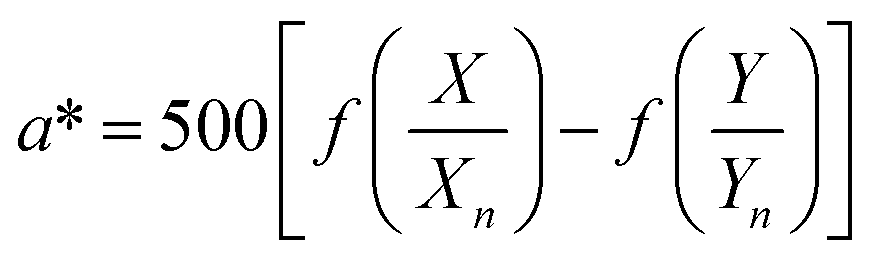 | (2) |
 | (3) |
 | (4) |
 | ||
| Fig. 1 CIELAB color coordinates calculation protocol for CHE extracts using diffuse reflectance spectral data. | ||
2.5. Total polyphenol content determination
The total polyphenol content of CHE extracts was measured using the Folin–Ciocalteu reagent.37 First, 150 μL of a CHE extract aqueous solution (1 mg mL−1), 150 μL of Folin–Ciocalteu reagent, 600 μL of water and 1500 μL of sodium carbonate solution (7% w/v) were mixed. The reaction mixture was stirred for five minutes and stored in the dark for 1 h at 25 °C. The absorbance was measured at 760 nm (Genesys S10; Thermo Scientific, Billerica, MA, USA) against a blank sample. A calibration curve, using gallic acid as standard, was prepared in the range of 0.02–0.4 mg mL−1. Results of the total amount of polyphenols were expressed as mg gallic acid equivalents per gram of CHE extract (mg GAE per g).382.6. Identification of flavonoids in CHE by MALDI-TOF
MALDI and LDI experiments were carried out in Bruker Ultraflextreme MALDI TOF–TOF mass spectrometer (Bruker Daltonics, Billerica, MA) equipped with a 1 kHz Nd:YAG Smart Bean laser (λ = 355 nm), 6 ns pulse and spot size of 10–100 μm. Mass spectra were obtained in positive/reflectron ion mode from m/z 100 to 1000, with PIE set at 100 ns, and accelerating voltage of 25 kV. Instrument calibration was performed using a standard peptide mixture (leucine-enkephalin, bradykinin, bombesin, and renin substrate).Sample analysis was performed using DCTB, α-CNPV-CH3 and α-CNPV-OCH3 as matrices (5 mM) in THF.39,40 Aqueous solutions of the three CHE extracts (4 mg mL−1) were prepared and mixed with individual matrix solutions to reach molar ratios analyte:matrix (A:M) 1:10 and 1:100. The resulting solutions were placed on a MALDI stainless target and let dry at room conditions. The flavonoids present in the CHE extracts were identified tentatively according to their mass/charge ratios and isotopic patterns. The Phenol-explorer: Database on polyphenol content in foods (https://www.phenol-explorer.eu) was used to determine the most probable compound.41
2.7. Dyeing properties of CHE extracts
The coloring properties of the CHE extracts were measured by dyeing bacterial cellulose (BC). BC was biosynthesized by Gluconacetobacter xylinus, in a static fermentation process, using cacao mucilage exudate as culture media as previously reported.42 The BC film was cleaned with peroxyacetic acid and cut into 1 cm3 cubes. The BC cubes (14 g) were placed in 10 mL of aqueous yellow, red, and purple CHE solutions (30 mg mL−1), respectively. Two BC:CHE extract mixtures were placed in a sealed recipient, one under vacuum (10 mm Hg) and another under atmospheric pressure (760 mm Hg), and stored at 4 °C for 24 h. The absorbance of the CHE extract solutions (283 nm) was measured before and after the dyeing experiments to calculate dye exhaustion. The dyeing kinetics was determined by periodically monitoring the changes in absorbance (283 nm) of a CHE solution (30 mg mL−1) in contact with clean BC cubes (7 g) for up to 7200 minutes (five days). Likewise, the fastness kinetics was determined by periodically monitoring the changes in absorbance (283 nm) of deionized water (5 mL) in contact with a previously dyed (5 days, yellow CHE) BC sample (7 g) for up to 7200 minutes (5 days).
2.8. CHE extracts cytotoxic properties
The MTT assay was performed to evaluate the cytotoxic properties of CHE extracts.43,44 A VERO Cell line (kidney epithelial cells extracted from the African green monkey) was used and cultured in EMEM medium (Eagles' Minimum Essential Medium) with 7% of fetal bovine serum at pH 7.4 and gentamicin (80 mg mL−1). The cells were cultured in 96-well cell culture plates (7500 cells per well) and incubated at 37 °C in a CO2 atmosphere (5%) for 24 h. Cells in optimal metabolic conditions were treated with the CHE extract solutions prepared in EMEM at 300 μg mL−1 concentration for 48 h. Cells without CPHE extract were used as a negative control. 200 μL of MTT (500 μg mL−1) in HBSS (Hank's Balanced Salt Solution) were added to the cultured cells (with and without CHE extracts) and cultivated for three hours at 37 °C to determine cell viability. The MTT solution was removed, and 200 μL of DMSO was added to dissolve any crystals formed. The absorbance was measured in a microplate reader at 570 nm using DMSO as blank. The viable and metabolic active cells reduce the tetrazolium salt (3-(4,5-dimethylthiazol-2-yl)-2,5-diphenyltetrazolium bromide) forming formazan crystals soluble in DMSO.3. Results and discussion
3.1. Cacao pod husk pretreatment and pigments isolation from epicarp
Initially, avoiding the enzymatic degradation of pigments is the most relevant issue when using fresh CH. Cutting, slicing, or pulping fresh CH releases enzymes, such as polyphenol oxidase, which in an oxidizing atmosphere and under slightly acidic conditions, can accelerate polyphenols oxidation resulting in the formation of brown pigments.45Diverse strategies exist for polyphenol oxidase inactivation, such as reducing agents or enzymes, changing pH, and increasing temperature.46 The most straightforward enzyme inactivation strategy is temperature. However, increasing the temperature affects the flavonoid's thermolabile structure.
Therefore, fresh-cut layers of cacao pod husk epicarp (CHE) were submerged in cold water (10 °C) to slow down polyphenol oxidase activity during the cutting process.47 Immediately after epicarp removal, the material was freeze-dried to produce the lyophilized epicarp strips shown in Fig. 2 (top row).
 | ||
| Fig. 2 Optical images of lyophilized CHE strips and extracts (top rows). CHE extracts yields and polyphenol content (bottom rows). | ||
The color observed in the lyophilized CHE strips is maintained in the final CHE extracts, as shown in Fig. 2. The extraction yields, ranging from 11.6 ± 0.10 wt% for the red extract to 13.9 ± 0.24 wt% for the purple CHE extract, are high compared to ultrasound-assisted flavonoid extractions (0.74 wt% from cacao shells, 1.64 wt% from hawthorn seeds or 1.87 wt% from bitter orange flowers).48,49 However, it is important to keep in mind that the epicarp comprises 17.3 wt% of the cacao pod husk, as dry weight. Also, previous works shows that ethanol concentration and temperature are essential experimental parameters in flavonoids ultrasound-assisted extraction from cacao bean shells,34 or in supercritical fluid extraction of phenolic compounds using ethanol as co-solvent.50 No variations in color, between the CHE strips and the extracts, suggest that the ultrasound-assisted solvent extraction conditions selected (80% EtOH, 30 °C, 20 minutes sonication) do not affect the pigments in the extracts. These extraction conditions were adapted from a previous work reporting phenolic compounds extraction from wine lees using ultrasound-assisted extraction.51 Ultrasound-assisted solvent extraction can improve the extraction yields of pigments from natural sources.52,53 High frequencies (20 kHz to 10 MHz) in ultrasonic waves induce acoustic cavitation, a phenomenon characterized by the appearance of transient gas bubbles due to mechanically-induced compression and expansion regions formed as the wave pushes through the liquid. The bubbles eventually collapse, producing shock waves, microjets, turbulence, and shear forces able to rupture plant cell walls. This process increases the surface area in contact with the solvent, raising the process extraction efficiency.34
Polyphenol content determination, using the Folin–Ciocalteu (FC) assay, involved dissolving the polyphenol sample in a Na2CO3 solution to promote proton abstraction and formation of a phenolate ion. The phenolate ion reduces the FC reagent (yellow), composed of phosphomolybdic and phosphotungstic acids, resulting in a blue Mo(V) complex with characteristic absorbance at 760 nm.54 The CHE polyphenol contents range from 153.9 mg EGA per g CHE extract for the red sample to 167.9 mg EGA per g CHE extract for the purple sample, as shown in Fig. 2. Previously, Campos-Vega et al. reported a polyphenol content of 49.92 mg EGA per g extract for the whole cacao pod husk, using 70% ethanol.9 These values are almost three times lower than our findings. However, the report by Campos-Vega et al. involved ethanolic extraction from the whole cacao pod husk, while our experiments involved only the fruit's epicarp, suggesting that polyphenols concentrate there. Interestingly, polyphenols in CHE from clone CCN-51 are almost three times higher than in dry cacao beans (47.31 ± 8.03 mg EGA per g bean) from the same clone.7
3.2. UV-vis and diffuse reflectance spectroscopy
The chemical structure of flavonoids is diverse due to hydroxylation, conjugation, glycosylation, and methoxylation. The characteristic absorption bands in the UV-Vis spectra of flavonoids correspond to electronic transitions in conjugated aromatic moieties and double bonds, together with electron-donating groups (hydroxy, methoxy). Flavonoids exhibit two characteristic absorption maxima identified as Band II (240–285 nm), corresponding to the benzoyl system formed by the ring A and the 4-keto group, and Band I (300–400 nm) which corresponds to the cinnamoyl group that includes ring B and the 4-keto group,30 as shown in Fig. 3a. These two bands were identified in the UV-Vis spectra of the CHE samples, verifying the presence of flavonoids in the extracts. The band I (323 nm) is located at higher λmax than the band II (283 nm) because the cinnamoyl conjugated π system is more extended than the benzoyl's.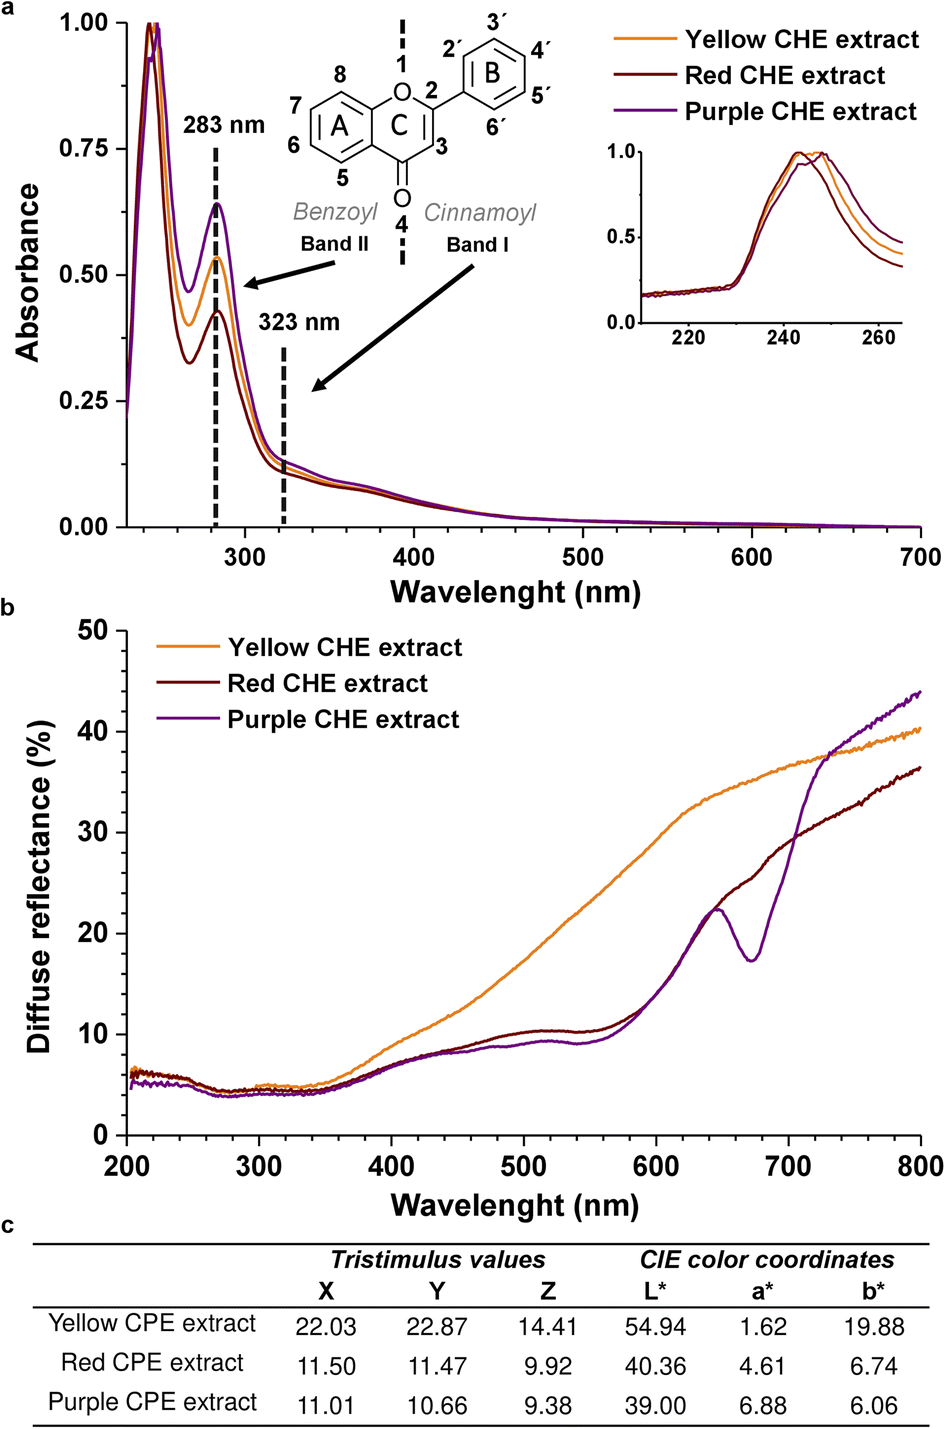 | ||
| Fig. 3 (a) UV-Vis spectra of CHE extracts (b) diffuse reflectance spectra of CHE extracts (c) CHE extracts CIELAB color coordinates. | ||
The similarity between the absorption profiles of the three CHE extracts in Fig. 3 arises from the complex nature of these natural mixtures containing diverse flavonoid types (flavones, flavonols, flavanols, anthocyanidins), which combined produce equivalent absorption profiles. Ethanolic extracts from various plant materials (sepals, leaves, fruit, seeds) display identical profiles.55 Interestingly, the 230–260 nm peak, zoomed in Fig. 3a inset, could correspond to isoflavones or flavanones, whose band II shifts to lower wavelengths (hypsochromic shift) to the 283 nm band II, typical of flavones and flavonols. The shift is probably due to changes in functional groups and conjugation in the flavonoid structure. For instance, the absence of the 2–3 double bond in flavanones and flavanols can shift the absorption maxima of the cinnamoyl conjugated system to the 230–260 nm region. Band I, in these systems, also appears as a shoulder between 300–400 nm.56
Diffuse reflectance spectra in Fig. 3b show a minimum reflectance wide band, between 200 and 350 nm, equivalent to an absorption zone for all the solid CHE samples. The band coincides with the UV-Vis absorption properties of the CHE extracts in the same spectral region of the Fig. 3a.
On the other hand, in the 400–700 nm region, we observe significant differences in the reflectance profiles of the CHE solid samples. The yellow CHE sample exhibits a higher reflectance band than the red and purple CHE extracts. The shape of the reflectance bands in this zone, specifically the purple CHE sample, coincides with the diffuse reflectance spectra of apple peel extracts with high anthocyanin content, as reported in a previous work.57 Decreased reflectance for the red and purple CHE extracts near 550 nm and a significant drop at 675 nm (only for the purple sample) hint at higher anthocyanin contents, in contrast with the yellow CHE extract.
The CIE color coordinates L*, a*, and b* represent the lightness, the redness-greenness, and the yellowness/blueness, respectively.58 For the yellow CHE extract, L* has an intermediate value of 54.94 on a scale of 0 to 100 indicating not a bright color. As expected, the parameter b* in the yellow sample is the highest of all extracts (19.88) because it is the closest to yellow. The lightness value for red (40.63) and purple (39.00) CHE extracts is lower than the yellow. Simultaneously, a* is highest for the purple and red samples (6.88 and 4.61) because of their closeness to red. Interestingly, the color coordinates of the yellow CHE extract (L* = 54.94, a* = 1.62, b* = 19.88) are similar to the coordinates reported for cacao pod husk flour (L* = 53.25, a* = 4.56, b* = 22.95).59
3.3. CHE flavonoid profiles by MALDI-TOF MS
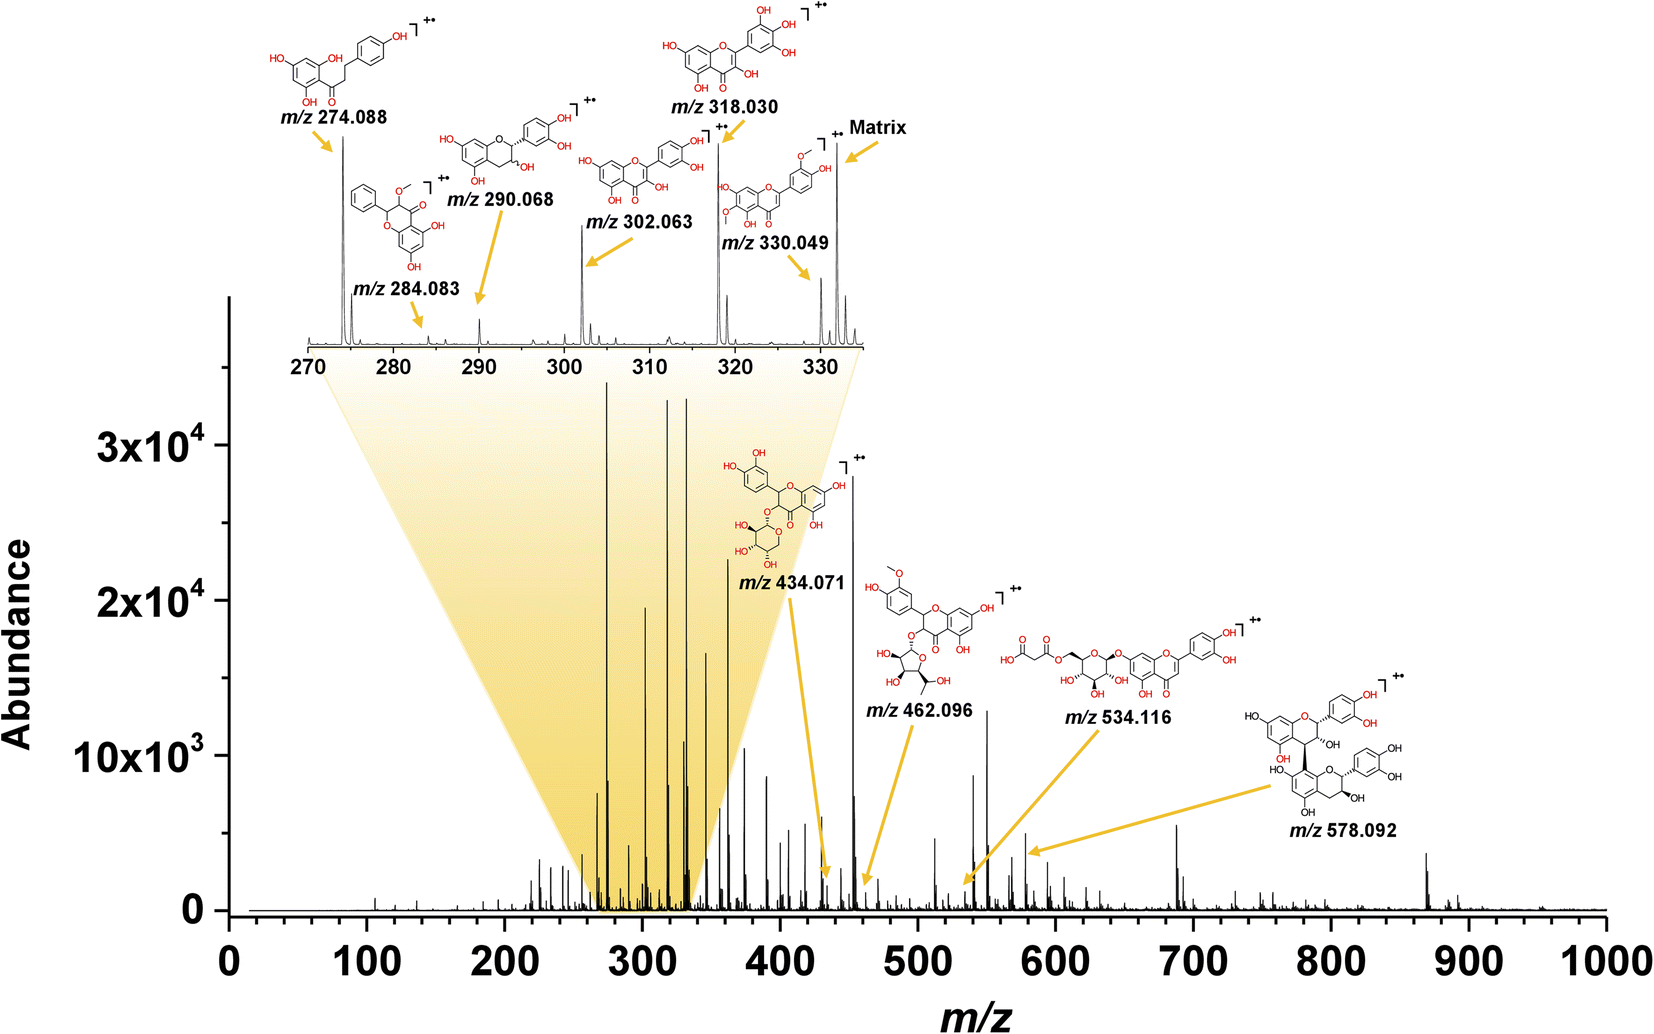
Matrix-assisted laser desorption/ionization (MALDI) is a widely used soft ionization method in mass spectrometry (MS) for high molecular weight biomolecule analysis. The technique is currently also applied to low molecular weight analytes when an appropriate non-interfering matrix is used.60 Unlike chromatographic techniques, MALDI-TOF MS provides short analysis times, high sensitivity, high tolerance to contaminants, and the ability to analyze complex mixtures without large volumes of solvents.61We selected MALDI-TOF MS analysis with electron-transfer ionization to determine the flavonoid profiles in CHE extracts. In positive ion mode, the MALDI process involves matrix (M) photoionization through an efficient pooling mechanism between excited matrix molecules resulting in primary matrix ions (M+˙) formation, eqn (5).60 Secondary ionization occurs by change–exchange reactions where neutral analytes (A) transfer an electron to the matrix primary ions to form radical cations (A+˙) and a matrix neutral molecule (M), eqn (6). The reactions associated with secondary ionization are only possible if the analyte's ionization energy (IE) is lower than the matrix's, eqn (7).62
 | (5) |
| M+˙ + A → A+˙ + M | (6) |
| (IEA < IEM) | (7) |
We selected three electron transfer matrices for the CHE extract analysis, the commercial matrix DCTB (trans-2-[3-(4-tert-butylphenyl)-2-methyl-2-propenylidene]-malonitrile) and the compounds CNPV-CH3, and CNPV-OCH3 (α-cyanophenylene vinylene derivatives) synthesized in our laboratory and previously reported as MALDI matrices.40 These matrices were chosen based on their high ionization energy, UV absorption properties, high vacuum stability, and low interferences in the low-mass region. The α-cyanophenylene vinylene derivatives are useful for the analysis of petroporphyrins, porphyrins, polyaromatic hydrocarbons, fullerenes, and pigments, among other low-molecular weight analytes.39 The DCTB matrix has been applied to the study of thermally labile compounds.63 In addition to mass spectrometric data (compound mass and isotopic patterns), the tentative identification of flavonoids was performed using the Phenol-Explorer Database (https://www.phenol-explorer.eu).41
The electron transfer MALDI spectrum of the yellow CHE extract in Fig. 4 shows signals in the m/z 200–600 region (flavonoid analysis window) and a few peaks at higher m/z values related to anthocyanins. The signals in the MALDI MS spectra correspond to radical cations, as expected from the electron-transfer ionization process promoted by the matrices selected for the MS analysis. Out of the three tested ET-MALDI matrices, the DCTB afforded detection of a higher number of species. The higher ionization efficiency for flavonoids and anthocyanins displayed by DCTB could be due to its low vacuum stability and low vapor pressure.
 | ||
| Fig. 4 MALDI-TOF spectrum of the yellow CHE sample using DCTB as a matrix. | ||
The ESI† contains the CHE extract spectra for all samples using the three matrices, the S/N ratios, and the experimental and theoretical isotopic patterns. Table 1 lists fifteen compounds identified in the MALDI MS experiments using the following criteria: S/N > 3, mass accuracy <150 ppm, coincidence between the experimental and theoretical isotopic pattern, and the presence of the compound in the Phenol-Explorer Database. The database contains 502 individual polyphenols; 274 are flavonoids identified in food samples.
| Compound | Formula | Yellow | Red | Purple | Color (ref.) | Previous reports in cacao (ref.) | ||||||
|---|---|---|---|---|---|---|---|---|---|---|---|---|
| Mass (exp.) | Mass accuracy | (%)a | Mass (exp.) | Mass accuracy | (%)a | Mass (exp.) | Mass accuracy | (%)a | ||||
| a Normalized relative abundance from ET-MALDI MS data. | ||||||||||||
| Phloretin | C15H14O5 | 274.092 | 15 | 30.36 | 274.078 | 22 | 35.14 | 274.082 | 15 | 40.77 | ||
| Methylgalangin | C16H12O5 | 284.07 | 53 | 1.27 | 284.086 | 63 | 2.04 | Brown (65) | ||||
| (+)-Catechin/(−)-epicatechin | C15H14O6 | 290.073 | 37 | 3.80 | 290.060 | 65 | 3.70 | Husk (67) bean (62) | ||||
| Hispidulin | C16H12O6 | 300.068 | 17 | 1.15 | ||||||||
| Quercetin | C15H10O7 | 302.085 | 70 | 17.40 | 302.063 | 70 | 14.31 | 302.059 | 56 | 16.14 | Yellow (65) | Husk (67) bean (64) |
| Myricetin | C15H10O8 | 318.055 | 22 | 29.34 | 318.030 | 22 | 28.51 | 318.047 | 31 | 25.63 | Yellow (65) | |
| Jaceosidin | C17H14O7 | 330.067 | 72 | 9.85 | 330.048 | 76 | 6.95 | 330.043 | 91 | 8.85 | ||
| Quercetin 3-O-arabinoside | C20H18O11 | 434.071 | 30 | 1.43 | 434.036 | 110 | 0.79 | Bean (62) | ||||
| Isorhamnetin 3-O-rutinoside | C22H22O11 | 462.096 | 43 | 1.04 | ||||||||
| 5,3′,4′-Trihydroxy-3-methoxy-6:7-methylenedioxyflavone 4′-O-Glucuronide | C23H20O14 | 520.100 | 29 | |||||||||
| 6′′-O-Malonylglycitin | C25H24O13 | 532.121 | 116 | |||||||||
| Luteolin 7-O-malonyl-glucoside | C24H22O14 | 534.116 | 30 | 1.09 | 534.099 | 2 | 1.36 | |||||
| Procyanidin dimer B1 | C30H26O12 | 578.092 | 86 | 4.42 | 578.130 | 21 | 5.25 | 578.092 | 62 | 5.42 | Bean (68) | |
| Luteolin-O-rutinoside | C27H30O15 | 594.123 | 59 | 2.72 | ||||||||
| Apigenin 7-O-diglucuronide | C27H26O17 | 622.160 | 69 | 1.27 | ||||||||
Ten compounds were identified in the yellow CHE extract using the criteria above, corresponding to five flavonols, two flavones, two flavanols, and one dihydrochalcone (Table 1). Only three compounds in the yellow CHE sample, (+/−)-catechin/epicatechin (C15H14O6, m/z 290.068), quercetin (C15H10O7, m/z 302.063) and procyanidin B1 (C30H26O12, m/z 578.092), coincide with previously reported flavonoids in cacao beans and cacao pod husks.64–66. Many of these identified flavonoids have also been found in other plant or food sources such as: oils, fruits, seeds, beers, wines, cereals, herbs, spices, coffee, tea, etc.41
We performed a semiquantitative analysis for the pigments identified in the CHE extracts using MALDI MS data.67 In a MALDI MS experiment, analytes with a common molecular architecture (e.g., flavonoids) share similar ionization efficiencies.68 Under this assumption, the abundance of the ions in the mass spectra could represent the species concentration in the sample. Thus, the normalization of the absolute signal abundance for a group of compounds sharing similar structural features can provide information about their relative concentration in the original sample. Using this rationale, we found that phloretin, quercetin, jaceosidin, and myricetin make up 87% of the flavonoids detected by ET-MALDI MS in the yellow CHE extract (Table 1). A quantitative HPLC study report catechin (1024.7 μg g−1), quercetin (601.8 μg g−1), and (−)-epicatequin (594.4 μg g−1) as the major phenolic compounds in fresh cacao pod husks.69
The compositional profiles of the red and purple CHE extracts are like the yellow sample, as seen in Table 1. Phloretin (C15H14O5, m/z 274.088), catechin/epicatechin (C15H14O6, m/z 290.060), quercetin (C15H10O7, m/z 302.063), myricetin (C15H10O8, m/z 318.063), jaceosidine (C17H14O7, m/z 330.048), quercetin 3-O-arabinoside (C20H18O11, m/z 434.036), luteolin O-malonyl-glucoside (C24H22O14, m/z 534.099), and procyanidin B1 (C30H26O12, m/z 578.130) are the main compounds in the red and purple extracts, much like in their yellow counterpart.
Semiquantitative MALDI analysis again shows that phloretin, quercetin, jaceosidin, and myricetin comprise up to 89% and 91% of the flavonoids detected by MS in the red and purple extracts, respectively. We detected additional compounds in the mass spectral region between m/z 600 and 900 in the red and purple CHE extracts (Fig. S2 and S3† respectively). These high molecular weight compounds are likely glycosylated flavonoids and anthocyanins not included in the database. The presence of these compounds, particularly glycosylated anthocyanins associated with redness, is likely the reason for the differences between the diffuse reflectance profiles of the yellow and the red/purple CHE extracts as discussed above.
According to the literature, specific pigments from natural sources carry particular colors. For instance, luteolin, quercetin, morin, kaempferol, rhamnetin, myricetin, and flavonoids from aurones, flavonols, and chalcones exhibit characteristic yellow hues. Anthocyanins and anthocyanidins such as pelargonidin, peonidin, and cyanidins are red-colored, while anthocyanidins such as delphinidin, petunidin, and malvidin are purple-colored.70,71
The most abundant species in the CHE extracts, according to MALDI MS data (Table 1), are phloretin, catechin/epicatechin, quercetin, myricetin, and jaceosidin. Works by other authors reported some of these molecules in cacao fruit derivatives. For instance, (+)-catechin/(−)-epicatechin (C15H14O6, m/z 290.079) and quercetin (C15H10O7, m/z 300.063) are present in cacao pod husks and beans.64–66,69,72–74 Quercetin-3-O-arabinoside (C20H18O11, m/z 434.084) and procyanidin B1 (C30H26O12, m/z 578.142) are also found in cacao beans. Some compounds also reported in cacao products (beans, husks) include caffeine, theobromine, procyanidins, phenolic acids, gallic acid, luteolin, coumaric acid, and protocatechuic acid. These substances were not detected in the MALDI experiment probably because the selectivity of the electron-transfer process towards compounds with IE below the matrix.75 Also, compounds acquiring charge through other processes such as cation/proton exchange or acid/base reactions are not detected in the ET process.76 Despite these shortcomings, ET-MALDI MS provides a rapid screening and semiquantitative strategy to identify secondary metabolites like flavonoids in plant-derived extracts.
3.4. CHE as coloring agents for cellulose
We used bacterial cellulose cubes (as an aqueous hydrophilic matrix) to test the CHE samples dyeing properties. BC cubes (approx. volume 1 cm3) were placed in sealable plastic bags and dipped in aqueous solutions of CHE extracts (30 mg mL−1) for 24 h. The bags were sealed under atmospheric pressure, and vacuum (10 mm Hg) using a commercial vacuum sealer and kept at 4 °C. After 24 h, the CHE solution dye exhaustion was measured using the following eqn (8).77
 | (8) |
Fig. 5a shows images of the raw and dyed bacterial cellulose cubes, also the dye exhaustion percentages for the process at atmospheric and reduced pressure. After 24 hours of dipping, the bacterial cellulose cubes absorb between 44 to 48% of the original pigment in the CHE solution for the samples stored at atmospheric pressure. Storage under vacuum causes increased absorption up to 56–66%. The percentages of dye exhaustion are higher than reports for azo dyes adsorbed on cellulose. For instance, Shim and Kym reported dye exhaustion of 30% on bacterial cellulose using an anthraquinone dye (Reactive Blue 19) at 135 °C for 30 min.77
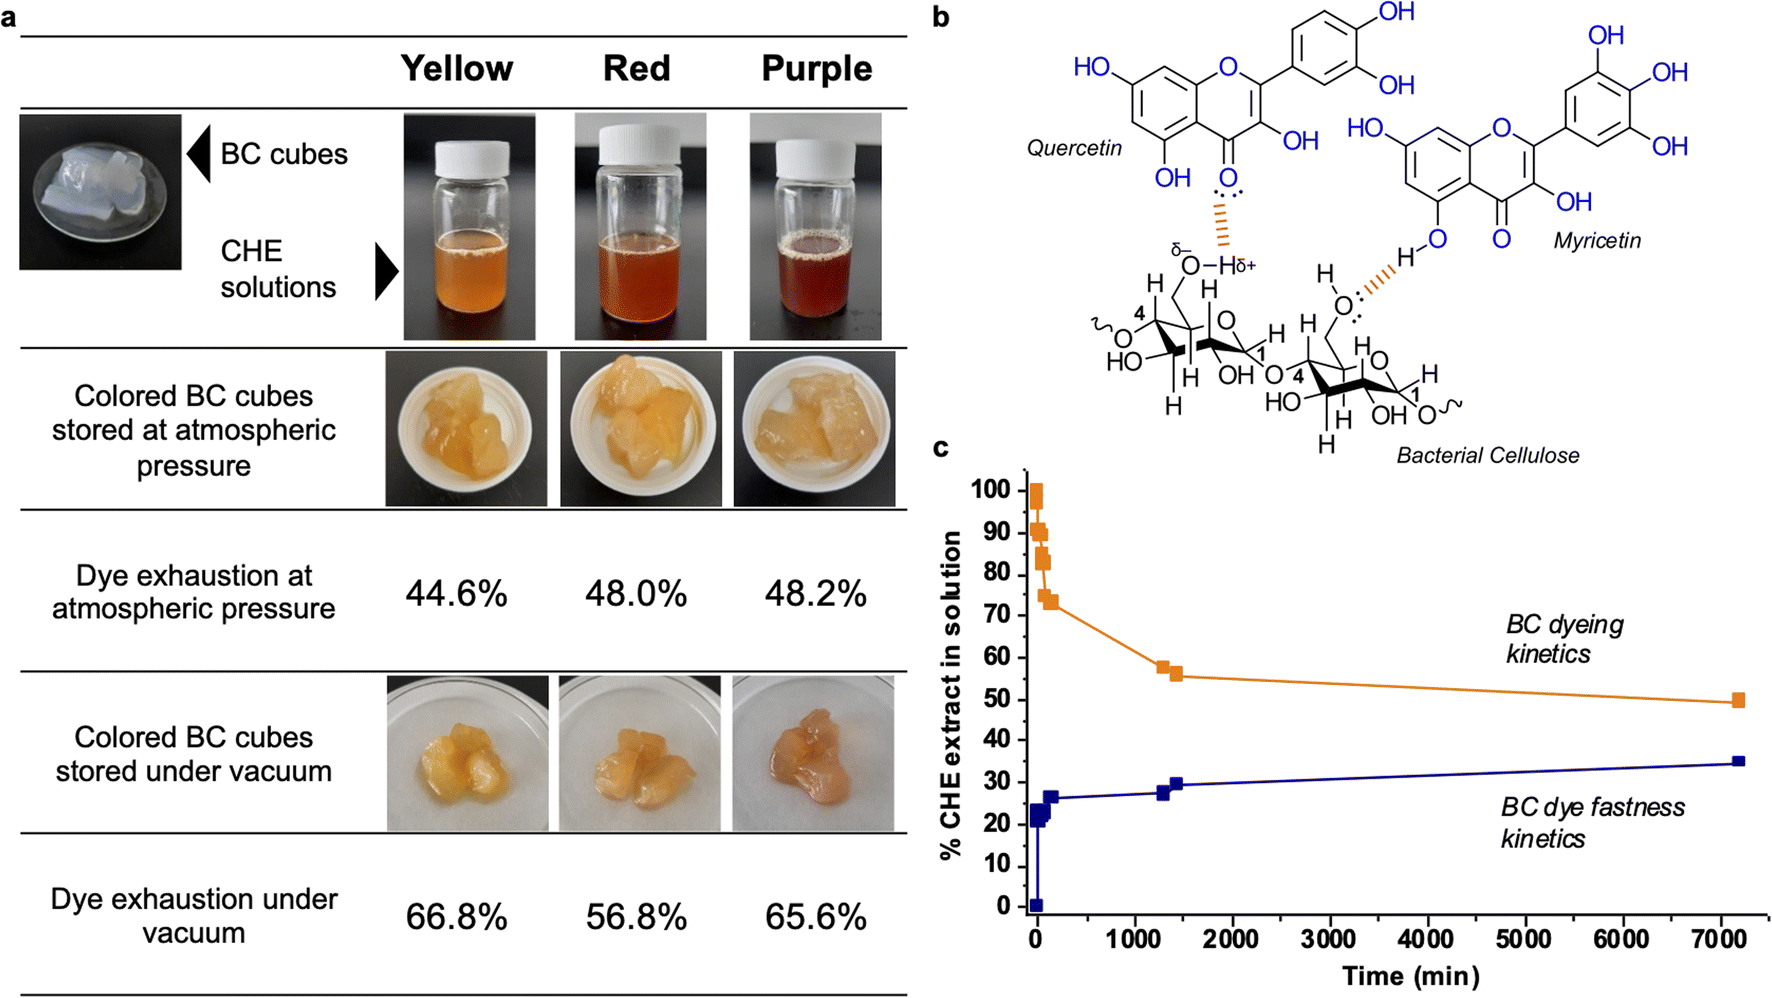 | ||
| Fig. 5 (a) BC cubes dyed with the CHE extracts (b) interactions between BC and the flavonoids in CHE extracts (c) BC cubes dyeing and fastness kinetics using the yellow CHE extract. | ||
Regarding color fastness or stability, we observe that the CHE solution can effectively dye the BC cubes. However, the color in the original CHE solution somehow fades when incorporated into the BC matrix, particularly for the red and purple extracts. Natural dyes, generally more labile and unstable than synthetic alternatives, can suffer decomposition from oxidation or exposure to light. For instance, storing the BC cubes under a vacuum reduces the O2 levels diminishing flavonoid degradation by oxidation; hence, increasing the color stability of the pigments as observed in Fig. 5a. Another possibility is that, after contact with the cellulose, color changes could arise from bathochromic or hypochromic effects induced by the matrix. This effect, called co-pigmentation, can enhance or change color perception via molecular interactions of the pigments with the matrix.78 As a polysaccharide, bacterial cellulose can effectively establish hydrogen bonds and van der Waals interactions with flavonoids, as shown in Fig. 5b. These interactions drive the adsorption of dyes found in effluents and polysaccharides.79 Finally, the observed color changes could be a combination of the effects mentioned above.80
We followed the dyeing and color fastness kinetics in BC cubes dyed with the yellow CHE solution. Fig. 5c shows that the yellow CHE extract is rapidly adsorbed by the BC, reaching equilibrium (at 44.3%) after twenty-four hours of contact. Continuous monitoring of the CHE solution for five days shows no significant changes in CHE absorbance over time. Afterward, we assessed the color fastness kinetics by placing the dyed BC cubes (7200 min with the yellow CHE extract) in contact with pure water and measuring the desorbed pigments via UV-vis from 0 to 7200 min.
Fig. 5c shows the dye fastness kinetic profile. After twenty-four hours, the color desorption reaches a plateau at 29.3%. This behavior indicates that some of the pigments in CHE are retained by the cellulosic matrix, perhaps due to strong molecular interactions – such as hydrogen bonds-between the flavonoids and the BC as shown in Fig. 5b. The amount of retained CHE extract in the cellulosic matrix after the desorption reached a plateau (7200 min) from Fig. 5c, corresponds to 541.8 mg of CHE per g of cellulose (as dry weight).
Previous works report polyphenol loading on cellulose. For instance, Chan et al. investigated the binding of dietary polyphenols (catechin, ferulic acid, chlorogenic acid, gallic acid, and cyanidin-3-glucoside) to bacterial cellulose (native and alkali-treated).81 The authors document maximum loading values up to 0.6 g polyphenols per g cellulose, coinciding with our results (0.514 g of CHE per g cellulose). Also, hydrogen bonds and hydrophobic interactions are described as the main drivers of the kinetics of fast adsorption and retention of polyphenols.81 For nutraceutical and cosmetic applications, additional studies indicate that polyphenol adsorption on biopolymers (hemicellulose, pectin, and collagen) depends on temperature, pH, ionic strength, and additives (organic solvents and surfactants).82–86
3.5. Cytotoxic properties
MTT assay measures the metabolic activity of cellular dehydrogenases that reduce MTT to formazan. The amount of formazan is directly proportional to the number of viable cells in the test. Fig. 6 shows the percentages of cell viability employing VERO cells exposed to the CHE extracts. We observed cell viability exceeding 100% for all CHE extracts. Increased cell viability indicates that the CHE extracts do not exert any cytotoxic effect on the VERO cell line. On the contrary, the CHE extracts stimulate cell proliferation and viability. We can relate this stimulation of cell proliferation to the flavonoids (phloretin, quercetin, and myricetin) found in the CHE extracts by MALDI. Literature reports illustrate how flavonoids (kaempherol and quercetin glycosides) may induce the biosynthesis of growth-inducing factors on Vero cells and stimulate cell viability both on Vero cells and Bovine dermis cells.87 Also, the flavonoid rutin, a glycoside derived from the flavonol quercetin, has been reported to cause cell proliferation in mice bone marrow cells.88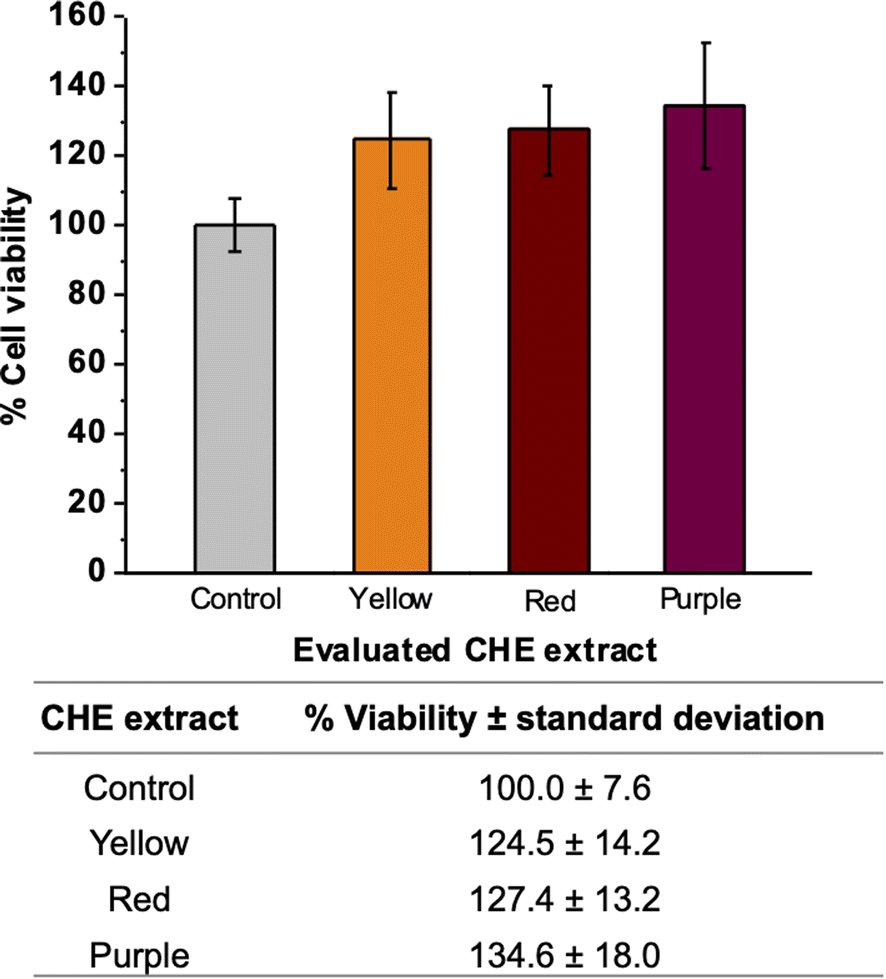 | ||
| Fig. 6 Cytotoxic properties of CHE extracts by MTT assays (triplicates). | ||
On the other hand, some researchers report that extracts from cacao beans and other fruit/plant parts (husk, shell, leaves, roots, etc.) exhibit a moderately active cytotoxicity on different human cancer cell lines (breast, liver, lung, cervical cancer and colon carcinoma).89 The role of dietary flavonoids and polyphenolic compounds in cancer prevention has been widely studied. Diverse mechanisms of action has been identified, such us carcinogen inactivation, antiproliferation, cell cycle arrest, induction of apoptosis, etc.90
4. Conclusions
Three extracts, yellow, red, and purple, from cacao pod husk epicarp (CHE) were obtained with high extraction yields (11–13% w/w) using ultrasound-assisted solvent extraction (EtOH:H2O ratio 80:20, 30 °C, 20 min). The UV-Vis strongest absorption bands of the CHE extracts were observed at 283 and 323 nm which corresponds to the benzoyl and cynnamoyl cores in flavonoids, likewise, characteristic bands in the diffuse reflectance spectra were identified and related to presence of flavonoids and anthocyanins. The yellow, red, and purple extracts exhibited significant contents of phenolic compounds equivalent to 162, 150 and 168 mg GAE per g CHE extract respectively. On the other hand, MALDI-TOF MS proved to be an appropriate technique for the analysis of the flavonoid profile of CHE extracts. A total of fifteen flavonoids were identified; phloretin, quercetin, myricetin, jaceosidin and procyanidin B1 are common to the three extracts. Compounds such us: catechin, quercetin, procyanidin B1, and quercetin-3-O-arabinoside were previously reported in cacao beans and husks. In turn, it was observed that the CHE extracts have a good capacity to dye bacterial cellulose and that they do not exert a cytotoxic effect on the VERO cell line in the concentration and time evaluated. We conclude that CHE extracts are a potential source of flavonoids and anthocyanins that can be used as dyes in food/cosmetic/pharma industries.
Conflicts of interest
There are no conflicts to declare.Acknowledgements
The authors acknowledge the Central Research Laboratory Facility at Guatiguara's Campus of the Universidad Industrial de Santander, Piedecuesta, Santander, Colombia, for technical support. We acknowledge financial support from SGR-Gobernación de Santander Grant BPIN 2020000100251. Jesús Andrés Oñate acknowledges a graduate fellowship from SGR-Ministerio de Ciencia, Tecnología e Innovación (Minciencias-Colombia) BPIN 2021000100022.Notes and references
- Food and Agriculture Organization of the United States, 2002.
- OECD, (OECD-FAO Agricultural Outlook), 2021.
- International Cocoa Organization (ICCO), 2022.
- Fedecacao, 2022.
- International Cocoa Organization (ICCO), 2021.
- R. G. García-Cáceres, A. Perdomo, O. Ortiz, P. Beltrán and K. López, DYNA, 2014, 81, 30–40 CrossRef.
- M. Vergara-Mendoza, G. R. Martínez, C. Blanco-Tirado and M. Y. Combariza, Molecules, 2022, 27, 3717 CrossRef CAS PubMed.
- E. Oddoye, C. M. Phil and E. Gyedu-Akoto, Chocolate in Health and Nutrition, 2013, pp. 23–37 Search PubMed.
- R. Campos-Vega, K. H. Nieto-Figueroa and B. D. Oomah, Trends Food Sci. Technol., 2018, 172–184 CrossRef CAS.
- L. C. Vriesmann, R. D. de Mello Castanho Amboni and C. L. de Oliveira Petkowicz, Ind. Crops Prod., 2011, 34, 1173–1181 CrossRef CAS.
- D. Charalampopoulos, Curr. Opin. Green Sustainable Chem., 2018, 14, 80–88 CrossRef.
- E. F. Laconi and A. Jayanegara, Asian-Australas. J. Anim. Sci., 2015, 28, 343–350 CrossRef CAS PubMed.
- W. Kumi, J. Takrama, M. Asamoah, E. Gyedu-Akoto, C. K. Agyente-Badu and F. M. Amoah, A manual for extraction of cocoa potash and production of cocoa soft soap, Cocoa Research Institute of Ghana, Ghana, 2012, pp. 1–48 Search PubMed.
- L. Beukes, J. Nanostruct. Chem., 2016, 6, 159–169 CrossRef.
- W. T. Tsai and P. C. Huang, Biomass Convers. Biorefin., 2018, 8, 521–528 CrossRef CAS.
- B. Pahat, Aust. J. Basic Appl. Sci., 2013, 7, 406–411 Search PubMed.
- D. Mansur, T. Tago, T. Masuda and H. Abimanyu, Biomass Bioenergy, 2014, 66, 275–285 CrossRef CAS.
- H. Barazarte, E. Sangronis and E. Unai, Arch. Latinoam. Nutr., 2008, 58, 64–70 CAS.
- N. B. Santana, J. C. Dias, R. P. Rezende, M. Franco, L. K. Oliveira and L. O. Souza, PLoS One, 2018, 13, 195206 Search PubMed.
- V. Oreopoulou and C. Tzia, Utilization of Plant By-Products for the Recovery of Proteins, Dietary Fibers, Antioxidants, and Colorants, Springer, 2007, pp. 209–232 Search PubMed.
- C. Kuyu, Food Sci. Qual. Manag., 2015, 45, 47–61 Search PubMed.
- A. Downham and P. Collins, Int. J. Food Sci. Technol., 2000, 35, 5–22 CrossRef CAS.
- J. Belmonte, I. Arroy and M. Vazquez, Nat. Rev., 2016, 10, 25–38 Search PubMed.
- S. Okafor, W. Obonga and M. Ezeokonkwo, UK J. Pharm. Biosci., 2016, 4, 1 CAS.
- P. Datta and S. Lundin-Schiller, J. Tenn. Acad. Sci., 2008, 83, 45–51 CAS.
- M. C. García-Muñoz, M. P. Tarazona-Díaz, N. A. Meneses-Marentes, G. González-Sarmiento, A. S. Pineda-Guerrero and G. E. Gómez-Uribe, Pesqui. Agropecu. Trop., 2021, 51, 1–6 Search PubMed.
- J. Delgado-Ospina, R. Lucas-González, M. Viuda-Martos, J. Fernández-López, J. Á. Pérez-Álvarez, M. Martuscelli and C. Chaves-López, Heliyon, 2021, 7, e06799 CrossRef CAS PubMed.
- F. Li, B. Wu, L. Yan, X. Qin and J. Lai, J. Plant Res., 2021, 134, 1323–1334 CrossRef CAS PubMed.
- E. Grotewold, The Science of Flavonoids, Springer, 2006, pp. 1–274 Search PubMed.
- E. Santos, B. Maia, A. Ferriani and S. Teixeira, Flavonoids: Classification, Biosynthesis and Chemical Ecology, Flavonoids - From Biosynthesis to Human Health, InTech, 2017 Search PubMed.
- B. W. Shirley, Trends Plant Sci., 1996, 1, 377–382 Search PubMed.
- B. Winkel-Shirley, Plant Physiol., 2001, 126, 485 CrossRef CAS PubMed.
- N. C. Cook and S. Samman, J. Nutr. Biochem., 1996, 7, 66–76 CrossRef CAS.
- A. Yusof, B. Zainudin, S. Gani, U. Zaidan and M. Halmi, Molecules, 2019, 24, 711 CrossRef CAS PubMed.
- https://www.cie.co.at/technical-work/technical-resources.
- R. Berns, Numerical Color Specification: Colorimetry. In: Principles of Color Technology, Wiley, 2019, pp. 51–84 Search PubMed.
- R. M. Lamuela-Raventó, Measurement of Antioxidant Activity & Capacity: Recent Trends and Applications, 1st edn, Wiley, 2018, pp. 107–115 Search PubMed.
- R. Martínez Espinosa, P. Torres Castro, M. Meneses, J. Figueroa, J. Pérez-Álvarez and M. Viuda-Martos, Int. Food Res. J, 2012, 49, 39–45 CrossRef.
- J. Ramirez, C. Blanco-Tirado and M. Y. Combariza, ACS Appl. Mater. Interfaces, 2019, 11, 10975–10987 CrossRef PubMed.
- L.J. Castellanos-García, B. Castro-Agudelo, H. F. Rosales, M. Cely, C. Ochoa-Puentes, C. Blanco-Tirado, C.A. Sierra and M. Y. Combariza, J. Am. Soc. Mass Spectrom., 2017, 28, 2548–2560 CrossRef PubMed.
- V. Neveu, J. Perez-Jiménez, F. Vos, V. Crespy, L. du Chaffaut, L. Mennen, C. Knox, R. Eisner, J. Cruz, D. Wishart and A. Scalbert, Database, 2010, 2010, bap024 CrossRef CAS PubMed.
- O. L. Saavedra-Sanabria, D. Durán, J. Cabezas, I. Hernández, C. Blanco-Tirado and M. Y. Combariza, Carbohydr. Polym., 2021, 274, 118645 CrossRef CAS PubMed.
- D. Gerlier and N. Thomasset, J. Immunol. Methods, 1986, 94, 57–63 CrossRef CAS PubMed.
- T. Riss, A. Niles and L. Minor, Assay Guidance Manual, 2004, 1–23 Search PubMed.
- S. Cheema and M. Sommerhalter, Food Chem., 2015, 171, 382–387 CrossRef CAS PubMed.
- S. Toro-Uribe, J. Godoy-Chivatá, A. R. Villamizar-Jaimes, M. de J. Perea-Flores and L. J. López-Giraldo, Antioxidants, 2020, 9, 458 CrossRef CAS PubMed.
- G. Mizobutsi, F. Finger, R. Ribeiro, R. Puschmann, L. Neves and W. Mota, Sci. Agric., 2010, 67, 213 CrossRef CAS.
- J. Chaves, M. de Souza, L. da Silva, D. Lachos-Perez, P. Torres-Mayanga, A. Machado, T. Forster-Carneiro, M. Vázquez-Espinosa, A. González-de-Peredo, G. Barbero and M. Rostagno, Front. Chem., 2020, 8, 507887 CrossRef CAS PubMed.
- A. Purnama, M. Mustanir and B. Ginting, AIP Conf. Proc., 2021, 2342, 030007 CrossRef CAS.
- L. Valadez-Carmona, A. Ortiz-Moreno, G. Ceballos, J. Mendiola and E. Ibáñez, J. Supercrit. Fluids, 2017, 131, 99 CrossRef.
- Y. Tao Y, D. Wu, Q. A. Zhan and D. W. Sun, Ultrason. Sonochem., 2014, 21, 706–715 CrossRef PubMed.
- F. Chemat, V. Tomao and M. Virot, Handbook of food analysis instruments, 2008, pp. 85–103 Search PubMed.
- K. Vilkhu, R. Mawson, L. Simons and D. Bates, Innovative Food Sci. Emerging Technol., 2008, 9, 161–169 CrossRef CAS.
- O. Munoz-Bernal, G. Torres-Aguirre, J. A. Núñez-Gastélum, L. De la Rosa, J. Rodrigo-Garcia, J. F. Ayala-Zavala and E. Alvarez-Parrilla, TIP, Rev. Espec. Cienc. Quim.-Biol., 2017, 20, 23 CAS.
- T. K. Patle, K. Shrivas, R. Kurrey, S. Upadhyay, R. Jangde and R. Chauhan, Spectrochim. Acta, Part A, 2020, 242, 118717 CrossRef CAS PubMed.
- K. Markham and T. J. Mabry, Ultraviolet-Visible and Proton Magnetic Resonance Spectroscopy of Flavonoids, Springer, 1975, pp. 45–77 Search PubMed.
- M. N. Merzlyak, A. E. Solovchenko and A. A. Gitelson, Postharvest Biol. Technol., 2003, 27, 197–211 CrossRef CAS.
- T. D. Lillotte, M. Joester, B. Frindt, A. Berghaus, R. F. Lammens and K. G. Wagner, Int. J. Pharm., 2021, 603, 120668 CrossRef CAS PubMed.
- C. Lòpez, Foods, 2021, 10, 1243 CrossRef PubMed.
- MALDI MS: A Practical Guide to Instrumentation, Methods and Applications, ed. F. Hillenkamp, J. Peter-Katalinic, Wiley, 2013, p. 411 Search PubMed.
- J. Wang, W. Kalt and P. Sporns, J. Agric. Food Chem., 2000, 48, 3330–3335 CrossRef CAS PubMed.
- T. D. McCarley, R. L. McCarley and P. A. Limbach, Anal. Chem., 1998, 70, 4376–4379 CrossRef CAS.
- Y. V. Vasil'ev, O. G. Khvostenko, A. V. Streletskii, O. V. Boltalina, S. G. Kotsiris and T. Drewello, J. Phys. Chem. A, 2006, 110, 5967–5972 CrossRef PubMed.
- J. Wollgast and E. Anklam, nt. Food Res. J, 2000, 33, 423–447 CrossRef CAS.
- S. Toro-Uribe, L. Montero, L. López-Giraldo, E. Ibáñez and M. Herrero, Anal. Chim. Acta, 2018, 1036, 204–213 CrossRef CAS PubMed.
- Y. Rodríguez, A. Gaspari, G. Graziani, A. Santini and A. Ritieni, nt. Food Res. J, 2018, 111, 229–236 CrossRef PubMed.
- S. Persson, C. P. Sönksen, N. U. Frigaard, R. P. Cox, P. Roepstorff and M. Miller, Eur. J. Biochem., 2000, 267, 450–456 CrossRef CAS PubMed.
- N. I. Belaya, A. V. Belyi and I. N. Shcherbakov, Kinet. Catal., 2020, 61, 360–368 CrossRef CAS.
- L. Valadez-Carmona, C.P. Plazola-Jacinto, M. Hernández-Ortega, M.D. Hernández-Navarro, F. Villareal, H. Necoechea-Mondragón, A. Ortiz-Moreno and G. Ceballos-Reyes, Innovative Food Sci. Emerging Technol., 2017, 41, 378–386 CrossRef CAS.
- T. Bechtold and R. Mussak, Handbook of Natural Colorants, 2009, pp. 1–434 Search PubMed.
- S. Azeez, K. N. Shiva and P. Va, CAB Rev.: Perspect. Agric. Vet., 2007, 2, 1–25 Search PubMed.
- A. Karim, A. Azlan, I. A. P. Hashim, S. S. Abd Gani, B. Zainudin and N. Abdullah, BMC Complementary Altern. Med., 2014, 14, 381 CrossRef PubMed.
- D. Silva, J. Mass Spectrom., 2014, 49, 251–255 CrossRef PubMed.
- F. Sánchez, O. Jáuregui, I. Casals, C. Andres-Lacueva, M. Izquierdo-Pulido and R. M. Lamuela-Raventós, J. Mass Spectrom., 2003, 38, 35–42 CrossRef PubMed.
- A. J. Hoteling, W. F. Nichols, D. J. Giesen, J. R. Lenhard and R. Knochenmuss, Eur. J. Mass Spectrom., 2006, 12, 345–358 CrossRef CAS.
- I. Kroslakova, S. Pedrussio and E. Wolfram, Phytochem. Anal., 2016, 27, 222–228 CrossRef CAS PubMed.
- E. Shim and H. R. Kim, Text. Res. J., 2019, 89, 1297–1310 CrossRef CAS.
- C. Harsito, A. Prabowo, S. Prasetyo and Z. Arifin, Open Eng., 2021, 11, 548–555 CrossRef CAS.
- R. S. Blackburn, Environ. Sci. Technol., 2004, 38, 4905–4909 CrossRef CAS PubMed.
- R. Cortez, D. A. Luna, D. Margulis and E. Mejia, Compr. Rev. Food Sci. Food Saf., 2016, 180 Search PubMed.
- A. Phan, G. Netzel, D. Wang, B. M. Flanagan, B. R. D'Arcy and M. J. Gidley, Food Chem., 2015, 171, 388–396 CrossRef CAS PubMed.
- A. Phan, B. R. D'Arcy and M. J. Gidley, Int. J. Food Sci. Technol., 2016, 51, 203–211 CrossRef CAS.
- A. Siemińska-Kuczer, M. Szymańska-Chargot and A. Zdunek, Food Chem., 2022, 373, 131487 CrossRef PubMed.
- H. Tang, A. D. Covington and R. A. Hancock, Biopolymers, 2003, 70(3), 403–413 CrossRef CAS PubMed.
- I. Fernandes, G. M. Maciel, V. Ribeiro, R. Rossetto, A. Pedro and C. Haminiuk, Carbohydr. Polym. Technol. Appl., 2021, 2, 100122 CAS.
- M. Ramos, E. Laveriano, L. San Sebastián, M. Perez, A. Jiménez, R. M. Lamuela-Raventos, M. C. Garrigós and A. Vallverdú-Queralt, Trends Food Sci. Technol., 2023, 131, 14–27 CrossRef CAS.
- M. Aderogba, L. Mcgaw and J. Eloff, Niger. J. Nat. Prod. Med., 2008, 12, 66–70 Search PubMed.
- M. Topashka-Ancheva, R. M. Taskova and N. V. Handjieva, Fitoterapia, 2006, 77, 608–610 CrossRef CAS PubMed.
- Z. Baharum, A. Md Akim, Y. H. Taufiq-Yap, R. Abd Hamid and K. RosmiN, Molecules, 2014, 19, 18317–18331 CrossRef PubMed.
- W. Ren, Z. Qiao, H. Wang, L. Zhu and L. Zhang, Med. Res. Rev., 2003, 23, 519–534 CrossRef CAS PubMed.
Footnote |
| † Electronic supplementary information (ESI) available. See DOI: https://doi.org/10.1039/d3ra01049j |
| This journal is © The Royal Society of Chemistry 2023 |