 Open Access Article
Unravelling the doping effect of potassium ions on structural modulation and photocatalytic activity of graphitic carbon nitride†
Chengyu Peng,
Rong Lu * and
Anchi Yu
 *
*
Department of Chemistry, Renmin University of China, Beijing 100872, P. R. China. E-mail: lurong@ruc.edu.cn; yuac@ruc.edu.cn
First published on 20th March 2023
Abstract
Graphitic carbon nitride (GCN), as a promising photocatalyst, has been intensely investigated in the photocatalytic fields, but its performance is still unsatisfactory. To date, metal ion doping has been proven to be an effective modification method to improve the photocatalytic activity of GCN. More importantly, comprehensive understanding of the doping mechanism will be of benefit to synthesize efficient GCN based photocatalysts. In this work, K+-doped GCN samples were prepared via heating the mixture of the preheated melamine and a certain amount of KCl at different synthetic temperatures. XRD and Raman characterization studies indicated that the introduction of K+ could improve its crystallinity at higher temperature but reduce its crystallinity at lower temperature. Moreover, FTIR and SEM-EDS measurements implied that K+ are found dominantly in the surface of the ion-doped sample prepared at lower temperature, while they are found both in the surface and bulk of the ion-doped sample prepared at higher temperature. These observations revealed that K+ distributed in the surface of the ion-doped GCN could inhibit its crystal growth, while K+ distributed inside of the ion-doped GCN could promote its crystallinity. Owing to the greater inducing effect of the bulk K+ than the disturbing effect of the surface K+, the improvement of the crystallinity for K+-doped GCN was achieved. As a result, the K+-doped GCN with higher crystallinity yielded an obviously higher H2 evolution rate than that with lower crystallinity under visible light irradiation (>420 nm). Besides, it was observed that the K+-doped GCN prepared at higher temperature exhibits significantly greater adsorption capacity for methylene blue than the K+-doped GCN prepared at lower temperature. This work would provide an insight into optimizing metal ion doped GCN with high photocatalytic activity.
1 Introduction
Due to its unique optical, electronic and physicochemical properties, as well as low cost and ease of preparation, graphitic carbon nitride (GCN), as a metal-free layered semiconductor, has been widely investigated and applied in the photocatalytic fields.1–7 However, the photocatalytic performance of the pristine GCN is still unsatisfactory at present. Then, modifying GCN to improve its photocatalytic efficiency becomes an inevitable strategy. Recently, metal element doping has been validated as an effective method to fabricate GCN with high photocatalytic activity.5,6,8,9K+ is one of the most studied elements among metal ion doping GCN studies. K+-doped GCN is usually obtained through potassium halide assisted thermal polymerization of nitrogen-rich precursor,10–23 and a few reports directly using GCN as the precursor.24–27 The calcination temperature was often set at 550 °C, the same temperature at which the pristine GCN was prepared. Since the melting point is much higher than 550 °C, potassium halide was also regarded as a solid template, which can be easily washed off after polymerization reaction.10–13
According to the previous studies, the influence of K+ on GCN is manifested in the aspects of changing morphology,12,26 introducing new functional groups,13,17 tuning electronic band structure,14 narrowing band gap,15,16 or modulating crystallinity,10–13,18,21,25 etc. However, most studies about K+-doped GCN showed only partial doping effects. Moreover, conclusions from different literatures regarding the effect of K+ could be contradictory, for example, the doped K+ was suggested to inhibit the crystal growth of GCN,13,14,18,20,21 but it also might induce highly crystalline structure in GCN.10–12,25 Therefore, unravelling the modification mechanism of K+ or potassium halide on GCN would be the key to understanding these contradictories.
Several studies have attempted to investigate how K+ to modify the structure of GCN. In 2016, Xiong et al. performed both experimental measurements and DFT calculations to explore K+ modification mechanism, and they proposed that K+ could intercalate into GCN interlayer via bridging the layers, which decreases the electronic localization and extends the π conjugated system, and thus narrows the band gap of GCN.15 In the same year, Li et al. claimed that K+ played an essential role in breaking the periodic chemical structure of GCN through introducing a new structural unit, cyano group, based on the controlled experiments.17 In 2019, Xu et al. demonstrated that KCl was to provide an inter-crystal confined space to guide the growth of GCN with high crystalline, which was attributed to its remarkably enhanced activity. The combination of the structural analyses and first-principle calculations further revealed that the high crystallinity sample was composed of chain-like melon motifs with intercalated K+.11 Furthermore, in 2020, the same group prepared a high crystalline sample via heating GCN and KCl, and they observed that K+ were uniformly distributed in bulk of GCN through the XPS measurement on the sample exposed to Ar+. They also concluded that the light harvesting, electron lifetime, charge separation and migration to the material surface as well as photocatalytic activity were all improved remarkably owing to K+ induced highly crystalline structure.25 From those studies, it is found that the modification mechanism of K+ or KCl on GCN is still unclear.
Herein, K+-doped GCNs were prepared via heating GCN together with a certain amount of KCl at different calcination temperatures. The as-prepared sample with a weight ratio of 0.75 of KCl to GCN heated at 560 °C (GCN-K0.75-560) possesses H2 evolution rate about 14 times in comparison with that of the pristine GCN. Experimental results demonstrate that the enhanced photocatalytic activity is mainly ascribed to the high crystallinity induced by K+ locating inside K+-doped sample. And large adsorption capacity of K+-doped GCN for methylene blue (MB) is also observed, which is due to the electrostatic interaction between MB and K+-doped GCN.
In addition, the characterization data of the pristine GCN are also displayed for reference. Besides, the introduction of K+ via potassium hydrate, potassium salt with less thermal stability (potassium carbonate, potassium sulfate, and potassium thiocyanate, etc.), and binary salts as well as molten salts containing potassium halide is not discussed here because of the more complicated process. The current study will be helpful for in-depth understanding the modification mechanism of GCN by K+. Meanwhile, this work puts forward to an alternative strategy that crystalline GCN could be prepared using the current facile and flexible doping method under optimal synthetic conditions (metal ion type, dosage of doping ion, calcination temperature, and calcination time, etc.), instead of the molten salt method which is more complicated but particularly popular recently.28
2 Experimental section
2.1 Samples
Melamine (>99.0%) was purchased from Sigma-Aldrich. Potassium chloride (KCl, ≥99.5%) was purchased from Meryer (Shanghai) Chemical Technology Co., Ltd. and ethanol (≥95%) was purchased from Beijing Tong Guang Fine Chemicals Company. All chemical reagents were used as received without further purification.2.2 Synthesis of graphitic carbon nitride (GCN)
GCN was prepared as follows (Scheme S1†). 2.0 g melamine was placed in an alumina boat crucible covered with an aluminum foil in a tube furnace and heated to 550 °C for 3 h at a ramping rate of 2 °C min−1 in atmosphere. The resultant sample was washed with deionized water, and dried at 60 °C in a vacuum oven (−0.085 MPa) for 24 h, and then ground into fine powder for further use.2.3 Synthesis of K+-doped GCN samples (GCN-Kx-T)
According to the literature,25 a blend of GCN (400 mg) and a certain amount of KCl was dispersed into 2 mL ethanol, and ground altogether in an agate mortar till ethanol evaporated. The resultant mixture was then placed in an alumina boat crucible covered with an aluminum foil in a tube furnace and heated to a preset temperature for 3 h at a ramping rate of 2 °C min−1 in atmosphere. The obtained sample was ground into fine power and dispersed in deionized water, and washed for several times till the conductivity of the dispersion system kept constant. The obtained precipitation was separated by centrifugation and dried at 60 °C in a vacuum oven (−0.085 MPa) for 24 h. The final product was fully ground again and denoted as GCN-Kx-T, and here x (x = 0, 0.25, 0.75, 1.0, 1.5 or 2.25) means the weight ratio of KCl to GCN (400 mg), and T represents the calcination temperature (T = 500, 530, 540, 550, 560, 570 or 580 °C). The preparation process of K+-doped sample is schematically illustrated in Scheme S1.†2.4 Characterizations
Powder X-ray diffraction (XRD) was measured on a Shimadzu XRD-7000 diffractometer with Cu radiation source (λ = 1.54056 Å). The Fourier transform-infrared (FTIR) spectra were collected on a Bruker Tensor 27 spectrometer. Raman spectra were captured using a FT Raman spectrometer (laser source 1064 nm, VERTEX 70v&RAMII, Bruker). X-ray photoelectron spectroscopy (XPS) was adopted by a Thermo ESCALab250Xi electron spectrometer with Al radiation source. The C 1s peak (284.8 eV) was referenced for all measurements. Scanning electron microscopy (SEM, SU8010, and Hitachi) was used to characterize the morphology of the sample, and the element mapping as well as K+ content were measured by a SEM energy dispersive spectrometer (SEM-EDS). K+ content was also obtained by inductively coupled plasma optical emission spectrometry (ICP-OES, Thermo Scientific iCAP 7400). Thermogravimetric Analyzer Q500 (TA Instrument company) was used to investigate the thermal stability of the sample, and the sample (about 10–20 mg with the mass precision ± 0.1 μg) was measured under ramp mode (ramp to 800 °C at a ramping rate of 10 °C min−1, N2 flow rate 40 mL min−1, platinum pan).The UV-vis diffuse reflectance spectra (DRS) were recorded on a Shimadzu UV-2600 spectrophotometer, using BaSO4 as a reference. The fluorescence spectra were recorded on a Horiba FluoroMax+ spectrophotometer, and the excitation wavelength was set at 375 nm. Fluorescence decay curve was obtained under 375 nm excitation and 470 nm detection with a time-resolution of around 250 ps on a UV-vis near infrared spectrophotometer (FLS980, Edinburgh). The Brunauer–Emmett–Teller (BET) specific surface area was determined with a Belsorp-Mini II equipment (MicrotracBEL) via measuring its N2 adsorption–desorption isotherm at 77 K.
Electrochemical measurements including Mott–Schottky curve, transient photocurrent response and electrochemical impedance spectroscopy (EIS) were performed on an electrochemical workstation (CHI-660D, Shanghai Chenhua) with a conventional three-electrode cell, which have been demonstrated in detail previously.21 A Pt wire was used as a counter electrode, and Ag/AgCl (3.0 M KCl) was used as a reference electrode. To prepare the working electrode, 10 mg sample was dispersed in a 200 μL Nafion solution (5 wt%) to get a slurry, and the as-prepared slurry was dropped onto the platinum–carbon electrode, and then dried under an infrared lamp. Na2SO4 aqueous solution (0.5 M) was used as the electrolyte solution. The transient photocurrent response was conducted under a 420 nm LED lamp irradiation.
2.5 Photocatalytic hydrogen evolution test
According to the reported procedure,21 the photocatalytic H2 evolution rate of the sample was measured. In detail, 20 mg of photocatalyst was dispersed in 100 mL aqueous solution, containing 10 vol% TEOA (triethanolamine). Pt (3 wt%) cocatalyst was photo-deposited on the surface of the catalyst powder through adding H2PtCl6·6H2O into the 100 mL aqueous solution. A 300 W Xeon lamp (Microsolar300, PerfectLight, and Beijing) with a 420 nm long path filter was used as a light source. The air was completely removed before the reaction aqueous solution was irradiated. A gas chromatography (GC-2014C, Shimadzu) was used to determine the amount of H2 from photocatalytic reaction.2.6 Photocatalytic degradation for methylene blue
Following the previously reported method,29 the photocatalytic degradation reaction of methylene blue (MB) was conducted in a Pyrex double-jacket reactor. The irradiation light source was supplied by a 300 W Xeon lamp (Microsolar300, PerfectLight, and Beijing) with a 420 nm long band-pass filter. A water bath connected with a pump was used to keep the reaction temperature at 25 °C. Typically, 20 mg photocatalyst was added into 100 mL of MB aqueous solution (10 mg L−1) and stirred for 30 min in the dark to achieve the adsorption desorption equilibrium. Then 1 mL of MB solution was taken out at regular intervals to measure its optical density at 665 nm on a Shimadzu UV-3600 spectrophotometer. I and I0 represent the absorbance of the solution, which are proportional to the concentration of the solution (C and C0).3 Results and discussion
Fig. 1 shows the XRD patterns of GCN and K+-doped GCNs with a fixed weight ratio of 0.75 of KCl to GCN at different calcination temperatures. For GCN, two characteristic peaks are observed. The strong one at 27.4° represents the interplanar graphitic stacking (002) plane with an interlayer distance of ∼0.33 nm, and the weak one at 12.8° represents the intralayer long-range order packing (100) plane.30,31 For K+-doped GCNs, with the increase of the calcination temperature (below 550 °C), the intensities of both peaks gradually decrease, and the (002) peak is broadened, indicating the reduction of the crystallinity. The peak position and the corresponding FWHM of the (002) peak for each sample are listed in Table S1.† As shown in Table S1,† the (002) peak shifts toward higher degree, indicating K+-doped samples prepared at relatively higher temperature possess narrower interlayer distance and more dense packing.17 The narrower interlayer distance implies K+ would not get inserted into the interlayer of K+-doped GCNs.18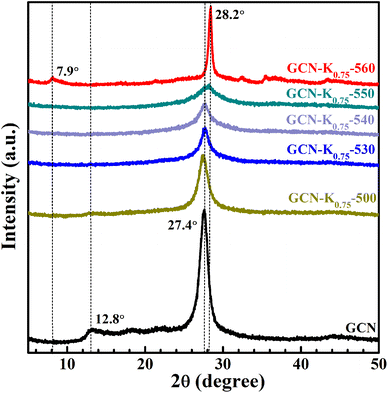 | ||
| Fig. 1 XRD patterns of GCN and K+-doped GCNs (weight ratio of KCl/GCN = 0.75) at different temperatures. | ||
To identify the factor leading to the decreased crystallinity, the sample GCN-K0-550 without adding KCl was prepared at 550 °C, and its XRD profile is shown in Fig. S1.† The intensities and positions of both peaks are nearly identical to those of GCN, implying K+ plays a principle role in affecting the crystallinity of K+-doped GCNs. Moreover, as seen from the XRD profile of GCN-K0.75-550, the (100) peak disappears, and the (002) peak presents the lowest intensity as well as the largest width. However, for GCN-K0.75-560, interestingly, the (002) peak width becomes extremely narrow, its intensity increases again and its peak position shifts to the maximum value 28.2°, suggesting GCN-K0.75-560 with remarkably high crystallinity and the most dense interlayer packing. In addition, the XRD pattern of GCN-K0.75-560 exhibits a new weak peak at 7.9° assigned to the (110) crystal facet, originating from the inserted K+ into the melon chains of GCN.10,25 Since the loading of KCl remains constant, the improved crystallinity of GCN-K0.75-560 is related to the higher calcination temperature. The mass yields of K+-doped GCNs at different temperatures are presented in Fig. S2,† which suggests a minimal amount of product is obtained if the calcination temperature is higher than 560 °C. Thus, 560 °C is an optimum temperature to prepare K+-doped GCN with high crystallinity at the weight ratio of 0.75 of KCl to GCN. These observations illustrate that K+ can cause a reduced crystallinity, while also can cause an improved crystallinity at optimum temperature. In the previous studies, the differences in crystallinity of K+-doped samples reported by different research groups might be caused by the differences in synthetic temperature or furnace temperature.
The effect of KCl dosage on the crystallinity was also investigated. Fig. S3† shows the XRD patterns of K+-doped GCNs with different weight ratios of KCl to GCN heated at 560 °C. It is apparent that GCN-K0.75-560, GCN-K1.00-560 and GCN-K1.50-560 exhibit similarly high crystallinity, while GCN-K0.25-560 and GCN-K2.25-560 exhibit lower crystallinity, which indicates too little or too much KCl loading in the precursor mixture is not helpful for the crystal growth at 560 °C.
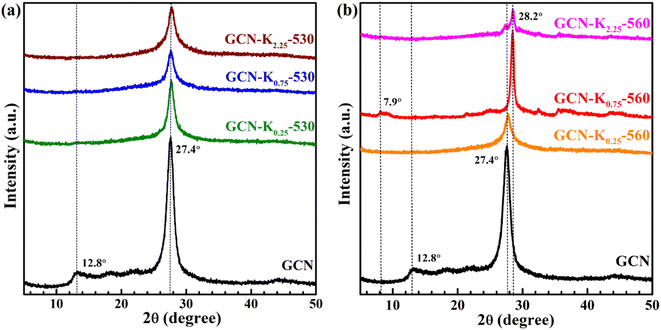
In order to deeply examine K+ doping effect, we tentatively chose three precursor mixtures with different weight ratios (0.25, 0.75 and 2.25) of KCl to GCN, and heated them at 530 °C and 560 °C, respectively, and then performed XRD, FTIR and Raman measurements on the final products. Fig. 2 shows the XRD patterns of GCN and K+-doped GCNs at 530 °C and 560 °C. Compared with K+-doped GCNs at 560 °C, three K+-doped GCNs at 530 °C all exhibit remarkably reduced crystallinity. Therefore, it is difficult to obtain K+-doped sample with improved crystallinity at relatively lower temperature.
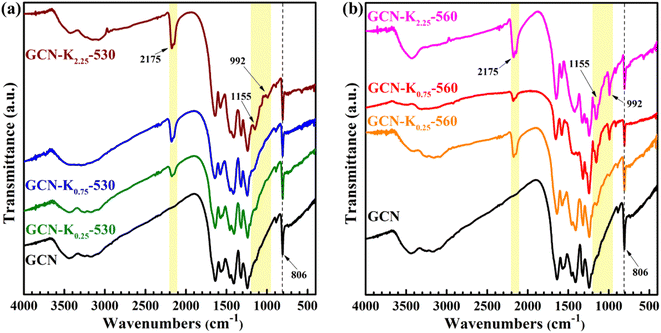
Fig. 3 shows the FTIR spectra of K+-doped GCNs at 530 °C and 560 °C together with GCN. The bands at 806 cm−1, 1200–1800 cm−1, 3000–3700 cm−1 regions respectively correspond to the breathing mode of heptazine units, the stretching modes of aromatic CN heterocycles, the stretching modes of N–H and the stretching modes of O–H arising from the adsorbed water on the sample surface.32 However, compared to GCN, there are three new peaks at 992 cm−1, 1155 cm−1, and 2175 cm−1 appearing in the FTIR spectra of K+-doped GCNs. The two peaks positioned at 992 cm−1 and 1155 cm−1 are assigned to the symmetric and asymmetric vibrations of N–C2 bond of K–NC2.19,33 To confirm the origin of N–C2 vibrations, GCN-K0.75-560 was treated with 0.1 M HCl aqueous solution for 12 h, and then dried at 60 °C. The FTIR spectrum of HCl-treated sample (GCN-K0.75-560-HCl) is displayed in Fig. S4,† showing apparent reduction of the two peaks after HCl treatment. K+ contents of GCN-K0.75-560 and GCN-K0.75-560-HCl are listed in Table S2† based on SEM-EDS measurements, presenting greatly decreased amount of K+ after HCl treatment. Therefore, the reduced amount of K+ accompanied by the weakened vibrational peaks clarifies that the intensities of the two peaks are strongly dependent on the amount of K+. As seen from Fig. 3, both 992 cm−1 and 1155 cm−1 peaks are very weak for K+-doped GCNs at 530 °C (Fig. 3(a)), while become remarkably strong for K+-doped GCNs at 560 °C with more KCl loading (Fig. 3(b)). Those phenomena imply that few K+ exist in K+-doped GCNs at 530 °C, while more K+ exist in K+-doped GCNs with more KCl loading at 560 °C.
The peak positioned at 2175 cm−1 has been suggested to originate from cyano group (–C![[triple bond, length as m-dash]](https://www.rsc.org/images/entities/char_e002.gif) N).17,25 Ye et al. pointed out that the appearance of –C
N).17,25 Ye et al. pointed out that the appearance of –C![[triple bond, length as m-dash]](https://www.rsc.org/images/entities/char_e002.gif) N is due to the tailoring of the layered structure of GCN by K+.17 Fig. S4† shows the peak of –C
N is due to the tailoring of the layered structure of GCN by K+.17 Fig. S4† shows the peak of –C![[triple bond, length as m-dash]](https://www.rsc.org/images/entities/char_e002.gif) N is much weaker for GCN-K0.75-560-HCl in comparison with that of GCN-K0.75-560, which confirms again –C
N is much weaker for GCN-K0.75-560-HCl in comparison with that of GCN-K0.75-560, which confirms again –C![[triple bond, length as m-dash]](https://www.rsc.org/images/entities/char_e002.gif) N is introduced by K+ doping, and the intensity of –C
N is introduced by K+ doping, and the intensity of –C![[triple bond, length as m-dash]](https://www.rsc.org/images/entities/char_e002.gif) N vibration also depend on the amount of K+. As seen from Fig. 3, the –C
N vibration also depend on the amount of K+. As seen from Fig. 3, the –C![[triple bond, length as m-dash]](https://www.rsc.org/images/entities/char_e002.gif) N peak apparently appears in the FTIR spectra of all K+-doped GCNs, indicating the tailoring function of K+ occurring in the samples prepared both at 530 °C and at 560 °C. Based on the above analysis, it is clear that the dependence of the spectral intensity of –C
N peak apparently appears in the FTIR spectra of all K+-doped GCNs, indicating the tailoring function of K+ occurring in the samples prepared both at 530 °C and at 560 °C. Based on the above analysis, it is clear that the dependence of the spectral intensity of –C![[triple bond, length as m-dash]](https://www.rsc.org/images/entities/char_e002.gif) N on the amount of K+ is different from that of N–C2, which suggests –C
N on the amount of K+ is different from that of N–C2, which suggests –C![[triple bond, length as m-dash]](https://www.rsc.org/images/entities/char_e002.gif) N might dominantly exist in the surface of K+-doped GCNs, while –C
N might dominantly exist in the surface of K+-doped GCNs, while –C![[triple bond, length as m-dash]](https://www.rsc.org/images/entities/char_e002.gif) N might mainly exist inside of K+-doped GCNs. Zhang et al. systemically explored K+ concentrations in K+-doped GCN as a function of the calcination time, and confirmed that K+ could diffuse into the bulk when the calcination time was sufficient.24 And their FTIR spectra also presented apparent –C
N might mainly exist inside of K+-doped GCNs. Zhang et al. systemically explored K+ concentrations in K+-doped GCN as a function of the calcination time, and confirmed that K+ could diffuse into the bulk when the calcination time was sufficient.24 And their FTIR spectra also presented apparent –C![[triple bond, length as m-dash]](https://www.rsc.org/images/entities/char_e002.gif) N and N–C2 vibrations for the K+-doped GCN sample with bulk K+.24 Therefore, it is further suggested that K+ are dominantly distributed in the surface of K+-doped GCNs prepared at 530 °C, while distributed both in the surface and bulk of K+-doped GCNs prepared at 560 °C. Besides, the appearance of 992 cm−1 and 1155 cm−1 peaks could be an indicator to judge whether K+ enter into the bulk of GCN.
N and N–C2 vibrations for the K+-doped GCN sample with bulk K+.24 Therefore, it is further suggested that K+ are dominantly distributed in the surface of K+-doped GCNs prepared at 530 °C, while distributed both in the surface and bulk of K+-doped GCNs prepared at 560 °C. Besides, the appearance of 992 cm−1 and 1155 cm−1 peaks could be an indicator to judge whether K+ enter into the bulk of GCN.
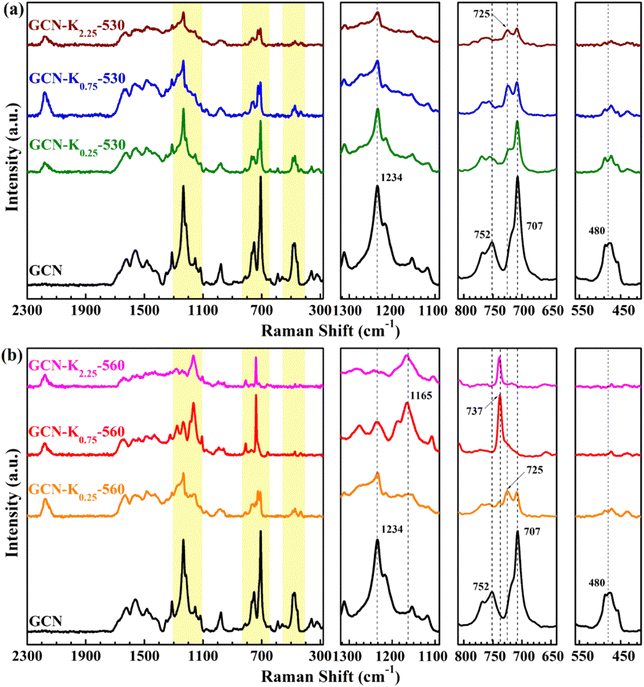
Raman spectroscopy is a useful tool to analyse the structure of solid materials.5 There are few discussions about Raman spectra of GCN,5 and even fewer reports about Raman spectra of K+-doped GCN. Fig. 4 presents the Raman spectra of GCN and K+-doped GCNs at 530 °C and 560 °C. For GCN, the bands positioned at 480 cm−1, 707 cm−1, 725 cm−1, 752 cm−1, 980 cm−1, 1100–1340 cm−1 and 1340–1740 cm−1 regions are assigned as in-plane twisting vibrations of the heptazine, heterocycle breathing 2 mode of the s-triazine ring, E′′ vibration, the layer–layer deformation vibration, breathing 1 mode of the s-triazine unit, ![[double bond, length as m-dash]](https://www.rsc.org/images/entities/char_e001.gif) C(sp2) bending vibrations and C–N vibrations of aromatic secondary amines, respectively.32 As shown in Fig. 4(a), the intensity ratio of 707 cm−1 peak to 725 cm−1 peak apparently decreases for K+-doped GCNs at 530 °C in comparison with that of GCN, suggesting the stronger structure perturbation by K+,21 which is in line with their corresponding XRD data in Fig. 2(a). Furthermore, a new peak at 2180 cm−1 appears in the Raman spectra of K+-doped GCNs at 530 °C, which originates from –C
C(sp2) bending vibrations and C–N vibrations of aromatic secondary amines, respectively.32 As shown in Fig. 4(a), the intensity ratio of 707 cm−1 peak to 725 cm−1 peak apparently decreases for K+-doped GCNs at 530 °C in comparison with that of GCN, suggesting the stronger structure perturbation by K+,21 which is in line with their corresponding XRD data in Fig. 2(a). Furthermore, a new peak at 2180 cm−1 appears in the Raman spectra of K+-doped GCNs at 530 °C, which originates from –C![[triple bond, length as m-dash]](https://www.rsc.org/images/entities/char_e002.gif) N by K+ doping. This observation is in well consistent with their corresponding FTIR spectrum in Fig. 3(a). Compared with the Raman spectrum of GCN, apart from the 2180 cm−1 peak, other characteristic bands all appear in the Raman spectra of K+-doped GCNs at 530 °C, suggesting no dramatic structural change in them.
N by K+ doping. This observation is in well consistent with their corresponding FTIR spectrum in Fig. 3(a). Compared with the Raman spectrum of GCN, apart from the 2180 cm−1 peak, other characteristic bands all appear in the Raman spectra of K+-doped GCNs at 530 °C, suggesting no dramatic structural change in them.
For K+-doped GCNs at 560 °C (Fig. 4(b)), the 2180 cm−1 peak of –C![[triple bond, length as m-dash]](https://www.rsc.org/images/entities/char_e002.gif) N also appears in their Raman spectra, in accordance with their corresponding FTIR spectra in Fig. 3(b). However, different from the Raman spectra of GCN and K+-doped GCNs at 530 °C, three peaks at 480 cm−1, 707 cm−1 and 752 cm−1 disappear, and a new peak at 737 cm−1 appears in the Raman spectra of GCN-K0.75-560 and GCN-K2.25-560. Moreover, the strongest peak of
N also appears in their Raman spectra, in accordance with their corresponding FTIR spectra in Fig. 3(b). However, different from the Raman spectra of GCN and K+-doped GCNs at 530 °C, three peaks at 480 cm−1, 707 cm−1 and 752 cm−1 disappear, and a new peak at 737 cm−1 appears in the Raman spectra of GCN-K0.75-560 and GCN-K2.25-560. Moreover, the strongest peak of ![[double bond, length as m-dash]](https://www.rsc.org/images/entities/char_e001.gif) C(sp2) bending vibrations moves from 1234 cm−1 to 1165 cm−1, which are probably due to the inserted K+ into the melon chains of GCN. Those tremendous changes in the Raman spectra of GCN-K0.75-560 and GCN-K2.25-560 indicate that their structure ordering has changed significantly, which is in good agreement of K+-doped GCN. Furthermore, the disappearance of the in-plane twisting vibration of the heptazine at 480 cm−1 and the layer–layer deformation vibration at 752 cm−1 verifies the highly ordered layer–layer stacking in GCN-K0.75-560 and GCN-K2.25-560, in good accordance with the densest interlayer packing resulted from their XRD data.
C(sp2) bending vibrations moves from 1234 cm−1 to 1165 cm−1, which are probably due to the inserted K+ into the melon chains of GCN. Those tremendous changes in the Raman spectra of GCN-K0.75-560 and GCN-K2.25-560 indicate that their structure ordering has changed significantly, which is in good agreement of K+-doped GCN. Furthermore, the disappearance of the in-plane twisting vibration of the heptazine at 480 cm−1 and the layer–layer deformation vibration at 752 cm−1 verifies the highly ordered layer–layer stacking in GCN-K0.75-560 and GCN-K2.25-560, in good accordance with the densest interlayer packing resulted from their XRD data.
The above FTIR results suggest that the amount of K+ may be different between K+-doped GCNs at 530 °C and K+-doped GCNs at 560 °C, and then K+ content was measured by SEM-EDS and listed in Table 1. For K+-doped GCNs with the same KCl loading, K+ content of the sample prepared at 560 °C is more than that of the sample prepared at 530 °C, which indicates the higher calcination temperature can promote K+ to enter into the bulk of the sample, but the lower calcination temperature cannot.
| Sample | K (at%) |
|---|---|
| GCN-K0.25-530 | 1.06 ± 0.13 |
| GCN-K0.75-530 | 1.58 ± 0.10 |
| GCN-K2.25-530 | 5.10 ± 0.18 |
| GCN-K0.25-560 | 2.55 ± 0.37 |
| GCN-K0.75-560 | 8.25 ± 1.00 |
| GCN-K2.25-560 | 9.86 ± 0.51 |
Further increasing the KCl loading of K+-doped GCN at 560 °C, K+ content tends to saturate. Combined with FTIR and XRD results, it is proposed that K+ in the bulk of K+-doped GCNs at 560 °C not only cause the appearance of the N–C2 vibration in their FTIR spectra, but also induce their improved crystallinity.
Since the doping effect of K+ closely correlates with the calcination temperature, a thermal analysis of the KCl/GCN mixture was carried out to investigate the changes in weight of the sample as a function of the rising temperature. Fig. 5 presents the thermogravimetric analysis (TGA) and the derivative thermogravimetric (DTG) analysis plots of the precursor mixture with a weight ratio of 0.75 of KCl to GCN, and the TGA and DTG plots of GCN are also plotted for comparison. In Fig. 5(a), the TGA curve of GCN shows a large step from 500 °C to 645 °C, which represents a combination process involving condensation and decomposition with a drastic weight loss.30 Accordingly, the DTG curve of GCN shows a distinct peak in the same region. For KCl/GCN (=0.75) mixture in Fig. 5(b), the TGA curve shows a step from 470 °C to 570 °C, a step from 570 °C to 634 °C, and a smaller step from 634 °C to 800 °C. The first and second steps represent the condensation and decomposition process, and the third one represents the further decomposition. Accordingly, the first and second intense peaks in the DTG curve indicate the condensation and decomposition process with a main weight loss and the weakest peak corresponds to the further decomposition process with additional weight loss.
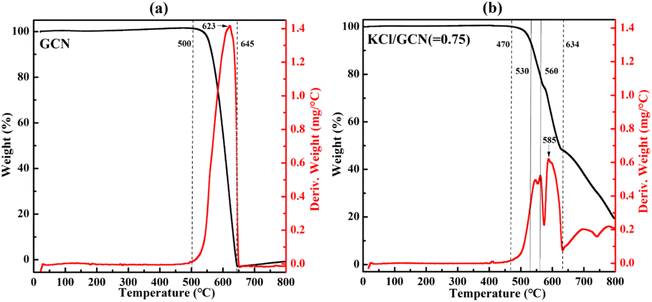 | ||
| Fig. 5 TGA (black) and DTG (red) plots of GCN (a) and the mixture of KCl/GCN (b) under N2 atmosphere. | ||
The significant difference of the TGA or DTG profiles between GCN and KCl/GCN mixture suggests KCl could greatly disturb the condensation and decomposition processes of the mixture. Furthermore, as seen from the TGA and DTG plots of KCl/GCN mixture, there is no obvious weight change at around 530 °C, but a significant weight change at around 560 °C, and then a great weight loss at higher temperature, which is in good accordance with the mass yield results at different temperatures (Fig. S2†).
To further explore the influence of K+, GCN, GCN-K0.75-530 and GCN-K0.75-560 were characterized by XPS spectroscopy. As shown in Fig. 6(a), the C 1s spectrum can be deconvoluted into three components located at 284.8, 286.4 and 288.2 eV, corresponding to the C species of the adventitious carbon, C–NHx, and N–C![[double bond, length as m-dash]](https://www.rsc.org/images/entities/char_e001.gif) N coordination in the framework of GCN, respectively.28 Apparently, the 286.4 peak becomes stronger after K+ doping, which is suggested to be ascribed to the introduction of –C
N coordination in the framework of GCN, respectively.28 Apparently, the 286.4 peak becomes stronger after K+ doping, which is suggested to be ascribed to the introduction of –C![[triple bond, length as m-dash]](https://www.rsc.org/images/entities/char_e002.gif) N,28 in consistent with the corresponding FTIR and Raman data. In Fig. 6(b), the N 1s spectrum can be deconvoluted into four peaks at 398.6 eV, 400.1 eV, 401.2 eV and 404.4 eV, which are assigned to the N species in N
N,28 in consistent with the corresponding FTIR and Raman data. In Fig. 6(b), the N 1s spectrum can be deconvoluted into four peaks at 398.6 eV, 400.1 eV, 401.2 eV and 404.4 eV, which are assigned to the N species in N![[double bond, length as m-dash]](https://www.rsc.org/images/entities/char_e001.gif) C–N, N–(C)3, N–Hx (and –C
C–N, N–(C)3, N–Hx (and –C![[triple bond, length as m-dash]](https://www.rsc.org/images/entities/char_e002.gif) N) and positive charge localization in heptazine rings, respectively.24,28 The intensity ratio of the 401.2 eV peak to the 400.1 eV peak becomes slightly larger after K+ doping, which is probably due to the contribution of –C
N) and positive charge localization in heptazine rings, respectively.24,28 The intensity ratio of the 401.2 eV peak to the 400.1 eV peak becomes slightly larger after K+ doping, which is probably due to the contribution of –C![[triple bond, length as m-dash]](https://www.rsc.org/images/entities/char_e002.gif) N (401.2 eV) in the K+-doped sample, and also in consistent with their corresponding FTIR and Raman results.
N (401.2 eV) in the K+-doped sample, and also in consistent with their corresponding FTIR and Raman results.
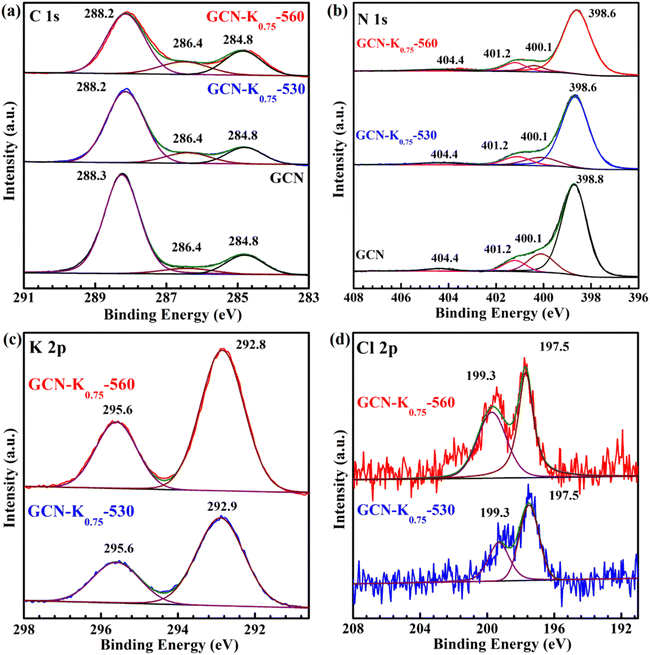 | ||
| Fig. 6 C 1s (a), N 1s (b) XPS spectra of GCN, GCN-K0.75-530 and GCN-K0.75-560; K 2p (c) and Cl 2p (d) XPS spectra of GCN-K0.75-530 and GCN-K0.75-560. | ||
In addition, the peak area of K 2p XPS spectrum of GCN-K0.75-530 is apparently smaller than that of GCN-K0.75-560 as shown in Fig. 6(c), suggesting less K+ in GCN-K0.75-530 (Table S3†), which is in agreement with above SEM-EDS results. However, the K+ content difference between GCN-K0.75-530 and GCN-K0.75-560 from XPS measurement (3.87 at% and 5.88 at% from Table S3†) is smaller than that from SEM-EDS measurement (1.58 at% and 8.25 at% from Table 1), which is due to XPS spectroscopy mainly detecting the surface layer element of the sample. Thus, compared to GCN-K0.75-530, more bulk K+ in GCN-K0.75-560 is confirmed again, which not only cause an appearance of the N–C2 vibrations in the FTIR spectrum of GCN-K0.75-560, but also lead to its higher crystallinity revealed by XRD as well as Raman data. The K+ contents of GCN-K0.75-530 and GCN-K0.75-560 were also determined to be 10.3 wt% and 14.9 wt% by ICP-OES, further suggesting more K+ in GCN-K0.75-560 than in GCN-K0.75-530. Besides, Cl 2p XPS spectra in Fig. 6(d) together with Cl− contents listed in Table S3† indicate trace Cl element were detected for both GCN-K0.75-530 and GCN-K0.75-560, suggesting that the effect of Cl− is negligible.
The morphologies of GCN, GCN-K0.75-530 and GCN-K0.75-560 were also investigated with SEM (Fig. S5†). Their SEM images present smaller and smaller pieces in order of GCN, GCN-K0.75-530 and GCN-K0.75-560, which is in agreement with the previously reported K+-doped GCN nanosheets when using large excess of KCl.26 Fig. S6† shows their SEM element mapping images, suggesting the uniform distribution of C and N in GCN, GCN-K0.75-530 and GCN-K0.75-560, as well as the uniform distribution of K+ in GCN-K0.75-530 and GCN-K0.75-560.
Above systematically experimental results indicate that GCN-K0.75-560 possesses higher crystallinity and more bulk K+ compared to GCN-K0.75-530, and then the respective transformation processes of GCN into GCN-K0.75-530 and GCN-K0.75-560 upon K+ doping are proposed and illustrated in Scheme 1. For GCN-K0.75-530, K+ in the surface layer play a role to disturb its crystallization, while for GCN-K0.75-560, the inducing effect of bulk K+ is greater than the disturbing effect of surface K+, which finally leads to its high crystallinity.
 | ||
| Scheme 1 The proposed transformation processes of GCN into GCN-K0.75-530 and GCN-K0.75-560, respectively. | ||
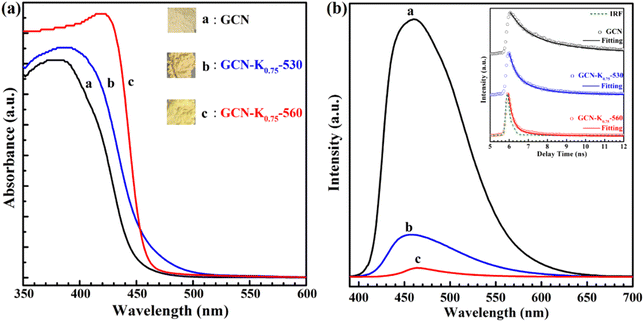
The influence of K+ on the optical and electronic properties of K+-doped GCN were also explored. Fig. 7(a) shows the UV-vis diffuse reflectance spectra (DRS) of GCN-K0.75-530 and GCN-K0.75-560 together with GCN. Compared to GCN, the absorption edge of the DRS spectra of GCN-K0.75-530 and GCN-K0.75-560 presents apparently red shift, which probably originates from K+ doping and –C![[triple bond, length as m-dash]](https://www.rsc.org/images/entities/char_e002.gif) N group,24,34 in consistent with their respective colors shown in the inset. Moreover, from the comparison of their DRS spectra, it is observed that the DRS spectrum of GCN-K0.75-560 exhibits an abrupt absorption edge, indicating its improved crystallinity and less defects,25 which is in good accordance with its XRD and Raman results. Fig. 7(b) presents the fluorescence spectra and the fluorescence decays (inset) of GCN, GCN-K0.75-530 and GCN-K0.75-560, and the fitting parameters of their fluorescence decays are listed in Table S4.† The average fluorescence lifetime of GCN is consistent with previous report.35 As seen from Fig. 7(b), the fluorescence emission intensity of GCN-K0.75-530 and GCN-K0.75-560 is much smaller than that of GCN, which is in accordance with their apparently reduced average fluorescence lifetime. The great doping effect of K+ on the fluorescence properties of GCN-K0.75-530 and GCN-K0.75-560 is also in consistent with the previous results.11,21 Besides, compared to GCN-K0.75-530, the further decrease of the fluorescence intensity and the average fluorescence lifetime is observed for GCN-K0.75-560, suggesting more non-radiative contribution in it.
N group,24,34 in consistent with their respective colors shown in the inset. Moreover, from the comparison of their DRS spectra, it is observed that the DRS spectrum of GCN-K0.75-560 exhibits an abrupt absorption edge, indicating its improved crystallinity and less defects,25 which is in good accordance with its XRD and Raman results. Fig. 7(b) presents the fluorescence spectra and the fluorescence decays (inset) of GCN, GCN-K0.75-530 and GCN-K0.75-560, and the fitting parameters of their fluorescence decays are listed in Table S4.† The average fluorescence lifetime of GCN is consistent with previous report.35 As seen from Fig. 7(b), the fluorescence emission intensity of GCN-K0.75-530 and GCN-K0.75-560 is much smaller than that of GCN, which is in accordance with their apparently reduced average fluorescence lifetime. The great doping effect of K+ on the fluorescence properties of GCN-K0.75-530 and GCN-K0.75-560 is also in consistent with the previous results.11,21 Besides, compared to GCN-K0.75-530, the further decrease of the fluorescence intensity and the average fluorescence lifetime is observed for GCN-K0.75-560, suggesting more non-radiative contribution in it.
Fig. 8(a) presents the Tauc plot curves of GCN, GCN-K0.75-530 and GCN-K0.75-560, which are transformed from their corresponding DRS spectra in Fig. 7(a), and the estimated band gaps are shown in the inset. Fig. 8(b) shows the Mott–Schottky plots of GCN, GCN-K0.75-530 and GCN-K0.75-560, and the derived flat band potentials are also displayed in the inset. The positive slopes of the Mott–Schottky plot indicate that GCN, GCN-K0.75-530 and GCN-K0.75-560 are n-type semiconductors, so that their conduction band minimum (CBM) is close to their respective flat band potential. Fig. 8(c) presents the valence band (VB) XPS spectra of the three samples and their respective VB values are also derived. Using their respective flat band potentials and VB values, the valence band maximum (VBM) positions of GCN, GCN-K0.75-530 and GCN-K0.75-560 are deduced. Further utilizing their optical band gap values, their corresponding CBM positions are derived.36 Thus, the electronic band structures for GCN, GCN-K0.75-530 and GCN-K0.75-560 are constructed as shown in Fig. 8(d). Apparently, the CBM positions (the driving force for H2 evolution) of GCN, GCN-K0.75-530 and GCN-K0.75-560 are quite similar, suggesting the negligible effect of K+ on their CBM positions.
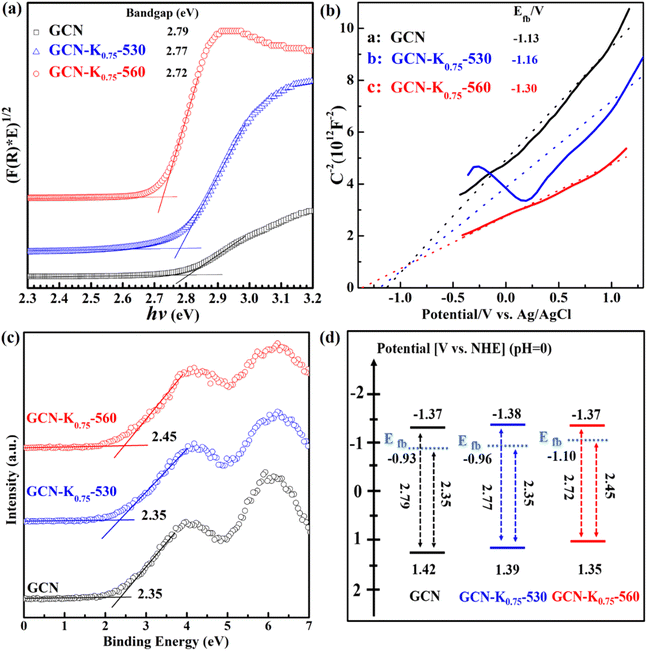 | ||
| Fig. 8 Tauc plot curves (a), Mott–Schottky plots at 4000 Hz (b), valence band XPS spectra (c), and band structure diagram (d) for GCN, GCN-K0.75-530 and GCN-K0.75-560. | ||
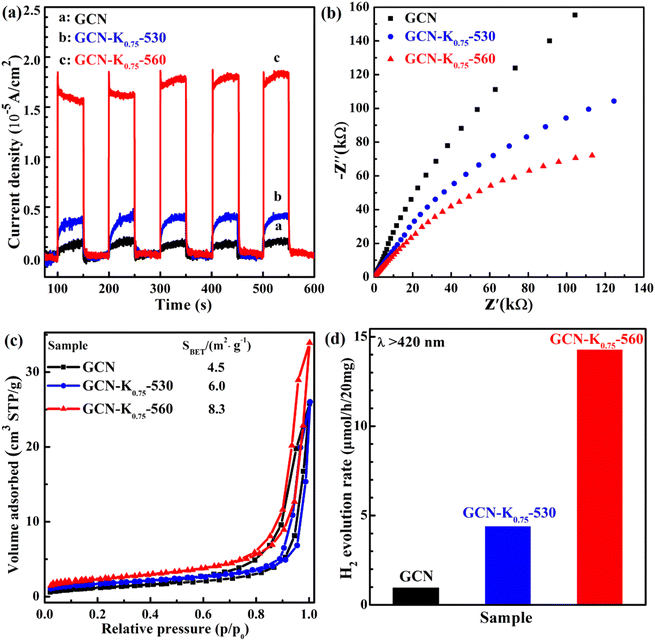
Photoelectrochemical measurements were also conducted to investigate the change transport property of GCN, GCN-K0.75-530 and GCN-K0.75-560. Fig. 9(a) shows their photocurrent densities under 420 nm light illumination. GCN-K0.75-560 exhibits a significant promotion of the photocurrent density compared with GCN and GCN-K0.75-530. Fig. 9(b) shows the smallest arc radius of the semiconductor Nyquist curve of electrochemical impedance spectroscopy (EIS) of GCN, GCN-K0.75-530 and GCN-K0.75-560, which is in consistent with their corresponding photocurrent density. Photocatalytic efficiency is closely related to the specific surface area of the photocatalyst. Fig. 9(c) presents the BET nitrogen adsorption/desorption isotherms of GCN, GCN-K0.75-530 and GCN-K0.75-560 and their specific surface areas are determined to be 4.5, 6.0 and 8.3 m2 g−1, respectively. The specific surface area of GCN is consistent with the previous report.37 The similar specific surface areas of the three samples indicate K+ doping has minor effect on the specific surface area under the current experimental conditions. The photocatalytic H2 evolution over GCN and K+-doped GCNs were evaluated under visible light irradiation (>420 nm). The H2 evolution rates for 20 mg of GCN, GCN-K0.75-530 and GCN-K0.75-560 are displayed in Fig. 9(d), and the H2 evolution rates for more samples are also displayed in Fig. S7 and Table S5.† GCN-K0.75-560 possesses the highest photocatalytic activity among all samples, and its H2 evolution rate is about 14 times as high as that of GCN, and more than 3 times as high as that of GCN-K0.75-530. The H2 evolution rate of GCN-K0.75-530 is around 4 times as high as that of GCN. The trend of the H2 evolution rate for GCN, GCN-K0.75-530 and GCN-K0.75-560 in Fig. 9(d) is in consistent with the trend of their photocurrent density in Fig. 9(a). The stability test of H2 evolution for GCN-K0.75-560 was further performed as shown in Fig. S8.† After four consecutive photocatalytic reaction cycles, the H2 evolution rate of GCN-K0.75-560 did not decrease obviously, indicative of its well stability. The slight difference in the FTIR spectra of GCN-K0.75-560 before and after the photocatalytic H2 evolution reaction (Fig. S9†) further indicates its stable structure.
Since the specific surface areas and the CBM positions of GCN, GCN-K0.75-530 and GCN-K0.75-560 are respectively similar, the higher H2 evolution rate of GCN-K0.75-530 than GCN might be ascribed to its surface –C![[triple bond, length as m-dash]](https://www.rsc.org/images/entities/char_e002.gif) N groups, which were identified to be the catalytically relevant sites for H2 generation.38,39 The further increase of the H2 evolution rate for GCN-K0.75-560 is suggested to be attributed to its higher crystallinity, which would facilitate better separation and migration of photogenerated charge carriers due to the less structural defects, and/or facilitate better contact with Pt cocatalyst so as to more efficiently utilizing the photogenerated free electrons during the photocatalytic reaction. Then, it is in great need to investigate the microscopic mechanism about the enhanced H2 evolution rate of K+-doped GCN with high crystallinity with femtosecond time-resolved transient spectroscopy.
N groups, which were identified to be the catalytically relevant sites for H2 generation.38,39 The further increase of the H2 evolution rate for GCN-K0.75-560 is suggested to be attributed to its higher crystallinity, which would facilitate better separation and migration of photogenerated charge carriers due to the less structural defects, and/or facilitate better contact with Pt cocatalyst so as to more efficiently utilizing the photogenerated free electrons during the photocatalytic reaction. Then, it is in great need to investigate the microscopic mechanism about the enhanced H2 evolution rate of K+-doped GCN with high crystallinity with femtosecond time-resolved transient spectroscopy.
Besides, the photocatalytic activity of GCN and K+-doped GCNs was also evaluated by degradation of MB under λ > 420 nm light illumination as shown in Fig. S10.† Compared to GCN, GCN-K0.75-530 and GCN-K0.75-560 exhibit slightly better photodegradation performance. However, it is observed that K+-doped GCNs possess greater absorption capacity for MB than GCN, which is attributed to the electrostatic interaction between MB and K+-doped GCN.40 Moreover, GCN-K0.75-560 has significantly greater absorption capacity than GCN-K0.75-530, in well agreement with the results that GCN-K0.75-560 contains more K+ than GCN-K0.75-530 from the K+ content measurements. The MB photodegradation stability test of GCN-K0.75-560 in Fig. S11† also indicates the good stability of GCN-K0.75-560.
4 Conclusions
In summary, a series of K+-doped GCN samples have been prepared via heating the mixture of GCN and KCl through changing the calcination temperature as well as the dosage of KCl. Both XRD and Raman observations indicate that K+-doped GCN with a weight ratio of 0.75 of KCl to GCN heated at 560 °C (GCN-K0.75-560) presents apparently improved crystallinity, while the one heated at 530 °C (GCN-K0.75-530) presents reduced crystallinity. FTIR combined with the K+ content measurements imply that K+ might be dominantly distributed in the surface of GCN-K0.75-530, while distributed both in the surface and bulk of GCN-K0.75-560. Thus, the improved crystallinity of GCN-K0.75-560 is suggested to be due to the greater inducing effect of the bulk K+ than the disturbing effect of the surface K+ in it, while the reduced crystallinity of GCN-K0.75-530 is caused by the disturbing effect of the surface K+ in it. Consequently, GCN-K0.75-560 possesses distinct optical and photoelectrochemical properties when compared to GCN-K0.75-530. As a result, GCN-K0.75-560 achieves around 14 times H2 evolution rate as high as that of the pristine GCN, and around 3 times as high as that of GCN-K0.75-530 under visible light irradiation. The distinguished feature of GCN-K0.75-560 is suggested to be ascribed to its high crystallinity induced by bulk K+. Besides, the remarkably greater adsorption capacity of GCN-K0.75-560 for MB than that of GCN-K0.75-530 again verifies more K+ in GCN-K0.75-560 than in GCN-K0.75-530. This study highlights the impact of bulk K+ on the structure variation, optical, adsorption and photoelectrochemical properties as well as the photocatalytic activity of the ion-doped sample, and the current results could be extended to other doping experiments as well as other metal ions.Conflicts of interest
There are no conflicts to declare.Acknowledgements
This work was supported by the National Natural Science Foundation of China (21773306).References
- X. Wang, K. Maeda, A. Thomas, K. Takanabe, G. Xin, J. M. Carlsson, K. Domen and M. Antonietti, Nat. Mater., 2009, 8, 76–80 CrossRef CAS PubMed.
- Y. Zheng, J. Liu, J. Liang, M. Jaroniec and S. Z. Qiao, Energy Environ. Sci., 2012, 5, 6717–6731 RSC.
- Y. Wang, X. Wang and M. Antonietti, Angew. Chem., Int. Ed., 2012, 51, 68–89 CrossRef CAS PubMed.
- W.-J. Ong, L.-L. Tan, Y. H. Ng, S.-T. Yong and S.-P. Chai, Chem. Rev., 2016, 116, 7159–7329 CrossRef CAS PubMed.
- T. S. Miller, A. B. Jorge, T. M. Suter, A. Sella, F. Cora and P. F. McMillan, Phys. Chem. Chem. Phys., 2017, 19, 15613–15638 RSC.
- S. Cao, J. Low, J. Yu and M. Jaroniec, Adv. Mater., 2015, 27, 2150–2176 CrossRef CAS PubMed.
- V. Hasija, P. Raizada, A. Sudhaik, K. Sharma, A. Kumar, P. Singh, S. B. Jonnalagadda and V. K. Thakur, Appl. Mater. Today, 2019, 15, 494–524 CrossRef.
- L. Jiang, X. Yuan, Y. Pan, J. Liang, G. Zeng, Z. Wu and H. Wang, Appl. Catal., B, 2017, 217, 388–406 CrossRef CAS.
- X. Liu, R. Ma, L. Zhuang, B. Hu, J. Chen, X. Liu and X. Wang, Crit. Rev. Environ. Sci. Technol., 2021, 51, 751–790 CrossRef CAS.
- C. Qiu, Y. Xu, X. Fan, D. Xu, R. Tandiana, X. Ling, Y. Jiang, C. Liu, L. Yu, W. Chen and C. Su, Adv. Sci., 2019, 6, 1801403 CrossRef PubMed.
- Y. Xu, X. He, H. Zhong, D. J. Singh, L. Zhang and R. Wang, Appl. Catal., B, 2019, 246, 349–355 CrossRef CAS.
- W. Wang, Z. Shu, J. Zhou, D. Meng, Z. Zhao and T. Li, J. Mater. Chem. A, 2020, 8, 6785–6794 RSC.
- H. Ma, Y. Jia, F. Zhang, S. Rhee, B. Lee and C. Liu, Appl. Surf. Sci., 2020, 507(1–11), 144885 CrossRef CAS.
- M. Zhang, X. Bai, D. Liu, J. Wang and Y. Zhu, Appl. Catal., B, 2015, 164, 77–81 CrossRef CAS.
- T. Xiong, F. Dong, W. Cen and Y. Zhang, ACS Catal., 2016, 6, 2462–2472 CrossRef CAS.
- Y. Wang, S. Zhao, Y. Zhang, J. Fang, Y. Zhou, S. Yuan, C. Zhang and W. Chen, Appl. Surf. Sci., 2018, 440, 258–265 CrossRef CAS.
- Y. Li, H. Xu, S. Ouyang, D. Lu, X. Wang, D. Wang and J. Ye, J. Mater. Chem. A, 2016, 4, 2943–2950 RSC.
- Y. Xu, Y. Gong, H. Ren, W. Liu, L. Niu, C. Li and X. Liu, RSC Adv., 2017, 7, 32592–32600 RSC.
- Z. Chen, A. Savateev, S. Pronkin, V. Papaefthimiou, C. Wolff, M. G. Willinger, E. Willinger, D. Neher, M. Antonietti and D. Dontsova, Adv. Mater., 2017, 29, 1700555 CrossRef PubMed.
- Y. Guo, T. Chen, Q. Liu, Z. Zhang and X. Fang, J. Phys. Chem. C, 2016, 120, 25328–25337 CrossRef CAS.
- S. Hu, A. Yu and R. Lu, RSC Adv., 2021, 11, 15701–15709 RSC.
- J. Yuan, Y. Tang, X. Yi, C. Liu, C. Li, Y. Zeng and S. Luo, Appl. Catal., B, 2019, 251, 206–212 CrossRef CAS.
- J. Yuan, X. Liu, Y. Tang, Y. Zeng, L. Wang, S. Zhang, T. Cai, Y. Liu, S. Luo, Y. Pei and C. Liu, Appl. Catal., B, 2018, 237, 24–31 CrossRef CAS.
- G. Zhang, Y. Xu, D. Yan, C. He, Y. Li, X. Ren, P. Zhang and H. Mi, ACS Catal., 2021, 11, 6995–7005 CrossRef CAS.
- Y. Xu, C. Qiu, X. Fan, Y. Xiao, G. Zhang, K. Yu, H. Ju, X. Ling, Y. Zhu and C. Su, Appl. Catal., B, 2020, 268, 118457 CrossRef CAS.
- M. Wu, J. M. Yan, X. N. Tang, M. Zhao and Q. Jiang, ChemSusChem, 2014, 7, 2654–2658 CrossRef CAS PubMed.
- W. Xu, X. Zhao, X. An, S. Wang, J. Zhang, Z. Li, W. Wu and M. Wu, ACS Appl. Mater. Interfaces, 2020, 12, 48526–48532 CrossRef CAS PubMed.
- L. Lin, W. Ren, C. Wang, A. M. Asiri, J. Zhang and X. Wang, Appl. Catal., B, 2018, 231, 234–241 CrossRef CAS.
- Z. Cen, Y. Kang, R. Lu and A. Yu, RSC Adv., 2021, 11, 22652–22660 RSC.
- I. Papailias, T. Giannakopoulou, N. Todorova, D. Demotikali, T. Vaimakis and C. Trapalis, Appl. Surf. Sci., 2015, 358, 278–286 CrossRef CAS.
- A. Thomas, A. Fischer, F. Goettmann, M. Antonietti, J. O. Muller, R. Schlogl and J. M. Carlsson, J. Mater. Chem., 2008, 18, 4893–4908 RSC.
- P. Jimenez-Calvo, C. Marchal, T. Cottineau, V. Caps and V. Keller, J. Mater. Chem. A, 2019, 7, 14849–18863 RSC.
- G. Zhang, L. Lin, G. Li, Y. Zhang, A. Savateev, S. Zafeiratos, X. Wang and M. Antonietti, Angew. Chem., Int. Ed., 2018, 57, 9372–9376 CrossRef CAS PubMed.
- F. Yang, D. Liu, Y. Li, L. Cheng and J. Ye, Appl. Catal., B, 2019, 240, 64–71 CrossRef CAS.
- H. Zhang, S. Li, R. Lu and A. Yu, ACS Appl. Mater. Interfaces, 2015, 7, 21868–21874 CrossRef CAS PubMed.
- W. Wang, P. Xu, M. Chen, G. Zeng, C. Zhang, C. Zhou, Y. Yang, D. Huang, C. Lai, M. Cheng, L. Hu, W. Xiong, H. Guo and M. Zhou, ACS Sustainable Chem. Eng., 2018, 6, 15503–15516 CrossRef CAS.
- H. Zhang and A. Yu, J. Phys. Chem. C, 2014, 118, 11628–11635 CrossRef CAS.
- V. W. Lau, I. Moudrakovski, T. Botari, S. Weinberger, M. B. Mesch, V. Duppel, J. Senker, V. Blum and B. V. Lotsch, Nat. Commun., 2016, 7, 12165 CrossRef CAS PubMed.
- W. Yang, R. Godin, H. Kasap, B. Moss, Y. F. Dong, S. A. J. Hillman, L. Steier, E. Reisner and J. R. Durrant, J. Am. Chem. Soc., 2019, 141, 11219–11229 CrossRef CAS PubMed.
- M. Fronczak, M. Krajewska, K. Demby and M. Bystrzejewski, J. Phys. Chem. C, 2017, 121, 15756–15766 CrossRef CAS.
Footnote |
| † Electronic supplementary information (ESI) available. See DOI: https://doi.org/10.1039/d3ra00934c |
| This journal is © The Royal Society of Chemistry 2023 |

