DOI:
10.1039/D3RA00847A
(Paper)
RSC Adv., 2023,
13, 15575-15585
Tailoring the interfacial surfaces of tungsten and molybdenum tungsten disulfide electrodes for hybrid supercapacitors
Received
8th February 2023
, Accepted 28th April 2023
First published on 23rd May 2023
Abstract
The layered structures of tungsten disulfide (WS2) and molybdenum tungsten disulfide (MoWS2) are considered as the most promising electrode materials for energy storage devices. Herein, MS (magnetron sputtering) is required for the deposition of WS2 and MoWS2 on the surface of the current collector to attain an optimized layer thickness. The structural morphology and topological behavior of the sputtered material were examined via X-ray diffraction and atomic force microscopy. Three-electrode assembly was used to start the electrochemical investigations to identify the most optimal and effective sample among WS2 and MoWS2. CV (cyclic voltammetry), GCD (galvanostatic charging discharging), and EIS (electro-impedance spectroscopy) techniques were employed to analyze the samples. After preparing WS2 with optimized thickness as the superior performing sample, a hybrid device was designed as WS2//AC (activated carbon). With a remarkable cyclic stability of 97% after 3000 continuous cycles, the hybrid supercapacitor generated a maximum energy density (Es) value of 42.5 W h kg−1 and 4250 W kg−1 of power density (Ps). Besides, the capacitive and diffusive contribution during the charge–discharge process and b-values were calculated by Dunn's model, which lay in the 0.5–1.0 range and the fabricated WS2 hybrid device was found to have a hybrid nature. The outstanding outcomes of WS2//AC make it suitable for future energy storage applications.
1. Introduction
The energy demand and supply has exploded exponentially during the last decade and now it is time to abandon fossil fuels. Renewable energy is going to be the major energy resource of the future; however, only its extraction would not suffice as there is a dire need for advance storage technologies for energy storage.1,2 The two most important energy storage technologies now meeting the energy demands of the modern world are batteries and supercapacitors, but each come with its own merits and demerits. Battery storage technology is controlled by faradaic redox reactions occurring at the battery electrodes by means of which high energy density can be delivered.3 Batteries, despite their promising features, face dendrite formation upon high power extraction as well as sluggish charge kinetics, which largely inhibit its high-power utilization.4 In contrast, supercapacitors (SCs) of two types, i.e., electric double layer capacitors (EDLCs) and pseudocapacitors retain the charges at the targeted electrode via electrostatic forces, which can be rapidly released when desired, thus catering to high power applications.5 Although SCs are an integral component of numerous electronic devices but lack high specific energy, which is a crucial factor for an energy storage device.6 Henceforth, the concept of merging the merits of both batteries and SCs can be realized employing both battery and capacitive grade electrodes into an individual device named as “supercapattery” or “hybrid supercapacitors”.7
A hybrid device utilizes battery grade material for its anode and carbonaceous materials (graphene, CNTs, AC, etc.) as the negative terminal. The efficiency of electrochemical energy storage system is highly reliant on the electrode material utilized.8 Thus, those materials with high porosity, large surface area, numerous redox active sites, and stable crystal structure are preferred.9 Many materials are thoroughly investigated as electrode materials for hybrid supercapacitor applications including oxides, phosphides, phosphates, sulfides, and conducting polymers.10–14 However, the low conductivity and stability of oxides, phosphates, and phosphides inhibit its practical implementations.15 In contrast, transition metal sulfides (TMS) are an interesting contender material for energy storage applications as they have unique electrochemical features. They have better charge storage capability and provide more redox active sites, thus leading to superior electrochemical performance.16 TMS also has an enhanced electrical conductivity relative to oxides and are less electronegative, thus bringing flexibility to their use in various applications. Nandhini et al. synthesized NiS nanoparticles via hydrothermal approach for supercapacitor applications.17 NiS possess a specific capacitance (Cs) of 964 F g−1 at a current density of 1 A g−1. Multidimensional CoS/NiO architectures were utilized by Yang and coworkers as supercapacitor electrode materials. CoS/NiO provided a Cs of 1620 F g−1 at 1.0 A g−1 current density with a long-life cyclic stability.18 Heydari et al. synthesized CuS nanohollow spheres for application in supercapacitors.19 The synthesized material presented a maximum Cs of 948 F g−1 at 1 A g−1 current density. Transition metal dichalcogenides have also grabbed a significant position in the development of advanced energy storage devices due their layered 2D structure. Chen et al. reports graphene coupled with WS2 for supercapacitor applications. The prepared sample displayed a maximum Cs of 383.6 F g−1.20 Mohan et al. synthesized WS2 nanoflowers, whose fabricated symmetric supercapacitor delivers a Cs of 119 F g−1 at 1 A g−1.21 The stated literature highlights the importance of investigating sulfides for hybrid supercapacitor devices.
Herein, we analyzed the electrochemical response of tungsten di-sulfide (WS2) and molybdenum-tungsten di-sulfide (MoWS2) magnetron sputtered on nickel foam with distinct film thickness. 2D transition metal chalcogenides are fascinating materials in terms of their layered structure and electrochemical properties and hence structurally and electrochemically elucidated in this current work. All the prepared samples are first tested in the three-electrode cell setup and then the most optimized performing sample is combined with activated carbon (AC) to assemble a hybrid supercapacitor device, which showed decent energy and power densities. The theoretical approach is also applied to acquire an understanding into the charge storage mechanism of the fabricated device.
2. Experimental section
2.1. Deposition technique for WS2 and MoWS2
Numerous deposition methods can be used to produce WS2 and MoWS2 thin films. Through radio frequency sputtering (RFMS), we were able to create WS2 and MoWS2 thin films in this case. On NF substrate and glass slides, both MoWS2 and WS2 were sputtered using an Ollital multitarget RF-DC (sputtering apparatus) and using WS2 and MoWS2 targets procured from Stanford Advanced Materials. Quartz crystal was used to detect an in situ layer thickness by maintaining a substrate to a target distance of 60 mm. Also, the predeposition precautions were taken care of by maintaining a constant flow rate (50 SCCM) of Argon gas in the chamber along with plasma cleaning and presputtering of targets prior to deposition to eradicate any impurity present. For WS2 and MoWS2, separate samples totaling four were created. WS2 samples were designated as W1, W2, W3, and W4 for film thicknesses of 150, 250, 350, and 550 nm, respectively. MoWS2 was designated as M1, M2, M3, and M4 with film thicknesses of 217, 467, 733, and 1026 nm ± 4 nm, individually.
3. Results and discussion
3.1. Structural, microscopic, morphological, and surface analysis
The X-ray diffraction patterns of WS2 and MoWS2 are depicted in Fig. 1(a) and 2(a). The WS2 X-ray diffraction pattern has significant high intensity diffraction peaks at 2θ of 28.92° (004), 39.32° (103), 43.48° (006), 49.16° (105), and 58.92° (008), respectively. These peaks are typical of tungsten disulfide, a substance having two unique structural phases, hexagonal and rhombohedral, which are completely consistent with one another and the ICDD database (PDF # 00-08-0237). In MoWS2-amalgamated thin films, the higher significant peaks at 2θ values of 39.8° and 56.02° along with the planes (103) and (106), respectively, are linked with the MoWS2 cubic structure ICDD database (PDF # 002-0132). Fig. 1(b) and 2(b) depict the Raman spectra of WS2 and MoWS2, respectively. The Raman spectrum of WS2 features a second-order peak (2LA(M)) near the M-point of the Brillouin zone center, and both the material samples have first-order in-plane (E12g) and out-of-plane (A1g) optical peaks.22 As shown in Fig. 1(c) and 2(c), SEM was adopted for analyzing the surface morphology of WS2 and MoWS2 layered over nickel foam (b). The SEM results at high-level magnification provides a clear explanation of the porous structure of substrate, which is completely coated in the sputtered material. In addition, EDX (energy dispersive X-ray spectroscopy) was carried out to perform an elemental assessment to determine the components of sputtered WS2 and MoWS2 on the substrate. The humps/peaks were checked for S, Mo, and W, which unquestionably proves that WS2 and MoWS2 exists on Ni-foam, as expressed in Fig. 1(d) and 2(d). Fig. 3(a)–(h) indicates the three-dimensional topology of the films described on the surface of glass slide, as measured by AFM for all the required samples.
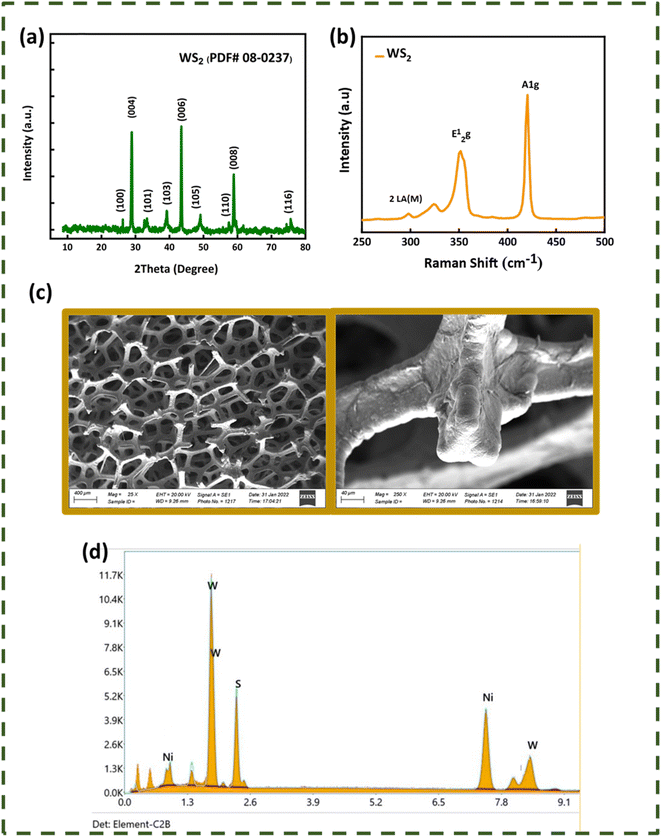 |
| | Fig. 1 (a) X-ray diffraction patterns of WS2. (b) Raman spectrum of WS2. (c) Scanning electron microscopy of magnetron-sputtered WS2 on nickel foam. (d) EDX spectrum of WS2. | |
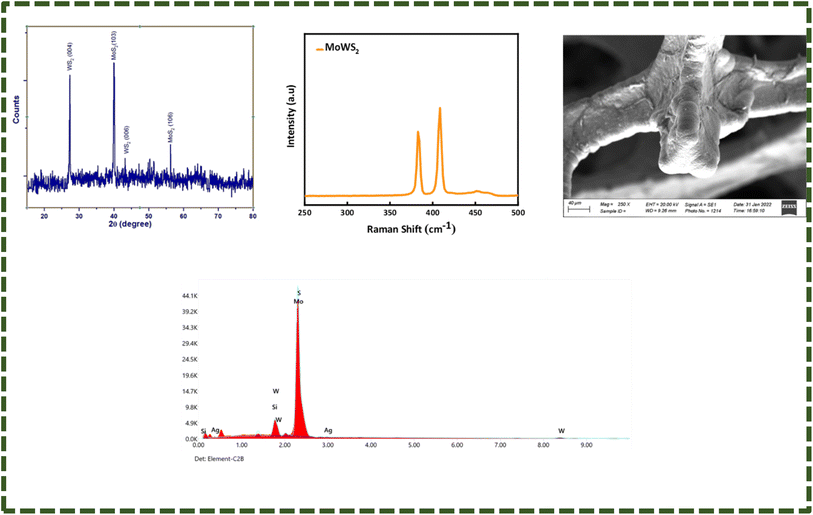 |
| | Fig. 2 (a) XRD patterns of MoWS2. (b) Raman spectrum of MoWS2. (c) SEM of magnetron-sputtered MoWS2 on nickel foam, (d) EDX spectrum of MoWS2. | |
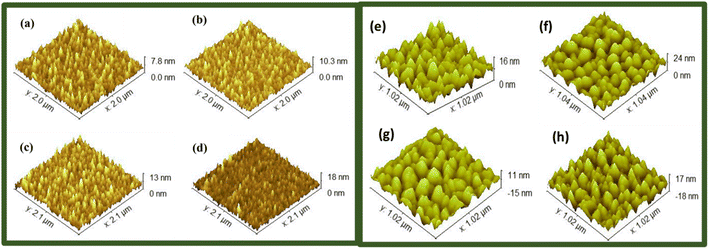 |
| | Fig. 3 AFM image of (a) W1, (b) W2, (c) W3, (d) W4, (e) M1, (f) M2, (g) M3, and (h) M4. | |
3.2. Three-electrode electrochemical analysis
3.2.1. Cyclic voltammetry (CV). To start with the electrochemical analysis, three-electrode cell setup was assembled and cyclic voltammetry of the WS2 and MoS2 samples was performed in 1 M KOH electrolytic medium with Hg/HgO and platinum wire as the reference and counter electrodes, respectively. The CV of the WS2 samples in Fig. 4(a)–(d) and MoWS2 samples in Fig. 6(a)–(d) were noted at different scanning rates (3–50 mV s−1) with 0–0.7 V scanning potential window. From the voltammograms of all the samples, it is clear that the samples possess battery grade nature as redox peaks are present at certain voltage values. The redox peaks indicate the existence of faradaic reactions, which in forward scan denotes oxidation reaction and in the negative scan shows reduction reactions.23 The design of CV curves of all the samples is a mixture of EDLC and faradaic behavior, due to which the material has higher stability over increasing scan rates and has symmetric curves. An elevation in the peak currents can be observed at higher scan rates along with peak broadening, which means that the capacitive role is influential at higher scan rate values. This phenomenon is regarded to the availability of limited time for the ions to intercalate into the electrode; rather, they are adsorbed on the surface. For all the samples, a shift in the peaks toward higher potentials can also be observed, which is a characteristic of the battery-grade nature material. At the electrodes, the redox reactions may follow the following equations.| | |
WS2 + OH− → WS2OH + e−
| (1) |
| | |
MoS2 + OH− → MoS2OH + e−
| (2) |
In case of WS2, W2 has the largest peak currents and has larger area under the curve, which means that it has the highest specific capacity (Qs) (Fig. 5(a)). Among different samples of MoWS2, M3 covers the largest area under the curve, making it superior among others in term of charge storage, as can be seen in Fig. 7(a). Qs can be calculated from the cyclic voltammograms using eqn (3) (ref. 24)| |
 | (3) |
where ‘ ’ is the area included under the CV curve, ‘’ is the synthesized materials' mass, and ‘v’ is the scan rate. The specific capacities achieved from the cyclic curves at the scan rate of 3 mV s−1 were 427, 479, 326, and 320 C g−1 for the W1, W2, W2, and W4 samples, respectively. For the samples M1, M2, M3, and M4, the calculated Qs were 230, 324, 361, and 192 C g−1, respectively. The specific capacities highlight that sample W2 is the best performing sample among all the tested samples, as judged from the CV results. The overall best performance of W2 may be attributed to battery-dominant materials, such as WS2, the electrolyte ions intercalate inside the surface of electrode material to ample the redox reaction. Thus, here, W2 has enough active sights to store the electrolyte ions, which eventually enhanced its electrochemical performance. By increasing the thickness, the compact layer of WS2 is formed, which blocks the path of ions to intercalate inside the surface of electrode material, which may affect the energy storage performance of WS2.
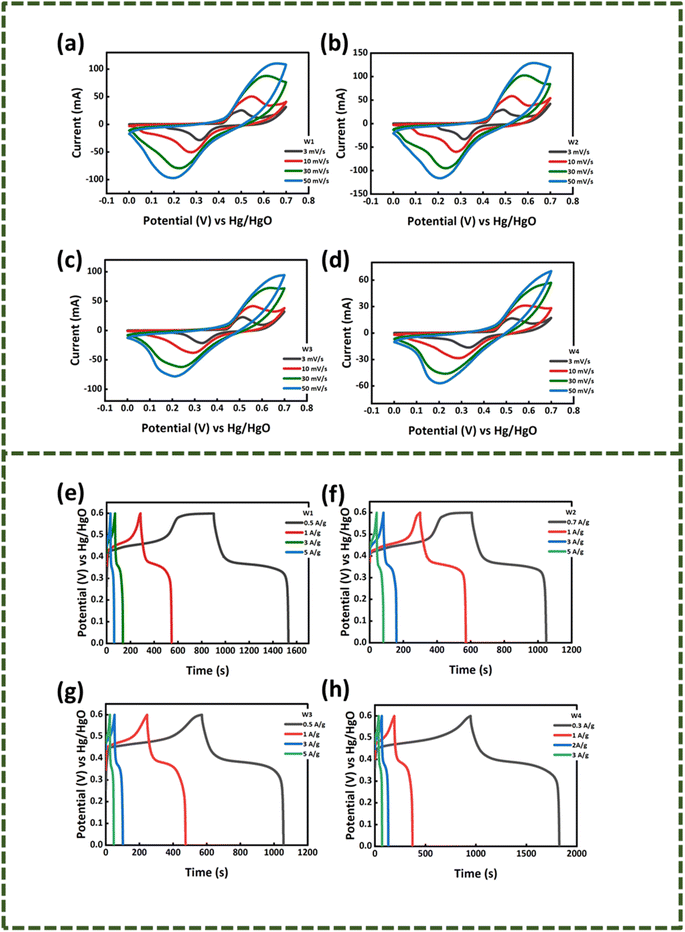 |
| | Fig. 4 Cyclic voltammograms of (a) W1, (b) W2, (c) W3, (d) W4. Galvanostatic curves of (e) W1, (f) W2, (g) W3, (h) W4. | |
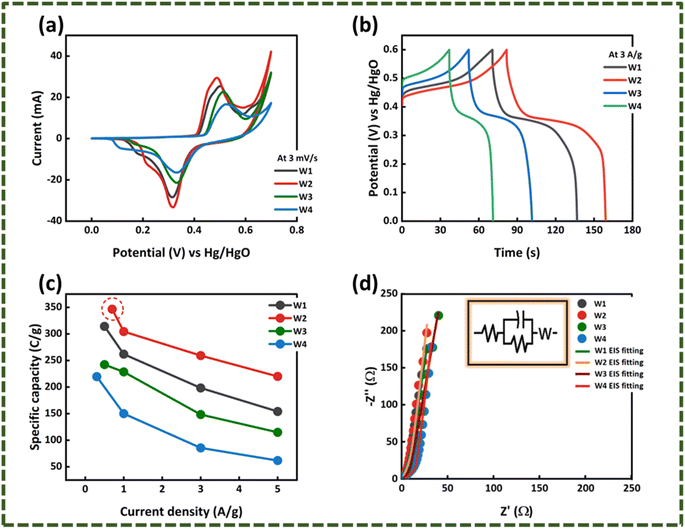 |
| | Fig. 5 Comparison of (a) cyclic voltammetry curves of the WS2 samples. (b) GCD curves of WS2 samples. (c) Specific capacities of WS2 samples. (d) EIS spectrum of WS2 samples with equivalent circuit fitting. | |
3.2.2. Galvanostatic charging discharging (GCD). After obtaining an understanding about the kinetics of the as-synthesized samples, the GCD tests were initiated in the potential window of 0–0.6 V at different current densities. The potential window was set by keeping in view the CV results as the maximum oxidation occurred in the 0.6 V region. The GCD results of WS2 are presented in Fig. 4(e)–(h) and that of MoS2 are expressed in Fig. 6(e)–(h). The galvanostatic charging/discharging curves of all the samples are in complete accordance with cyclic voltammetry results as a hump is clearly observed in the charging-discharging curves, which shows the continuation of redox reactions. The specific capacity of sample W1–W4 and M1–M4 were calculated using eqn (4) (ref. 24)| |
 | (4) |
where ‘I/m’ is the current density and the discharging time is specified by ‘Δt’. The maximum specific capacities calculated for the samples from the GCD results were 314, 346, 242, and 219 C g−1 for W1, W2, W3, and W4, respectively. For M1, M2, M3, and M4, the maximum specific capacities calculated were 235, 252, 304, and 144.8 C g−1, respectively. The GCD results also support the CV outcomes and shows that the same W2 is the best performing sample among all other samples, as presented in Fig. 5(c) and 7(b).
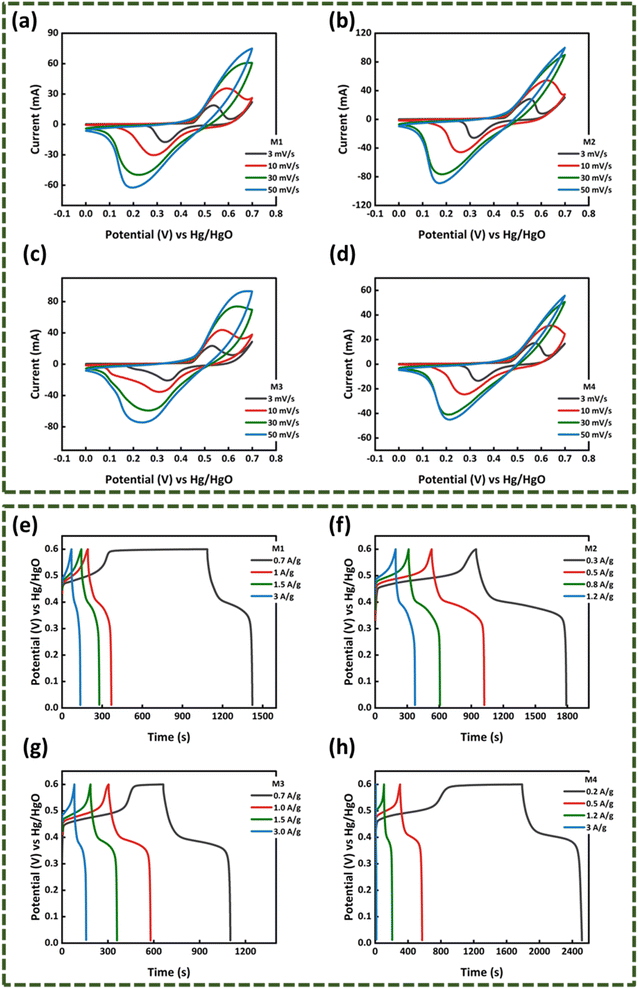 |
| | Fig. 6 Cyclic voltammograms of (a) M1, (b) M2, (c) M3, (d) M4. Galvanostatic curves of (e) M1, (f) M2, (g) M3, (h) M4. | |
 |
| | Fig. 7 Comparison of (a) the cyclic voltammetry curves of the MoWS2 samples. (b) Specific capacities of MoWS2 samples. (c) EIS spectrum of WS2 samples with equivalent circuit fitting. | |
3.2.3. Electron-impedance spectroscopy (EIS). Electronic conductivity is one of the prime factors that influences the electrochemical properties of a material. To get an idea about the overall conductivity of WS2 and MoS2 samples, electrochemical impedance spectroscopy analysis was conducted in the range of 0.1 Hz–100 kHz. The EIS spectra of WS2 are presented in Fig. 5(d). In the elevated frequency region, the semicircle in the EIS spectrum denotes the Rct (charge transfer resistance), which is the resistance faced by ions at the electrode/electrolyte interface. In case of the WS2 samples, negligible Rct can be observed. The resistance offered to the ions, while its diffusion through the electrolyte and its interaction with the electrode is described through ESR (equivalent series resistance). The intersection of EIS spectrum with x-axis can provide the ESR value. The ESR calculated for W1, W2, W3, and W4 was 1.17, 0.88, 14.5, and 1.65 Ω, respectively. Similarly, looking at the EIS spectrum of the MoWS2 sample in Fig. 7(c), it can be noticed that the samples have negligible Rct. The ESR was 1.97, 2.20, 0.74, and 1.98 Ω for M1, M2, M3, and M4, respectively. The ESR also confirmed that W2 has convincing outcomes and is most favorable to be integrated in a hybrid supercapacitor assembly.The overall best performance of WS2 may be attributed to battery-dominant materials such as WS2; the electrolyte ions intercalate inside the surface of electrode material to complete the redox reaction. Here, WS2 may have enough active sites to store the electrolyte ions, which eventually enhanced its electrochemical performance. By increasing the thickness, the compact layer of WS2 is formed, which blocks the path of ions to intercalate inside the surface of electrode material, thus affecting the energy storage performance of WS2.
3.3. Real device fabrication
To realize the functional implication of WS2 as a high-performance active electrode, a hybrid supercapacitive device was engineered by amalgamating activated carbon and WS2 (sample W2) as the negative and positive electrode (WS2//AC), respectively. The fabricated device was scrutinized for its electrochemical properties in 1 M KOH. To obtain maximum results from any hybrid device, charge balancing must be done, which was done in this current work using eqn (5).25| |
 | (5) |
where, m+ and m− are the active material's mass on the anode and cathode, respectively, Qs determines the specific capacity, ΔV is the operating voltage, and Cs is the specific capacitance.
Fig. 8(a) compares the voltammograms of both AC carbon and WS2 in a three-electrode assembly. The working potential window of AC was in the range of 0 V to −1 V and that of WS2 was in the range of 0–0.7 V. With that in view, the optimum potential window for the CV analysis of the fabricated device was set to 0 V–1.7 V. The cyclic voltammograms of the WS2//AC device are displayed in Fig. 8(b), which shows that the device has symmetric peaks with the simultaneous behavior of both EDLC and battery. The symmetric curves of WS2 are an indication that it possesses great rate capability and stability even at higher scan rates. The GCD patterns of the fabricated device are shown in Fig. 8(c). The curves represent the attributes of a hybrid device and were recorded at various current (0.9–5.0 A g−1) densities between 0 V and −1.7 V. The highest discharging rate was obtained at 0.9 A g−1. The Qs calculated for WS2//AC at 0.9 A g−1 was 180 C g−1. Fig. 8(d) depicts the Qs of the device extracted from the CV and GCD curves. The stability of any energy storage is an important analysis that determines whether the device can be implemented for practical purposes. In this regard, a stability test was run for 3000 GCD cycles, which showed that the fabricated device has an exceptional cyclic stability with a capacity retention of 97% (Fig. 8(f)). The energy density (Es) and specific power (Ps) for WS2//AC were calculated using eqn (6) and eqn (7), respectively.26
| |
 | (6) |
| |
 | (7) |
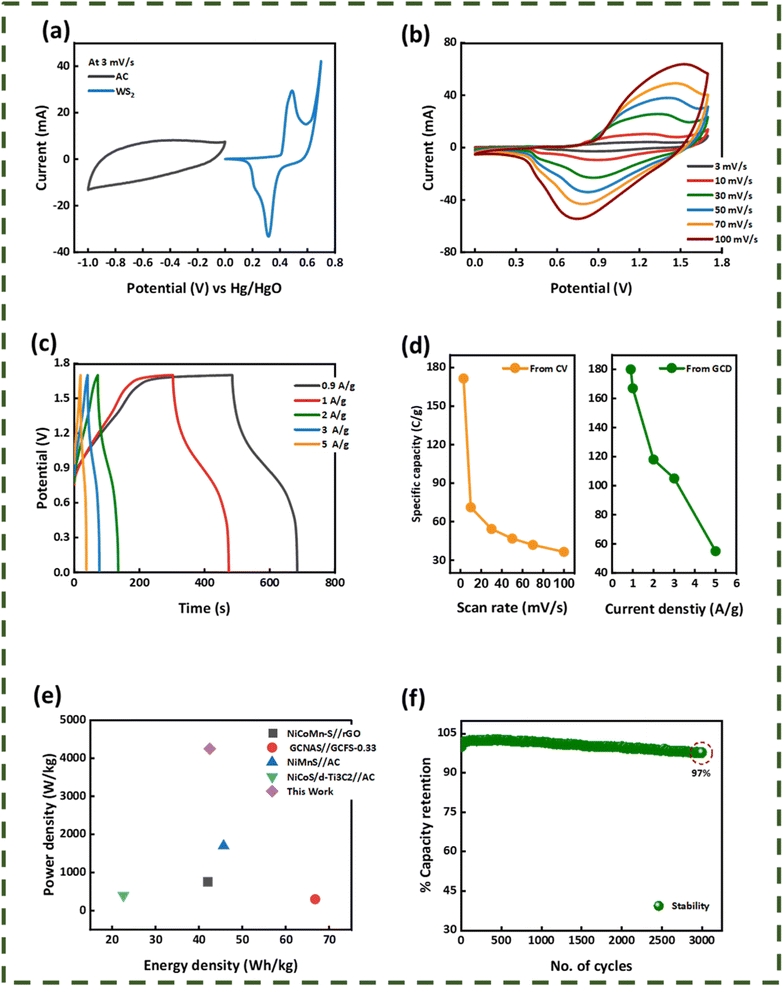 |
| | Fig. 8 (a) Comparative CV of activated carbon and WS2(W2) at 3 mV s−1. (b) CV of the WS2//AC hybrid device. (c) GCD plot of the WS2//AC hybrid device at various current densities. (d) Specific capacities calculated from CV and GCD for the hybrid device. (e) Energy and power density plot of WS2//AC. (d) Stability test of the hybrid supercapacitor. | |
The hybrid device showcased a maximum energy density and Ps of values 42.5 W h kg−1 and 4250 W kg−1, respectively (Fig. 8(e)). Electro-impedance spectroscopy was also done for the hybrid device before and after the stability test. It is visible from Fig. 9(a) that the ESR reduced after the performing stability test indicates the greater conductivity of the hybrid device.
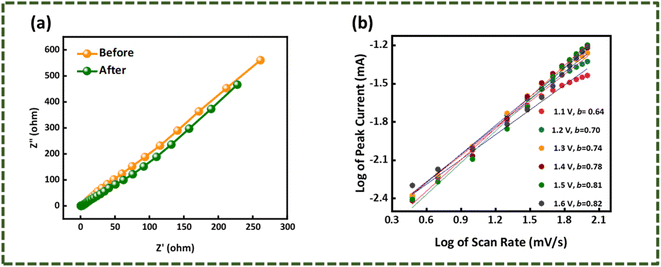 |
| | Fig. 9 (a) EIS spectrum before and after the stability test of WS2//AC. (b) b-values calculated for the hybrid device. | |
Apart from experimental analysis, theoretical models were implied to simulate theoretical data that provided evidence that WS2//AC has hybrid features. The power law, as mentioned in eqn (8), was used to derive the b-values for the asymmetric device.27
Where ‘
i’ represents the current, ‘
v’ is the scan rate, and ‘
a’ and ‘
b’ variable parameters. It is well known that if the
b-value of a device is ∼0.5, it bears battery-grade nature, whereas if it is ∼1.0, then the capacitive nature is dominant. In the case of WS
2//AC, the
b-values calculated were ∼0.6–0.8, as can be seen in
Fig. 9(b). The capacitive and diffusion contribution during the charging/discharging of the hybrid device is presented in
Fig. 10(a)–(c) at 3 mV s
−1, 50 mV s
−1, and 100 mV s
−1, with
Fig. 10(d) showing the percentage current contribution at distinct scan rates. These data were extracted using Dunn's model (
eqn (9)).
28 It is obvious from the results that WS
2//AC has characteristics of a hybrid device.
| |
 | (9) |
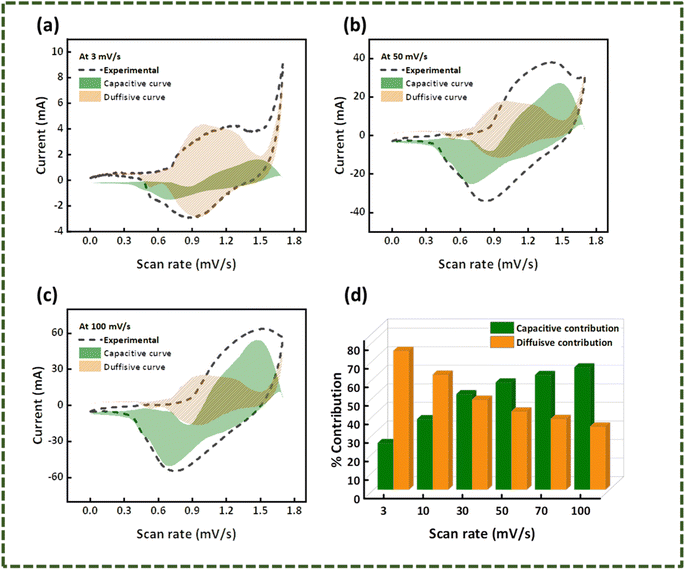 |
| | Fig. 10 Capacitive-diffusive contribution elucidated using Dunn's model at (a) 3 mV s−1, (b) 50 mV s−1, (c) 100 mV s−1, (d) percentage capacitive-diffusive contribution at different scan rates (3–100 mV s−1). | |
The decent electrochemical outcomes of WS2 in both the three-electrode system and hybrid device puts it in great position to be further investigated for potential applications, especially for energy storage.
Conclusion
The electrochemical performance of binder-free WS2 and MoWS2 electrodes is studied in this analysis. WS2 and MoWS2 were magnetron-sputtered on nickel foam with different thicknesses to achieve the optimized layer. Both the materials were structurally and morphologically characterized via XRD, which revealed that WS2 has two distinct structural phases, hexagonal and rhombohedral. MoWS2 has a cubic structure, as is evident from the XRD pattern. The SEM images show that the sputtered material entirely covered the nickel foam. Raman and AFM studies were also performed to get insights into the structural properties of both the materials. Electrochemical tests were initiated in the three-electrode assembly through CV, GCD, and EIS. Both WS2 and MoWS2 were identified as W2 (WS2 sample) and performed better relative to all other samples by delivering the highest specific capacity of 479 C g−1. The manufactured device assembled as W2//AC was fabricated, as characterized through electrochemical analysis. The hybrid device showed a specific capacity of 180 C g−1 at a current density of 0.9 A g−1. Also, the device displayed a long-life cyclic stability by retaining 97% of its primary charge after 3000 charging-discharging cycles. The maximum Es and Ps displayed by the hybrid device was 42.5 W h kg−1 and 4250 W kg−1, respectively. In addition, the b-values and capacitive-diffusive contributions were elucidated using Dunn's model, which affirmed that WS2//AC bears hybrid characteristics. The superior performance of binder-free transition-metal sulfide electrodes makes them highly desirable for future energy storage applications.
Conflicts of interest
The authors declare that they have no known competing financial interests or personal relationships that could have appeared to influence the work reported in this paper.
Acknowledgements
This work was funded by the Deanship of Scientific Research at Jouf University under grant No (DSR2022-RG-0128).
References
- W. Liu, M.-S. Song, B. Kong and Y. Cui, Adv. Mater., 2017, 29, 1603436 CrossRef PubMed.
- P. Du, Y. Dong, C. Liu, W. Wei, D. Liu and P. Liu, J. Colloid Interface Sci., 2018, 518, 57–68 CrossRef CAS PubMed.
- M. Z. Iqbal, S. R. Ali, M. M. Faisal, S. Siddique, S. Aftab and M. Alzaid, Mater. Chem. Phys., 2022, 291, 126638 CrossRef.
- A. Zhamu, G. Chen, C. Liu, D. Neff, Q. Fang, Z. Yu, W. Xiong, Y. Wang, X. Wang and B. Z. Jang, Energy Environ. Sci., 2012, 5, 5701–5707 RSC.
- Q. Guo, X. Zhao, Z. Li, B. Wang, D. Wang and G. Nie, ACS Appl. Energy Mater., 2020, 3, 2727–2736 CrossRef CAS.
- K. Le, M. Gao, W. Liu, J. Liu, Z. Wang, F. Wang, V. Murugadoss, S. Wu, T. Ding and Z. Guo, Electrochim. Acta, 2019, 323, 134826 CrossRef CAS.
- M. Z. Iqbal, U. Aziz, M. W. Khan, S. Siddique, M. Alzaid and S. Aftab, J. Electroanal. Chem., 2022, 924, 116868 CrossRef CAS.
- Q. Zhou, Y. Gong and K. Tao, Electrochim. Acta, 2019, 320, 134582 CrossRef CAS.
- Q. Lu, J. G. Chen and J. Q. Xiao, Angew. Chem., Int. Ed., 2013, 52, 1882–1889 CrossRef CAS PubMed.
- D. Wang, Y. Wang, Z. Fu, Y. Xu, L.-X. Yang, F. Wang, X. Guo, W. Sun and Z.-L. Yang, ACS Appl. Mater. Interfaces, 2021, 13, 34507–34517 CrossRef CAS PubMed.
- M. Z. Iqbal and J. Khan, Electrochim. Acta, 2021, 368, 137519 CrossRef.
- Z. Xu, Z. Zhang, H. Yin, S. Hou, H. Lin, J. Zhou and S. Zhuo, RSC Adv., 2020, 10, 3122–3129 RSC.
- N. Gupta, R. K. Sahu, T. Mishra and P. Bhattacharya, J. Mater. Chem. A, 2022, 10, 15794–15810 RSC.
- A. Agarwal and B. R. Sankapal, J. Mater. Chem. A, 2021, 9, 20241–20276 RSC.
- Y. Sun, T. Zhang, C. Li, K. Xu and Y. Li, J. Mater. Chem. A, 2020, 8, 13415–13436 RSC.
- M. Z. Iqbal, U. Abbasi and S. Alam, Int. J. Energy Res., 2022, 46, 3906–3938 CrossRef CAS.
- S. Nandhini, A. Juliet Christina Mary and G. Muralidharan, Appl. Surf. Sci., 2018, 449, 485–491 CrossRef CAS.
- Y. Yang, S. Li, F. Liu, J. Wen, N. Zhang, S. Wang and K. Liu, Nanotechnology, 2018, 29, 455401 CrossRef PubMed.
- H. Heydari, S. E. Moosavifard, S. Elyasi and M. Shahraki, Appl. Surf. Sci., 2017, 394, 425–430 CrossRef CAS.
- W. Chen, X. Yu, Z. Zhao, S. Ji and L. Feng, Electrochim. Acta, 2019, 298, 313–320 CrossRef CAS.
- V. V. Mohan, M. Manuraj, P. M. Anjana and R. B. Rakhi, Energy Techol., 2022, 10, 2100976 CrossRef CAS.
- M. Z. Iqbal, S. Siddique and Z. Abideen, Carbon, 2017, 123, 168–173 CrossRef CAS.
- Y. Luo, K. Gu, T. Yang and M. Zhang, J. Energy Storage, 2019, 21, 362–369 CrossRef.
- M. Z. Iqbal, M. W. Khan, M. Shaheen, S. Siddique, S. Aftab, M. Alzaid and M. J. Iqbal, J. Energy Storage, 2022, 55, 105418 CrossRef.
- D. M. Sayed, M. M. Taha, L. G. Ghanem, M. S. El-Deab and N. K. Allam, J. Power Sources, 2020, 480, 229152 CrossRef CAS.
- S. Dai, B. Zhao, C. Qu, D. Chen, D. Dang, B. Song, B. M. deGlee, J. Fu, C. Hu, C.-P. Wong and M. Liu, Nano Energy, 2017, 33, 522–531 CrossRef CAS.
- L. Fan, K. Lin, J. Wang, R. Ma and B. Lu, Adv. Mater., 2018, 30, 1800804 CrossRef PubMed.
- J. Wang, J. Polleux, J. Lim and B. Dunn, J. Phys. Chem. C, 2007, 111, 14925–14931 CrossRef CAS.
|
| This journal is © The Royal Society of Chemistry 2023 |
Click here to see how this site uses Cookies. View our privacy policy here.  Open Access Article
 *bc,
Bandar Alqahtania,
Rakan Alanazia,
Ibrahim Hotan Alsohaimid,
W. S. Mohameda and
N. M. A. Hadiaa


 ’ is the area included under the CV curve, ‘’ is the synthesized materials' mass, and ‘v’ is the scan rate. The specific capacities achieved from the cyclic curves at the scan rate of 3 mV s−1 were 427, 479, 326, and 320 C g−1 for the W1, W2, W2, and W4 samples, respectively. For the samples M1, M2, M3, and M4, the calculated Qs were 230, 324, 361, and 192 C g−1, respectively. The specific capacities highlight that sample W2 is the best performing sample among all the tested samples, as judged from the CV results. The overall best performance of W2 may be attributed to battery-dominant materials, such as WS2, the electrolyte ions intercalate inside the surface of electrode material to ample the redox reaction. Thus, here, W2 has enough active sights to store the electrolyte ions, which eventually enhanced its electrochemical performance. By increasing the thickness, the compact layer of WS2 is formed, which blocks the path of ions to intercalate inside the surface of electrode material, which may affect the energy storage performance of WS2.


