DOI:
10.1039/D3RA00750B
(Paper)
RSC Adv., 2023,
13, 10914-10922
Cocrystal of phloretin with isoniazid: preparation, characterization, and evaluation†
Received
4th February 2023
, Accepted 14th March 2023
First published on 6th April 2023
Abstract
Phloretin (Phl) is a natural flavonoid compound with wide range of biological activities but demonstrates poor water solubility and limited pharmacological effects. In this study, one cocrystal of phloretin–isoniazid (Phl–Inz) was prepared successfully using the solvent evaporation method. The physical properties of cocrystal were characterized by differential scanning calorimetry (DSC), thermogravimetric analysis (TG), powder X-ray diffraction (PXRD), Fourier-transform infrared (FT-IR) and single crystal X-ray diffraction (SCXRD). The Hirshfeld surface analysis explained further interactions in the cocrystal. The solubility test showed that the solubility of the cocrystal was increased at pH 1.2 and pH 6.8 compared to that of the pure drug. The test in vitro simulated gastrointestinal digestion showed that the release of phloretin in the cocrystal was better than that in the pure phloretin. The results of the DPPH and ABTS scavenging activity showed that the in vitro antioxidant activity of the cocrystal was improved. The anticancer assay exhibited improved cytotoxicity in the Phl–Inz cocrystal as compared with the pure Phl.
Introduction
Phloretin (Phl) is a kind of plant polyphenol formed by the skeleton structure of C6–C3–C6 (two aromatic rings connected by the C3 chain)1,2 (Fig. 1). Recent studies have shown that phloretin demonstrates various pharmacological effects, such as antioxidant activity,3 immunosuppression,4 and antimicrobial5 and anticancer6 activities. However, Phl belongs to the biopharmaceutics classification system (BCS) class II, which is characterized by low solubility and high permeability, and its low solubility limits the full play of its pharmacological effects.7–9
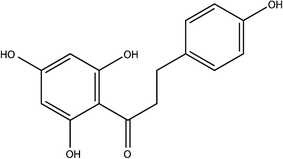 |
| | Fig. 1 Chemical structure of Phl. | |
In recent years, pharmaceutical cocrystal technology has become a research hotspot to improve solubility, dissolution, bioavailability, and other properties of drugs.10–13 This technology did not change the molecular structure of drugs but only changed the physical and chemical properties of drugs through intermolecular forces, providing a new way for the development of poorly water-soluble drugs.14,15 Pharmaceutical cocrystal refers to the crystal formed by two or more kinds of molecules bonded in the same lattice by non-covalent bonds based on a fixed stoichiometric ratio.16 The components of pharmaceutical cocrystals include one or more active pharmaceutical ingredients (APIs) and one or more cocrystal formers (CCFs).17 A cocrystal is a supramolecular complex formed by API and CCF. The intermolecular forces for cocrystals include hydrogen bonding, halogen bonding, van der Waals force and π – bonding, among which hydrogen bonding is the most important intermolecular force for cocrystal formation between API and CCF.18–20 These intermolecular forces reshape the structure of the cocrystal, which can change the dissolution behaviour of the cocrystal.
Therefore, pharmaceutical cocrystal was used to improve the solubility of Phl. According to the literature,7,21–24 the ratio of Phl and its similar structure to co-former is usually 1![[thin space (1/6-em)]](https://www.rsc.org/images/entities/char_2009.gif) :1 in cocrystal, which was chosen as the ratio of Phl and co-former in this experiment. Water-soluble isoniazid (Inz) was chosen as a co-former to prepare cocrystal with Phl and Phl–Inz cocrystal was successfully obtained by the solvent evaporation method. Phl and other co-formers were unsuccessfully synthesized into cocrystals or formed mixtures of cocrystal and API. The cocrystal's structure was determined by differential scanning calorimetry-thermogravimetry (DSC-TG), Fourier-transform infrared (FT-IR), nuclear magnetic resonance (1H NMR), powder X-ray diffraction (PXRD), and single-crystal X-ray diffraction (SCXRD). Compared with Phl, the release in gastrointestinal fluid, solubility and anticancer activities of Phl–Inz were improved.
:1 in cocrystal, which was chosen as the ratio of Phl and co-former in this experiment. Water-soluble isoniazid (Inz) was chosen as a co-former to prepare cocrystal with Phl and Phl–Inz cocrystal was successfully obtained by the solvent evaporation method. Phl and other co-formers were unsuccessfully synthesized into cocrystals or formed mixtures of cocrystal and API. The cocrystal's structure was determined by differential scanning calorimetry-thermogravimetry (DSC-TG), Fourier-transform infrared (FT-IR), nuclear magnetic resonance (1H NMR), powder X-ray diffraction (PXRD), and single-crystal X-ray diffraction (SCXRD). Compared with Phl, the release in gastrointestinal fluid, solubility and anticancer activities of Phl–Inz were improved.
Materials and methods
Materials
Phloretin (Phl, purity ≥ 98%), isoniazid (Inz, purity = 98%), 2-picolinic acid (99%), theophylline (99%), 4-aminobenzamide (98%), proline (99%), nicotinic acid (99%) and 4-picolinic acid (99%) were purchased from Shanghai Macklin Biochemical Co., Ltd (Shanghai, China). Phloretin (HPLC ≥ 98%) and maleic (99%) acid were purchased from Shanghai Yuanye Bio-Technology Co., Ltd. (Shanghai, China). 2,2′-Azino-bis(3-ethylbenzothiazoline-6-sulfonic acid) diammonium salt (ABTS) was purchased from Sigma Life Science (St. Louis, MO, USA). 1,1-Diphenyl-2-picrylhydrazyl (DPPH) was purchased from Shanghai Macklin Biochemical Co., Ltd. (Shanghai, China). Methanol was obtained from Guangzhou Reagent Co., Ltd. (Guangzhou, China). The A549 cell line and HepG2 cell line were purchased from the Institute of Biochemistry and Cell Biology Sciences, Chinese Academy of Sciences (Shanghai, China).
Powder X-ray diffraction (PXRD)
The generation of new crystalline phases leads to the disappearance of all or part of the characteristic peaks of API or CCF and the appearance of new peaks of cocrystal. The PXRD measurements of Phl, co-formers and cocrystals were tested using an X'pert multifunctional powder X-ray diffractometer (PANalytical, Holland) operated with Cu Kα radiation (λ = 1.540598 Å) at 30 mA and 40 kV. The XRD patterns of all samples were collected over an angle of 3–40° with a scan step size of 0.0131° per step and scan speed of 15° min−1 at 25–26 °C.
Preparation and screening of phloretin cocrystal
The binary cocrystal was formed with Phl and co-former, which were dissolved in methanol at a 1:1 mol ratio. The co-formers were chosen from isoniazid, 2-picolinic acid, theophylline, 4-aminobenzamide, proline, maleic acid, nicotinic acid and 4-picolinic acid. The two solutions were mixed and stirred in closing bottles of a parallel synthesizer and sonicated to complete dissolution. After stirring for 12 h at room temperature, the solution was transferred to a beaker and evaporated slowly. The crystals were obtained from the solution after 3–5 days and dried under vacuum at 45 °C for 8 h. The disappearance and appearance of diffraction peaks could determine whether the cocrystal was formed successfully. The samples were identified by PXRD to analyse the diffraction peak of mixtures for cocrystal screening.
Thermal test
The melting point and thermal behaviour of samples were tested by DSC/DTA-TG STA 449 F5 Jupiter® (NETZCH, Germany) instrument. Approximately 4–6 mg of samples (Phl, co-formers and cocrystals) were placed in an aluminum pan and analysed from 30 °C to 500 °C with a rate of 10 °C min−1. N2 was used as purge gas and protect gas.
Fourier-transform infrared (FT-IR)
FT-IR studies were conducted using a Fourier-Transform Infrared Spectrometer (PerkinElmer, United States). The tested samples were dried in a vacuum drying oven at 45 °C for 6 h before testing, and the data were collected over the range of 4000–400 cm−1 and processed by spectrum software (PerkinElmer).
Nuclear magnetic resonance analysis (1H NMR)
All 1H NMR spectra of the cocrystal were recorded using DMSO-d6 with TMS as an internal standard at room temperature on a 600 MHZ nuclear magnetic resonance spectrometer (Bruker, Germany). All spectra were processed on MestReNova.
Single crystal X-ray diffraction analysis (SCXRD)
The crystallographic data of the Phl–Inz cocrystal were collected using an Agilent SuperNova diffractometer with Cu Kα radiation (λ = 1.5418 Å) at 150 K. Data reduction and absorption correction were processed using the CrysAlisPro. The structure of the cocrystal was solved by direct methods using Olex2 ShelXT25 and ShelXL26 (CCDC number: 2239405†). The figures were drawn using Mercury or Olex2.
Hirshfeld surfaces and 2D fingerprint plots
Hirshfeld surface analysis was used to investigate the structure of the Phl–Inz cocrystal. Hirshfeld surface and molecular fingerprints of Phl–Inz cocrystal using Crystal-Explorer 21.5.27
High-performance liquid chromatography (HPLC)
The concentration of Phl was determined by HPLC using Agilent 1200 (Agilent, America) systems equipped with an Agilent G1311A pump and an Agilent G1315D DAD. The separation was carried out using a Diamonsil C18 column (250 mm × 4.6 mm, 5 μm) with a flow rate of 1 mL min−1 at 30 °C. The mobile phases were composed of solution A (water) and solution C (acetonitrile), and the gradient elution was set as follows: 40–60% C (0–12 min) and 60–40% C (12–15 min). The injection volume was 15 μL, and the detection wavelength was 273 nm.
Solubility experiments
The solubility of Phl and its cocrystal were measured by applying the shake-flask method in a pH 1.2 ± 0.2 hydrochloric acid buffer and pH 6.8 ± 0.2 phosphate buffer solution, which was described in the literature with slight modification.7 An excess amount of mixture (containing 50 mg Phl), Phl or Phl–Inz cocrystal were sieved through 100-mesh sieves and added into a penicillin bottle containing 10 mL solution, and the resulting suspension was rotated at 100 rpm for 24 h at 37 ± 0.5 °C. Sampling intervals were fixed at 5, 10, 15, 20, 30, 45, 60, 75, 90, 120, 180, 240, 300, 360, 420, 540, 720, and 1440 min with 0.4 mL aliquots withdrawn and replaced with an equal amount of buffer. The samples were centrifuged at 5000 rpm for 5 min and filtered through 0.22 μm nylon filters for HPLC analysis (n = 3) using the methods described in HPLC.
In vitro simulated gastrointestinal digestion
To explore the kinetics of drug release in gastrointestinal fluid, the kinetic release profile of phloretin from cocrystals was studied in simulated gastric fluid (SGF) and Simulated Intestinal Fluid (SIF). The detection of in vitro simulated gastrointestinal digestion was modified based on the method documented in the literature.28 About 6 mg of Phl–Inz cocrystal was placed in 4 mL of SGF release medium and stirred at 37 °C for 2 h. After that, the pH of SGF was adjusted to pH 6.8 and mixed with SIF release medium at a ratio of 1:1 (v/v) and stirred at 37 °C for 4 h. Every 30 min during the simulated digestion process, 0.8 mL of the mixture was collected, and 0.8 mL of fresh release medium was replenished to maintain the same volume. The concentration of phloretin in the collected mixture was determined by HPLC (n = 3) using the methods described in HPLC.
In vitro antioxidant activity
DPPH free radical-scavenging activity. The detection of DPPH free radical scavenging ability was modified based on the method documented in the literature.29 1 mL of DPPH alcoholic solution (0.2 mmol L−1), and 1 mL of sample (containing concentrations of 20, 40, 60, 80, 100 μg mL−1 in methanol) was mixed in a test tube, shaken evenly and incubated for 30 min at room temperature in a dark place. After the reaction, the absorbance was measured at a wavelength of 517 nm.
ABTS free radical-scavenging activity. The ABTS free radical scavenging ability of the samples was determined using the method reported previously with some modifications.29 ABTS radical cation was produced by ABTS solution (7 mmol L−1) with 2.5 mmol L−1 potassium persulfate, and the mixture was stored in the dark at 26 °C for 16 h. The ABTS free radical solution was diluted with water to an absorbance of approximately 0.70 at 734 nm, which was the ABTS working solution. 150 μL of each sample (final concentration 20–100 μg mL−1) in methanol and 150 μL of ABTS working solution were mixed in a test tube reacting at room temperature in the dark for 15 min. After the reaction, the absorbance was measured at a wavelength of 734 nm.
Anticancer assay
Human pulmonary carcinoma cells (A549) and human hepatocellular carcinoma cells (HepG2) were cultured in DMEM supplemented with 10% FBS and 1% antibiotics at 37 °C in a 5% (v/v) CO2 atmosphere. Then, the cells were seeded and incubated in 96-well plates with 2.0 × 10⁴ cells per well for 24 h. They were then treated with various concentrations of Phl, Inz, and Phl–Inz cocrystals (20, 40, 80, 160, and 320 μmol L−1) for 24 h, for which 5 replicates and a blank control group were set up concurrently. The samples were dissolved in DMSO attenuated to a specific concentration by adding DMEM. After 24 h, the supernatant was removed, and the cells were incubated with 20 μL MTT (5 mg mL−1) for 4 h at 37 °C. After discarding the supernatant, 150 μL of DMSO was added per hole, and absorbance values were measured at 570 nm using a microplate reader.
Results and discussion
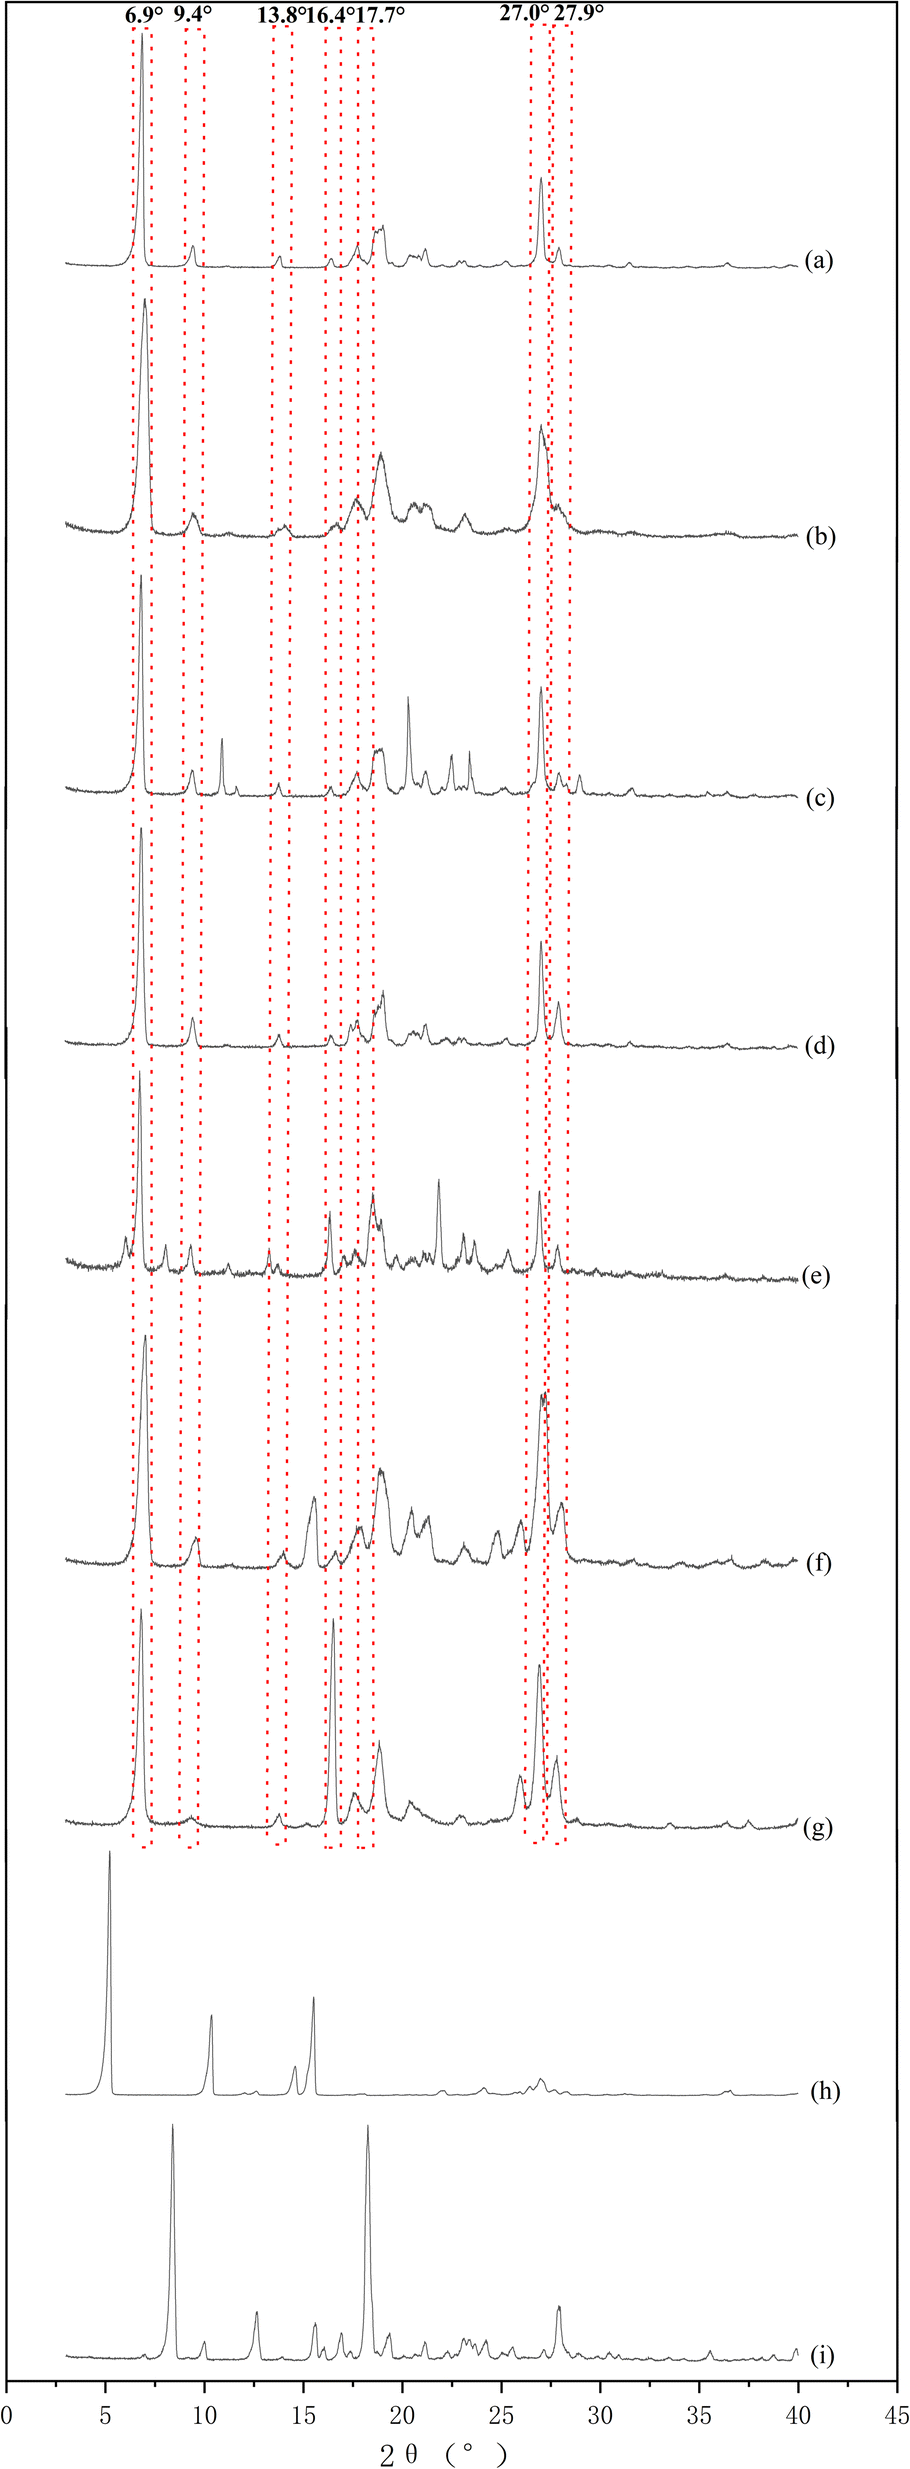
Cocrystal screening by PXRD
Phloretin had characteristic peaks at 6.9°, 9.4°, 13.8°, 16.4°, 17.7°, 27.0°, and 27.9° (Fig. 2a). These characteristic peaks of phloretin were also found in phloretin–theophylline, phloretin–benzamide, phloretin–maleic acid, phloretin–proline, phloretin–nicotinic acid and phloretin–isonicotinic acid (Fig. 2b–g), which showed that the phloretin did not form cocrystal with these co-formers by applying the solvent evaporation method at a ratio of 1:1 in methanol. As illustrated in Fig. 2h, the PXRD pattern of phloretin–picolinic acid showed that the characteristic peaks of phloretin at 6.9°, 9.4°, 13.8° and 16.4° disappeared. Moreover, characteristic peaks of phloretin (6.9°, 9.4°, 13.8° and 16.4°) disappeared from the PXRD pattern of phloretin–isoniazid (Fig. 2i). These phenomena indicate the formation of new crystalline phases. To further determine whether phloretin forms cocrystal with picolinic acid and isoniazid, samples of phloretin–picolinic acid (Phl–Pa) and phloretin–isoniazid (Phl–Inz) were tested using DSC-TG.
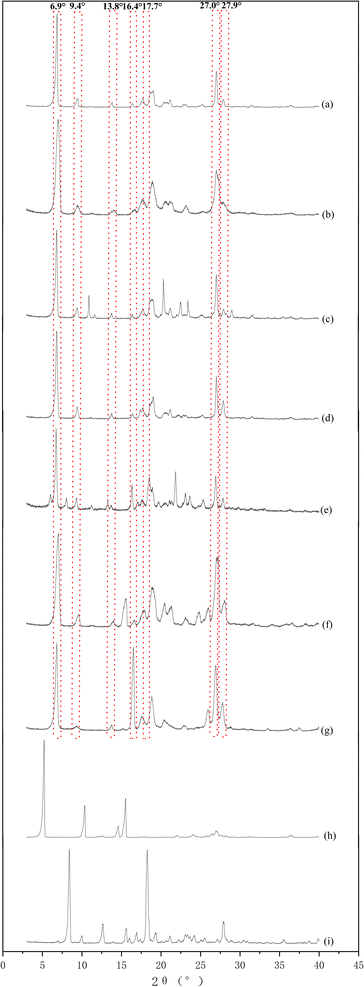 |
| | Fig. 2 PXRD patterns of Phl and co-formers. | |
Thermal analysis
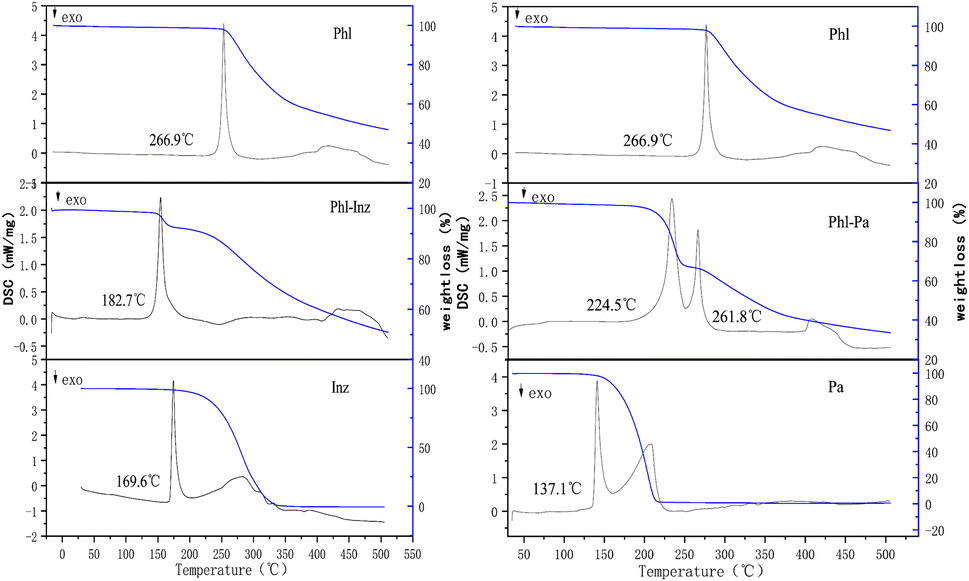
The thermal analysis method can be used to check the purity of the crystalline phases.20,30 The thermal behaviours of crystals can be determined by differential scanning calorimetry (DSC) and thermogravimetric analysis (TG).31,32 In the thermogram (Fig. 3), 266.9 °C, 169.6 °C and 137.1 °C in DSC endotherms were the melting points of phloretin, isoniazid and picolinic acid, respectively. The cocrystal Phl–Inz exhibited the formation of a sharp endothermic peak at 182.7 °C (Fig. 3). The position of the endothermic peak of Phl–Inz was different from that of Phl and Inz, which showed that the peak was the melting point of the cocrystal. The appearance of a new single peak illustrated the formation of a new crystal with high crystallinity and purity. Furthermore, the results of the TGA showed that the Phl–Inz cocrystal had approximately a 7.9% weight loss at about 219 °C. This phenomenon means the decomposition of the Phl–Inz cocrystal with the loss of –NH–NH2. However, the mixture of Phl–Pa exhibited two sharp endothermic peaks at 224.5 °C and 261.8 °C. The position of the endothermic peak of the Phl–Pa mixture at 261.8 °C was similar to the melting point of phloretin, and the peak of the Phl–Pa mixture at 224.5 °C was different from the melting points of phloretin and picolinic acid. These two endothermic peaks showed that the new crystalline phase was formed in the phloretin and picolinic acid by applying the solvent evaporation method, but some phloretins were still in a free state, which explicates that the mixture includes a new crystal and phloretin monomer. Based on the analysis of DSC-TG, pure Phl–Inz cocrystal was successfully formed by the solvent evaporation method, but pure Phl–Pa cocrystal failed. However, DSC-TG can only provide thermodynamic information about the cocrystal. More characterization methods (including FT-IR, HNMR, PXRD and SCXRD) were needed to determine the structure of the cocrystal.
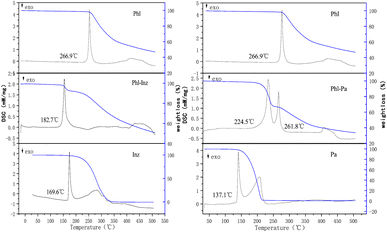 |
| | Fig. 3 The DSC and TG curves. | |
FT-IR analysis
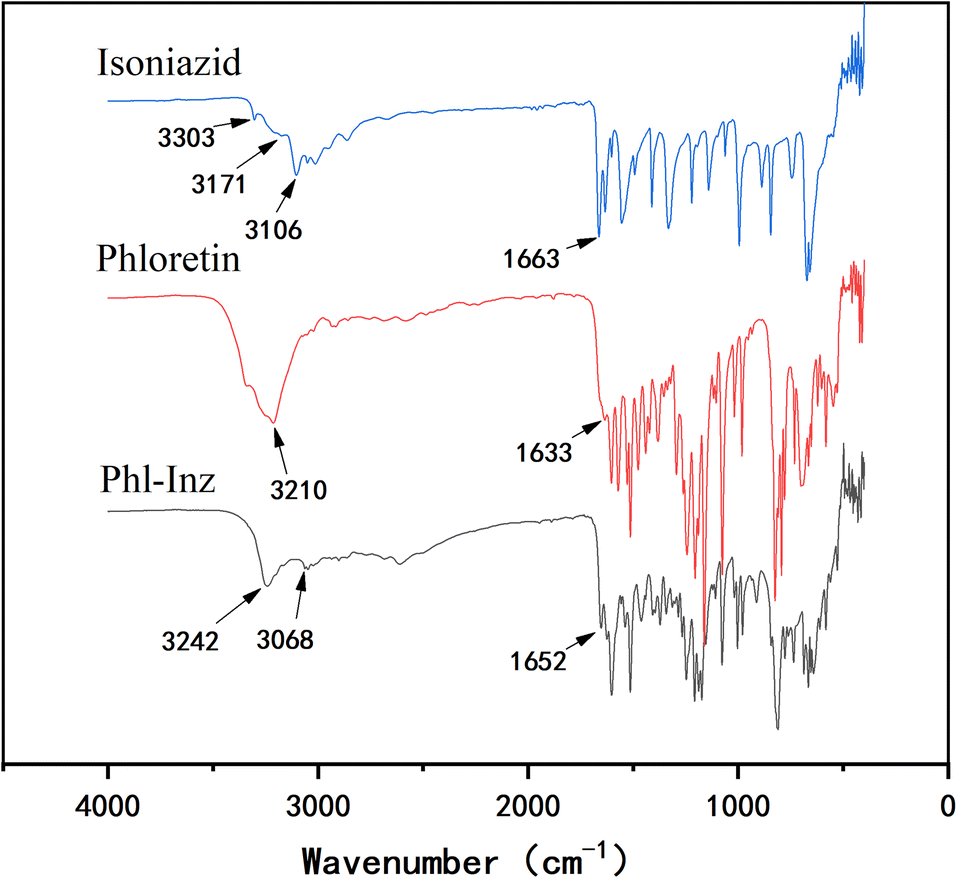
The energy absorbed or scattered by the bonds in the cocrystal differs from the energy of the pure components. The formation of cocrystals could lead to changes in positions, shape and intensity of absorption pattern.33,34 Infrared spectroscopy can help to obtain more information about the intermolecular interactions of functional groups involved in their vibrational frequency changes. For Phl (Fig. 4), the characteristic peaks appeared at 3210 cm−1 and 1633 cm−1, which corresponded to the O–H and C![[double bond, length as m-dash]](https://www.rsc.org/images/entities/char_e001.gif) O stretching vibrations of the hydroxyl groups and carbonyl groups. The infrared spectrum of Inz reflected the characteristic peaks that appeared at 3303 cm−1, 3171 cm−1 and 3106 cm−1 corresponding to N–H of the hydrazide groups. The characteristic peak located at 1663 cm−1 corresponds to the CO stretching vibrations of the carbonyl group. The hydrogen bonding between Phl and Inz in the cocrystal led to a change in the position of the vibrational frequencies, which differed from Phl and Inz. The vibrational frequency of O–H of Phl shifted to 3242 cm−1 from 3210 cm−1, while that of N–H of Inz shifted to 3068 cm−1 from 3106 cm−1. The CO of Phl and Inz moved from 1633 cm−1 and 1663 cm−1 to 1652 cm−1, respectively. The formation of hydrogen bonding in the Phl–Inz cocrystal results in a blue shift or red shift of the stretching vibrations.35–37
O stretching vibrations of the hydroxyl groups and carbonyl groups. The infrared spectrum of Inz reflected the characteristic peaks that appeared at 3303 cm−1, 3171 cm−1 and 3106 cm−1 corresponding to N–H of the hydrazide groups. The characteristic peak located at 1663 cm−1 corresponds to the CO stretching vibrations of the carbonyl group. The hydrogen bonding between Phl and Inz in the cocrystal led to a change in the position of the vibrational frequencies, which differed from Phl and Inz. The vibrational frequency of O–H of Phl shifted to 3242 cm−1 from 3210 cm−1, while that of N–H of Inz shifted to 3068 cm−1 from 3106 cm−1. The CO of Phl and Inz moved from 1633 cm−1 and 1663 cm−1 to 1652 cm−1, respectively. The formation of hydrogen bonding in the Phl–Inz cocrystal results in a blue shift or red shift of the stretching vibrations.35–37
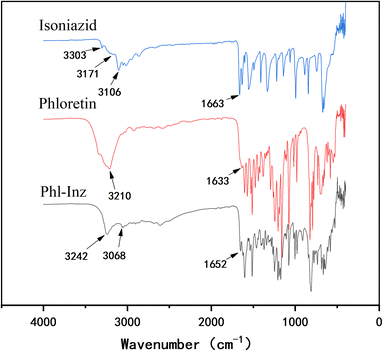 |
| | Fig. 4 IR of Phl, Inz and Phl–Inz. | |
1H NMR analysis
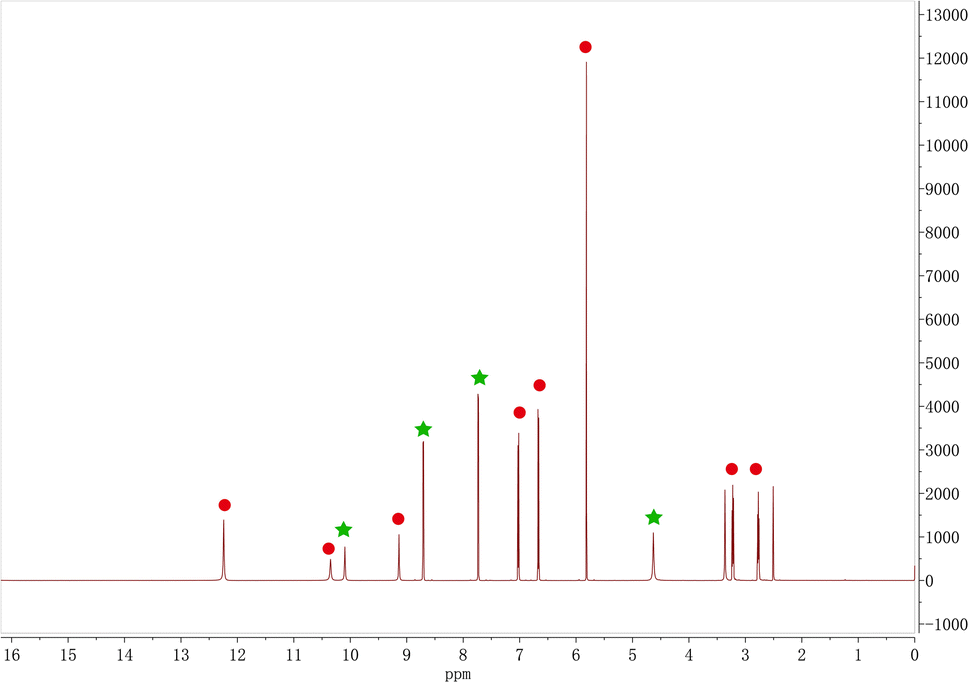
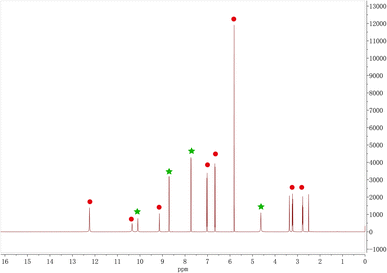
The ratio of Phl and Inz in the cocrystal was identified with 1H NMR. In Fig. 5, the characteristic peaks of the chemical shift of Phl in 1H NMR (DMSO-d6) spectrum were as follows (red points in Fig. 5): δ12.24 (s, 2H), 10.35 (s, 1H), 9.14 (s, 1H), 7.02 (d, J = 8.4 Hz, 2H), 6.67 (d, J = 8.4 Hz, 2H), 5.82 (s, 2H), 3.22 (t, J = 7.8 Hz, 2H), and 2.77 (t, J = 7.8 Hz, 2H). For Inz, 1H NMR (DMSO-d6) spectrum was as follows (green points in Fig. 5): δ10.10 (s, 1H), 8.71 (d, J = 6.1 Hz, 2H), 7.73 (d, J = 6.1 Hz, 2H), and 4.63 (s, 2H). The stoichiometric ratio of Phl and Inz is 1:1 from the ratio of the integration results of the characteristic peaks of Phl and Inz in the 1H NMR spectrum.
 |
| | Fig. 5 1H NMR of Phl–Inz cocrystal. | |
PXRD analysis
Different crystal phases of a substance can be obtained by applying the powder X-ray diffraction method to obtain different diffraction patterns, which is a common method for the characterization of cocrystals.38 Fig. 6 shows the diffraction patterns of Phl, Inz and cocrystal. Phl exhibited characteristic diffraction peaks at 6.9°, 9.4°, 13.8°, 16.4°, 17.7°, 27.0°, and 27.9°. The characteristic diffraction peaks of Inz were 9.7, 11.9°, 14.2°, 15.4°, 16.6°, 19.6°, 24.0°, 25.3°, 28.7°, and 32.0°. The PXRD analysis of Phl–Inz exhibited new characteristic reflections at 8.3°, 12.6°, and 18.2° positions (2θ), which differed from those in Phl and Inz. The existence of new phases from Phl and Inz was confirmed by PXRD. The diffraction peaks shown in the simulated diffraction pattern of a single crystal are approximately the same as those of a cocrystal.
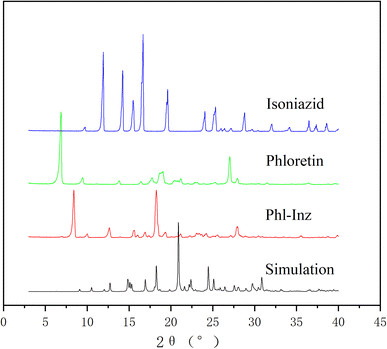 |
| | Fig. 6 PXRD patterns of Phl–Inz cocrystal. | |
Crystal structure analysis
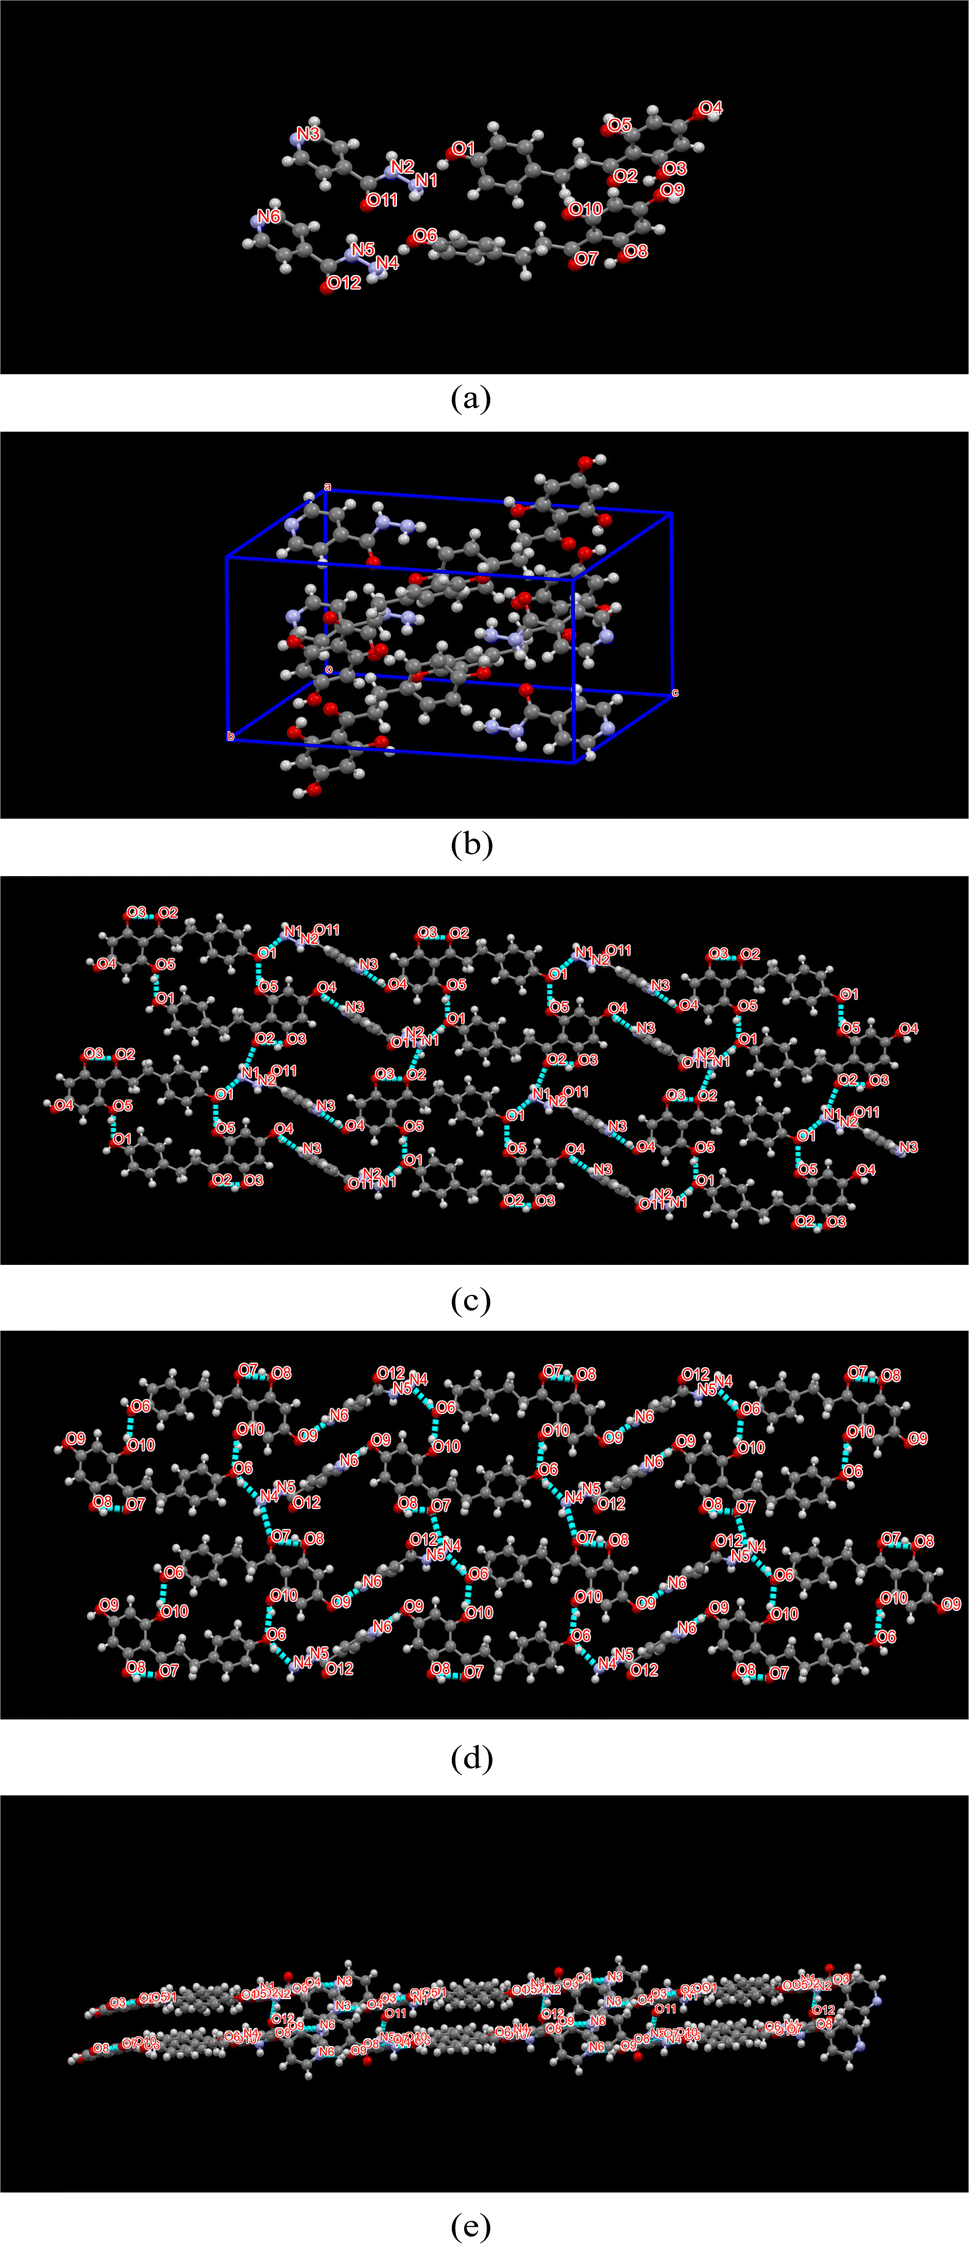
SCXRD can obtain microscopic information, such as space group, unit cell, bond length, bond angle and intermolecular interaction, by measuring the structure of a single crystal.30 Many relevant isoniazid-based cocrystals have been reported.39–44 The structure of Phl–Inz crystallized in the triclinic space group P![[1 with combining macron]](https://www.rsc.org/images/entities/char_0031_0304.gif) (Table 1), with two molecules of Phl and Inz in the asymmetric unit. A unit cell contains two asymmetric units. One molecule of Phl connected with Inz through O1–H1⋯N1 or O6–H6A⋯N4 to form a dimer. The two dimers were further linked by O5–H5⋯O1 or O10–H10⋯O6 hydrogen bond between the hydroxy groups of the adjacent Phl molecules to form a tetramer. The tetramers were further connected by O4–H4⋯N3 and N1–H1A⋯O2 hydrogen bonds or O9–H9⋯N6 and N4–H4A⋯O7 to form 2D structure of the cocrystal (Fig. 7c and d). The 2D structures are connected by N2–H2A⋯O12 and N5–H5B⋯O11 hydrogen bonds to form 3D structures (Fig. 7e). The hydrogen-bonding distances and angles for the Phl–Inz cocrystal were showed in Table 2.
(Table 1), with two molecules of Phl and Inz in the asymmetric unit. A unit cell contains two asymmetric units. One molecule of Phl connected with Inz through O1–H1⋯N1 or O6–H6A⋯N4 to form a dimer. The two dimers were further linked by O5–H5⋯O1 or O10–H10⋯O6 hydrogen bond between the hydroxy groups of the adjacent Phl molecules to form a tetramer. The tetramers were further connected by O4–H4⋯N3 and N1–H1A⋯O2 hydrogen bonds or O9–H9⋯N6 and N4–H4A⋯O7 to form 2D structure of the cocrystal (Fig. 7c and d). The 2D structures are connected by N2–H2A⋯O12 and N5–H5B⋯O11 hydrogen bonds to form 3D structures (Fig. 7e). The hydrogen-bonding distances and angles for the Phl–Inz cocrystal were showed in Table 2.
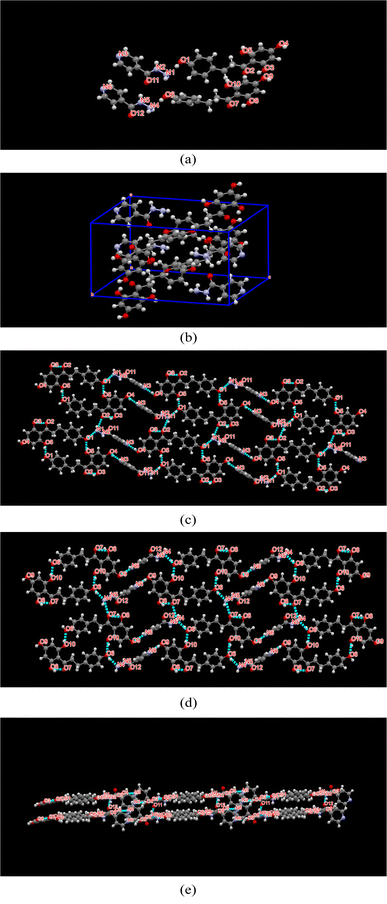 |
| | Fig. 7 (a) Asymmetric unit, (b) cell packing, (c) 2D structure, (d) 3D sheet structure of Phl–Inz cocrystal. H-bonds are represented by dashed lines. | |
Table 1 Crystallographic data and structure refinement parameters for the Phl–Inz cocrystal
| Compound |
Phl–Inz |
| Empirical formula |
C21H21N3O6 |
| Formula weight |
411.41 |
| Temperature (K) |
150(10) |
| λ (Å) |
1.54184 |
| Crystal size (mm3) |
0.29 × 0.15 × 0.03 |
| Space group |
P |
| Crystal system |
Triclinic |
| a (Å) |
9.8309(4) |
| b (Å) |
9.8954(4) |
| c (Å) |
20.6193(7) |
| α (°) |
92.308(3) |
| β (°) |
91.398(3) |
| γ (°) |
107.015(3) |
| Volume (Å3) |
1915.13(12) |
| Z |
4 |
| ρcalc (g cm−3) |
1.427 |
| μ (mm−1) |
0.887 |
| 2θ range |
8.59–149.404 |
| F(000) |
864 |
| Index ranges |
−12 ≤ h ≤ 11 |
| −12 ≤ k ≤ 12 |
| −25 ≤ k ≤ 25 |
| Reflections collected |
30217 |
| Independent reflections |
7393 [Rint = 0.0329, Rsigma = 0.0218] |
| Data/restraints/parameters |
7393/0/550 |
| GOF |
1.044 |
| Final R indexes[I ≥ 2σ(I)] |
0.0878/0.2537 |
| Final R indexes (all data) |
0.0932/0.2574 |
| Largest diff. peak/hole (e Å−3) |
0.54/−0.36 |
Table 2 Hydrogen-bonding distances and angles for the Phl–Inz cocrystala
| Hydrogen bond |
H⋯A (Å) |
D⋯A (Å) |
∠D– H⋯A (°) |
| Symmetry codes: 11 + X, +Y, 1 + Z; 22 − X, 1 − Y, 1 − Z; 31 − X, 1 − Y, 1 − Z; 41 − X, −Y, 1 − Z; 51 + X, +Y, +Z; 6−X, −Y, 1 − Z; 7–1 + X, +Y, +Z. |
| O1–H1⋯N1 |
1.91 |
2.736(4) |
169.9 |
| O1–H1⋯N2 |
2.73 |
3.418(4) |
140.8 |
| O3–H3⋯O2 |
1.76 |
2.504(3) |
147.1 |
| O4–H4⋯N31 |
1.94 |
2.750(4) |
160.8 |
| O5–H5⋯O12 |
1.87 |
2.677(3) |
159.8 |
| C6–H6⋯O52 |
2.88 |
3.474(4) |
121.5 |
| C12–H12⋯N31 |
2.80 |
3.456(5) |
127.3 |
| O6–H6A⋯N4 |
1.92 |
2.751(4) |
168.0 |
| O6–H6A⋯N5 |
2.78 |
3.492(4) |
143.5 |
| O8–H8⋯O7 |
1.76 |
2.505(3) |
147.3 |
| O9–H9⋯N61 |
1.95 |
2.753(4) |
159.9 |
| O10–H10⋯O63 |
1.85 |
2.664(3) |
163.3 |
| C27–H27⋯N61 |
2.77 |
3.431(4) |
127.7 |
| N1–H1A⋯O24 |
2.21 |
2.986(4) |
146.8 |
| N2–H2A⋯O84 |
2.77 |
3.330(4) |
122.8 |
| N2–H2A⋯O125 |
1.98 |
2.784(4) |
151.9 |
| C33–H33⋯O84 |
2.47 |
3.406(4) |
169.9 |
| N4–H4A⋯O76 |
2.29 |
2.961(4) |
132.1 |
| N4–H4B⋯O17 |
2.47 |
3.250(4) |
151.6 |
| N5–H5B⋯O34 |
2.70 |
3.270(4) |
123.3 |
| N5–H5B⋯O11 |
1.99 |
2.773(4) |
148.3 |
| C39–H39⋯O34 |
2.46 |
3.402(4) |
169.5 |
Hirshfeld surface analysis
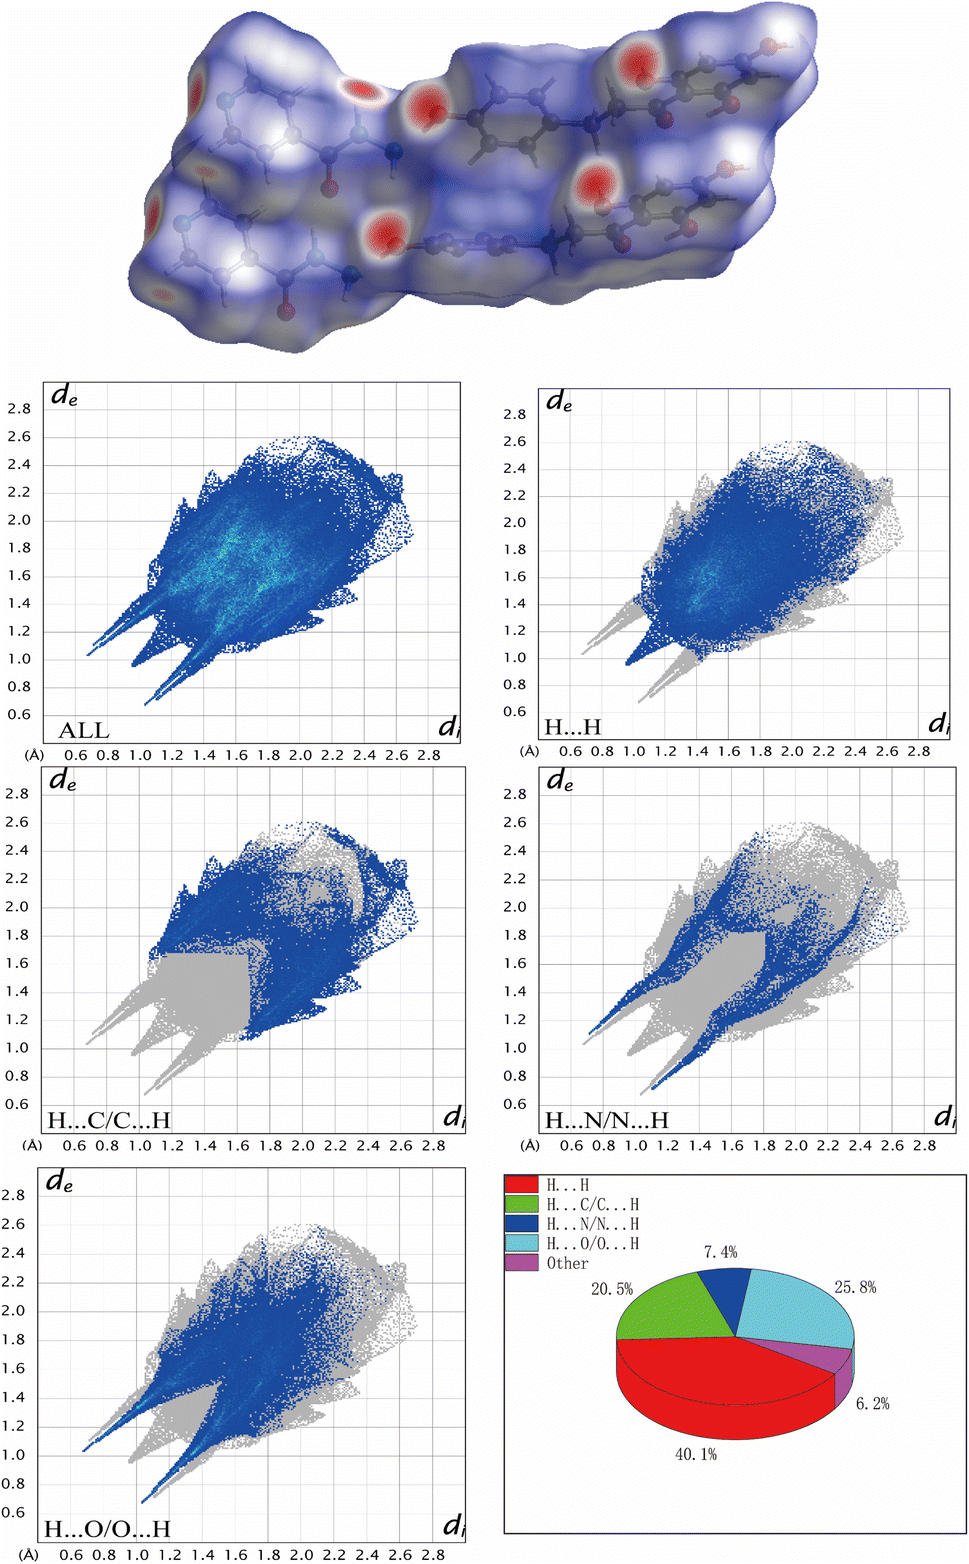
To have a broader view of the packing modes and interactions between the components in the cocrystal, the Hirshfeld surface could be examined in a visual way.45 Hirshfeld surface (HS) and 2D fingerprint plots were prepared using Crystal Explorer 21.5. As shown in Fig. 8, HS of Phl–Inz revealed the interaction in O–H⋯O and O–H⋯N shown in bright red on the surface, while H⋯H contact was exhibited in the blue areas on the surface. Based on the finger plots of cocrystal (Fig. 8), the contacts of H⋯H, H⋯C/C⋯H, H⋯O/O⋯H and H⋯N/N⋯H accounted for 40.1%, 20.5%, 25.8% and 7.4% of HS, respectively. H⋯H interaction contributed the most to the total HS of Phl–Inz, indicating that the cocrystal structure is loose, which creates favourable conditions for regulating the solubility of Phl. The cocrystal structure was stable in space through hydrogen bonding and van der Waals forces.
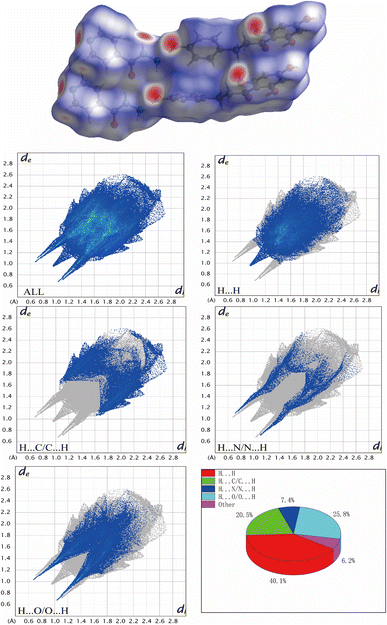 |
| | Fig. 8 Hirshfeld surface and 2D fingerprint plots of Phl–Inz. | |
Analysis of solubility experiments
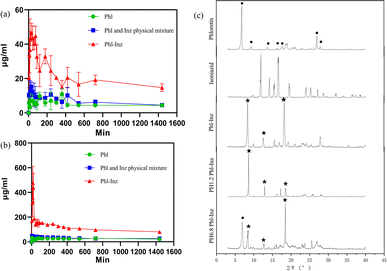
The purpose of these experiments was to modify the physicochemical properties of Phl using cocrystals to improve its poor water solubility. The results of solubility experiments on the Phl–Inz cocrystal in pH 1.2 and pH 6.8 fluid at various times are presented in Fig. 9. The equilibrium solubility of pure Phl was around 4.38 μg mL−1 (pH 1.2) and 21.39 μg mL−1 (pH 6.8). The solubility of Phl in the mixture with Inz did not improve (Fig. 9a and b). After the formation of the Phl–Inz cocrystal, the solubility of cocrystal in two buffers distinctly increased to 46.84 μg mL−1 (pH 1.2) at 30 min and 477.24 μg mL−1 (pH 6.8) at 15 min. Phl's concentration increased to the maximum value and then began to decrease within 40 min, but the equilibrium solubility was still higher than the levels exhibited by pure Phl. This may be because Inz molecules with better water solubility dissolved first in the initial phase of dissolution, leading to the destruction of the molecular spatial structure and the rapid dissolution of Phl molecules to supersaturation. The recrystallization of supersaturated Phl results in the decreased solubility of Phl.
 |
| | Fig. 9 The powder dissolution curve of Phl, Inz and Phl–Inz cocrystal ((a) pH = 1.2), ((b) pH = 6.8). (c) PXRD patterns of samples after testing. | |
The remaining samples were tested by PXRD after the solubility experiment. The results of PXRD patterns (Fig. 9c) showed that the remaining materials had a few characteristic peaks of the Phl–Inz cocrystal, such as 8.3°, 12.6° and 18.2° (with star symbol). However, the characteristic of raw Phl at 6.9° was found in the PXRD pattern of the cocrystal (pH 6.8). At pH 6.8, the solubility of the cocrystal decreased abruptly but decreased gradually at pH 1.2. The reason may be that the solubility of Phl at pH 6.8 is higher than that of pH 1.2, and the solubility of Phl in a short time is also higher than that of pH 1.2 owing to the influence of the rapid dissolution of Inz. More free Phl is more likely to recrystallize at pH 6.8 than at pH 1.2, so the solubility of the cocrystal at pH 6.8 decreases rapidly. The phenomenon explained that the Phl–Inz cocrystal dissolves into the individual molecules in the solute and is recrystallized because of poor solubility. The phenomenon showed a change in Phl solubility owing to the formation of a new crystalline phase.
Analysis of simulated digestion in vitro
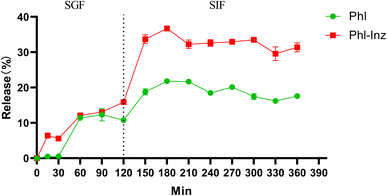
The release profile of free phloretin and phloretin in cocrystal tested in vitro simulated gastrointestinal digestion experiment is shown in Fig. 10 throughout the entire 6 h in SGF and SIF fluid. Approximately 11% free phloretin diffused to the SGF, followed by another approximately 7% released in the SIF, totalling the 18% cumulative release at the end of the experiment. In contrast, there was around 16% phloretin in the cocrystal released in the SGF and another 15% released in the SIF, totalling 31% cumulative release in the release medium. During the incubation of intestinal digestion, it was shown that the release of phloretin in the cocrystal was better than that of the free phloretin. It could correspond to the results of the solubility experiments that the solubility of Phl–Inz cocrsytal is better than pure Phl.
 |
| | Fig. 10 Release properties of phloretin from free phloretin and Phl–Inz cocrystal during an in vitro digestion study. | |
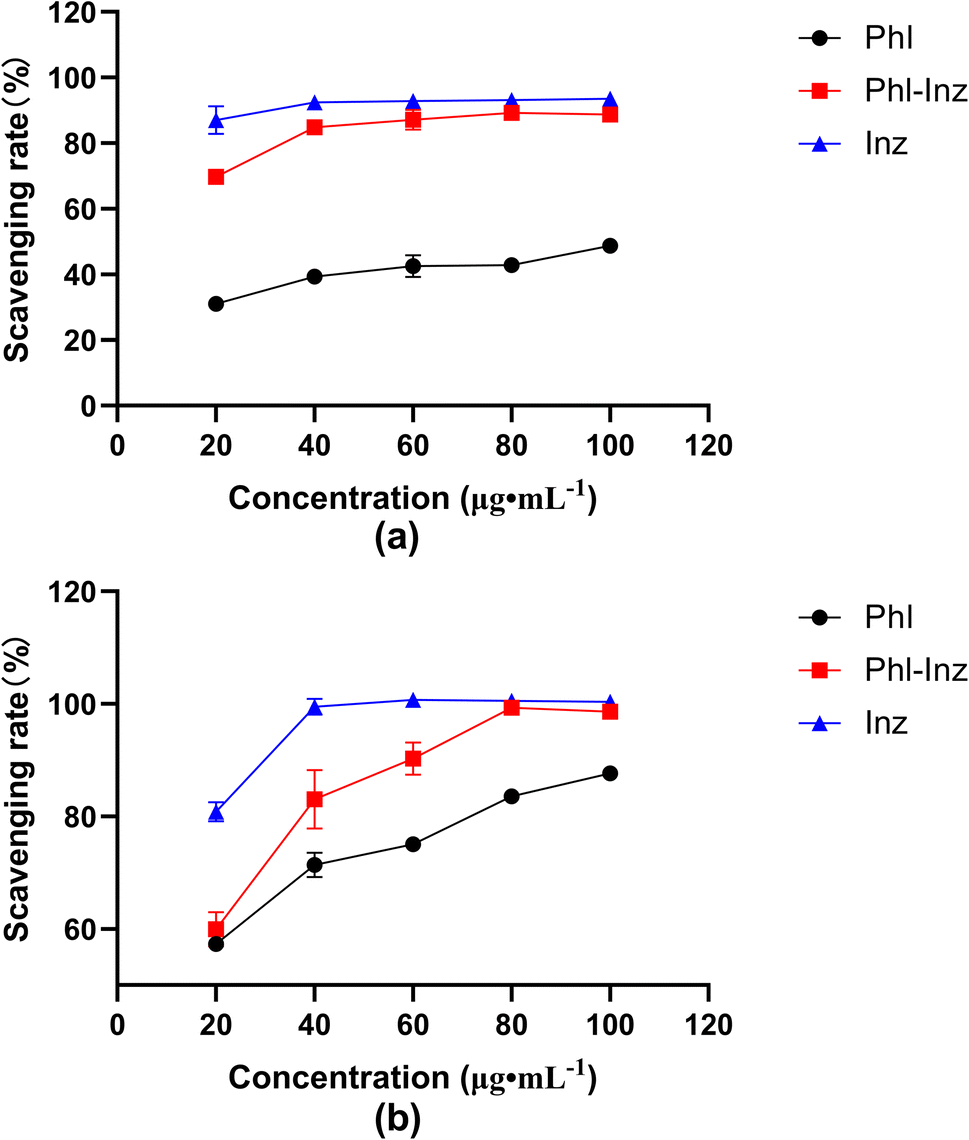
Analysis of in vitro antioxidant activity
The in vitro antioxidant activity of Phl–Inz cocrystal, Phl and Inz was evaluated with DPPH and ABTS free radical scavenging rate46 (Fig. 11a and b). In the concentration range of 20–100 μg mL−1, the DPPH free radical scavenging rate of the compounds increased as the mass concentration increased. When the mass concentration was 100 μg mL−1, the DPPH free radical scavenging rate of Phl–Inz reached 88.7%, while that of pure Phl was 48.8%. The concentration of Phl, Inz and cocrystals positively correlated with ABTS free radical scavenging rate in the range of 20–100 μg mL−1. The ABTS free radical scavenging rate of Phl–Inz reached 98.6% in 100 μg mL−1 while that of pure Phl was 87.7%. The results indicated that the DPPH and ABTS radical scavenging activity of Phl–Inz had nearly 82% and 12% enhancement over that shown by pure Phl.
 |
| | Fig. 11 Free radical scavenging activity of Phl, Inz and Phl–Inz cocrystal ((a) DPPH; (b) ABTS). | |
Anticancer evaluation
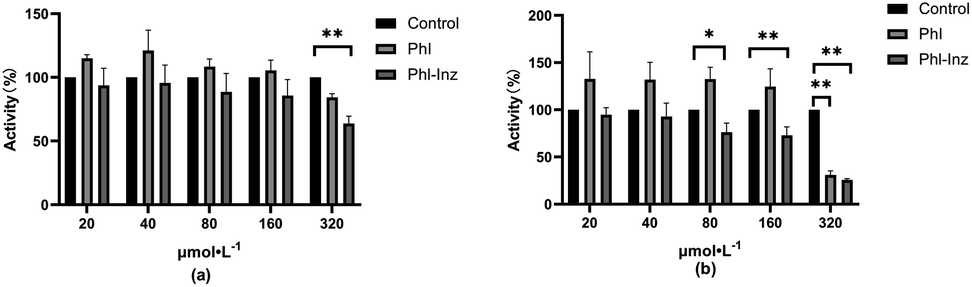
To further ascertain whether the improved physicochemical properties can promote the enhancement of antitumor activities, we used various concentrations of Phl and cocrystal to incubate cancer cells and investigate their effects on cancer cell proliferation (Fig. 12a and b). The results showed that cocrystal exhibited an inhibitory effect on the proliferation of A549 cells at 320 μmol L−1 (P < 0.01) and better than the effect of Phl, but other concentrations had insignificant inhibitory effects. For the result of HepG2, cocrystal showed significant inhibitory effects at 80 μmol L−1, 160 μmol L−1 and 320 μmol L−1 (P < 0.01, 0.05) but Phl was only at 320 μmol L−1. The improved inhibitory ability may be basically due to the cocrystal having better physicochemical properties after Phl forming cocrystal with Inz. The better solubility of the cocrystal can facilitate the dissolution of Phl at a faster rate, thereby inducing high-concentration drug enrichment around the cancer cells, which provides sufficient conditions for sustained efficacy.
 |
| | Fig. 12 The cytotoxicity of Phl and cocrystal against the tested cancer cells ((a) A549 cell; (b) HepG2). | |
Conclusions
In this study, we selected several CCFs and tried to form cocrystals with Phl by applying the solvent evaporation method. Based on the results of PXRD and DSC-TG, it was determined that only Phl formed a cocrystal with Inz. Fourier-transform infrared was used to determine the hydrogen bonding between the hydroxyl group in Phl and the hydrazide group in Inz. Single-crystal diffraction and 1H NMR showed that the stoichiometric ratio of the two components in the crystal was 1:1. Phl and Inz were bound to each other through various hydrogen bonds in the cocrystal. The Hirshfeld surface and 2D fingerprint plots further elucidate the intermolecular interaction of the two components in the cocrystal. The solubility experiment showed that the in vitro dissolution rate and equilibrium solubility of the Phl–Inz cocrystal were better than those of pure Phl. The release of phloretin in the cocrystal was better than that of pure phloretin in the gastrointestinal fluid. Moreover, in vitro antioxidant activity and anti-cancer activity of cocrystals increased. The above work showed a promising approach to overcoming the poor physicochemical properties of parent drugs by forming cocrystal structures, and pharmaceutical cocrystals could be used as an effective technology for developing new drugs.
Author contributions
Zhongyu Lu: data curation, formal analysis, investigation, visualization, and writing-original draft. Hankun Chen: supervision and editing. Jiaxin Mo: formal analysis and validation. Xiaohong Yuan: investigation and formal analysis. Dawei Wang: formal analysis; Xianhui Zheng: formal analysis; Wei Zhu: supervision, resources, and funding acquisition.
Conflicts of interest
There are no conflicts to declare.
Acknowledgements
This research was funded by Guangdong Provincial Hospital of Chinese Medicine Science and Technology Research Program (YN2019MJ11); Scientific Research Project of Guangdong Administration of Traditional Chinese Medicine (202231144); Foundation of Guangzhou Science and Technology Bureau (202201020296), and the Foshan Project of Key Areas of Science and Technology Research (2120001008478).
Notes and references
- R. L. Birru, K. Bein, H. Wells, N. Bondarchuk, A. Barchowsky, Y. P. Di and G. D. Leikauf, Mol. Nutr. Food Res., 2021, 65, e2000658 CrossRef PubMed.
- L. Wang, Z. W. Li, W. Zhang, R. Xu, F. Gao, Y. F. Liu and Y. J. Li, Molecules, 2014, 19, 16447–16457 CrossRef PubMed.
- X. Li, B. Chen, H. Xie, Y. He, D. Zhong and D. Chen, Molecules, 2018, 23, 1162 CrossRef PubMed.
- X. Y. Lu, Y. Y. Zeng, Y. X. Ye, Y. Y. Zhou, J. J. Mu and X. H. Zhao, Yaoxue Xuebao, 2009, 44, 480–485 CAS.
- D. Barreca, E. Bellocco, G. Lagana, G. Ginestra and C. Bisignano, Food Chem., 2014, 160, 292–297 CrossRef CAS PubMed.
- B. Y. Choi, Molecules, 2019, 24, 278 CrossRef PubMed.
- S. Huang, J. Xu, Y. Peng, M. Guo and T. Cai, Cryst. Growth Des., 2019, 19, 6837–6844 CrossRef CAS.
- L. Gu, R. Sun, W. Wang and Q. Xia, Chem. Phys. Lipids, 2022, 242, 105150 CrossRef CAS PubMed.
- T. P. Anunciato Casarini, L. A. Frank, A. R. Pohlmann and S. S. Guterres, Eur. J. Pharmacol., 2020, 889, 173593 CrossRef CAS PubMed.
- A. Karagianni, M. Malamatari and K. Kachrimanis, Pharmaceutics, 2018, 10, 18 CrossRef PubMed.
- G. Kuminek, F. Cao, A. Bahia de Oliveira da Rocha, S. Goncalves Cardoso and N. Rodriguez-Hornedo, Adv. Drug Delivery Rev., 2016, 101, 143–166 CrossRef CAS PubMed.
- J. Varshosaz, E. Ghassami and S. Ahmadipour, Curr. Pharm. Des., 2010, 24, 2473–2496 CrossRef PubMed.
- D. Srivastava, Z. Fatima, C. D. Kaur, S. L. Tulsankar, S. S. Nashik and D. A. Rizvi, Recent Pat. Drug Delivery Formulation, 2019, 13, 62–69 CrossRef CAS PubMed.
- I. Sathisaran and S. V. Dalvi, Pharmaceutics, 2018, 10, 108 CrossRef CAS PubMed.
- N. Schultheiss and A. Newman, Cryst. Growth Des., 2009, 9, 2950–2967 CrossRef CAS PubMed.
- W. Li, J. Pi, Y. Zhang, X. Ma, B. Zhang, S. Wang, D. Qi, N. Li, P. Guo and Z. Liu, Fitoterapia, 2018, 129, 85–93 CrossRef CAS PubMed.
- M. Liu, C. Hong, Y. Yao, H. Shen, G. Ji, G. Li and Y. Xie, Eur. J. Pharm. Biopharm., 2016, 107, 151–159 CrossRef CAS PubMed.
- M. Rodrigues, B. Baptista, J. A. Lopes and M. C. Sarraguca, Int. J. Pharm., 2018, 547, 404–420 CrossRef CAS PubMed.
- I. Miroshnyk, S. Mirza and N. Sandler, Expert Opin. Drug Delivery, 2009, 6, 333–341 CrossRef CAS PubMed.
- N. Qiao, M. Li, W. Schlindwein, N. Malek, A. Davies and G. Trappitt, Int. J. Pharm., 2011, 419, 1–11 CrossRef CAS PubMed.
- Y. Liu, F. Yang, X. Zhao, S. Wang, Q. Yang and X. Zhang, Pharmaceutics, 2022, 14, 94 CrossRef CAS PubMed.
- J. Xu, Y. Huang, S. Ruan, Z. Chi, K. Qin, B. Cai and T. Cai, CrystEngComm, 2016, 18, 8776–8786 RSC.
- Z. Zhang, D. Li, C. Luo, C. Huang, R. Qiu, Z. Deng and H. Zhang, Cryst. Growth Des., 2019, 19, 3851–3859 CrossRef CAS.
- Z. Zhou, W. Li, W. J. Sun, T. Lu, H. H. Y. Tong, C. C. Sun and Y. Zheng, Int. J. Pharm., 2016, 509, 391–399 CrossRef CAS PubMed.
- G. M. Sheldrick, Acta Crystallogr., Sect. A: Found. Adv., 2015, 71, 3–8 CrossRef PubMed.
- G. M. Sheldrick, Acta Crystallogr., Sect. C: Struct. Chem., 2015, 71, 3–8 Search PubMed.
- P. R. Spackman, M. J. Turner, J. J. McKinnon, S. K. Wolff, D. J. Grimwood, D. Jayatilaka and M. A. Spackman, J. Appl. Crystallogr., 2021, 54, 1006–1011 CrossRef CAS PubMed.
- P. P. Wang, Z. G. Luo and X. C. Peng, J. Agric. Food Chem., 2018, 66, 10598–10607 CrossRef CAS PubMed.
- P. Rozi, A. Abuduwaili, P. Mutailifu, Y. Gao, R. Rakhmanberdieva, H. A. Aisa and A. Yili, Int. J. Biol. Macromol., 2019, 131, 97–106 CrossRef CAS PubMed.
- A. Raheem Thayyil, T. Juturu, S. Nayak and S. Kamath, Adv. Pharm. Bull., 2020, 10, 203–212 CrossRef PubMed.
- Z. Zhou, H. M. Chan, H. H. Sung, H. H. Tong and Y. Zheng, Pharm. Res., 2016, 33, 1030–1039 CrossRef CAS PubMed.
- I. Nugrahani, D. Utami, Y. P. Nugraha, H. Uekusa, R. Hasianna and A. A. Darusman, Heliyon, 2019, 5, e02946 CrossRef PubMed.
- S. Sawatdee, A. Atipairin, S. Rakkummerd, O. Suriyaphol, D. J. Harding, P. Muenraya and P. Harding, J. Adv. Pharm. Technol. Res., 2021, 12, 408–419 CrossRef CAS PubMed.
- P. Cerreia Vioglio, M. R. Chierotti and R. Gobetto, Adv. Drug Delivery Rev., 2017, 117, 86–110 CrossRef CAS PubMed.
- R. Chadha, Y. Bhalla, A. Nandan, K. Chadha and M. Karan, J. Pharm. Biomed. Anal., 2017, 134, 361–371 CrossRef CAS PubMed.
- A. Sokal, E. Pindelska, L. Szeleszczuk and W. Kolodziejski, Int. J. Pharm., 2017, 522, 80–89 CrossRef CAS PubMed.
- Z. Zhou, W. Li, W.-J. Sun, T. Lu, H. H. Y. Tong, C. C. Sun and Y. Zheng, Int. J. Pharm., 2016, 509, 391–399 CrossRef CAS PubMed.
- E. Pindelska, A. Sokal and W. Kolodziejski, Adv. Drug Delivery Rev., 2017, 117, 111–146 CrossRef CAS PubMed.
- K. K. Bisht, P. Patel, Y. Rachuri and S. Eringathodi, Acta Crystallogr., Sect. B: Struct. Sci., Cryst. Eng. Mater., 2014, 70, 63–71 CrossRef CAS PubMed.
- P. Grobelny, A. Mukherjee and G. R. Desiraju, CrystEngComm, 2011, 13, 4358–4364 RSC.
- R. Kaur, S. S. R. R. Perumal, A. J. Bhattacharyya, S. Yashonath and T. N. Guru Row, Cryst. Growth Des., 2014, 14, 423–426 CrossRef CAS.
- I. Sarcevica, L. Orola, M. V. Veidis, A. Podjava and S. Belyakov, Cryst. Growth Des., 2013, 13, 1082–1090 CrossRef CAS.
- M. C. Scheepers and A. Lemmerer, Acta Crystallogr., Sect. B: Struct. Sci., Cryst. Eng. Mater., 2022, 78, 857–867 CrossRef CAS.
- B. Swapna, D. Maddileti and A. Nangia, Cryst. Growth Des., 2014, 14, 5991–6005 CrossRef CAS.
- M. A. Spackman and D. Jayatilaka, CrystEngComm, 2009, 11, 19–32 RSC.
- I. G. Munteanu and C. Apetrei, Int. J. Mol. Sci., 2021, 22, 3380 CrossRef CAS PubMed.
|
| This journal is © The Royal Society of Chemistry 2023 |
Click here to see how this site uses Cookies. View our privacy policy here. 
 Open Access Article
 This Open Access Article is licensed under a Creative Commons Attribution-Non Commercial 3.0 Unported Licence
 a,
Hankun Chenb,
Jiaxin Moa,
Xiaohong Yuana,
Dawei Wangc,
Xianhui Zhenga and
Wei Zhu
a,
Hankun Chenb,
Jiaxin Moa,
Xiaohong Yuana,
Dawei Wangc,
Xianhui Zhenga and
Wei Zhu