 Open Access Article
Photocatalytic degradation of tetracycline hydrochloride by lanthanum doped TiO2@g-C3N4 activated persulfate under visible light irradiation†
Yan Wang *,
Jingyu Xiu,
Tao Gan,
Haiming Zou and
Feiyue Li
Department of Environmental Science and Engineering, Anhui Science and Technology University, Donghua Road 9#, Fengyang, 233100, China. E-mail: wangyanht@163.com
First published on 14th March 2023
Abstract
In this work, a visible light-driven La/TiO2@g-C3N4 photocatalyst was synthesized for the photodegradation of tetracycline hydrochloride (TCH) in the presence of peroxydisulfate (PDS) in an internal loop-lift reactor. The surface morphology and structure of La/TiO2@g-C3N4 have been characterized by XRD, SEM-EDS, FTIR, XPS, and UV/vis DRS. La/TiO2@g-C3N4 displays outstanding photocatalytic performance and reusability. After four reuse cycles of the vis/La/TiO2@g-C3N4/PDS system, the TCH degradation rate and efficiency still reached 0.083 min−1 and 97.68%, respectively. Reactive species in this system included free radicals SO4˙−, ˙OH, and ˙O2−, as well as non-radicals e−, and h+, as established from the results of chemical quenching experiments. Moreover, a mechanism of action of the vis/La/TiO2@g-C3N4/PDS system for TCH degradation was proposed. The acute toxicity of the reaction solution towards Photobacterium phosphoreum T3 spp. in the vis/La/TiO2@g-C3N4/PDS process increased during the first 60 min and then decreased, illustrating that vis/La/TiO2@g-C3N4/PDS provided an effective and safe method for the removal of TCH.
1. Introduction
Over the past few decades, the widespread and excessive utilization of antibiotics has caused severe serious environmental pollution,1–3 which has been of wide concern due to its risks to human health. Tetracycline hydrochloride (TCH), as one of the extensively used antibiotics for disease prevention and disease cures, has been frequently detected in water environments, such as groundwater, surface water, and even drinking water.4–6 Because TCH is difficult to completely metabolize in the body of humans and animals, most of the antibiotics may enter the aquatic environment with fecal and urine excretion due to the untreated or incomplete processing of feces.5 The problem of antibiotics pollution has seriously threatened the security of human health and living organisms. Thus, it is urgent to rapidly and effectively eliminate TCH.Traditional water treatment technologies (such as membrane filtration and adsorption) cannot effectively destroy TCH from aqueous solution and they just transfer pollutants from one phase to another.7,8 Moreover, the sludge also needs to be further treated. Compared to conventional water treatment methods, photocatalysis and sulfate radical-based advanced oxidation process (SR-AOP) have been demonstrated to be viable, eco-friendly and ideal technology for the degradation of refractory organic pollutants in aquatic environments.9–11 Moreover, photocatalysis and SR-AOP demonstrated the positive synergetic interaction because persulfate (PS) could accept photogenerated electrons (e−) to produce reactive oxygen species, which decreased the recombination of the photogenerated e−–hole (h+) pairs.12
Therefore, the development of the cost-effective photocatalyst during photocatalytic oxidation process is crucial.13 Among the photocatalytic materials, TiO2 has attracted increasing attention due to its excellent photocatalytic activity, suitable, good stability, and nontoxicity.14,15 However, the widespread application of TiO2 was limited by its crucial disadvantages. Due to its large energy bandgap (3.2 eV), TiO2 only could be induced in the ultraviolet (UV) light region, not the visible light.16 The e− and h+ could be prone to rapid recombination, which further reduces the photocatalytic activity.17 To overcome these shortcomings, TiO2 may be subjected to modifications at ESI materials.† 14,16,18 As an excellent support candidate, graphite carbon nitride (g-C3N4) not only has good chemical stability, non-toxicity, and low cost,14,15,19 but also has a small bandgap of 2.7 eV to absorb wide visible light (<460 nm) from the solar spectrum and improve photo-degradation performance of pollutants.15,20,21 Moreover, g-C3N4 has been successfully employed as co-catalyst to effectively increase the photocatalytic performances of TiO2 due to enhancing the light harvesting and decreasing the recombination of electron–hole pairs.22–24
However, TiO2 in TiO2/g-C3N4 could not absorb visible light (>3.2 eV) to produce more the photogenerated e−–h+ pairs for the degradation of pollutants, and it merely accepted the transferred e− from the conduction band (CB) of g-C3N4. Therefore, the researchers used conductive materials (such as Fe, Al, Mg, Ni, Cu, La, and Ag) to prepare a novel all-solid-state Z-scheme photocatalysts.16,25–27 Lanthanum (La), as one of the rare-earth metal elements, has been investigated widely and could effectively improve the photocatalytic activity as well as suppress the recombination of the photogenerated e−–h+ pairs due to their special 4f electronic configuration.13,28,29
In this study, La/TiO2@g-C3N4 was synthesized and its characteristics were evaluated. The photocatalytic performance of as-prepared La/TiO2@g-C3N4 in present of PS was investigated through the degradation of TCH under visible light irradiation. Meanwhile, the degradation mechanism was also discussed.
2. Experimental
2.1. Material
Tetracycline hydrochloride (TCH) were purchased from Shanghai Macklin Biochemical Co., Ltd (Shanghai, China). Tetrabutyl titanate (TBOT), p-benzoquinon (BQ), tert-butanol (TBA), ethanol (EtOH), ethylenediamine tetraacetic acid (EDTA), peroxydisulfate (PDS), oxalic acid, acetonitrile, methanol, potassium dichromate (K2Cr2O7), urea, were bought from Sinopharm Chemical Reagent Co., Ltd, China. 5,5-Dimethyl-1-pryrroline-N-oxide (DMPO) and 2,2,6,6-tethamethyl-4-piperidinol (TMP) were purchased from Shanghai Aladdin Bio-Chem Technology Co., Ltd, China. All reagents were of analytical grade and used without further purification.2.2. Synthesis of La/TiO2@g-C3N4
10 mL TBOT was dropped into 100 mL deionized water, aged for 48 h. And then, the precipitates were thoroughly washed with ethanol and water for three times, respectively. Finally, the white precipitates were dried under vacuum at 80 °C for 12 h to obtain the TiO2 powders.An appropriate amount of urea was placed in a covered crucible and heated at 500 °C in a muffle furnace for 2 h. The product was then left naturally to room temperature. The yellow g-C3N4 block was ground into powder.30
The TiO2@g-C3N4 was prepared as follows: 5 g urea were added in 100 mL deionized water with heating up to 100 °C until it was completely dissolved. Then, 0.45 g TiO2 powder were added into the above solution and ultrasonicated for 30 min, and then dehydrated in an oven at 80 °C 24 h. Subsequently, the dried powders were placed in a covered crucible and heated at 500 °C for 2 h in a muffle furnace. Finally, the product was then left naturally to room temperature and the TiO2@g-C3N4 block was ground into powder.
The La/TiO2@g-C3N4 was prepared as follows: 5 g urea and 0.3 g La(NO3)3 were added in 100 mL deionized water with heating up to 100 °C until it was completely dissolved. Then, 0.45 g TiO2 powder were added into the above mixed solution and ultrasonicated for 30 min, and then dehydrated in an oven at 80 °C 24 h. Subsequently, the dried powders were placed in a covered crucible and heated at 500 °C for 2 h in a muffle furnace. Finally, the product was then left naturally to room temperature and the La/TiO2@g-C3N4 block was ground into powder.
2.3. TCH degradation experiments
Batch photocatalytic experiments were performed an internal loop-airlift reactor (ALR) which has been described in a previous report.31 An Xe lamp with a cut-off filter (≥400 nm) (Heraeus-6, 300 W) was used to simulate sunlight and fixed inside a cylindrical quartz tube at room temperature. Firstly, an appropriate amount of catalyst was dispersed into 1.5 L 20 mg L−1 TCH solution with the compressed gas (40 mL min−1) from the bottom of the ALR to maintain the catalyst particles circulation throughout the reactor. After that, a certain amount of PDS was added to the reactor to initiate the reaction under Xe lamp. 3 mL of the solution was quickly taken out from the reactor at each determined time interval, filtrated with a 0.22 μm membrane, and 0.1 mmol L−1 sodium thiosulfate solution (Na2S2O3) was added to terminate the reaction. Four cycles were carried out consecutively to investigate the stability and reusability of La/TiO2@g-C3N4.2.4. Analytical methods
The residual concentration of TCH in the filtrate was determined by high-performance liquid chromatography (HPLC, LC-20AB) with an SPD-10A UV/vis detector at 365 nm. Equipped with a shim-pack VP-ODS C18 (4.6 mm × 250 mm, 5 μm) was employed for separation. An acetonitrile/0.01 mol L−1 aqueous oxalic acid mixture with a 30![[thin space (1/6-em)]](https://www.rsc.org/images/entities/char_2009.gif) :
:![[thin space (1/6-em)]](https://www.rsc.org/images/entities/char_2009.gif) 70 (v/v) ratio was used as mobile phase at 25 °C and a constant flow rate was set to 1.0 mL min−1. The removal rate (R) of TCH was calculated according to eqn (1):
70 (v/v) ratio was used as mobile phase at 25 °C and a constant flow rate was set to 1.0 mL min−1. The removal rate (R) of TCH was calculated according to eqn (1):| R (%) = (1 − C/C0) × 100 | (1) |
2.5. Acute toxicity assay
Active toxicities were determined towards luminescent bacteria based on the Chinese standard for water quality determination of acute toxicity (GB/T 15441-1995). Each test was repeated in six times.Freeze-dried powder of Photobacterium phosphoreum T3 spp. was purchased from the institute of soil science, Chinese academy of sciences (Nanjing, China) and was refreshed with 3% NaCl solution before active toxicity test. The variation of luminescence was investigated with a toxicity determinator (DXY-3, institute of soil science, Chinese academy of sciences, Nanjing, China). In a blank test, the effluent during the TCH degradation process was replaced by deionized water. The inhibition rate of luminosity (X) was measured according to the following equation (eqn (2)):
| X (%) = (1 − luminosity of sample/luminosity of CK) × 100 | (2) |
3. Results and discussion
3.1. Characterizations
The characteristic morphology of La/TiO2@g-C3N4 was observed by scanning electron microscopy (SEM). As shown in Fig. 1a, the irregular sheet-like morphology of g-C3N4 was exhibited and the small-sized TiO2 particles were attached to the g-C3N4 sheets. The energy dispersive X-ray spectroscopy (EDS) elemental mapping images were used to demonstrate the elemental composition of La/TiO2@g-C3N4 and the results are shown in Fig. 1b–f. It was confirmed from Fig. 1b–f that the existence of C, O, N, Ti and La five elements in the La/TiO2@g-C3N4 particles. EDX analysis revealed the percentage composition of g-C3N4, TiO2@g-C3N4, and La/TiO2@g-C3N4 and the results were shown in Table S1.† The carbon and nitrogen ratio were approximately 3![[thin space (1/6-em)]](https://www.rsc.org/images/entities/char_2009.gif) :
:![[thin space (1/6-em)]](https://www.rsc.org/images/entities/char_2009.gif) 4 in g-C3N4, TiO2@g-C3N4, and La/TiO2@g-C3N4 when TiO2
4 in g-C3N4, TiO2@g-C3N4, and La/TiO2@g-C3N4 when TiO2![[thin space (1/6-em)]](https://www.rsc.org/images/entities/char_2009.gif) :
:![[thin space (1/6-em)]](https://www.rsc.org/images/entities/char_2009.gif) g-C3N4 was about 2
g-C3N4 was about 2![[thin space (1/6-em)]](https://www.rsc.org/images/entities/char_2009.gif) :
:![[thin space (1/6-em)]](https://www.rsc.org/images/entities/char_2009.gif) 3. It could be known from Table S1† that the percentage of La in La/TiO2@g-C3N4 was approximately 4%.
3. It could be known from Table S1† that the percentage of La in La/TiO2@g-C3N4 was approximately 4%.
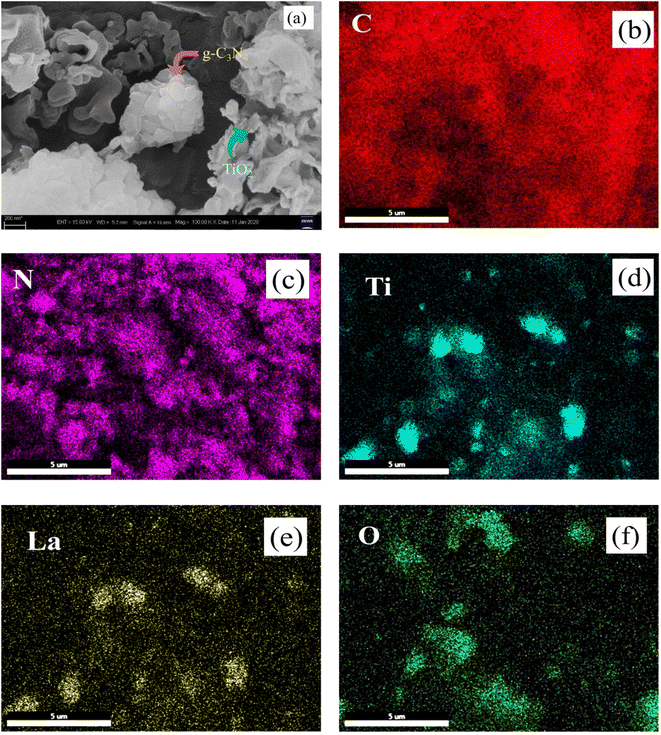 | ||
| Fig. 1 SEM of La/TiO2@g-C3N4 (a) and EDS elemental mapping results of C (b), N (c), Ti (d), La (e), and O (f) elements on La/TiO2@g-C3N4. | ||
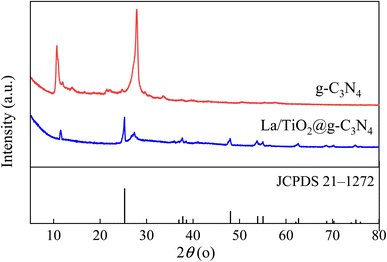
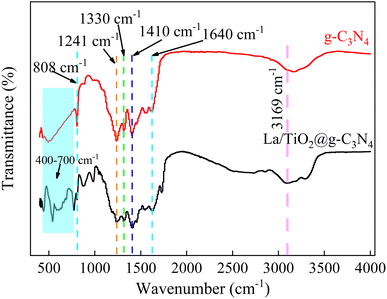
Fig. 2 displays the XRD patterns of pure g-C3N4 and La/TiO2@g-C3N4 and in both of g-C3N4 and La/TiO2@g-C3N4, the peaks positioned at 2θ value of 13.1° (100) and 27.3° (002) belonged to the interlayer structural packing and the interplanar stacking peaks of the aromatic systems, respectively,32,33 which demonstrated that g-C3N4 was successfully prepared. The characteristic peaks at 2θ of 25.3°, 37.8°, 48.0°, 62.7° and 75.2° corresponded to the crystal planes of (101), (004), (200), (204) and (215) of the TiO2 (JCPDS 21-1272), respectively.25,32,34,35 No La2O3 or La(OH)3 diffraction peaks were observed, which may be due to the low La content in La/TiO2@g-C3N4. The FT-IR analysis was employed to further measure the surface properties of La/TiO2@g-C3N4 and g-C3N4 and the results were shown in Fig. 3. The peak at 3169 cm−1 was attributed to the stretching vibration of NH2 or NH groups, which further illustrated the presence of incomplete carbonization of amino.36 The peak at 1633 cm−1 is typically related to the stretching of C![[double bond, length as m-dash]](https://www.rsc.org/images/entities/char_e001.gif) N when the characteristic absorption peaks at 1241 cm−1, 1330 cm−1, 1410 cm−1, and 1640 cm−1 were assigned to the stretching vibration of the C–N heterocycles.11,36 And the strong vibration peak at 808 cm−1 was observed s-triazine ring structure in g-C3N4.36,37 The distinct stretching vibrations at 400–700 cm−1 was ascribed to the fingerprint region of TiO2 and represented the presence of Ti–O and Ti–O–Ti bonds.36 Moreover, the vibration peak of s-triazine ring structure at 808 cm−1 shifted slightly to 804 cm−1 compared with the g-C3N4, which also confirms the heterojunction interfaces between the TiO2 and g-C3N4.24
N when the characteristic absorption peaks at 1241 cm−1, 1330 cm−1, 1410 cm−1, and 1640 cm−1 were assigned to the stretching vibration of the C–N heterocycles.11,36 And the strong vibration peak at 808 cm−1 was observed s-triazine ring structure in g-C3N4.36,37 The distinct stretching vibrations at 400–700 cm−1 was ascribed to the fingerprint region of TiO2 and represented the presence of Ti–O and Ti–O–Ti bonds.36 Moreover, the vibration peak of s-triazine ring structure at 808 cm−1 shifted slightly to 804 cm−1 compared with the g-C3N4, which also confirms the heterojunction interfaces between the TiO2 and g-C3N4.24
A wide X-ray photoelectron spectrum (XPS) was employed to investigate the elemental composition and surface chemical states of the fresh La/TiO2@g-C3N4 and after it was used for 1 time. The XPS survey spectrum of La/TiO2@g-C3N4 was shown in Fig. 4a and the XPS spectra of the C 1s, N 1s, O 1s, Ti 2p, and La 3d were presented in Fig. 4b–f. The two characteristic peaks of C 1s exhibited in Fig. 4b at 284.7 eV and 288.4 eV are correspond to the sp2 carbon (C![[double bond, length as m-dash]](https://www.rsc.org/images/entities/char_e001.gif) C) and the sp3 C
C) and the sp3 C![[double bond, length as m-dash]](https://www.rsc.org/images/entities/char_e001.gif) N bonds of the synthesized g-C3N4, respectively.11,38 The N 1s spectrum in Fig. 4c could be divided into two main characteristic peaks at 398.4 eV and 400.7 eV, which corresponded to C
N bonds of the synthesized g-C3N4, respectively.11,38 The N 1s spectrum in Fig. 4c could be divided into two main characteristic peaks at 398.4 eV and 400.7 eV, which corresponded to C![[double bond, length as m-dash]](https://www.rsc.org/images/entities/char_e001.gif) N–C bonds and C–N–H bonds.36,38,39 Fig. 4d presented the Ti 2p spectra of TiO2. It is clear that two peaks at 458.8 eV and 464.4 eV were ascribed to the Ti 2p3/2 and Ti 2p1/2, which confirmed the existence of TiO2.36,39 As shown in Fig. 4e, the La 3d spectrum displayed the splitting of La 3d5/2 and La 3d3/2 at around 835.7 eV and 852.2 eV, respectively. Therefore, the La 3d XPS profile observed in La/TiO2@g-C3N4 illustrated that all the La species were present in its oxide form.13,40 The O 1s XPS spectra and peak separation details of La/TiO2@g-C3N4 are presented in Fig. 4f and the O 1s spectra primarily consisted of two characteristic absorption peaks located close to 530.3 eV and 531.6 eV, corresponding to the lattice oxygen of TiO2 and La2O3, respectively.13
N–C bonds and C–N–H bonds.36,38,39 Fig. 4d presented the Ti 2p spectra of TiO2. It is clear that two peaks at 458.8 eV and 464.4 eV were ascribed to the Ti 2p3/2 and Ti 2p1/2, which confirmed the existence of TiO2.36,39 As shown in Fig. 4e, the La 3d spectrum displayed the splitting of La 3d5/2 and La 3d3/2 at around 835.7 eV and 852.2 eV, respectively. Therefore, the La 3d XPS profile observed in La/TiO2@g-C3N4 illustrated that all the La species were present in its oxide form.13,40 The O 1s XPS spectra and peak separation details of La/TiO2@g-C3N4 are presented in Fig. 4f and the O 1s spectra primarily consisted of two characteristic absorption peaks located close to 530.3 eV and 531.6 eV, corresponding to the lattice oxygen of TiO2 and La2O3, respectively.13
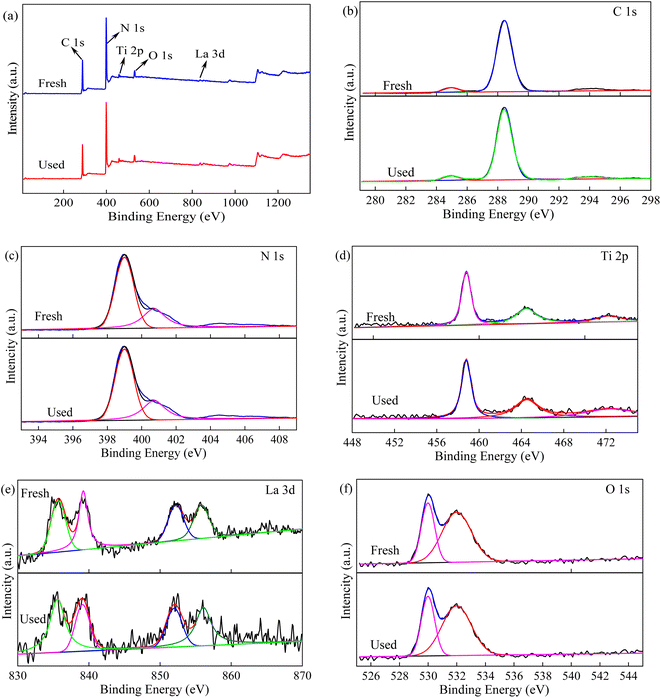 | ||
| Fig. 4 XPS spectra and fitted data of La/TiO2@g-C3N4: survey scan (a), C 1s (b), N 1s (c), Ti 1s (d), La 3d (e), and O 1s (f). | ||
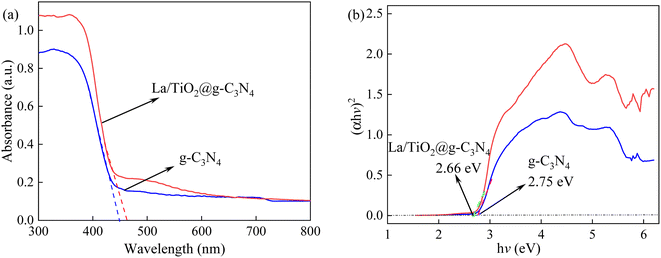
The N2 adsorption–desorption isotherm was employed to understand the Brunauer–Emmett–Teller (BET) specific surface areas (SBET), pore volume and pore diameter distribution of TiO2, g-C3N4, and La/TiO2@g-C3N4 and the result was shown in Table S2.† According to the BET theory, pure TiO2 had a high surface area of 43.1 m2 g−1, while g-C3N4 had a relatively low surface area of 7.3 m2 g−1. This represented that TiO2 would be able to better capture the molecule to be degraded than that of g-C3N4. Interestingly, SBET of La/TiO2@g-C3N4 (14.2 m2 g−1) was closer to g-C3N4 due to the low content of TiO2 in La/TiO2@g-C3N4. On the contrary, pore diameter of g-C3N4 was 32 nm and bigger than that of TiO2 (7.1 nm) and La/TiO2@g-C3N4 (13.98 nm). It was noteworthy that the pore volume of La/TiO2@g-C3N4 (0.046 cm3 g−1) is also higher than those of TiO2 (0.035 cm3 g−1) and g-C3N4 (0.027 cm3 g−1). These results clearly illustrated that the preparation process of La/TiO2@g-C3N4 possessed mesoporous structure, which could offer massive reactive surface sites to activate PDS. The UV-vis diffuse reflectance spectra (DRS) was employed to estimate the light-absorption capability and the band gap of g-C3N4 and La/TiO2@g-C3N4 as well as the results were shown in Fig. 5. According to the obtained results of the DRS as displayed in Fig. 5a, the absorbances of g-C3N4 and La/TiO2@g-C3N4 were in the visible region and the basic absorption edge of g-C3N4 appeared near 450 nm. Interestingly, the UV-visible absorption wavelength edge of the La/TiO2@g-C3N4 was around 465 nm due to the presence of La2O3 and TiO2. The band gap energies (Eg) of g-C3N4 and La/TiO2@g-C3N4 was calculated by the following standard formula (eqn (3)) and were shown in Fig. 5b.
| (αhv)2 = A(hv − Eg) | (3) |
In order to examine the charge separation and migration of the photo-generated electron–hole pairs, the transient photocurrent responses and electrochemical impedance spectroscopy (EIS) are employed and the results were shown in Fig. S1.† It could be seen from Fig. S1a,† the catalysts responded very fast and reached the equilibrium in seconds under visible light irradiation when the light is switched on and off. Simultaneously, the transient photocurrent responses were recorded. Compared to g-C3N4 and TiO2, La/TiO2@g-C3N4 demonstrated a stronger transient photocurrent response. This may be attributed to the enhanced charge separation and migration efficiency resulting from the efficient heterojunction between TiO2 and g-C3N4 with La.
It is generally known that the smaller semicircle radius represents a faster charge transfer. The Nyquist plots of g-C3N4 and TiO2, La/TiO2@g-C3N4 were shown in Fig. S1b† and the arc radius of La/TiO2@g-C3N4 was obviously smaller than that of g-C3N4 and TiO2. It further illustrated that the charge transportation was increased due to the synergy between two semiconductors TiO2 and g-C3N4.
3.2. Photocatalytic activity testing
To investigate the impact of La on the photocatalytic activity, the TCH degradation rate were studied under visible light irradiation and the results were presented at Fig. 6 and Table S3.† The adsorption of La/TiO2@g-C3N4 was negligible for TCH degradation due to the low specific surface areas (Table S2†). The negligible TCH removal was obtained with visible light irradiation. The results apparently demonstrated the light irradiation was not powerful enough to generate efficient free radical to degrade TCH and TCH was photo-stable under visible light illumination on account of the negligible change (<4%). About 12.32% removal of TCH was obtained with only 6 mmol L−1 PDS due to the limited oxidation capability of PDS (E0 = 2.01 V).41,42 When 0.5 g L−1 La/TiO2@g-C3N4 was added to TCH in the presence of PDS, the degradation rate was significantly improved to 43.91%. The photo-degradation efficiency of TCH by the combination of visible light and La/TiO2@g-C3N4 was about 28.44% after reaction for 60 min, which explained that visible light could promote the photocatalysis of La/TiO2@g-C3N4 to generate effective free radicals. As illustrated in Fig. 6, the degradation rate of TCH by vis/PDS system was 17.79% and very low within 60 min, which illustrated that TCH was quite recalcitrant to degradation and easily accumulated in the environment. However, when TiO2 or La/TiO2 appeared separately in the vis/PDS system, the degradation rates of TCH were improved to 27.68% and 37.10%, respectively. In addition, the degradation rates of TCH reached 95.52% in the vis/La/TiO2@g-C3N4/PDS system, which is higher than the TCH degradation efficiencies in the La/TiO2@g-C3N4/PDS and vis/La/TiO2@g-C3N4 systems. Importantly, it is also higher than the sum efficiencies of the La/TiO2@g-C3N4/PDS and vis/La/TiO2@g-C3N4 systems, indicating that coupling visible light with La/TiO2@g-C3N4 had a synergetic effect on PDS activation for TCH degradation.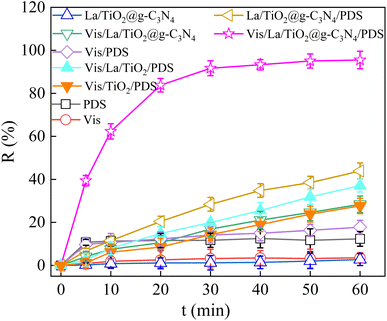 | ||
| Fig. 6 Degradation of TCH under different reaction conditions (C0 = 30 mg L−1, pH0 = 6, PDS = 6 mmol L−1, La/TiO2@g-C3N4 = 0.5 g L−1, λ ≥ 400 nm). | ||
Meanwhile, the degradation of TCH was simulated by pseudo-first-order kinetic equation by the formula given below,
| ln(Ct/C0) = −kt | (4) |
3.3. The effect of reaction conditions on the TCH degradation
As is well known, the initial pH value (pH0) of pollutant solution plays an important role in the photocatalytic oxidation system. The effect of initial pH experiments on the TCH degradation were carried out at pH0 3, 5, 6, 7 and 9. As depicted in Fig. 7a and Table S3,† the degradation rate of TCH increases obviously with increasing pH0 from 3 to 6, as well as the highest removal efficiency reached 95.52% and 0.083 min−1 when pH0 was 6. The pKa values for TCH are 3.3, 7.7 and 9.7 and the TCH molecule could produce four different species in different pH solution, including TCH3+, TCH2, TCH− and TC2−.45,46 On the one hand, the increase of pH0 will increase the electrostatic repulsion between the TCH and catalyst surface charges, which results in lower degradation.45 On the other hand, the adverse effect of H+ on PDS activation process resulted in the lower removal efficiency.42,47 However, the degradation of TCH decreased obviously when the pH ranged from 6 to 9, and the removal efficiency of TCH decreased from 95.52% to 80.27%, which was due to the lifetime of SO4˙− and ˙OH are shortened with pH above 6.The TCH removal under various La/TiO2@g-C3N4 dosage was investigated (Fig. 7b) at 6 mmol L−1 PDS concentration and initial pH 6. When the La/TiO2@g-C3N4 loading was 0.2, 0.5, 1 and 1.5 g L−1, TCH was degraded by 22.07%, 93.86%, 95.52% and 98.26%, as well as the kinetic constant ascended from 0.048 to 0.099 min−1. Higher dosage of La/TiO2@g-C3N4 would provide more active sites for PDS activation and photogenerated e−–h+ pairs, which further formed TCH elimination.
The effect of PDS concentrations (2, 4, 6, and 8 mmol L−1) on TCH removal was investigated (Fig. 7c). The La/TiO2@g-C3N4 loading was 0.5 g L−1, the initial pH was 6, and the initial TCH concentration was 30 mg L−1. When the PDS concentration increased from 2 to 8 mmol L−1, the removal rate of TCH after 60 min increased from 86.03% to 97.18%. This can be ascribed to a higher generation of more reactive species (such as SO4˙− and ˙OH) to accelerate the TCH degradation process.48
Different initial TCH concentrations (10, 20, 30 and 40 mg L−1) were used to study its effect on photocatalytic degradation efficiency. The La/TiO2@g-C3N4 loading was 0.5 g L−1, the PDS concentration was 6 mmol L−1, and the initial pH was 6. The results are shown in Fig. 7d. When the initial TCH concentration increased from 10 to 40 mg L−1, the TCH degradation efficiency decreased from 97.29% to 90.36%. It can be ascribed to the following reasons: (i) the surface of La/TiO2@g-C3N4 was gradually covered by the intermediates generated during the photocatalytic degradation process, which would reduce the generation of e−–h+ pairs and inhibit the formation of reactive species. (ii) The increasing of initial concentration would increase more TCH and its byproducts in the solution, which would bring the competition between TCH and its intermediates for active species as well as could diminish the photocatalytic degradation efficiency.45,49
3.4. Stability and reusability of La/TiO2@g-C3N4
It is widely known that the reusability and stability of a catalyst is one of the most important factors for the actual applicability. In order to confirm the reusability of La/TiO2@g-C3N4, four cyclic experiments were carried out in the degradation of TCH under the same condition of PDS, pH and visible light and the result was shown in Fig. 8. After six cyclic experiments, the TCH degradation efficiency were 95.52%, 95.28%, 95.05%, 94.70%, 95.30%, and 94.87%, respectively, when the TCH degradation rate constants were 0.084, 0.083, 0.083, 0.082, 0.079, and 0.070 min−1. It can be seen that the TCH removal remained roughly the same when the TCH degradation rate slightly reduced for six cycles use. Meanwhile, it also illustrated that the catalytic activity of La/TiO2@g-C3N4 did not decrease significantly. Furthermore, the results of the structural stability investigation of La/TiO2@g-C3N4 by XPS (Fig. 4) proved insignificant changes compared with the fresh catalyst after the sixth run. According to the XPS data of fresh and used La/TiO2@g-C3N4, the amount of La dopant on the surface of La/TiO2@g-C3N4 decreased from 7.52% to 7.26% when that of Ti composition decreased from 2.31% to 2.02%, but the amount of La dopant and Ti composition on the surface of La/TiO2@g-C3N4 did not declined obviously, which further confirmed the good reusability and stability of La/TiO2@g-C3N4.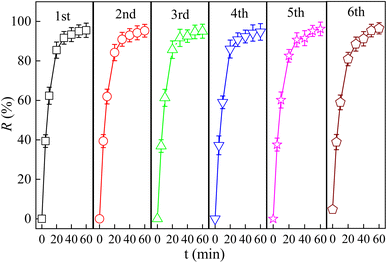 | ||
| Fig. 8 Repeated photocatalytic degradation of TCH by La/TiO2@g-C3N4 (C0 = 30 mg L−1, pH0 = 6, PDS = 6 mmol L−1, La/TiO2@g-C3N4 = 0.5 g L−1, λ ≥ 400 nm). | ||
3.5. Possible degradation mechanism
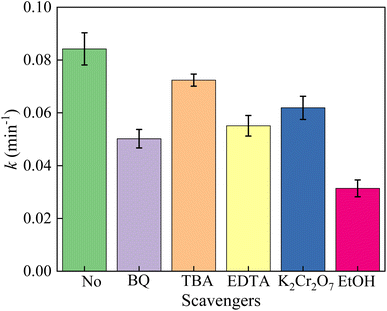
In order to reveal the degradation mechanism of the photocatalytic oxidation process in the vis/La/TiO2@g-C3N4/PDS system, a series of radical quenching experiments were conducted to identify the main reactive radicals for the TCH degradation. TBA, EtOH, BQ, K2Cr2O7 and EDTA were employed to quench ˙OH, SO4˙− and ˙OH, superoxide radical (˙O2−), e− and h+, respectively.11,43,47,48 As shown in Fig. 9, after the addition of BQ, the kinetic constant of the degradation TCH decreased significantly from 0.084 min−1 to 0.050 min−1, which indicated that ˙O2− had a major contribution to the TCH degradation. When TBA and EtOH were added into the vis/La/TiO2@g-C3N4/PDS system, the kinetic constant of the TCH degradation decreased to 0.066 min−1 and 0.031 min−1, respectively. This phenomenon indicated SO4˙− and ˙OH both were involved in the TCH degradation. The addition of EDTA and K2Cr2O7 also had a certain inhibitory effect on the photocatalytic degradation system, the kinetic constant of the TCH degradation decreased to 0.035 min−1 and 0.062 min−1, which h+ and e− played important roles in the degradation of TCH in the vis/La/TiO2@g-C3N4/PDS system. Here, the role of dissolved oxygen was observed by eliminating oxygen with bubbling N2. It can be seen from Fig. 10 that the addition of N2 reduced the TCH degradation rate from 95.52% to 83.74% and the kinetic constant declined from 0.084 to 0.0304 min−1. Therefore, the results illustrated that the decrease of dissolved oxygen concentration reduced the production of ˙O2−, which then decreased the degradation of TCH. Interestingly, as circulating gas, O2 replaced air, but the TCH degradation rate only increased from 95.52% to 98.09% and the kinetic constant enhanced from 0.084 to 0.102 min−1. The active sites provided by La/TiO2@g-C3N4 as well as h+ and e− generated by visible light were constant in the vis/La/TiO2@g-C3N4/PDS system, the increase of dissolved oxygen concentration did not significantly improve the production of ˙O2− for the TCH degradation.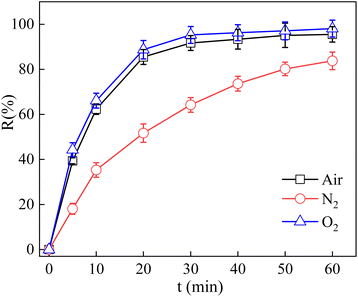 | ||
| Fig. 10 Effect of reaction conditions for the degradation of TCH (C0 = 30 mg L−1, pH0 = 6, PDS = 6 mmol L−1, La/TiO2@g-C3N4 = 0.5 g L−1, λ ≥ 400 nm). | ||
It is widely reported that a low conduction band edge (CB) and high valence band edge (VB) of a photocatalyst would promote the degradation efficiency of organic pollutants.15,34 According to the band edge potential calculation, the approximated conduction band position (ECB, eV) and valence band position (EVB, eV) were calculated through the following equations:12,17,39
| EVB = χ − E + 0.5Eg | (5) |
| ECB = EVB + Eg | (6) |
Based on the above results and other literature, the possible mechanism of TCH degradation by La/TiO2@g-C3N4 activation of PDS under visible light irradiation was proposed in Fig. 11. Under visible light irradiation, e−–h+ pairs are exposed to the surface of TiO2 and g-C3N4. Owing to the different band edge potential, the e− in the conduction band of TiO2 is compounded with h+ on the valence band of g-C3N4 via metal La. Since the ECB of g-C3N4 (−1.14 eV) was more negative against the redox potential of O2/˙O2− (−0.33 V vs. NHE),34,35 O2 could accept e− on the g-C3N4 conduction band generated ˙O2−, respectively. The ECB of TiO2 (2.92 eV) was more positive than the standard redox potential of ˙OH/H2O (2.38 V vs. NHE),36 thus H2O and h+ on the TiO2 price band formed ˙OH. Therefore, ˙O2−, e−, h+, ˙OH and SO4˙− are present during the reaction, which degrade pollutants into CO2 and H2O.
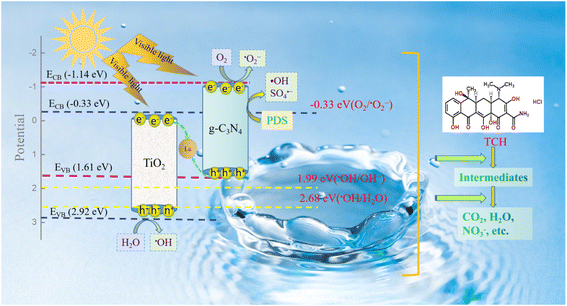 | ||
| Fig. 11 Schematic illustration of the main oxidant generation mechanism by La/TiO2@g-C3N4 activate PDS under visible light radiation. | ||
3.6. Toxicity evaluation of effluent
The complete degradation of TCH did not mean that the biotoxicity of effluent (including TCH and its by-products) was removed. Thus, the toxicity changes of effluent were explored by luminescent bacteria and the result was shown in Fig. 12. It could be seen from Fig. 12 that the luminescence inhibition ratio increases from 10% to 97% within the first 60 min while the removal rate of TCH achieved 95.52%. This phenomenon proved that some toxicity intermediates were produced at the beginning of the TCH degradation. And then the luminescence inhibition ratio decreased gradually to nearly 4% at 210 min, demonstrating that TCH and the intermediates were reduced significantly into low/non-toxic compounds by the vis/La/TiO2@g-C3N4/PDS. Hence, the vis/La/TiO2@g-C3N4/PDS system was ecotoxicological safety.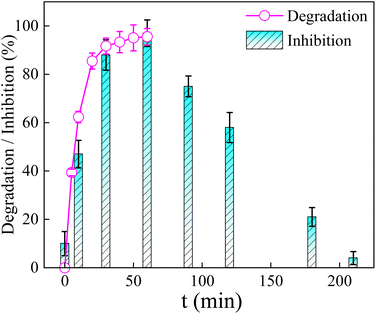 | ||
| Fig. 12 Changes of acute toxicity and degradation rate during TCH degradation process (C0 = 30 mg L−1, pH0 = 6, PDS = 6 mmol L−1, La/TiO2@g-C3N4 = 0.5 g L−1, λ ≥ 400 nm). | ||
4. Conclusion
La/TiO2@g-C3N4 was successfully prepared and was applied as efficient PDS activators to reached efficient TCH elimination under visible light irradiation in an internal loop-lift reactor. The photocatalytic performance of La/TiO2@g-C3N4 was estimated based on its structure, activity, stability and reusability towards TCH under visible light induced process. The catalysts displayed excellent degradation performance and the mechanism was revealed that e−, h+, ˙O2−, ˙OH and SO4˙− were responsible for the removal of TCH. The vis/La/TiO2@g-C3N4/PDS system was efficient in a wide pH range. In addition, the acute toxicity of the effluent during TCH degradation process firstly increased to 97% after 60 min reaction, and then gradually decreased to 4%. In sum, the development of La/TiO2@g-C3N4 is an effective photocatalyst for the remediation of antibiotic wastewater.Author contributions
Yan Wang: investigation, methodology, data curation, formal analysis, visualization, writing – original draft, writing – review & editing, supervision. Tao Gan: investigation, data curation. Jingyu Xiu: investigation, data curation. Feiyue Li: conceptualization, data curation, methodology. Haiming Zou: formal analysis, funding acquisition, supervision.Conflicts of interest
There are no conflicts to declare.Acknowledgements
This study was supported by Natural Science Research Project of Anhui Educational Committee (2022AH051628); Anhui Provincial Natural Science Foundation (No. 2008085ME169); Outstanding Youth Scientific Research Project of Universities in Anhui Province (2022AH020089); Innovation and Entrepreneurship Training Program for College Students in Anhui Province (S202110879254, S202110879251).References
- W. Chen, J. Huang, Z. C. He, X. Ji, Y. F. Zhang, H. L. Sun, K. Wang and Z. W. Su, Sep. Purif. Technol., 2021, 277, 119461 CrossRef CAS.
- J. Zheng, L. Li, Z. Dai, Y. Tian, T. Fang, S. Xin, B. Zhu, Z. Liu and L. Nie, Appl. Surf. Sci., 2022, 571, 151305 CrossRef CAS.
- Y. Wang, T. Gan, J. Xiu, G. Liu and H. Zou, RSC Adv., 2022, 12, 24088–24100 RSC.
- Q. Xu, P. Wang, Z. Wang, J. Shen, X. Han, X. Zheng, Y. Wei, C. Li and K. Song, Colloids Surf., A, 2022, 648, 129392 CrossRef CAS.
- Y. Yang, Z. Bian, L. Zhang and H. Wang, J. Hazard. Mater., 2022, 427, 127866 CrossRef CAS PubMed.
- Y. Zhang, J. Zhou, X. Chen, L. Wang and W. Cai, Chem. Eng. J., 2019, 369, 745–757 CrossRef CAS.
- C. H. Nguyen, C. C. Fu, D. Y. Kao, T. T. V. Tran and R.-S. Juang, J. Taiwan Inst. Chem. Eng., 2020, 112, 259–270 CrossRef CAS.
- Y. Zhang, Y. Li, W. Xu, M. Cui, M. Wang, B. Chen, Y. Sun, K. Chen, L. Li, Q. Du, X. Pi and Y. Wang, Chem. Eng. Res. Des., 2022, 183, 424–438 CrossRef CAS.
- H. Sun, F. Guo, J. Pan, W. Huang, K. Wang and W. Shi, Chem. Eng. J., 2021, 406, 126844 CrossRef CAS.
- H. Zhu, B. Yang, J. Yang, Y. Yuan and J. Zhang, Chemosphere, 2021, 276, 130217 CrossRef CAS PubMed.
- Y. Li, S. Li, C. Chao, S. Yao, D. Zhang and Q. Chen, J. Alloys Compd., 2022, 926, 166904 CrossRef CAS.
- L. Luo, D. Meng, L. He, X. Wang, L. Xia, X. Pan, F. Jiang, H. Wang and J. Dai, Chem. Eng. J., 2022, 446, 137325 CrossRef CAS.
- Y. Chen, M. Ran, Z. Zhou, X. Han, H. Zhu and J. Gu, J. Clean. Prod., 2021, 321, 129014 CrossRef CAS.
- N. H. Mohamad Idris, K. Y. Cheong, B. J. Kennedy, T. Ohno and H. L. Lee, J. Environ. Chem. Eng., 2022, 10, 107549 CrossRef CAS.
- S. Ni, Z. Fu, L. Li, M. Ma and Y. Liu, Colloids Surf., A, 2022, 649, 129475 CrossRef CAS.
- J. Lee, S. Seong, S. Jin, Y. Jeong and J. Noh, J. Ind. Eng. Chem., 2021, 100, 126–133 CrossRef CAS.
- Y. Cui, J. Zheng, Z. Wang, B. Li, Y. Yan and M. Meng, J. Environ. Chem. Eng., 2021, 9, 106666 CrossRef CAS.
- E. Weidner, K. Siwińska-Ciesielczyk, D. Moszyński, T. Jesionowski and F. Ciesielczyk, Environ. Technol. Innov., 2021, 24, 102016 CrossRef CAS.
- M. Sher, M. Javed, S. Shahid, O. Hakami, M. A. Qamar, S. Iqbal, M. M. Al-Anazy and H. B. Baghdadi, J. Photochem. Photobiol. A., 2021, 418, 113393 CrossRef CAS.
- B. Palanivel, M. Lallimathi, B. Arjunkumar, M. Shkir, T. Alshahrani, K. S. Al-Namshah, M. S. Hamdy, S. Shanavas, M. Venkatachalam and G. Ramalingam, J. Environ. Chem. Eng., 2021, 9, 104698 CrossRef CAS.
- X. Li, G. Huang, X. Chen, J. Huang, M. Li, J. Yin, Y. Liang, Y. Yao and Y. Li, Sci. Total Environ., 2021, 792, 148462 CrossRef CAS PubMed.
- X. Du, X. Bai, L. Xu, L. Yang and P. Jin, Chem. Eng. J., 2020, 384, 123245 CrossRef CAS.
- M. Roškarič, G. Žerjav, J. Zavašnik and A. Pintar, J. Environ. Chem. Eng., 2022, 10, 107656 CrossRef.
- M. Vijayan, V. Manikandan, C. Rajkumar, A. A. Hatamleh, B. K. Alnafisi, G. Easwaran, X. Liu, K. Sivakumar and H. Kim, Chemosphere, 2022, 311, 136928 CrossRef PubMed.
- Z. Hu, D. Shi, G. Wang, T. Gao, J. Wang, L. Lu and J. Li, Appl. Surf. Sci., 2022, 601, 154167 CrossRef CAS.
- I. Ahmad, Sep. Purif. Technol., 2020, 251, 117372 CrossRef CAS.
- M. A. Qamar, M. Javed, S. Shahid and M. Sher, Mater. Res. Bull., 2022, 147, 111630 CrossRef CAS.
- Y. Cong, B. Tian and J. Zhang, Appl. Catal., B, 2011, 101, 376–381 CrossRef CAS.
- S. Preetha, S. Ramamoorthy, R. Pillai, B. Narasimhamurthy and I. C. Lekshmi, Mater. Today, 2022, 62, 5396–5401 CAS.
- S. S. Wong, M. J. Hülsey, H. An and N. Yan, Catal. Sci. Technol., 2022, 12, 5217–5228 RSC.
- Y. Wang, T. Gan, J. Xiu, G. Liu and H. Zou, RSC Adv., 2022, 12, 24088–24100 RSC.
- P. Karthik, P. Gowthaman, M. Venkatachalam and M. Saroja, Inorg. Chem. Commun., 2020, 119, 108060 CrossRef CAS.
- M. Dung Nguyen, T. Binh Nguyen, L. Hai Tran, T. Giang Nguyen, I. Fatimah, E. Prasetyo Kuncoro and R. A. Doong, Chem. Eng. J., 2023, 452, 139249 CrossRef CAS.
- A. Kane, L. Chafiq, S. Dalhatou, P. Bonnet, M. Nasr, N. Gaillard, J. M. D. Dikdim, G. Monier, A. A. Assadi and H. Zeghioud, J. Photochem. Photobiol. A., 2022, 430, 113971 CrossRef CAS.
- I. M. Sundaram, S. Kalimuthu, P. G. Priya, K. Sekar and S. Rajendran, Int. J. Hydrogen Energy, 2022, 47, 3709–3721 CrossRef CAS.
- Y. Cao, G. Yuan, Y. Guo, X. Hu, G. Fang and S. Wang, Appl. Surf. Sci., 2022, 600, 154169 CrossRef CAS.
- L. Wang, X. Ma, G. Huang, R. Lian, J. Huang, H. She and Q. Wang, J. Environ. Sci., 2022, 112, 59–70 CrossRef CAS PubMed.
- Z. Wang, H. Wang, Z. Wang, D. Huang, H. Qin, Y. He, M. Chen, G. Zeng and P. Xu, Colloids Surf., A, 2021, 626, 127024 CrossRef CAS.
- T. Narkbuakaew, S. Sattayaporn, N. Saito and P. Sujaridworakun, Appl. Surf. Sci., 2022, 573, 151617 CrossRef CAS.
- B. M. Jun, S. S. Elanchezhiyan, Y. Yoon, D. Wang, S. Kim, S. Muthu Prabhu and C. M. Park, Chem. Eng. J., 2020, 393, 124733 CrossRef CAS.
- C. Cai, J. Liu, Z. Zhang, Y. Zheng and H. Zhang, Sep. Purif. Technol., 2016, 165, 42–52 CrossRef CAS.
- R. Li, H. Hu, Y. Ma, X. Liu, L. Zhang, S. Zhou, B. Deng, H. Lin and H. Zhang, J. Clean. Prod., 2020, 276, 124246 CrossRef CAS.
- B. Gao, M. Dou, J. Wang, S. Li, D. Wang, L. Ci and Y. Fu, Chem. Eng. J., 2021, 426, 131677 CrossRef CAS.
- M. Abu Hanif, J. Akter, M. Akherul Islam, I. Lee, K. Prasad Sapkota, S. Shrestha, A. Pandey, N. Gyawali and J. Ryang Hahn, J. Photochem. Photobiol. A., 2022, 431, 114066 CrossRef CAS.
- T. Zhang, Y. Liu, Y. Rao, X. Li, D. Yuan, S. Tang and Q. Zhao, Chem. Eng. J., 2020, 384, 123350 CrossRef CAS.
- Y. Wang, H. Zhang, J. Zhang, C. Lu, Q. Huang, J. Wu and F. Liu, J. Hazard. Mater., 2011, 192, 35–43 CAS.
- S. Xiao, J. Zhou, D. Liu, W. Liu, L. Li, X. Liu and Y. Sun, Chem. Phys. Lett., 2022, 805, 139944 CrossRef CAS.
- Q. Wang, Y. Mei, R. Zhou, S. Komarneni and J. Ma, Colloids Surf., A, 2022, 648, 129315 CrossRef CAS.
- J. Guo, A. Zhang, Z. Pei, X. Liu, B. Xu and H. Jia, Sep. Purif. Technol., 2022, 287, 120568 CrossRef CAS.
Footnote |
| † Electronic supplementary information (ESI) available. See DOI: https://doi.org/10.1039/d3ra00729d |
| This journal is © The Royal Society of Chemistry 2023 |

