 Open Access Article
Power dependent photoacoustic and photoluminescence studies on a Ho3+/Yb3+ doped Y2O3 phosphor†
Minarul I. Sarkar and
Kaushal Kumar *
*
Optical Materials & Bio-Imaging Research Laboratory, Department of Physics, Indian Institute of Technology (Indian School of Mines) Dhanbad, Dhanbad 826004, India. E-mail: kkumar@iitism.ac.in
First published on 25th April 2023
Abstract
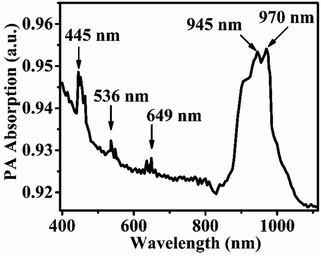
The Ho3+/Yb3+ doped Y2O3 phosphor samples were synthesized through a combustion method and then were annealed at 800 °C, 1000 °C, and 1200 °C. The cubic phase of the synthesized samples was confirmed by XRD analysis. The upconversion (UC) & photoacoustic (PA) spectroscopic studies were done on prepared samples and both spectra are compared. The samples have shown intense green upconversion emission at 551 nm due to the 5S2 → 5I8 transition of Ho3+ ion along with other bands. The maximum emission intensity is obtained for the sample annealed at 1000 °C for 2 hours. The authors have also measured the lifetime corresponding to 5S2 → 5I8 transition and found that lifetime values follow the trend of upconversion intensity. The maximum lifetime of 224 μs is observed for the sample annealed at 1000 °C. A photoacoustic cell & a pre-amplifier was fabricated and optimized for maximum sensitivity of the system. The PA signal was found to increase with increase of excitation power within the studied range, while UC emission was found to saturate after a certain pump power. The increase in PA signal is due to the increase in non-radiative transitions in the sample. The wavelength-dependent photoacoustic spectrum of sample has shown absorption bands around 445, 536, 649 and 945 (970) nm with maximum absorption at 945 (970) nm. This indicates its potential for photo-thermal therapy using infrared excitation.
1. Introduction
Sound is produced when a periodic light beam is incident on any sample surface and this effect is called the ‘photoacoustic effect’.1–3 Photoacoustic spectroscopy (PAS) is a novel spectroscopy technique used to measure optical and thermal properties of materials of any phase (solid, liquid or gas) 4. It has two working modes, (i) varying frequency mode where PA signal is recorded at different chopping frequencies for any selected excitation wavelength and (ii) fixed frequency mode where PA signal is measured against different excitation wavelengths. The first mode gives thermal information like thermal diffusivity, thermal effusivity and thermal conductivity of the materials and second mode gives information about absorption bands leading to heat generation. Rare earth ions doped phosphors have received interest in photoacoustic studies along with the photoluminescence 5–9. The rare earth phosphors can show strong downshifting as well as upconversion (UC) emission and upconversion phosphors have attracted lots of research interest in recent years 10–12. Such phosphor materials have applications in solid-state lighting, silicon solar cells as efficiency enhancers, medical diagnostics, night glowing panels, optical temperature sensing, fingerprint detection, in vivo bio-imaging etc.13–21 As a suitable host for UC emission the yttrium dioxide (Y2O3) is considered as a good host.22–25The Y2O3 has a large band gap (∼5.8 eV), good thermal and chemical stability, high melting point, good optical transparency over a wide range (0.2–8 μm), high refractive index (∼2) and low phonon energy (600 cm−1) etc.26–30 Also, the ionic radius of the Ho3+ ion (104.1 pm) is very close to that of the Y3+ ion (104 pm) and hence Ho3+ easily occupies host sites (Y3+).31 The UC emission of Ho3+/Yb3+ doped phosphors has been reported by many researchers.32–36 Luo et al.32 have made comparative UC emission studies between Ho3+/Yb3+ and Er3+/Yb3+ doped Y2O2 phosphor and have shown that the emission intensity is 2.2 times higher for the Ho3+/Yb3+ doped phosphor than the Er3+/Yb3+ doped in the same host. Dwivedi et al.33 have shown UC emissions in a Gd2O3 host and obtained photon avalanche process in this host. Sangeetha et al.34 have measured the UC emission intensities in Ho3+/Yb3+ doped lanthanum silicate & lanthanum zirconate hosts and found dominant red and green emissions, respectively. The authors have explained the results on the basis of phonon energy difference between the two matrices. Wei et al.35 have measured the intense green UC intensity of Ho3+/Yb3+ under 980 nm excitation and their results show that Ho3+/Yb3+ emission is suitable for biomedical applications.
Generally Ho3+/Yb3+ doped Y2O3 phosphors show high luminescence intensity due to large absorption cross-section of Yb3+ ions and efficient energy transfer between energy levels of Yb3+ and Ho3+. The 5F4 → 5I8 and 5S2 → 5I8 transitions of Ho3+ ions have energy separation of ∼667 cm−1 and hence are thermally coupled.36–38 Further, 5I5 and 2F5/2 levels of Ho3+ and Yb3+ ions, respectively are involved in the energy transfer upconversion process. These levels have a slight mismatch in the energy and hence during the energy transfer process mismatched energy is emitted in the form of heat. Each of the rare earth ions has some non-radiative transitions that lead to heat generation. This heat generation on such rare earth ions doped phosphors could lead to increased sample temperature and is useful in several applications such as in contrast agents in optical coherence tomography and photo-thermal therapy. The amount of temperature gain in phosphor depends on various parameters such as host material, particle size, thermal diffusivity of material, rare earth concentration etc. The plasmonic particles (like gold, silver) are also known to generate heat when excited with UV-visible radiation but these particles have a drawback that UV-visible radiation is not suitable for the biological samples due to lower penetration of high frequency radiation inside the tissues. Rare earth phosphors on the other hand are excited with 980 or 800 nm infrared radiation, which has higher penetration depth and is safer for the biological tissues. Hence, in the present study a Ho3+/Yb3+ doped Y2O3 phosphor was studied under 980 nm excitation. The 980 nm excitation results strong upconversion emission as well as heat generation through non-radiative transitions. The heat generation could be studied through photoacoustic technique and hence a photoacoustic spectrometer was built in the laboratory and then studies were made on the sample. Photoacoustic studies on such phosphors are very rare and more studies are required to know relation between photoluminescence and photo-acoustic signal. The phosphor sample was synthesized through a solution combustion method as it produces better sample homogeneity with large yield and is cost effective.36,39
2. Experimental
2.1 Chemicals used
For the synthesis of the phosphor samples, yttrium oxide (Y2O3) (99.99%, Alfa Asear), holmium oxide (Ho2O3) (99.99%, Sigma Aldrich), ytterbium oxide (Yb2O3) (99.99%, Sigma Aldrich), urea (CH4N2O) (99.99%, Alfa Asear) and nitric acid (HNO3) (90.0%, Finar Chemicals, India) were used as precursors. Also, triply distilled deionized (DI) water was used throughout the synthesis.2.2 Sample synthesis
Ho3+/Yb3+ doped Y2O3 phosphor samples were synthesized through combustion method. The chemical compositions of the precursor was taken in the following proportions:| (100 − x − y)Y2O3 + xHo2O3 + yYb2O3 |
So for synthesis of this phosphor sample, first nitrates of all rare earth oxides were prepared by dissolving them in nitric acid through heating. Appropriate weights of each rare earth oxide were taken in separate beakers and then nitric acid was added slowly with stirring. After that, all beakers were placed on a hot plate at 90 °C until a transparent solution was formed. The solutions were continuously stirred at 350 rpm at the same temperature to evaporate extra nitrate. Then all oxide precursors were placed in a single beaker and mixed for another 30 minutes. After that required amount of urea was mixed with 10 ml DI water and then added in the main solution. The solution was stirred on the hot plate below 60 °C temperature continuously until solution is converted to a transparent gel. Now, the gel was transferred into an alumina crucible of 150 ml volume for combustion process. The crucible was placed inside a preheated furnace roughly at 500 °C. At high temperature the gel swells & forth was immediately catches fire. After burning the gel white foamy sample is obtained. The obtained sample was crushed using a mortar pestle to form fine powder. Finally, samples were annealed at 800 °C, 1000 °C, and 1200 °C temperatures for 2 hours and stored in a desiccator for further characterization.40
Different characterization techniques were performed in this work. X-ray diffraction (XRD) study was made through X-ray diffractometer (Rigaku TTRX-III) having Cu Kα radiation to confirm the phase of the synthesized sample. The FE-SEM analysis was carried out on Carl Zeiss, Supra 55 instrument for study of the surface morphology. The UC emission spectra were recorded on a fiber-coupled CCD spectrometer (ULS2048X58, Avantes, USA). The luminescence decay curves were recorded using a photo detector (Model: DET36A2, Thorlabs, USA) and a double-channel digital storage oscilloscope (DSO) (Model GDS-2102E, GW Instek, Taiwan). The PA spectra were recorded by a home-made photoacoustic spectrometer discussed below.
2.3 Experimental setup
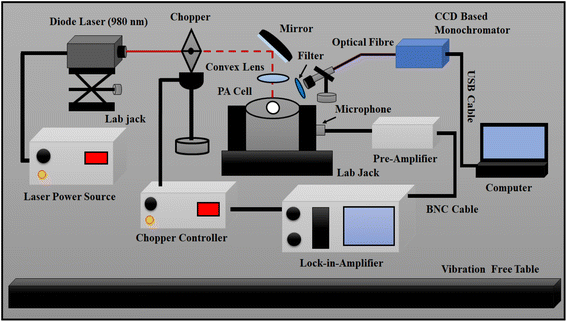
The experimental setup is an important part for recording good PA signal and UC intensity of the phosphor sample. The fabrication and optimization of the photoacoustic spectrometer is described thoroughly in our previous work.8 A photoacoustic spectrometer has four main parts; an optical source integrated with a frequency controlled chopper, a PA cell containing highly sensitive pre-polarized microphone, a pre-amplifier, and a data recording/storage system. For recording of UC spectra and PA signal a 980 nm diode laser (Model: PSU-H-LED, C.N.I., China) was used to excite the sample. The PA absorption spectra were recorded using 500 Watts Xenon lamp attached with a software-controlled high intensity monochromator (Model: 9055, ¼ m, Sciencetech, Canada). As both sources are continuous, a frequency controlled mechanical chopper (Model: SR 540, Stanford Research Systems, USA) was used to make periodic beam. The most important component of the PA spectroscopy is the PA cell. The acoustic signal strength is dependent on the internal geometrical shape and cavity volume of the cell. The cell was fabricated from a cylindrical aluminum metal rod of diameter 70 mm and length 60 mm. It has two parts, one is the main body where a sample chamber was made and a microphone was connected with the main chamber through a channel of diameter 1 mm and length 10 mm. Another part is the covering plate where a quartz window of diameter 30 mm and thickness 2.5 mm was fixed on its back side. The covering plate was fixed on the top of main block using 3 mm O-ring to minimize outside noise. Optimum volume of the sample chamber was found around 4.85 × 10⁻⁷ m3.41A highly sensitive (Sensitivity: 50 mV Pa−1) pre-polarized microphone (Model: 4966, Bruel & Kjaer, Germany) was used. The schematic diagram of home-made PA cell and pre-amplifier circuit is given in Fig. S1(a) and (b) (ESI†). A pre-amplifier circuit was fabricated and frequency response was optimized for desired frequency range. The circuit diagram is given in Fig. S1(c) (ESI†). The overall gain of the pre-amplifier was maintained close to hundred by adjusting feedback resistances of each op-amp. All connections are made by low impedance (50 ohms) Bayonet Neil–Concelman (BNC) cable to get better signal. The PA voltages were recorded using a double channel lock-in-amplifier (Model: SR-830, Stanford Research System, USA) connected with excitation source and PA cell. The whole arrangement of the experiment was performed on an active vibration free table to minimize the external vibrations.
When modulated light beam falls on the sample which is placed inside the PA cell chamber, the Ho3+ and Yb3+ ions present in sample absorb the photons and get excited to upper states. The excited states relax through radiative (upconversion emission) and non-radiative (heat generation) processes. The sample give both properties simultaneously. The experimental setup was arranged in a manner to enable both the measurements simultaneously. A schematic of the arrangement is shown in Fig. 1. The upconversion emission was recorded using a fibre coupled CCD spectrometer. The light collection tip of the fiber was mounted at an angle from the top window of the PA cell to receive emitted light from the sample. The periodic heat generation in the sample was detected by the microphone and then amplified by pre-amplifier. The pre-amplifier signal was connected to lock-in-amplifier for data recording. The wavelength dependent PA absorption spectra were recorded with the help of experimental setup given in Fig. S2 (ESI†).
3. Result and discussion
3.1 XRD analysis
The XRD data of the synthesized samples were recorded in the range of 15–80° with the scanning rate of 3° per minute and step size of 0.02 to confirm the phase of the synthesized sample. Fig. 2 shows the obtained XRD patterns of sample annealed at different temperatures and all patterns well match with the reference JCPDS file no 25 1200. All samples are found in pure cubic phase with increasing crystallite size. The crystallite size of the prepared samples was measured by Debye–Scherrer's equation;42
 | (1) |
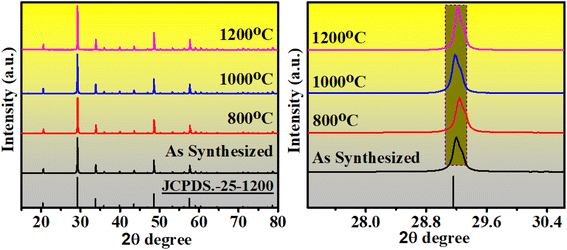 | ||
| Fig. 2 XRD patterns of the samples annealed at different temperatures. Magnified shaded region showing small shift corresponding to (222) plane. | ||
3.2 FE-SEM and EDAX analysis
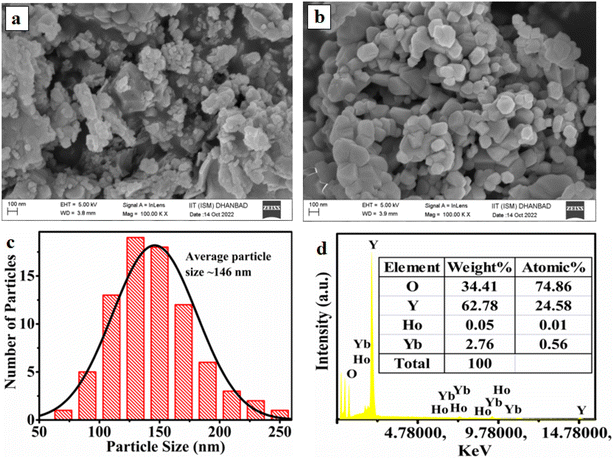
The FE-SEM images of the samples were recorded to see surface morphology of the prepared samples. In Fig. 3 the images are compared for as-synthesized and sample annealed at 1000 °C. The first image clearly shows the non-uniform shape & agglomerated form of the particles. The second image for annealed sample disc shape particles joined with each other through boundary. The particle size is found to increase on annealing. The particle size distribution of the optimized sample measured by ImageJ software is shown in Fig. 3c. The average particle size is around 146 nm for the optimized sample. The recorded EDAX spectrum of the annealed sample is shown in Fig. 3d. The spectrum confirms that Y, Tb, Ho and O are present in the sample composition.3.3 Upconversion emission study
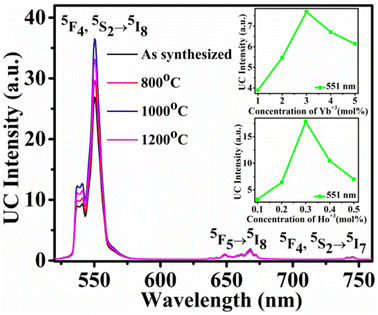
The UC emission intensity of the phosphor was recorded with 980 nm diode laser source. Fig. 4 shows the recorded UC spectra in the range of 520–760 nm for annealed samples. The result shows that emission intensity gradually increases with annealing temperature up to 1000 °C (for 2 h) and further increment of annealing temperature reduces the emission intensity. So, maximum intensity is observed for the sample annealed at 1000 °C. The decrease in emission intensity at higher annealing temperatures may be due to the decomposition of the Y2O3 lattice. The emission intensity could be decreased by oxygen removal from the sample at higher temperature.43 The emission bands are observed at 538 nm, 551 nm, 668 nm, and 745 nm due to the 5F4 → 5I8, 5S2 → 5I8, 5F5 → 5I8, and 5F4, 5S2→5I7 transitions of Ho3+ ion, respectively.39,31–44 The first two bands are observed near the green region. The emission intensity of the band near 551 nm bands is very high compared to the rest peaks. The emission intensity was optimized by varying the concentrations of Yb3+ and Ho3+ ions. Firstly, the concentration of Ho2O3 was fixed at 0.1 mol% and concentration of Yb2O3 was varied. Emission intensity vs. concentration of Yb2O3 (1–5 mol%) graph for the emission bands at 551 nm is shown in inset of Fig. 4. The maximum intensity is observed for 3.0 mol% Yb2O3. Then, in the next step concentration of Yb2O3 was fixed at 3.0 mol% and concentration of Ho2O3 was varied in 0.1–0.5 mol%. The intensity pattern for different concentrations of Ho2O3 is shown in the inset of Fig. 4 and maximum intensity is observed for 0.3 mol% concentration of Ho2O3. So, maximum emission intensity is found for 3.0 mol% Yb2O3 and 0.3 mol% Ho2O3 concentrations.The UC spectrum of the optimized sample at 1150 mW excitation power is shown in Fig. 5. The UC intensity was recorded for different excitation powers in the range of 186–1540 mW. The emission intensity (IUC) depends on excitation power (PPump) as per the following eqn (2):
| IUC (Intensity) ∝ [PPump]n | (2) |
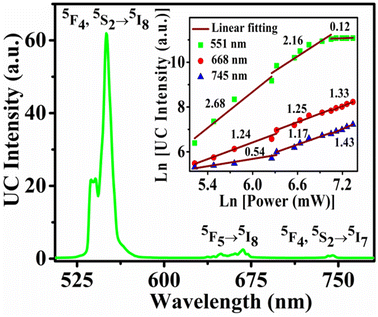 | ||
| Fig. 5 (a) The UC spectrum of the optimized sample at the excitation power of 1150 mW. Inset plot shows the ln(P) vs. ln(IUC) plots for different emission bands. | ||
3.4 Comparative study of upconversion and heat generation
Important objective of this experiment is to made comparison between the UC emission intensity and PA amplitude with excitation pump powers in the synthesized sample as both originate from two different transitions. The experimental setup for comparative study of UC (produced due to radiative transitions) emission intensity and PA signal (produced from non-radiative transitions) is shown in Fig. 1. The whole setup was aligned properly to record both data by varying the laser power. The chopper frequency was fixed at 30 Hz for the production of PA signal. In Fig. 6 the measured upconversion intensity for 551 and 668 nm bands and total PA signal is plotted against excitation power. The 551 nm emission is seen to increase rapidly up to 100 mW excitation power and above it the emission intensity remains almost constant. The 668 nm band however, increases slowly in a linear fashion in the whole excitation power range. The PA signal plot with excitation power shows two slopes. The rate of increase in PA signal goes slightly rapid after 250 mW of excitation power. This thrust in PA signal occurs due to quantum decrease in rate of increase of intensity of 551 nm band. Above 100 mW of excitation power, the upconversion emission intensity of 551 nm band shows saturation behaviour and hence excess excitation power above 100 mW just increases non-radiative transitions and hence PA signal increases with higher rate. However, the rate of increase of PA signal is found much lower than previously studied La2O3: Er3+/Yb3+ phosphor.8 Hence, it could be concluded that in the present Y2O3: Ho3+/Yb3+ sample heat generation occurs through non-radiative contributions from (1) mismatch of energy levels between 5I6 and 2F5/2 levels of Ho3+ & Yb3+ ions, respectively and (2) absorption of excitation power by host itself. The contribution of upper levels of Ho3+ ions in heat generation is very small.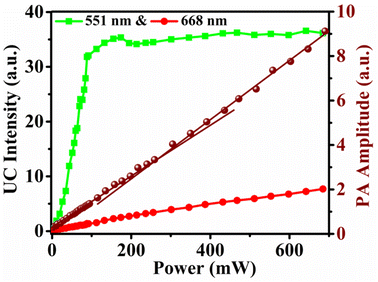 | ||
| Fig. 6 Variation of UC emission intensity of 551 nm, & 668 nm bands and PA signal amplitude with excitation pump powers for the sample annealed at 1000 °C for 2 h. PA signal is on right Y-axis. | ||
3.5 Lifetime study
The lifetime of 5S2 level of Ho3+ ion was measured for prepared samples. The decay curves were recorded by exciting the sample with 980 nm laser in periodic mode. The decay times were calculated by measuring the time to decay emission intensity by 37% of its maximum value. The result shows that the lifetime of the sample increases from 173 μs for as-synthesized sample to 224 μs for sample annealed at 1000 °C. The decrease in lifetime is observed for sample annealed at 1200 °C. This pattern in change in lifetime is in line with the change in upconversion emission intensity. Calculated lifetimes are given in Table 1. This result is very close to the reported values.45 The recorded decay curves are given in Fig. S3 (ESI†).| Annealed temperature in °C | Lifetime (in μs) for 5S2 → 5I8 at 551 nm |
|---|---|
| As synthesized | 173 (τ0) |
| 800 | 190 (τ8) |
| 1000 | 224 (τ10) |
| 1200 | 184 (τ12) |
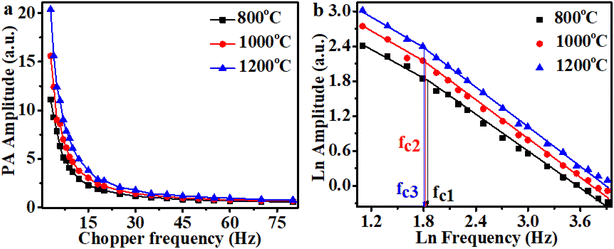
The transition frequencies of PA signal of the samples were also measured to predict change in thermal diffusivities of the sample with annealing temperature. Fig. 7a shows the variation of PA amplitude with chopper frequency in 3–80 Hz range for samples annealed at 800 °C, 1000 °C, and 1200 °C. For this measurement the excitation power of the laser source was fixed at 160 mW. The ln–ln plot between chopper frequency and PA voltage is shown in Fig. 7b. The plot results change in slope value of the plot at a particular frequency and this frequency is the measure of thermal diffusivity.46 In the plotted graph the transition frequency is found to decrease with annealing temperature and it indicates that thermal diffusivity of the sample decreases with the increase of annealing temperature. The heating the sample reduces the volatile impurities and these impurities are supposed to contribute in thermal diffusivity of the sample.
3.6 Measurements of PA absorption spectrum
For recording of PA absorption spectrum of the sample, a 500 watt Xenon source was used as a source. The PA spectrum of the sample was recorded on experimental setup given in Fig. S2 (ESI†). The slit width was fixed at 2 mm (optical resolution ∼5 nm) throughout the measurement and chopping frequency was fixed at 30 Hz. The PA voltages were recorded by varying the excitation wavelength in the range of 400–1200 nm. Recorded PA spectrum was normalized with saturation PA spectrum of the carbon black. The recorded PA absorption spectrum of the sample annealed at 1000 °C is shown in Fig. 8. Here peaks are observed at 445, 536, 649, and 945 (970 nm) nm wavelengths corresponding to the 5I8 → 5F4, 5I8 → 5S2, 5I8 → 5F5 absorption transitions of Ho3+ ion and 2F7/2 → 2F5/2 absorption transition of Yb3+ ion, respectively. The most intense band is observed at 945 (970 nm) nm for the strong absorption of excitation radiation (980 nm) by Yb3+ ions.4. Conclusions
The authors have successfully fabricated and optimized homemade photoacoustic cell and pre-amplifier to measure PA spectra of Ho3+/Yb3+ doped Y2O3 phosphor samples. The sample was synthesized through the combustion method and was annealed at 800, 1000 and 1200 °C temperatures. The maximum UC intensity is found for the sample annealed at 1000 °C and the emission bands are observed at 538, 551, 668, and 745 nm due to the two-photon absorption process. Most intense band was observed for 5S2 → 5I8 transition and the lifetime of 5S2 level was measured under 980 nm excitation. The sample annealed at 1000 °C has given maximum lifetime of 224 μs. With excitation pump power the emission at 551 nm was found to increase very rapidly and above 100 mW of excitation power the emission gets saturated. This saturation in the 551 nm upconversion emission results slight increase in the rate of increase of PA signal. This increase in PA signal happens due to the conversion of emission energy in to the non-radiative transitions. The photoacoustic absorption spectrum of sample has shown bands around 445, 536, 649 and 945 (970) nm with maximum absorption at 945 (970) nm. The strong PA signal around 970 nm indicates that this sample generates intense heat on 980 nm excitation. Present sample gives intense upconversion emission as well as intense heat generation on 980 nm excitation. This dual modality is suitable for the bio-imaging as well as photo-thermal therapy.Conflicts of interest
The authors have declared that no conflicting interests exist.Acknowledgements
Firstly, the authors are gratefully acknowledged to the Department of Science and Technology, New Delhi for financial help [Project No.-DST(SERB)/EMR/2017/000228]. Also, The authors are thankfully acknowledged to the ISM workshop, IIT(ISM) Dhanbad for cell fabrication. One of the authors, Minarul is also grateful to the institute IIT(ISM) Dhanbad, for providing research fellowship in terms of SRF.References
- A. G. Bell, Am. J. Sci., 1880, 20, 305–324 CrossRef.
- A. G. Bell, Philos. Mag., 1881, 11, 510–528 Search PubMed.
- A. Rosencwaig and A. Gersho, J. Appl. Phys., 1976, 47, 64–69 CrossRef.
- N. A. George, C. P. G. Vallabhan, V. P. N. Nampoori, A. K. George and P. Radhakrishnan, Appl. Phys., 2000, 33, 3228–3232 CAS.
- J. R. Schoonover, Y. L. Lee, S. N. Su, S. H. Lin and L. Eyring, Appl. Spectrosc., 1984, 38(2), 154–158 CrossRef CAS.
- W. Stręk, E. Lukowiak, M. Marchewka and H. Ratajczak, Appl. Spectrosc., 1987, 41(4), 693–695 CrossRef.
- Y. Sheng, L. D. Liao, A. Bandla, Y. H. Liu, N. Thakor and M. C. Tan, ACS Biomater. Sci. Eng., 2016, 2(5), 809–817 CrossRef CAS PubMed.
- M. I. Sarkar, N. K. Mishra and K. Kumar, Methods Appl. Fluoresc., 2023, 11, 014002 CrossRef PubMed.
- S. A. Wood, C. D. Tait, D. R. Janecky and T. L. Constantopoulos, Geochim. Cosmochim. Acta, 1995, 59(24), 5219–5222 CrossRef CAS.
- Z. Xia, W. Zhou, H. Du and J. Sun, Mater. Res. Bull., 2010, 45, 1199–1202 CrossRef CAS.
- S. K. Singh, K. Kumar and S. B. Rai, Appl. Phys. B, 2009, 94, 165–173 CrossRef CAS.
- V. K. Rai, Solid State Laser, IntechOpen, 2012, pp. 209–224 Search PubMed.
- T. R. Hinklin, S. C. Rand and R. M. Laine, Adv. Mater., 2008, 20, 1270–1273 CrossRef CAS.
- D. K. Chatterjee, A. J. Rufaihah and Y. Zhang, Biomaterials, 2008, 29, 937–943 CrossRef CAS PubMed.
- L. Liu, S. K. Gill, Y. Gao, L. J. H. Weeks and K. H. Cheng, Forensic Sci. Int., 2008, 176, 163–172 CrossRef CAS PubMed.
- S. Fischer, J. C. Goldschmidth, P. Loper, G. H. Bauer, R. Brüggemann, K. Kramer, D. Biner, M. Hermle and S. W. Glunz, J. Appl. Phys., 2010, 108, 044912 CrossRef.
- M. Wang, C. C. Mi, W. X. Wang, C. H. Liu, Y. F. Wu, Z. R. Xu, C. B. Mao and S. K. Xu, ACS Nano, 2009, 3, 1580–1586 CrossRef CAS PubMed.
- T. I. Karu, IEEE J. Quantum Electron., 1987, 3, 1703–1741 CrossRef.
- J. Milliez, A. Rapaport, M. Bass, A. Cassanho and H. Jenssen, J. Disp. Technol., 2006, 2, 307–311 CrossRef CAS.
- V. K. Tikhomirov, L. F. Chibotaru, D. Saurel, P. Gredin, M. Mortier and V. V. Moshchalkov, Nano Lett., 2009, 9, 721–724 CrossRef CAS PubMed.
- B. K. Gupta, D. Haranath, S. Saini, V. N. Singh and V. Shanker, Nanotechnology, 2010, 21, 55607–55615 CrossRef PubMed.
- G. Wilk, R. Wallace and J. Anthony, J. Appl. Phys., 2001, 89, 5243–5275 CrossRef CAS.
- J. Kwo, M. Hong, A. R. Kortan, K. T. Queeney, Y. J. Chabal, J. P. Mannaerts, T. Boone, J. J. Krajewski, A. M. Sergent and J. M. Rosamilia, Appl. Phys. Lett., 2000, 77, 130–132 CrossRef CAS.
- C. Cannas, M. Casu, M. Mainas, A. Musinu, G. Piccaluga, S. Polizzi, A. Speghini and M. Bettinelli, J. Mater. Chem., 2003, 13, 3079–3084 RSC.
- V. Swamy, N. A. Dubrovinskaya and L. S. Dubrovinsky, J. Mater. Res., 1999, 14, 456–459 CrossRef CAS.
- P. A. Tanner, X. Zhou and F. Liu, J. Phys. Chem. A, 2004, 108, 11521–11525 CrossRef CAS.
- C. Y. Shang, X. Q. Wang, H. Kang and D. M. Han, J. Appl. Phys., 2011, 109, 104309 CrossRef.
- A. C. Rastogi and R. N. Sharma, Semicond. Sci. Technol., 2001, 16, 641–650 CrossRef CAS.
- R. J. Gaboriaud, F. Pailloux, P. Guerin and F. Paumier, Thin Solid Films, 2001, 400, 106–110 CrossRef CAS.
- P. de Rouffignac, J. Park and R. G. Gordon, Chem. Mater., 2005, 17, 4808–4814 CrossRef CAS.
- A. Pandey, V. K. Rai, R. Dey and K. Kumar, Mater. Chem. Phys., 2013, 139, 483–488 CrossRef CAS.
- X. Luo and W. Cao, Mater. Lett., 2007, 61, 3696–3700 CrossRef CAS.
- Y. Dwivedi, A. Bahadur and S. B. Rai, J. Appl. Phys., 2011, 110, 043103 CrossRef.
- N. M. Sangeetha and F. C. J. M. van Veggel, J. Phys. Chem. C, 2009, 113, 14702–14707 CrossRef CAS.
- X. Wei, Y. Li, X. Cheng, Y. Chen and M. Yin, J. Rare Earths, 2011, 29, 536–539 CrossRef CAS.
- R. Dey, V. K. Rai and A. Pandey, Spectrochim. Acta, Part A, 2012, 99, 288–291 CrossRef CAS PubMed.
- A. K. Singh, Sens. Actuators, A, 2007, 136, 173–177 CrossRef CAS.
- R. K. Verma and S. B. Rai, J. Quant. Spectrosc. Radiat. Transfer, 2012, 113, 1594–1600 CrossRef CAS.
- M. Rai, K. Mishra, S. K. Singh, R. K. Verma and S. B. Rai, Spectrochim. Acta, Part A, 2012, 97, 825–829 CrossRef CAS PubMed.
- S. K. Singh, K. Kumar and S. B. Rai, Appl. Phys. B, 2009, 94, 165–173 CrossRef CAS.
- K. Sathiyamoorthy, E. M. Strohm and M. C. Kolios, J. Biomed. Opt., 2017, 22(4), 046001 CrossRef PubMed.
- R. L. Snyder, J. Fiala and H. J. Bunge, International union of Crystallography, Oxford University Press, USA, 1999 Search PubMed.
- A. K. Singh, K. Kumar, A. C. Pandey, O. Parkash, S. B. Rai and D. Kumar, Appl. Phys. B: Lasers Opt., 2011, 104, 1035–1041 CrossRef CAS.
- R. Dey and V. K. Rai, Spectrochim. Acta, Part A, 2015, 151, 213–217 CrossRef CAS PubMed.
- V. Kumar, B. Zoellner, P. A. Maggard and G. Wang, Dalton Trans., 2018, 47(32), 11158–11165 RSC.
- M. I. Sarkar, M. M. Upadhyay and K. Kumar, Proc. Inst. Mech. Eng., Part C, 2022, 09544062221135528 Search PubMed.
Footnote |
| † Electronic supplementary information (ESI) available. See DOI: https://doi.org/10.1039/d3ra00643c |
| This journal is © The Royal Society of Chemistry 2023 |

