DOI:
10.1039/D3RA00618B
(Paper)
RSC Adv., 2023,
13, 12375-12385
Boron doping effect on the structural, spectral properties and charge transfer mechanism of orthorhombic tungsten bronze β-SrTa2O6:Eu3+ phosphor
Received
29th January 2023
, Accepted 12th April 2023
First published on 20th April 2023
Abstract
In the study, the effect of boron doping on spectral properties and CTB mechanism was investigated by using Eu3+ doped orthorhombic β-SrTa2O6. A phosphor series of Eu3+ doped SrTa2O6, and Eu3+ and B3+ co-doped SrTa2O6 polycrystals were fabricated by solid-state reaction at 1400 °C for 20 h in an air atmosphere. The X-ray diffractions of the main phase structure for all the ceramics maintained up to 10 mol% Eu3+ concentration, while the increase of XRD intensity for Eu3+ and B3+ co-doped samples was attributed to somewhat improvement of crystallization. SEM morphologies of grains showed that the presence of boron promotes agglomeration and grain growth. The doping of boron up to 20 mol% led to an increase in PL intensity, CTB energy slightly shifted to low energy, and also an increase occurred in the asymmetry ratio of the phosphor. Therefore, the low crystal field symmetry of the Eu3+ sites and some improvement in crystal structure properties for Eu3+, B3+ co-doped samples supported the PL increase. The trend of Judd–Ofelt parameters (Ω2, Ω4) is SrTa2O6:xEu3+, 0.1B3+ > SrTa2O6:xEu3+. The high Ω2 parameter for boron co-doped samples showed a covalent Eu–O bond character with low symmetry of Eu3+ environment, while the high Ω4 value indicated the reduction in electron density of the ligands. Some increase in the short decays of Eu3+, B3+ co-doped samples is probably due to the surface effect and low crystal field symmetry. The quantum efficiency of 0.05Eu3+, 0.1B3+ co-doped phosphor with the highest PL intensity increased by about 21% compared to that without boron.
1. Introduction
The trivalent europium ion (Eu3+) is known for its strong luminescence in the red spectral region which exhibits interesting theoretical properties. The Eu3+ has a great advantage over other RE ions due to the initial levels of transitions in both the absorption and luminescence spectrum not degenerate (J = 0).1,2 The charge transfer (CT) transitions of Eu3+ luminescence exhibit broad absorption bands called charge transfer (CT) bands or ligand-to-metal charge transfer (LMCT) bands in the ultraviolet region of electromagnetic spectrum. CT bands occur due to electron transfer where an electron is transferred from one or more neighboring atoms to the Eu3+ ion, and Eu3+ is formally reduced to Eu2+. The trivalent europium is the most oxidizing of the trivalent rare-earth ions, because Eu3+ lacks only one electron to reach a stable half-filled shell.1 The CT bands are very intense compared to the f–f transitions due to the transitions are allowed by the Laporte selection rule, and the position of the CT bands strongly depends on the nature of the ligands. CT bands can be useful for sensitization of Eu3+ luminescence, because they can act as an antenna to absorb light and to transfer the excitation energy to Eu3+ ion.1
Tungsten bronze (TB) crystal structures are good host matrix candidates for many luminescent applications due to their crystal structure with different coordinated cationic tunnels that allow doping of RE3+ ions.3–7 SrTa2O6 occurs as three different polymorphs in SrO–Ta2O5 system.6–9 Two polymorphs of SrTa2O6 are related to TB symmetry and occur at high temperatures. The β-SrTa2O6 crystallizes at temperatures between 1300–1500 °C, while the β′-SrTa2O6 forms at temperatures over 1500 °C.6–9 The other polymorph is orthorhombic α-SrTa2O6 occurs at about 1100 °C and below. However, the synthesis of α-SrTa2O6 is difficult with the solid state reaction, so it can be produced by the flux method using strontium borate.10 Tungsten bronze polymorphs have similar lattice sizes but their crystal symmetries are different. This difference affects its physical properties, that β′-SrTa2O6 polymorph has better dielectric properties compared to β-SrTa2O6.8,9 The β-SrTa2O6 is orthorhombic with space group Pnam and lattice parameters a = 12.37 Å, b = 12.43 Å, c = 7.72 Å, V = 1187.70 Å3, Z = 10.8,9 The β′-SrTa2O6 is tetragonal with space group P4/mbm and lattice parameters a = 12.47 Å, c = 3.90 Å, V = 606.27 Å3, Z = 5.8,9 The comparison of the two tungsten bronze polymorphs shows that the orthorhombic distortion of β-SrTa2O6 to β′-SrTa2O6 is accompanied by an expansion of the TaO6 octahedral with narrowing of the (Sr2)O13 tricapped pentagonal prisms. Although the crystal lattice of β-SrTa2O6 is about 2.5% smaller than β′-SrTa2O6, Ta–O bond distances and corresponding octahedral volumes of β-SrTa2O6 are large, and it has a relaxed anion sublattice where electrostatic interactions are optimized via octahedral tilting distortions.8
Boron is widely used as a dopant in glasses to improve its optical and mechanical properties which could promote vitrification of oxide.11 However, the doping effect of boron has been studied in detail for certain structures such as TiO2. In boron-doped TiO2, interstitial B has the more stable form under high calcination temperature compared to substitutional B. An increase and decrease occurred in the lattice parameters are associated with interstitial B and substitutional B, respectively.12,13 Boron types can take at least two different major positions in TiO2 which are the oxygen–boron substitution (paramagnetic state), and the interstitial boron (diamagnetic state). In the paramagnetic B arrangement, electrons can be easily captured from other defect states, whereas in the diamagnetic B arrangement, the centers do not transfer charge to other defects in the system. In any case, the driving force for boron to occupy interstitial positions is the formation of very strong bonds with oxygen.14 The doping of boron to SrAl2O4:Eu2+, Dy3+ phosphor improves the performance of trapping centers and afterglow times at the low temperature.15 The powders of Eu3+ doped CdNb2O6 and Eu3+, B3+ co-doped CdNb2O6 are prepared by molten salt synthesis method and the presence of orthorhombic single phase without any other interphase showed that boron is incorporated in the host structure and a significant increase occurred in PL.16
In the study, the effect of boron doping on the photoluminescence, charge transfer transition, and structural properties of the Eu3+ doped β-SrTa2O6 and Eu3+, B3+ co-doped β-SrTa2O6 phosphors were investigated. The structural and spectroscopic characterizations were carried out by XRD, SEM, XPS, PL, decay time analyses, and also the spectral properties were examined comparatively within the scope of Judd–Ofelt theory.
2. Experimental
SrTa2O6:xEu3+, yB3+ ceramic samples were fabricated in three groups by solid-state reaction. First group contains Eu3+ doped samples with x = 0.5, 1.5, 3, 5, 7, 10 mol% concentrations, second group has x = 5 mol% Eu3+ and y = 0, 5, 10, 20 mol% B3+ co-doped samples while the third group represents the y = 10 mol% B3+ and x = 0.5, 1.5, 3, 5, 7, 10 mol% Eu3+ doped samples. Each 1 mol% of x represents two atomic% values of the Eu2O3 compound. Strontium carbonate (SrCO3: Sigma-Aldrich, 99%), and tantalum oxide (Ta2O5: Alpha Aesar, 99.9%) powders were used as starting materials in calculated stoichiometric amounts. Europium oxide (Eu2O3: Alpha Aesar, 99.9%) and boric acid (H3BO3: Kimyalab, %99.9) were used as dopant materials. The SrCO3 and Ta2O5 were weighed according to the stoichiometry of SrTa2O6. For CO2 extraction, SrCO3 was kept in a furnace at 1200 °C for 1 h to obtain SrO. Then SrO and Ta2O5 powders were homogenized by mixing well with the addition of acetone in an agate mortar. The powder mixture of SrO and Ta2O5 was doped by the 0.5, 1.5, 3, 5, 7, 10 mol% Eu2O3 (for the 1st group), 5 mol% Eu2O3 and 0, 5, 10, 20 mol% H3BO3 (for the 2nd group), 0.5, 1.5, 3, 5, 7, 10 mol% Eu2O3 and 10 mol% H3BO3 (for the 3rd group), respectively. The final powder mixtures were mixed by acetone for further homogenization. The prepared powders were sintered in an electric furnace at 1400 °C for 20 h after pelleting.
The phase structure of the ceramic samples were examined by XRD (X-ray diffractometer; Bruker D-8 Advance, Bruker Corp., Germany) between 2θ = 20–65 °C using Cu-Kα (1.5406 Å) radiation and scan speed 2 °C min−1. The grain morphology of the ceramic samples was investigated by SEM (scanning electron microscopy; FEG-SEM; XL 30S, Philips Corp., Netherlands). Elemental analysis was performed by the Thermo-Scientific Al-Kα model XPS device. Photoluminescence (PL) results were taken by a fluorescence spectrometer (FLS920, Edinburgh Instruments, UK) equipped with a 450 W ozone-free Xe lamp. Lifetime data were also obtained by fluorescence spectrometer (FLS920) using the time-correlated single-photon counting (TCSPC) system. PL analysis was performed at room temperature.
3. Results and discussions
3.1 Structural analyses
X-ray diffractions of SrTa2O6:xEu3+ samples for x = 0.5, 1.5, 3, 5, 7 10 mol% Eu3+ concentrations are shown in Fig. 1. The presence of single-phase continued from 0.5 to 10 mol%, and there was no impurity phase. The crystal symmetry of β-SrTa2O6 is identified by the first report as Pbam (no. 55) and JCPDS card no. 51-1683.17 However, Lee et al.7 reported that the crystal symmetry is suitable for the space group Pnam. Accordingly, the crystal symmetry of the orthorhombic TB samples was indexed with space group Pnam (no. 62).8,9 Tetragonal tungsten bronze structure can be expressed by the A4B2C4M10O30 general formula where the pentagonal (A), square (B), and triangular (C) tunnels have 15 CN (large ions such as alkaline earth ions and alkali), 12 CN (such as rare earth ions), 9 CN (small ions such as Li+), respectively. Also, the octahedral Ta sites with small and highly charged ions have 6 CN.4–7 The Eu3+ ions (r = 1.12 Å, for CN 9) will be suitable for the A and B sites with 15 and 12 CN, respectively. Tungsten bronze symmetry at high concentrations may persist despite of some change occurring in the lattice, which can be attributed to the superiority of TB for RE3+ doping.3–7 In addition, although the β-SrTa2O6 polymorph has preserved its single-phase structure, it is likely to suffer some increase in distortion due to its slightly longer Ta–O bond distances compared to β′-SrTa2O6. X-ray diffractions of SrTa2O6:xEu3+, yB3+ (x = 5 mol% Eu3+, y = 0, 5, 10, 20 mol% B3+), and SrTa2O6:xEu3+, yB3+ (x = 0.5, 1.5, 3, 5, 7, 10 mol% Eu3+, y = 10 mol% B3+) co-doped samples are shown in Fig. 2a, b and 3, respectively. As seen in the figures, the diffraction peaks of Eu3+, B3+ co-doped samples exhibited a slight narrowing compared to the Eu3+ doped samples, indicating some improvement in crystallization. The absence of secondary phases in XRD patterns can be also associated with the boron's successful incorporation into the structure. In Fig. 2b, the reflection (131) showed a slight shift towards the smaller two theta angles, which is likely related to the increase in B3+ concentration leading to the expansion of the lattice volume.
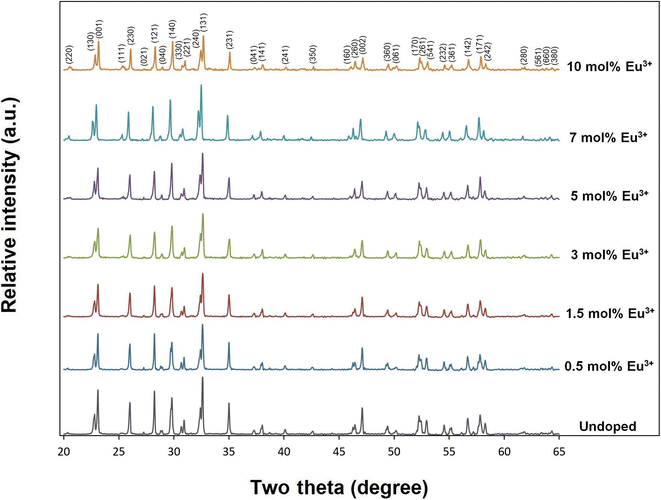 |
| | Fig. 1 XRD results of undoped, 0.5, 1.5, 3, 5, 7, and 10 mol% Eu3+ doped SrTa2O6 samples. | |
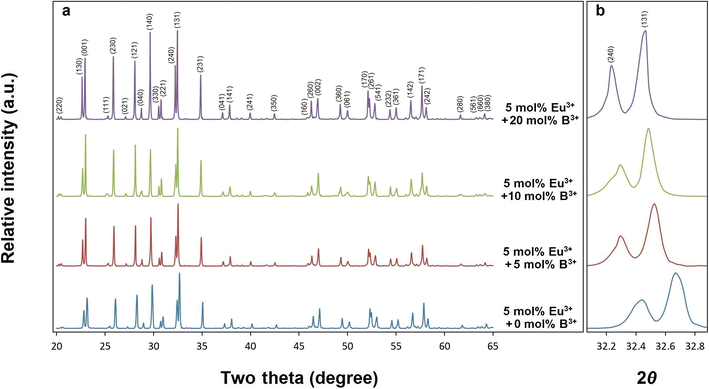 |
| | Fig. 2 XRD results of (a) 5 mol% Eu3+, and 0, 5, 10, 20 mol% B3+ co-doped SrTa2O6, (b) the shift of the two theta angle peaks (240) and (131) to lower angles. | |
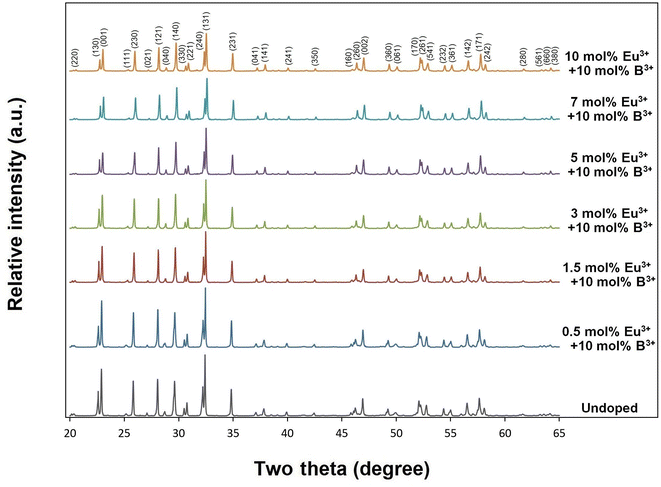 |
| | Fig. 3 XRD results of 10 mol% B3+, and undoped, 0.5, 1.5, 3, 5, 7, 10 mol% Eu3+ co-doped SrTa2O6 samples. | |
SEM micrographs of SrTa2O6:xEu3+, yB3+ samples for x = 5 mol% Eu3+, y = 0, 5, 10, 20 mol% B3+ co-doped concentrations at 2000× and 10![[thin space (1/6-em)]](https://www.rsc.org/images/entities/char_2009.gif) 000× magnifications under 15 kV accelerating voltage are shown in Fig. 4a–h, respectively. In SEM micrographs, it is seen that boron doping promotes agglomeration and growth, where grain boundaries are reduced or disappeared. In addition, grain size and agglomeration increase with increasing boron, as reported in the supporting study.15 The increase in grain size can be seen in Fig. 4a, c, e and g at 2000× magnifications. More detail is shown in Fig. 4b, d, f and h at 10
000× magnifications under 15 kV accelerating voltage are shown in Fig. 4a–h, respectively. In SEM micrographs, it is seen that boron doping promotes agglomeration and growth, where grain boundaries are reduced or disappeared. In addition, grain size and agglomeration increase with increasing boron, as reported in the supporting study.15 The increase in grain size can be seen in Fig. 4a, c, e and g at 2000× magnifications. More detail is shown in Fig. 4b, d, f and h at 10![[thin space (1/6-em)]](https://www.rsc.org/images/entities/char_2009.gif) 000× magnifications, which are shown in the inset figures of Fig. 4a, c, e and g as yellow windows. Fig. 5a and b shows the XPS analysis of the 5 mol% Eu3+, 20 mol% B3+ co-doped sample. In Fig. 5a, the binding energies of O1s, Sr3d, and Ta4f were identified at 529.26, 133.44, and 26.23 eV which belong to tantalum oxide structure, respectively. Also, the 1133 eV peak defines the europium dopant with Eu3d. In Fig. 5b, the binding energy of B1s is 189.59 eV. The broad spectrum in the range of about 187–192 eV shows that boron was incorporated into the structure. The binding energies of boron for the elemental and fully oxidized form (B2O3) are 187.2 eV (ref. 18) and 193.0 eV,19,20 respectively. Accordingly, the broad B1s spectrum shows that interstitial B atoms can exist in different stoichiometric forms with oxygen in the structure.
000× magnifications, which are shown in the inset figures of Fig. 4a, c, e and g as yellow windows. Fig. 5a and b shows the XPS analysis of the 5 mol% Eu3+, 20 mol% B3+ co-doped sample. In Fig. 5a, the binding energies of O1s, Sr3d, and Ta4f were identified at 529.26, 133.44, and 26.23 eV which belong to tantalum oxide structure, respectively. Also, the 1133 eV peak defines the europium dopant with Eu3d. In Fig. 5b, the binding energy of B1s is 189.59 eV. The broad spectrum in the range of about 187–192 eV shows that boron was incorporated into the structure. The binding energies of boron for the elemental and fully oxidized form (B2O3) are 187.2 eV (ref. 18) and 193.0 eV,19,20 respectively. Accordingly, the broad B1s spectrum shows that interstitial B atoms can exist in different stoichiometric forms with oxygen in the structure.
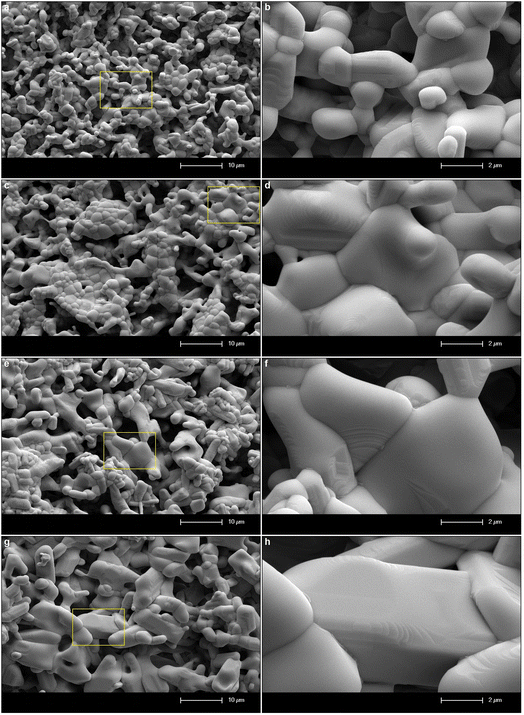 |
| | Fig. 4 SEM micrographs of 5 mol% Eu3+, and different concentrations B3+ co-doped SrTa2O6 samples: (a and b) without B3+, (c and d) 5 mol% B3+, (e and f) 10 mol% B3+, (g and h) 20 mol% B3+, under 15 kV accelerating voltage at 2000× and 10![[thin space (1/6-em)]](https://www.rsc.org/images/entities/char_2009.gif) 000× magnifications, respectively. 000× magnifications, respectively. | |
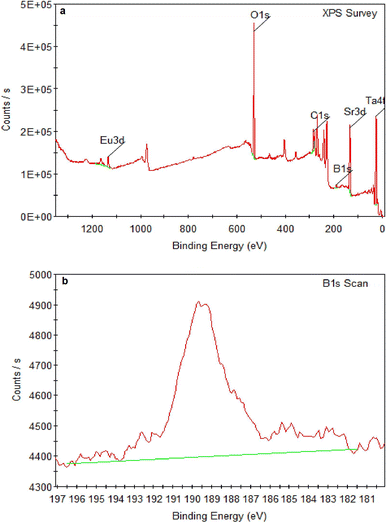 |
| | Fig. 5 XPS spectra of (a) 5 mol% Eu3+, 20 mol% B3+ co-doped SrTa2O6 sample, (b) B1s. | |
3.2 Photoluminescence of SrTa2O6:xEu3+ and SrTa2O6:xEu3+, yB3+ phosphors
Fig. 6a–c and 7a–c show PL excitations and emissions of orthorhombic tungsten bronze β-SrTa2O6 phosphors corresponding to the SrTa2O6:xEu3+ (x = 0.5, 1.5, 3, 5, 7, 10 mol% “without boron”), SrTa2O6:xEu3+, yB3+ (x = 5 mol% “Eu3+ fixed”, y = 0, 5, 10, 20 mol%), and SrTa2O6:xEu3+, yB3+ (x = 0.5, 1.5, 3, 5, 7, 10 mol%, y = 10 mol% “boron fixed”), respectively. In Fig. 6a–c, PL excitations under 618 nm were assigned with 7F0 → 5D4, 7F0 → 5GJ, 7F0 → 5L6, 7F0 → 5D3, and 7F0 → 5D2 transitions, respectively. In Fig. 7a–c, PL emissions with 465 nm excitation were observed at 5D0 → 7FJ, (J = 0, 1, 2, 3, 4, 5) corresponding to the Eu3+ transitions. Fig. 7a shows the PL spectra of SrTa2O6:xEu3+ (x = 0.5, 1.5, 3, 5, 7, 10) phosphors. The PL intensity reached its maximum value at 5 mol%, while the concentration quenching occurred at 7 and 10 mol%. Therefore, the concentration of the 5 mol% Eu3+ doped phosphor with the highest PL intensity was used to investigate the effect of different B3+ concentrations. The PL emissions of SrTa2O6:xEu3+, yB3+ (x = 5, y = 0, 5, 10, 20 mol%) phosphors are given in Fig. 7b. The PL emission intensity increased up to 20 mol% B3+ concentration, while the intensity increase slightly slowed down over 10 mol%. By choosing 10 mol% B3+ doping ratio, SrTa2O6:xEu3+, yB3+ (x = 0.5, 1.5, 3, 5, 7, 10 mol%, y = 10 mol%) phosphors were fabricated to compare with the SrTa2O6:xEu3+ (x = 0.5, 1.5, 3, 5, 7, 10 mol%) series. The PL emissions of SrTa2O6:xEu3+, 0.1B3+ phosphors are presented in Fig. 7c, respectively. The PL emission intensity of SrTa2O6:xEu3+, 0.1B3+ phosphors showed a nearly threefold increase compared to the SrTa2O6:xEu3+ series, which is compatible with the luminescence increase reported in the literature due to boron effect.
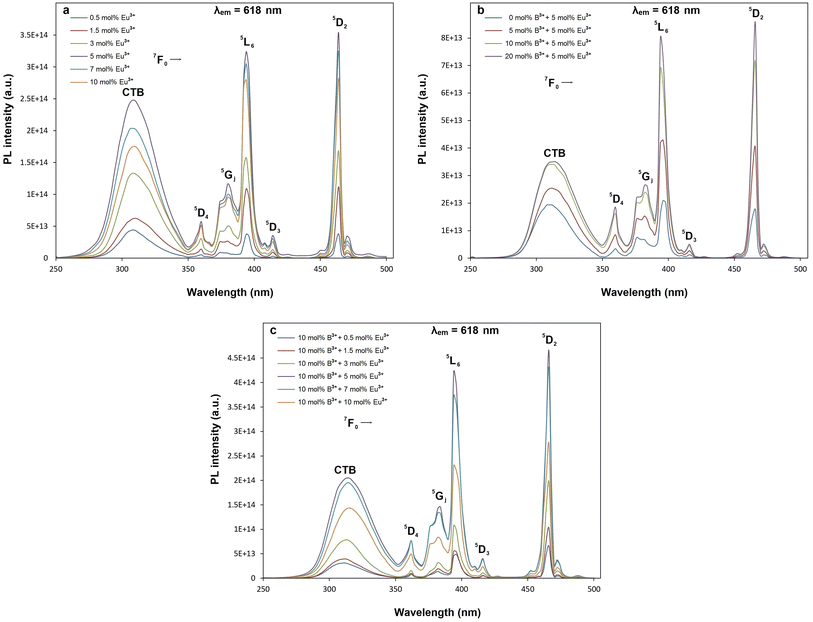 |
| | Fig. 6 PL excitation spectra and CT bands of (a) SrTa2O6:xEu3+, (b) SrTa2O6:0.05Eu3+, yB3+ (c) SrTa2O6:xEu3+, 0.1B3+ phosphors corresponding to 618 nm emission. | |
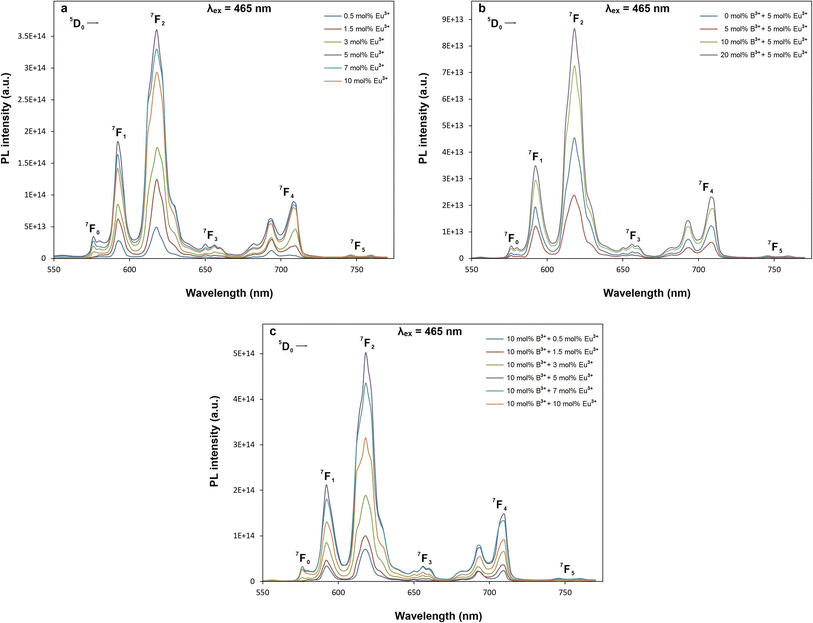 |
| | Fig. 7 PL emission spectra of (a) SrTa2O6:xEu3+, (b) SrTa2O6:0.05Eu3+, yB3+ (c) SrTa2O6:xEu3+, 0.1B3+ phosphors with excitation of 465 nm. | |
The charge transfer bands (CTB) under 618 nm wavelength of 5D0 → 7F2 transition are shown in Fig. 6a–c. As seen in the figures, the CTB peaks are over 300 nm, which is related to the ligand nature of the host structure.21,22 It has been reported by many studies that the CTB energy is found at low energies or over 300 nm due to the ligand environment with highly coordinated A and B tunnels of the tungsten bronze structure.6 Fig. 6b shows CT band position slightly affected with the increase in boron concentration, where the CTB peaks are at the wavelengths of 308.6, 310.4, 312.7, 314.2 nm for 0, 5, 10, 20 mol% B3+ concentrations, respectively. A shift to the lower energy in CTB position is also evident for the SrTa2O6:xEu3+, 0.1B3+ phosphors (Fig. 6c) compared to SrTa2O6:xEu3+ series (Fig. 6a), where CTB positions are by average about 313 and 309 nm, respectively. The shift in CTB energy is related to the binding strength of valence electrons and the site of rare earth.22 An atom with higher electronegativity will bind the oxygen 2p electron more strongly than an atom with lower electronegativity, where CT band will shift to a higher energy. The CTB energy will rise to a higher level, while the Eu3+ sites tend to be smaller. So, the CTB energy shift to the lower energy despite the high electronegativity of boron may be ascribed to the fact that the Eu3+ sites become larger. Another phenomenon is the relationship between CTB and hypersensitive transition. The inverse relationship between 5D0 → 7F2 transition and CTB is highlighted, where the more intensity of 5D0 → 7F2 transition indicates the lower energy of CTB.22,23 In Fig. 7b, the asymmetry ratios for 0, 5, 10, and 20 mol% B3+ concentrations are 1.97, 2.34, 2.48, and 2.49, respectively. In Fig. 7a and c, the asymmetry values for Eu3+ doped and Eu3+, B3+ co-doped phosphors varied in the range of 1.83–2.07, and 2.21–2.58, respectively. The results show that boron doping causes a decrease in CTB energy and an increase in the 5D0 → 7F2 transition intensity. On the other hand, the inverse correlation between CTB intensity and 5D0 → 7F2 transition is previously observed in TTB-MTa2O6:Eu3+ (Sr, Ba, Pb) phosphors. The trend of the 5D0 → 7F2 transition is BaTa2O6:Eu3+ > SrTa2O6:Eu3+ > PbTa2O6:Eu3+ while trend of intensity of CTB and 5D0 → 7F1 transition is reverse.6 Hua et al.24 compared the CINO:Eu3+, SINO:Eu3+, and BINO:Eu3+ phosphors. The CINO:Eu3+ phosphor has strong 5D0 → 7F2 transition and weak CTB intensity, while there is an opposite effect for SINO:Eu3+, BINO:Eu3+. A similar phenomenon was also observed in this study. In Fig. 6c, SrTa2O6:xEu3+, 0.1B3+ phosphors have a low CTB transition intensity and high asymmetry compared to SrTa2O6:xEu3+ phosphors (Fig. 6a). Since the formation of charge transfer bands or reduction of Eu3+ to Eu2+ is largely dependent on the nature of the ligands, the decrease in CTB density for the Eu3+, B3+ co-doped phosphors may be associated with the decreased electron transfer from neighboring atoms to Eu3+ ions in the tungsten bronze host. It has been reported in many studies that the addition of boron contributes to the improvement of crystallization and increases luminescence. Besides, it is generally believed that improved crystallinity properties and low crystal field symmetry are advantageous for the luminescence of rare earth activators.25 Consequently, the increase in asymmetry associated with the low crystal field symmetry of the Eu3+ sites as well as some enhancement crystallinity in Eu3+, B3+ co-doped samples support the PL increase.
UV lamp photographs of the phosphors under 365 nm are given in Fig. 8a–c. As seen from the pictures, the Eu3+, B3+ co-doped phosphors in Fig. 8c are brighter than Eu3+ doped samples in Fig. 8a. The increase in brightness with the increasing B3+ concentration is more evident after 10 mol%, which is given in Fig. 8b.
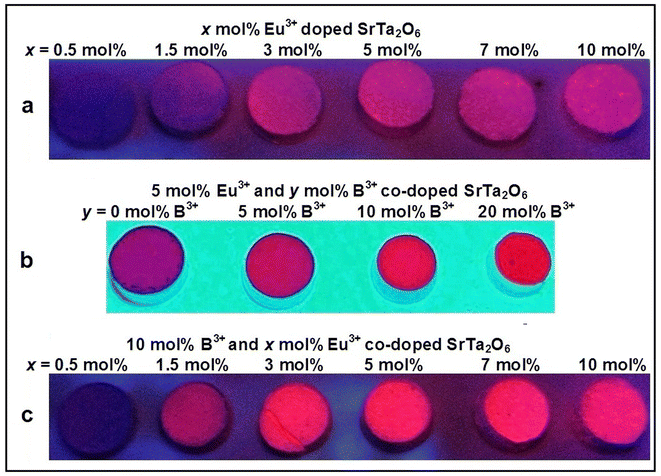 |
| | Fig. 8 UV lamp photos of (a) SrTa2O6:xEu3+, (b) SrTa2O6:0.05Eu3+, yB3+ (c) SrTa2O6:xEu3+, 0.1B3+ phosphors at 365 nm. | |
3.3 Judd–Ofelt analysis of SrTa2O6:xEu3+and SrTa2O6:xEu3+, 0.1B3+ phosphors
Judd–Ofelt (JO) theory explains the intensity of electron transitions in 4f shell of rare-earth ions using three parameters and describes their spectral properties.26,27 The JO intensity parameters ΩJ (J = 2, 4, 6) from emission spectrum for Eu3+ can be determined by eqn (1):28,29| |
 | (1) |
where V is the transition frequency, I1 and IJ for 5D0 → 7F1 and 5D0 → 7FJ transitions are the integrated intensities, respectively, SMD = 9.6 × 10−42 (esu2 cm2) is the magnetic dipole line strength,6 n is the refractive index, e = 4.803 × 10⁻¹⁰ (esu) is the elementary charge, J and J′ for the initial state and final state are the total angular momentum, respectively, |〈J‖UJ‖J〉|2 is the symbol of double reduced matrix elements for unit tensor operators. For all electric dipole (ED) transitions originating from the 5D0 level, the reduced matrix elements are zero except for the 5D0 → 7F2 (U2 = 0.0032), 5D0 → 7F4 (U4 = 0.0023) and 5D0 → 7F6 (U6 = 0.0002) transitions.28,29 The 5D0 → 7FJ (J = 1, 2, 4, 6) transitions are used for the determination of the radiative transition probabilities while 5D0 → 7FJ (J = 0, 3, 5) transitions are prohibited, and are not included JO calculation. The 5D0 → 7F6 transition related to Ω6 parameter was not included in the calculation because it could not be detected by PL in infrared region. However, the effect of this transition on the calculation is negligible, which has been reported in some studies.28,29 The spontaneous transition probability (A) is related to its dipole strength which can be expressed as eqn (2):| |
 | (2) |
where SED (electric dipole) and SMD (magnetic dipole) are line strengths (in esu2 cm2), h is Planck constant. The electric dipole line strengths (SED) from the JO parameters can be calculated by eqn (3):| |
 | (3) |
The χED and χMD are the local field corrections for the ED and MD transitions which can be found by eqn (4) and (5) respectively:
| |
 | (4) |
where
n is the refractive index of SrTa
2O
6 which was taken as 1.828 from ref.
6 and
7. The Judd–Ofelt intensity parameters (
Ω2,
Ω4) are given in
Table 1. The parameter
Ω2, which is closely related to the hypersensitive electric dipole transition (
5D
0 →
7F
2), indicates the covalency of the Eu–O bond character and the environmental changes of the Eu
3+ ion.
6,7 The trend of the
Ω2 parameter is SrTa
2O
6:
xEu
3+, 0.1B
3+ > SrTa
2O
6:
xEu
3+, where the slightly higher
Ω2 parameters of the boron doped phosphors indicate relatively high covalency of Eu–O and low local symmetry of Eu
3+ sites. The parameter
Ω4 is related to the electron density of the surrounding ligands, where an increase in
Ω4 parameter indicates a decreased electron density.
28,29 The trend of the
Ω4 parameter is SrTa
2O
6:
xEu
3+, 0.1B
3+ > SrTa
2O
6:
xEu
3+ wherein B
3+ co-doped phosphors have relatively weak ligand density. The relatively high value of the
Ω4 parameter may be ascribed to the reduced charge transfer from the ligand ions to the Eu
3+ ion, which supports the effect of boron to decrease the formation of CTB or the reduction of Eu
3+ to Eu
2+ and increase the
5D
0 →
7F
2 transition intensity.
Table 1 Judd–Ofelt intensity parameters (Ω2, Ω4) for SrTa2O6:xEu3+ (x = 0.5, 1.5, 3, 5, 7, 10 mol%) and SrTa2O6:xEu3+, yB3+ (x = 0.5, 1.5, 3, 5, 7, 10 mol%, y = 10 mol%) phosphors
| Eu3+ conc. (x mol%) |
SrTa2O6:xEu3+ |
SrTa2O6:xEu3+, 0.1B3+ |
| Ω2 (×10−20 cm2) |
Ω4 (×10−20 cm2) |
Ω2 (×10−20 cm2) |
Ω4 (×10−20 cm2) |
| 0.5 |
2.963 |
1.670 |
3.586 |
2.800 |
| 1.5 |
3.315 |
1.764 |
3.692 |
3.101 |
| 3 |
3.343 |
1.943 |
3.806 |
3.130 |
| 5 |
3.201 |
1.906 |
4.070 |
2.887 |
| 7 |
3.292 |
2.018 |
4.162 |
3.055 |
| 10 |
3.367 |
2.196 |
4.183 |
2.913 |
Fig. 9a–c shows the decay curves of SrTa2O6:xEu3+, SrTa2O6:0.05Eu3+, yB3+, and SrTa2O6:xEu3+, 0.1B3+ phosphors, respectively. The decay curves for 5D0 → 7F2 transition were detected by the emission of 618 nm and excitation of 465 nm. Fluorescence bi-exponential decay curves can be produced using eqn (6):27,28
| |
 | (6) |
where
It is PL intensity,
t is the time after excitation,
I0 is the background,
I1 and
I2 are luminescence intensities corresponding to
τ1 (long) and
τ2 (short) lifetimes, respectively. Accordingly, the average lifetime (
τ) can be calculated through
eqn (7):
28,30| |
 | (7) |
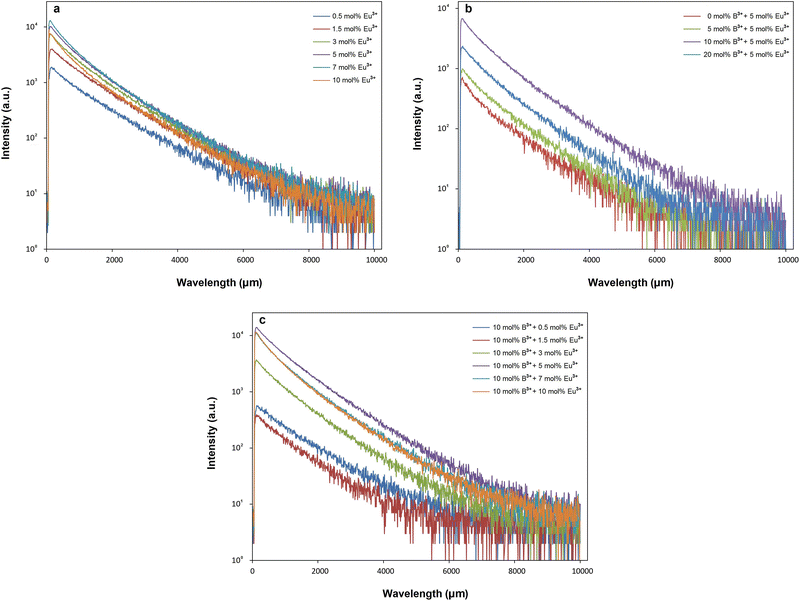 |
| | Fig. 9 Decay curves of (a) SrTa2O6:xEu3+, (b) SrTa2O6:0.05Eu3+, yB3+ (c) SrTa2O6:xEu3+, 0.1B3+ phosphors with emission of 618 nm and excitation of 465 nm. | |
The fitting parameters of bi-exponential decays for SrTa2O6:xEu3+, SrTa2O6:xEu3+, 0.1B3+, and SrTa2O6:0.05Eu3+, yB3+ are tabulated in Tables 2 and 3, where the average lifetimes varied between 1.178–0.904, 1.162–0.892, and 0.979–0.958 ms, respectively. In Table 2, for both phosphor series, a somewhat decrease was observed in the decay times with the increase of the Eu3+ concentration, and slightly low decay times were found in Eu3+, B3+ co-doped samples compared to Eu3+ doped samples. The increased asymmetry supports the relatively lower average lifetimes of Eu3+, B3+ co-doped samples.31 The τ1 (long) and τ2 (short) lifetimes of the phosphors are given in Tables 2 and 3. In the literature, the authors made definitions of the long (τ1) and short (τ2) lifetimes, where the short decay component is associated with Eu3+ ions close to the surfaces of the particles, while the long decay component is related to Eu3+ ions in inner part of the particles.32–35 Padlyak et al.36 emphasized that the long lifetimes are characteristic of luminescence centers and belong to isolated Eu3+ centers in oxide glasses and polycrystalline samples while the short components belong to the Eu3+–Eu3+ exchange-coupled pairs or small exchange-coupled Eu3+ clusters. On the other hand, Gupta et al.37,38 highlighted that the long component and the short component are associated with high symmetry and low symmetry of Eu3+ ions, respectively. In Tables 2 and 3, there is an increase in τ2 lifetimes and slight decrease in τ1 lifetimes of Eu3+, B3+ co-doped samples compared to Eu3+ doped phosphors. Accordingly, the change in the τ1 and τ2 lifetimes may be originated from the activation of Eu3+ luminescence centers at the particle surface rather than in the particle core/isolated centers. The variation in τ2 an τ1 lifetimes can be explained by the lowering of local symmetry of Eu3+ due to the presence of boron, which was previously expressed as an increase in 5D0 → 7F2/5D0 → 7F1. The asymmetry variation of the Eu3+ doped samples is associated with the A, and B site occupation, charge balance, or some degree of crystal distortion in the tungsten bronze structure.4,39 On the other hand, although there is some improvement in the crystal properties, the increase in the ratio of 5D0 → 7F2/5D0 → 7F1 or the decrease in the local symmetry of Eu3+ ions is high in Eu3+, B3+ co-doped samples. As mentioned in the XPS results, the fact that boron makes strong bonds with oxygen in the structure may be the reason for this difference (such as polarization). As another consequence, increase of grain size in SEM micrographs is associated with the vitrification effect that accelerates agglomeration in boron grains. By evaluating the SEM micrographs and the decay components, it is seen that there is a correlation between grain growth and the increase in the short components. Similar behavior has been observed in Sm3+ doped BaTa2O6 phosphor, where grain growth with increasing sintering temperature leads to an increase in short components.5 Although this requires further observation, it shows that grain growth may be related to the increase of Eu3+ luminescence centers on grain surfaces and a decrease in crystal field symmetry. The quantum efficiency (ηQE) of 5D0 level can be found from the ratio of the average (observed) lifetime (τ) to the radiative lifetime (τr) by eqn (8):
| |
 | (8) |
where the radiative and nonradiative transitions of
5D
0 are
Ar and
Anr, respectively. The radiative lifetimes (
τr) and quantum efficiencies (
ηQE) are tabulated in
Table 2. The values of the
ηQE% for SrTa
2O
6:
xEu
3+ and SrTa
2O
6:
xEu
3+, 0.1B
3+ phosphors varied between 36.03–30.30% and 42.72–36.08%, respectively. The
ηQE% for Eu
3+ and B
3+ co-doped phosphors corresponds to an approximate increase of 15–21%. The quantum efficiency of the highest luminescent (or 0.05Eu
3+, 0.1B
3+ co-doped) phosphor increased by about 21%. As mentioned in the previous sections, the low symmetry of the Eu
3+ sites and some enhancement in crystal structure properties are likely to increase the luminescence efficiency.
Table 2 Long (τ1) and short (τ2) lifetimes, average (observed) lifetimes (τ), radiative lifetimes (τr), quantum efficiencies (ηQE) and chi-square (x2) values for SrTa2O6:xEu3+ (x = 0.5, 1.5, 3, 5, 7, 10 mol%) and SrTa2O6:xEu3+, yB3+ (x = 0.5, 1.5, 3, 5, 7, 10 mol%, y = 10 mol%) phosphors
| Eu3+ conc. (x mol%) |
SrTa2O6:xEu3+ |
SrTa2O6:xEu3+, 0.1B3+ |
| τ1 (ms) |
τ2 (ms) |
τ (ms) |
τr (ms) |
ηQE (%) |
x2 |
τ1 (ms) |
τ2 (ms) |
τ (ms) |
τr (ms) |
ηQE (%) |
x2 |
| 0.5 |
1.293 |
0.504 |
1.178 |
3.283 |
35.88 |
1.190 |
1.259 |
0.429 |
1.162 |
2.720 |
42.72 |
1.106 |
| 1.5 |
1.274 |
0.319 |
1.101 |
3.056 |
36.03 |
1.151 |
1.205 |
0.521 |
1.086 |
2.619 |
41.47 |
1.196 |
| 3 |
1.198 |
0.421 |
1.012 |
3.025 |
33.45 |
1.179 |
1.183 |
0.452 |
1.003 |
2.570 |
39.03 |
1.108 |
| 5 |
1.147 |
0.462 |
0.978 |
3.110 |
31.45 |
1.156 |
1.135 |
0.425 |
0.959 |
2.516 |
38.12 |
1.225 |
| 7 |
1.112 |
0.387 |
0.919 |
3.033 |
30.30 |
1.142 |
1.104 |
0.437 |
0.902 |
2.456 |
36.73 |
1.208 |
| 10 |
1.148 |
0.395 |
0.904 |
2.952 |
30.62 |
1.360 |
1.113 |
0.423 |
0.892 |
2.472 |
36.08 |
1.194 |
| Avg |
1.195 |
0.415 |
1.015 |
3.077 |
32.96 |
— |
1.167 |
0.448 |
1.001 |
2.559 |
39.03 |
— |
Table 3 Long (τ1) and short (τ2) lifetimes, average (observed) lifetimes (τ) and chi-square (x2) values for SrTa2O6:xEu3+, yB3+ (x = 5 mol%, y = 0, 5, 10, 20 mol%) phosphors
| B3+ conc. (y mol%) |
SrTa2O6:0.1Eu3+ |
| τ1 (ms) |
τ2 (ms) |
τ (ms) |
x2 |
| 0 |
1.131 |
0.306 |
0.979 |
1.057 |
| 5 |
1.111 |
0.346 |
0.991 |
1.003 |
| 10 |
1.147 |
0.436 |
0.950 |
1.178 |
| 20 |
1.110 |
0.440 |
0.958 |
1.107 |
4. Conclusion
The effect of boron on the structural and spectral properties was studied by using Eu3+ doped orthorhombic β-SrTa2O6 fabricated by solid-state method at 1400 °C for 20 h. The phase structure of all the ceramics preserved up to 10 mol%, and the Eu3+, B3+ co-doped samples have relatively slightly better crystallinity. SEM micrographs showed that the presence of boron promoted agglomeration and growth in grains. The increment in boron concentration led to an increase in PL up to 20 mol%, and the increase of PL may be related to the low symmetry of Eu3+ ions and the improvement of crystal properties. In Eu3+, B3+ co-doped samples, the charge transfer band slightly shifted to the lower energy and asymmetry of phosphor increased. The trend of Judd–Ofelt (Ω2, Ω4) parameters was SrTa2O6:xEu3+, 0.1B3+ > SrTa2O6:xEu3+. The high values of the Ω2, and Ω4 for Eu3+, B3+ co-doped phosphors related to a covalent Eu–O bond character with low symmetry of the Eu3+ ions and a reduced electron density in the ligands, respectively. While the increase of Eu3+ causes a slight decrease in the decay times, the decrease is slightly more in the Eu3+, B3+ co-doped samples. The increase in τ2 lifetimes may be associated with the activation of the Eu3+ luminescence centers at the grain surface and near the surface. The quantum efficiencies of the Eu3+, B3+ co-doped phosphors increased between 15–21%.
Conflicts of interest
There are no conflicts to declare.
References
- K. Binnemans, Coord. Chem. Rev., 2015, 295, 1–45 CrossRef CAS.
- C. G. Walrand and K. Binnemans, Handbook on the Physics and Chemistry of Rare Earths, Elsevier, Belgium, 1998, pp. 101–264 Search PubMed.
- M. İlhan and İ. Ç. Keskin, Physica B, 2020, 85, 412106 CrossRef.
- M. İlhan, Solid State Sci., 2014, 38, 160–168 CrossRef.
- M. İlhan and L. F. Güleryüz, Chem. Pap., 2022, 76, 6963–6974 CrossRef.
- M. İlhan, M. İ. Katı, İ. Ç. Keskin and L. F. Güleryüz, J. Alloys Compd., 2022, 901, 163626 CrossRef.
- M. İlhan, İ. Ç. Keskin, L. F. Güleryüz and M. İ. Katı, J. Mater. Sci.: Mater. Electron., 2022, 33, 16606–16620 CrossRef.
- E. Lee, C. H. Park, D. P. Shoemaker, M. Avdeev and Y. I. Kim, J. Solid State Chem., 2012, 191, 232–238 CrossRef CAS.
- J. Y. Kim and Y. I. Kim, J. Ceram. Soc. Jpn., 2015, 123, 419–422 CrossRef CAS.
- H. Kato and A. Kudo, Chem. Lett., 1999, 28, 1207–1208 CrossRef.
- Y. Huang, Q. Feng, Y. Yang and H. J. Seo, Phys. Lett. A, 2005, 336, 490–497 CrossRef CAS.
- D. Zhao, Y. Yu, C. Cao, J. Wang, E. Wang and Y. Cao, Appl. Surf. Sci., 2015, 345, 67–71 CrossRef CAS.
- N. Lu, H. Zhao, J. Li, X. Quan and S. Chen, Sep. Purif. Technol., 2008, 62, 668–673 CrossRef CAS.
- E. Finazzi, C. D. Valentin and G. Pacchioni, J. Phys. Chem. C, 2009, 133, 220–228 CrossRef.
- V. Vitola, I. Bite, D. Millers, A. Zolotarjovs, K. Laganovska, K. Smits and A. Spustaka, Ceram. Int., 2020, 46, 26377–26381 CrossRef CAS.
- A. S. Başak, M. K. Ekmekçi, M. Erdem, M. İlhan and A. Mergen, J. Fluoresc., 2016, 26, 719–724 CrossRef PubMed.
- J. Kaduk and W. Wong-Ng, International Center for Diffraction Data, PDF code 00-051-1683 Search PubMed.
- W. E. Moddeman, A. R. Burke, W. C. Bowling and D. S. Foose, Surf. Interface Anal., 1989, 14, 224 CrossRef CAS.
- D. H. Quinones, A. Rey, P. M. Álvarez, F. J. Beltrán and G. L. Puma, Appl. Catal., B, 2015, 178, 74–81 CrossRef CAS.
- W. Zhang, T. Hu, B. Yang, P. Sun and H. He, J. Adv. Oxid. Technol., 2013, 16, 261–267 CAS.
- G. Blasse, J. Solid State Chem., 1972, 4, 52–54 CrossRef CAS.
- P. Dorenbos, J. Lumin., 2005, 111, 89–104 CrossRef CAS.
- D. E. Henrie, R. L. Fellows and G. R. Choppin, Coord. Chem. Rev., 1976, 18, 199–224 CrossRef CAS.
- Y. Hua, T. Wang, J. S. Yu, W. Ran and L. Li, Inorg. Chem. Front., 2022, 9, 6211–6224 RSC.
- Q. Shao, H. Zhang, J. Dai, C. Yang, X. Chen, G. Feng and S. Zhou, CrystEngComm, 2020, 22, 1359 RSC.
- B. R. Judd, Phys. Rev., 1962, 127, 750 CrossRef CAS.
- G. S. Ofelt, J. Chem. Phys., 1962, 37, 511 CrossRef CAS.
- M. İlhan, M. K. Ekmekçi and İ. Ç. Keskin, RSC Adv., 2021, 11, 10451–10462 RSC.
- M. İlhan and İ. Ç. Keskin, Phys. Chem. Chem. Phys., 2020, 22, 19769–19778 RSC.
- R. Saraf, C. Shivakumara, S. Behera, H. Nagabhushana and N. Dhananjaya, RSC Adv., 2015, 5, 4109 RSC.
- G. Blasse, J. Phys. Chem. Solids, 1989, 50, 99 CrossRef CAS.
- J. W. Stouwdam and F. C. M. van Veggel, Nano Lett., 2002, 2, 733–737 CrossRef CAS.
- V. Sudarsan, F. C. J. M. van Veggel, R. A. Herring and M. Raudseppc, J. Mater. Chem., 2005, 15, 1332 RSC.
- N. Yaiphaba, R. S. Ningthoujam, N. S. Singh, R. K. Vatsa, N. R. Singh, S. Dhara, N. L. Misra and R. Tewari, J. Appl. Phys., 2010, 107, 034301 CrossRef.
- A. K. Parchur and R. S. Ningthoujam, RSC Adv., 2012, 2, 10859–10868 RSC.
- B. Padlyak, M. Grinberg, B. Kukliński, Y. Oseledchik, O. Smyrnov, D. Kudryavtcev and A. Prosvirnin, Opt. Appl., 2010, 2, 413–426 Search PubMed.
- S. K. Gupta, B. Modak, M. Tyagi, N. S. Rawat, P. Modak and K. Sudarshan, ACS Omega, 2022, 7, 5311–5323 CrossRef CAS PubMed.
- S. K. Gupta, C. Reghukumar and R. M. Kadam, RSC Adv., 2016, 6, 53614–53624 RSC.
- M. İlhan, M. K. Ekmekçi, A. Mergen and C. Yaman, J. Fluoresc., 2016, 26, 1671–1678 CrossRef PubMed.
|
| This journal is © The Royal Society of Chemistry 2023 |
Click here to see how this site uses Cookies. View our privacy policy here.  Open Access Article
 *a and
Lütfiye Feray Güleryüz
 b
b


![[thin space (1/6-em)]](https://www.rsc.org/images/entities/char_2009.gif) 000× magnifications under 15 kV accelerating voltage are shown in Fig. 4a–h, respectively. In SEM micrographs, it is seen that boron doping promotes agglomeration and growth, where grain boundaries are reduced or disappeared. In addition, grain size and agglomeration increase with increasing boron, as reported in the supporting study.15 The increase in grain size can be seen in Fig. 4a, c, e and g at 2000× magnifications. More detail is shown in Fig. 4b, d, f and h at 10
000× magnifications under 15 kV accelerating voltage are shown in Fig. 4a–h, respectively. In SEM micrographs, it is seen that boron doping promotes agglomeration and growth, where grain boundaries are reduced or disappeared. In addition, grain size and agglomeration increase with increasing boron, as reported in the supporting study.15 The increase in grain size can be seen in Fig. 4a, c, e and g at 2000× magnifications. More detail is shown in Fig. 4b, d, f and h at 10![[thin space (1/6-em)]](https://www.rsc.org/images/entities/char_2009.gif) 000× magnifications, which are shown in the inset figures of Fig. 4a, c, e and g as yellow windows. Fig. 5a and b shows the XPS analysis of the 5 mol% Eu3+, 20 mol% B3+ co-doped sample. In Fig. 5a, the binding energies of O1s, Sr3d, and Ta4f were identified at 529.26, 133.44, and 26.23 eV which belong to tantalum oxide structure, respectively. Also, the 1133 eV peak defines the europium dopant with Eu3d. In Fig. 5b, the binding energy of B1s is 189.59 eV. The broad spectrum in the range of about 187–192 eV shows that boron was incorporated into the structure. The binding energies of boron for the elemental and fully oxidized form (B2O3) are 187.2 eV (ref. 18) and 193.0 eV,19,20 respectively. Accordingly, the broad B1s spectrum shows that interstitial B atoms can exist in different stoichiometric forms with oxygen in the structure.
000× magnifications, which are shown in the inset figures of Fig. 4a, c, e and g as yellow windows. Fig. 5a and b shows the XPS analysis of the 5 mol% Eu3+, 20 mol% B3+ co-doped sample. In Fig. 5a, the binding energies of O1s, Sr3d, and Ta4f were identified at 529.26, 133.44, and 26.23 eV which belong to tantalum oxide structure, respectively. Also, the 1133 eV peak defines the europium dopant with Eu3d. In Fig. 5b, the binding energy of B1s is 189.59 eV. The broad spectrum in the range of about 187–192 eV shows that boron was incorporated into the structure. The binding energies of boron for the elemental and fully oxidized form (B2O3) are 187.2 eV (ref. 18) and 193.0 eV,19,20 respectively. Accordingly, the broad B1s spectrum shows that interstitial B atoms can exist in different stoichiometric forms with oxygen in the structure.


