
 Open Access Article
 This Open Access Article is licensed under a Creative Commons Attribution-Non Commercial 3.0 Unported Licence
High-precision zinc isotopic characterization of twenty soil reference materials from China determined by MC-ICP-MS
Hua-Ye Zhaia,
Xuan-Ce Wang *ab,
Chao-Feng Lic,
Simon A. Wilded,
Xiang-Zhong Lia,
Bei Xu*e,
Xian-Liang Zhanga and
Ping Zhanga
*ab,
Chao-Feng Lic,
Simon A. Wilded,
Xiang-Zhong Lia,
Bei Xu*e,
Xian-Liang Zhanga and
Ping Zhanga
aYunnan University, Kunming 650504, China. E-mail: x.wang4@uq.edu.au
bSchool of Earth and Environmental Sciences, The University of Queensland, QLD 4072, Australia
cState Key Laboratory of Lithospheric Evolution, Institute of Geology and Geophysics, Chinese Academy of Sciences, P.O. Box 9825, Beijing 100029, China
dARC Centre of Excellence for Core to Crust Fluid Systems, The Institute for Geoscience Research, Curtin University, GPO Box U1987, Perth, WA 6845, Australia
eHebei Key Laboratory of Strategic Critical Mineral Resources, Hebei GEO University, Shijiazhuang 050031, China. E-mail: bxu@pku.edu.cn
First published on 28th June 2023
Abstract
Zinc isotopic ratios serve as powerful tools for tracing biochemical cycling of metals at Earth's surface, including the distribution, transportation, and enrichment of zinc (Zn) in soil. To conduct such studies and enable inter-laboratory comparisons, high-precision Zn isotopic measurements require the use of soil reference materials (RMs). However, there have been limited reports on the high-precision Zn isotope ratios of soil RMs thus far. In this study, we have developed a two-step Zn chemical separation protocol utilizing Bio-Rad AG MP-1M resin columns. This method has demonstrated excellent reproducibility for measuring the external δ66Zn values (relative to JMC-Lyon) of standard soil reference materials over an extended time period, with a better than 0.06‰ (2SD) precision. Remarkably, this study is the first to report the Zn isotopic compositions of 20 soil reference materials from various soil types in China. With the exception of one sample obtained from a mining area, the Zn isotopic compositions of all the analyzed soil reference materials exhibit remarkable similarity, with an average δ66Zn value of 0.31 ± 0.12‰, which aligns closely with the values observed in igneous rocks. The exceptional sample, with a higher δ66Zn value of 0.61 ± 0.02‰, indicates potential contamination during mining activities.
1. Introduction
With the development of Multiple-Collector Inductively Couple Plasma Mass Spectrometry (MC-ICP-MS) analytical technology over the past two decades, non-traditional stable isotope systems have been amenable to study, providing a powerful tool in the fields of geochemistry,1 ore deposit research,2 paleoceanography,3 and biology.4 As a key non-traditional stable metal isotope, Zn has shown its great potential to trace biochemical cycling in the Earth's surface systems (soils, atmosphere, water).5–10Zn is an essential life element for a range of organisms.11,12 However, as a heavy metal element, excessive Zn can cause significant damage to crops. The appropriate concentration of Zn is one of the keys to the evolution of life. When wheat is irrigated with water with a Zn concentration exceeding 100 ppm, it will destroy the stability of the cell membrane of the leaves and accelerate the senescence of the wheat.13 In addition, excessive Zn in the human body will reduce the absorption efficiency of nutrients such as Fe and Cu, resulting in their lack in the human body, thus leading to Fe-deficiency anemia and the occurrence of diseases such as rickets in children.14–17 Soil structure, as the basic medium for plant growth, controls the migration and enrichment of Zn and the form of Zn is important if plants are to absorb it.15,18–22 Therefore, research on the migration and fractionation of Zn in soil can provide scientific guidance for taking reasonable counter-measures in areas of Zn-deficiency and Zn-contamination.
The behavior of the various Zn isotopes during soil formation and plant growth is crucial for tracing the biochemical cycling of Zn at the Earth's surface. The currently available data show that the fractionation behavior of Zn isotopes in soils is crucial for understanding the uptake of Zn during plant growth.23 Zinc in soil solutions usually exists in an organically-bound form, with organic matter more likely to bind the heavier Zn isotopes.24 In addition, clay minerals and Fe–Mn oxide adsorption also exert important controls on Zn isotopic fractionation in soils.23,25 These studies indicate that soils are important reservoirs of Zn and hence detailed studies are crucial for examining and determining biochemical cycling of Zn in Earth's surface systems.
Although MC-ICP-MS has advantages in non-traditional stable isotope analysis,26 including high ionization efficiency, high sample throughput, and high mass resolution, the large instrumental mass bias requires a well-designed correction protocol. Among different analytical mass-bias correction strategies, the “empirical external normalization” (EEN) approach proposed by Maréchal et al. (1999)27 has been proven successful for Zn isotope measurement.28,29 This method is based on the “external” normalization of Zn relative to a Cu standard (Cu-SRM976, NIST) added into each solution. Although analytical protocols of MC-ICP-MS measurement of Zn isotopes in silicate materials have been well documented in the past decade,30 few case studies have focused on soil samples due to the challenging analytical techniques required. Because few Zn isotope data on soil reference materials have been reported in the literature, this has hampered the understanding and application of Zn isotope geochemistry in optimizing conditions for successful plant growth. In this study, we applied a newly-developed method to determine Zn isotopic composition of 20 soil reference materials, collected from different regions of China. The Zn isotopes of these different types of soil reference materials are systematically evaluated and reported. An evaluation of the reproducibility of the measurements demonstrates that both precise and accurate data can be obtained. We also provide a comprehensive dataset of recommended Zn isotope values for the various soil types and associated uncertainties, which encompasses a wide range of geological and biological disciplines and serves as a valuable reference for quality assurance and inter-laboratory comparisons. The dataset fills an important gap in the existing knowledge and facilitates future zinc isotopic studies in diverse scientific fields.
2. Experimental
2.1 Materials, reagents and samples
AG MP-1M resins (100–200 mesh, Bio-Rad®) were used in this study for Zn purification, as these are a classical and widely-used anion exchanger and have been designed to extract transition elements from seawater.5,27 The resin was carefully washed by successively passing 6 M HCl and Milli-Q before loading the columns. All high-purity acids used in this study were purified by double sub-boiling distillation of the TraceMetal™ grade acids (from Thermo Fisher Scientific), which were then diluted using ultrapure water (18.2 MΩ cm, see below). The Bio-Rad Poly-Prep columns and pipette tips were cleaned by soaking them in 10% v/v HCl for 48 hours (at room temperature) and then rinsing them with ultrapure water. All the Savillex® PFA Teflon beakers were cleaned by purifying them in 6 mol l−1 HCl, 7 mol l−1 HNO3 and then ultrapure water.This study is the first to analyze Zn isotopic compositions of 20 soil reference materials from all over China, which includes most soil types (Dark brown earths, Castanozems, Yellow-brown earths, Limestone soil, Yellow-red earths, Humid-thermo ferralitic, Loess, Soil of cultivation, Shahist, Saline soil, Brown desert soil, Sierozems, Phaeozem, Paddy soil, Red earths, Dark loessial soils). The basic information on the soil reference materials is shown in Table 1. For most materials, different amounts of powders (4.4–70 mg) containing ∼1 μg Zn were digested for chemical separation. For samples with very low Zn mass fractions (GSS-3a and GSS-17), 95 mg and 103 mg powders were digested. All samples were digested in 3 ml of 23 mol l−1 HF and 1 ml of 14 mol l−1 HNO3 in a 15 ml Savillex® PFA screw-top capsule. The capsules were capped and placed on a hot plate at 150 °C for at least 3 days. They were then dried and treated with aqua regia solution, followed by 2 ml HCl (11.4 mol l−1) for full digestion. Samples were then dried and finally dissolved in 1 ml 6 mol l−1 HCl for chemical purification.
| Sample ID | Sampling area | Soil types |
|---|---|---|
| GBW07401a (GSS-1a) | Yichun, Heilongjiang | Dark brown earths |
| GBW07402a (GSS-2a) | Bayan Obo, Inner Mongolia | Castanozems |
| GBW07403a (GSS-3a) | Laizhou, Shandong | Yellow-brown earths |
| GBW07404a (GSS-4a) | Yizhou, Guangxi | Limestone soil |
| GBW07405a (GSS-5a) | Liuyang, Hunan | Yellow-red earths |
| GBW07406a (GSS-6a) | Yangchun | Yellow red earths |
| GBW07407a (GSS-7a) | Xu Wen, Guangdong | Humid-thermo ferralitic |
| GBW07408a (GSS-8a) | Luochuan, Shaanxi Province | Loess |
| GBW07427 (GSS-13) | North China Plain | Soil of cultivation |
| GBW07428 (GSS-14) | Sichuan Basin | Soil of cultivation |
| GBW07446 (GSS-17) | Wulate, Inner Mongolia | Shahist |
| GBW07447 (GSS-18) | Hangmianhou Banner, Inner Mongolia | Saline soil |
| GBW07448 (GSS-19) | Haiyan County, Qinghai | Brown desert soil |
| GBW07449 (GSS-20) | Shanshan, Xinjiang | Saline soil |
| GBW07450 (GSS-21) | Shihezi, Xinjiang | Sierozems |
| NSA-1 | Suihua, Heilongjiang | Phaeozem |
| NSA-5 | Changsha County, Hunan | Paddy soil |
| NSA-6 | Shaoguan, Guangzhou | Red earths |
| HTSB-2 | Luochuan, Shaanxi | Dark loessial soils |
| HTSB-5 | Qinghai mutual assistance | Castanozems |
2.2 Chemical purification procedure
The separation procedure used in this study is modified from Maréchal et al. (1999)27 and Chen et al. (2009).31 We used a two-step method to purify Zn isotopes from matrices, and Fig. 1 shows the elution curves. The first column was a 10 ml Bio-Rad Poly-Prep column with 2 ml of AG MP-1M (100- to 200-mesh) anion-exchange resin, and the second was a 10 ml Bio-Rad Poly-Prep column with 0.6 ml of the same resin. Before loading into the column, the resin was precleaned by alternately using 0.5 mol l−1 HNO3, ultrapure H2O, 6 mol l−1 HCl and ultrapure H2O. The details of the chemical purification procedure are given in Table 2. After 2 ml of AG MP-1M resin was loaded into the precleaned first column, it was washed with 0.5 mol l−1 HNO3 (30 ml) and ultrapure H2O (15 ml) and then conditioned with 6 mol l−1 HCl (8 ml). The sample was loaded into the column in 1 ml 6 mol l−1 HCl. After Na, Mg, Ti, Al, Ni, K and Ca were eluted using 4 ml 6 mol l−1 HCl and Fe and Cu were eluted using 6 ml 0.5 mol l−1 HCl, all Zn (>99%) was collected with 12 ml 0.5 mol l−1 HNO3 (Fig. 1). The Zn yields were calculated by comparing the Zn amount determined in our BHVO-2 rock powder with the amount of Zn collected at the end of the chemical separation procedure. Because a small residue of matrix elements remained in the collected Zn solutions, a second separation step with 0.6 ml AG MP-1M (100 to 200 mesh) resin was used for further purification following the procedure described in Table 2. Here, the samples were dissolved and diluted in 2% m/m HNO3 to 200 ng g−1 Zn solutions for isotopic determination. The total procedure yield of Zn is better than 99%, and the whole-procedure blank was less than 2 ng, which constitutes less than 0.2% of the total Zn (>1 μg) collected and thus has negligible influence on the Zn isotope results.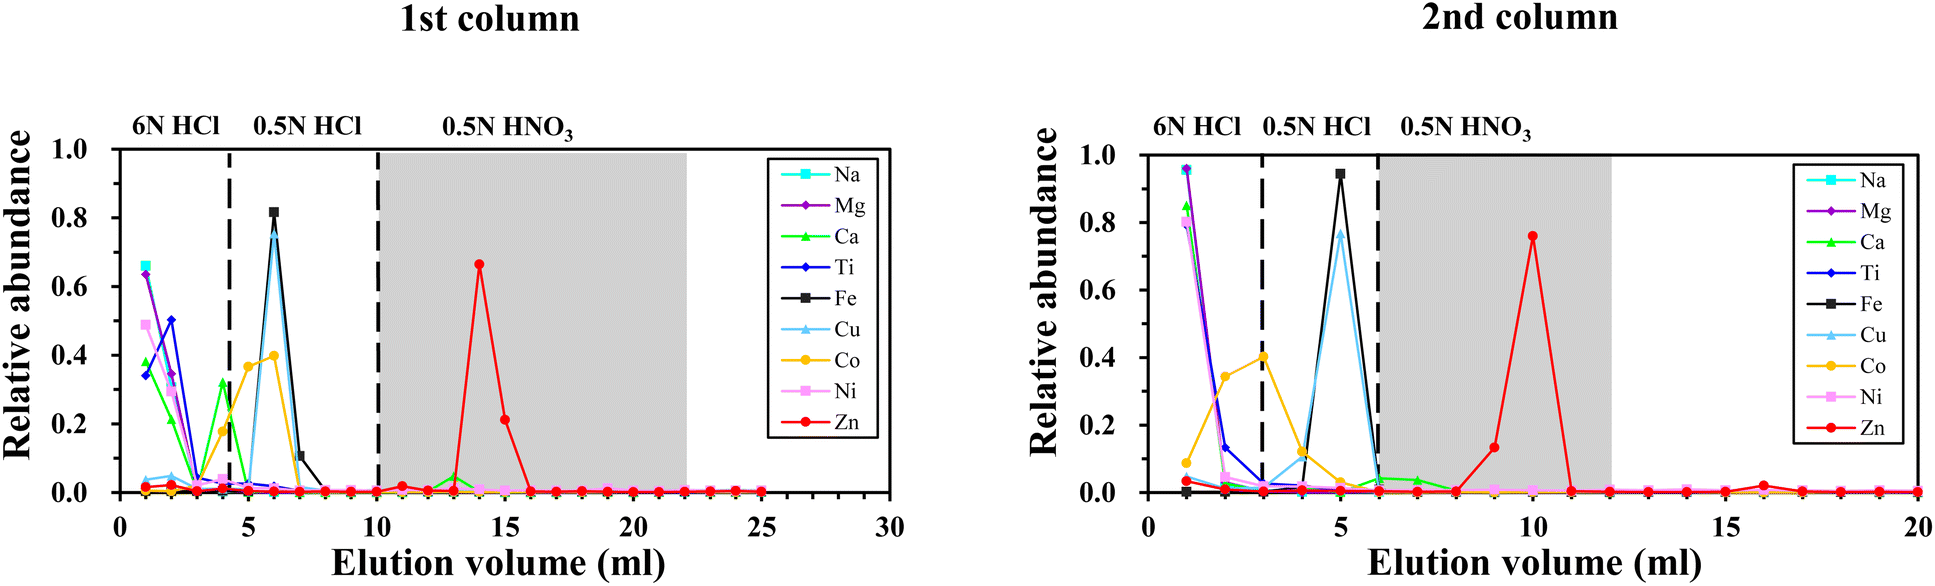 | ||
| Fig. 1 After loading samples, most matrices were eluted using 6 mol l−1 HCL, and Fe and Cu were eluted using 0.5 mol l−1 HCL, and then, Zn was collected with 0.5 mol l−1 HNO3. The x-axis is the volume of acid used and the y-axis is the relative abundance, which is the element content in the cut compared with the total abundance of that element. | ||
| Eluant | ml | Eluted |
|---|---|---|
| Column 1: 2 ml Bio-rad AG MP-1M resin (100–200 mesh) | ||
| 0.5 mol l−1 HNO3 | 30 | Cleaning |
| H2O | 15 | Rinsing |
| 6 mol l−1 HCl | 8 | Conditioning |
| 6 mol l−1 HCl sample solution | 1 | Loading |
| 6 mol l−1 HCl | 4 | Matrix |
| 0.5 mol l−1 HCl | 6 | Matrix |
| 0.5 mol l−1 HNO3 | 12 | Eluting Zn |
![[thin space (1/6-em)]](https://www.rsc.org/images/entities/char_2009.gif) |
||
| Column 2: 0.6 ml Bio-rad AG MP-1M resin (100–200 mesh) | ||
| 0.5 mol l−1 HNO3 | 30 | Cleaning |
| H2O | 15 | Rinsing |
| 6 mol l−1 HCl | 8 | Conditioning |
| 6 mol l−1 HCl sample solution | 1 | Loading |
| 6 mol l−1 HCl | 2 | Matrix |
| 0.5 mol l−1 HCl | 3 | Matrix |
| 0.5 mol l−1 HNO3 | 7 | Eluting Zn |
2.3 Mass spectrometry
Zinc isotopic analysis was performed on a Thermo-Fisher Neptune Plus Multiple-Collector Inductively Couple Plasma Mass Spectrometry (MC-ICP-MS) at the Hebei Key Laboratory of Strategic Critical Mineral Resources, Hebei GEO University. The Zn isotopic data were acquired in the static collection mode, and the configuration of the Faraday cups is shown in Table 3. About 4–5 V signal for 64Zn (with a 1011 Ω resistor for the Faraday cup) was obtained for a 200 ng g−1 Zn solution using the high-sensitivity (X) cones in low-resolution mode (M/ΔM ≈ 1200). Typically, each measurement routine lasted approximately 13 min and comprised 10 “blocks” of 10 “cycles”. Each cycle consisted of an idle time of 3 s and integration over the peak center of 4.194 s, with each analysis comprising 100 cycles. Ultra-pure 2% m/m HNO3 was rinsing after each measurement for about 2 min. Under such conditions, the measurement reproducibility was better than ±0.06‰ (2SD) on the Cu-corrected 66Zn/64Zn ratio. Zinc isotope data are reported in standard δ-notation in per mil relative to JMC Lyon Zn standard 3-0749L:| δxZn (‰) = [(xZn/64Zn)sample/(xZn/64Zn)JMC 3-0749L − 1] × 1000, where x = 66, 68 |
| Cup | L3 | L2 | L1 | C | H1 | H2 | H3 |
|---|---|---|---|---|---|---|---|
| Accepting ions | 62Ni+ | 63Cu+ | 64Zn+ | 65Cu+ | 66Zn+ | 67Zn+ | 68Zn+ |
| 64Ni+ |
To accurately measure Zn isotopic ratios in natural samples, raw data must be corrected for instrumental mass bias.27,32 The direct sample-standard bracketing (SSB)32 method was not used in this study, because it requires perfect instrumental stability. Instead, mass discrimination in this study was corrected by external normalization through the addition of an internal Cu standard (SRM 976) to both standard and sample Zn solutions.33
The δ66Zn values are sensitive to the amounts of Ni in the sample solutions, because 64Ni+ can produce intense isobaric interferences on 64Zn+. Previous studies indicated that when [Ni]/[Zn] ratios reach 0.001, an obvious offset of δ66Zn (>0.07‰) was observed, but when the [Ni]/[Zn] ratio is less than 0.0005, the isobaric interference of 64Ni+ on 64Zn+ is negligible.33 For monitoring of sample purity and the potential isobaric interference of 64Ni+ on 64Zn+, 62Ni+ was measured. To determine both the subtraction of 64Ni and the correction of the mass discrimination of Zn isotopes by Cu, it is necessary to measure 63Cu+, 64Zn+/64Ni+, 65Cu+, 66Zn+, 67Zn+, 68Zn+ at the same time. It is generally accepted that the mass fractionation produced by the instrument follows the law of exponential fractionation.34
For Cu this is:
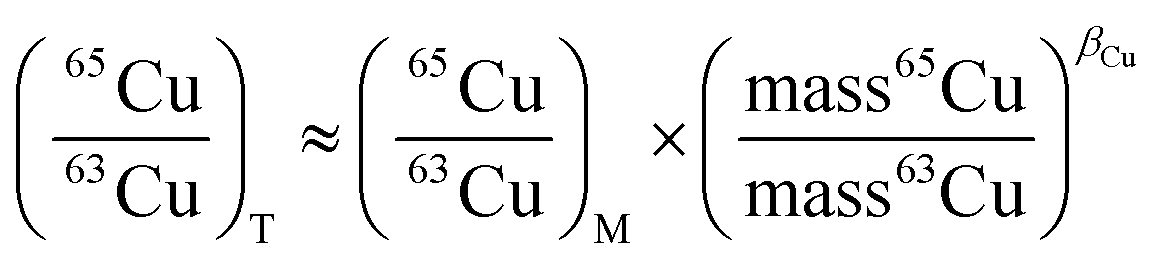 | (1) |
(65Cu/63Cu)T represents the true value of the ratio of isotopic abundances of 65Cu and 63Cu. (65Cu/63Cu)M represents a measure of the ratio of the abundances of 65Cu and 63Cu. (mass65Cu/mass63Cu) represents the ratio of the mass numbers of 65Cu and 63Cu. βCu is the mass fractionation factor generated by the instrument.
Similarly, for 64Ni isobaric interference correction we have:
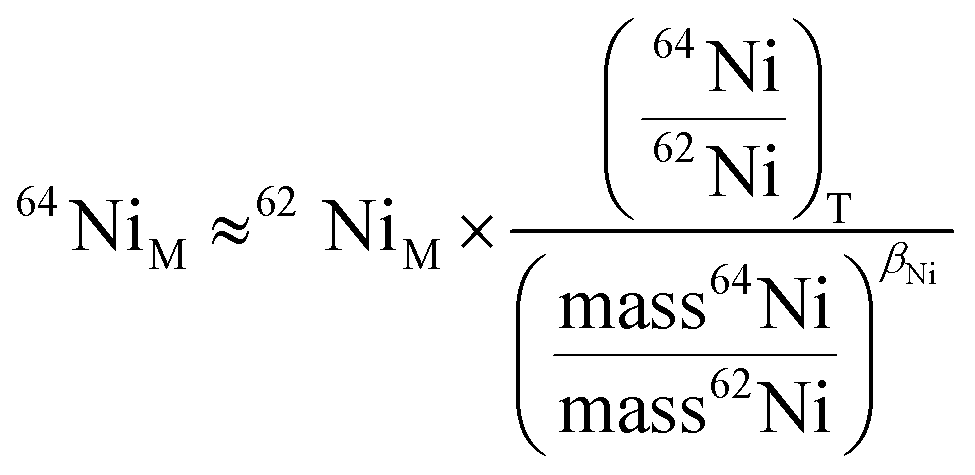 | (2) |
(64Ni/62Ni)T represents the true value of the ratio of isotopic abundances of 64Ni and 62Ni. To calculate this value, we first determine βCu based on the isotopes 63Cu and 65Cu. As βNi is approximately equal to βCu, we then incorporate βNi into formula (2) to calculate the signal intensity of 64Ni. This value is obtained by utilizing the signal intensity of 62Ni and subtracting it. The same methodology is applied for the isotopes of zinc (Zn):
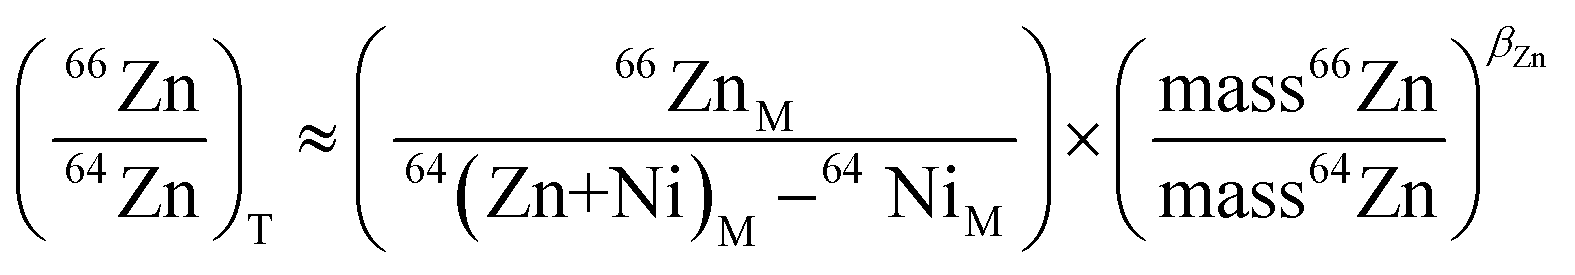 | (3) |
For the same internal standard of Cu, the elemental abundance of 63Cu (69.17%) and 65Cu (30.83%) is a fixed value,35 so βCu can be calculated. Also, based on the assumption (βCu ≈ βZn),27 the βCu therefore replace βZn can be brought into the formula (3) to correct 66ZnM/(64(Zn + Ni)M − 64NiM). The corrected 66ZnM/(64(Zn + Ni)M − 64NiM) was then used to calculate the Zn isotope value using the sample-standard interpolation method.32 U.S. National Institute of Standards and Technology (NIST) Zn Standard Reference Material NIST SRM683 and European Committee for Standardization Zn Standard IRMM 3702 were utilized to monitor instrument stability during the course of the study.
3. Results and discussion
3.1 Effect of variable Zn/Cu ratios and Zn concentration
Achieving high-precision Zn isotope data requires a high purity Zn fraction and ∼100% column yield for Zn samples. In addition, to correct accurately for Zn mass bias, the Zn/Cu concentration ratio, Zn concentration, and acidity of the purified sample solution must be investigated and optimized. This is because during the measurement process, the Zn concentrations of the actual samples after chemical separation will be different. In order to test the application range of this calibration method for the differences in Zn/Cu and Zn concentrations, a series of doping Cu experiments were undertaken. The results are shown in Table 4.| Purpose | Conditions | δ66Zn | 2SD | δ68/64Zn | 2SD | Times | |
|---|---|---|---|---|---|---|---|
| The effect of Zn/Cu | Zn concentration (ppb) | Cu concentration (ppb) | |||||
| 300 | 100 | −0.06 | 0.05 | −0.17 | 0.09 | 3 | |
| 200 | 0.04 | 0.05 | 0.07 | 0.06 | 3 | ||
| 250 | 0.06 | 0.03 | 0.12 | 0.05 | 3 | ||
| 300 | 0.08 | 0.06 | 0.15 | 0.09 | 3 | ||
|
|||||||
| The effect of Zn concentration | Zn/Cu | Zn concentration (ppb) | |||||
| 2:1 |
60 | 0.67 | 0.04 | 0.62 | 0.10 | 3 | |
| 100 | 0.49 | 0.06 | 0.53 | 0.20 | 3 | ||
| 150 | 0.16 | 0.06 | 0.15 | 0.03 | 3 | ||
| 200 | 0.10 | 0.10 | 0.10 | 0.15 | 3 | ||
| 250 | 0.01 | 0.02 | 0.00 | 0.10 | 3 | ||
| 350 | −0.03 | 0.03 | −0.02 | 0.09 | 3 | ||
| 400 | −0.05 | 0.03 | −0.05 | 0.14 | 3 | ||
| 600 | −0.09 | 0.02 | −0.06 | 0.08 | 3 | ||
| 900 | −0.13 | 0.03 | −0.09 | 0.01 | 3 | ||
|
|||||||
| The effect of Ni concentration | Ni concentration (ppb) | ||||||
| 0.1 | 0.00 | 0.04 | −0.01 | 0.08 | 3 | ||
| 0.5 | −0.01 | 0.04 | 0.01 | 0.16 | 3 | ||
| 1 | −0.03 | 0.09 | −0.04 | 0.11 | 3 | ||
| 5 | −0.01 | 0.03 | 0.07 | 0.02 | 3 | ||
| 10 | −0.01 | 0.02 | 0.02 | 0.01 | 3 | ||
| 40 | −0.04 | 0.03 | −0.06 | 0.10 | 3 | ||
| 60 | 0.01 | 0.08 | −0.02 | 0.18 | 3 | ||
| 80 | 0.00 | 0.09 | −0.03 | 0.07 | 3 | ||
| 100 | 0.01 | 0.09 | 0.02 | 0.08 | 3 | ||
| 150 | 0.02 | 0.04 | 0.01 | 0.14 | 3 | ||
|
|||||||
| The effect of solution acidity | Solution acidity (m/m%) | ||||||
| 0.042 | −0.20 | 0.07 | −0.42 | 0.11 | 3 | ||
| 1.0 | −0.08 | 0.08 | −0.14 | 0.21 | 3 | ||
| 1.5 | −0.06 | 0.06 | −0.11 | 0.07 | 3 | ||
| 2.2 | 0.02 | 0.03 | 0.09 | 0.03 | 3 | ||
| 2.5 | 0.02 | 0.04 | 0.06 | 0.04 | 3 | ||
| 3.0 | 0.01 | 0.03 | 0.10 | 0.05 | 3 | ||
The EEN (empirical external normalization) method dependence on the analyte-spike (Zn/Cu) ratio has been reported for the Neptune instrument.27,31 Here, we also follow these methods. To obtain the optimized calibration condition, a suite of man-made GSB standard solutions with different Zn/Cu ratios (3:1, 3:2, 3:2.5 and 3:3) were measured with stable introduction systems. All Zn and Cu concentrations were adjusted between 100 and 300 ng g−1. All raw results of variable Zn/Cu solutions define different parallel mass fractionation lines. These departures from the Zn/Cu = 2 line induce a negative deviation of Cu-normalized δ66Zn values up to −0.06‰ for high Zn solutions (Zn/Cu = 3) and a positive variation of 0.08‰ for high Cu solutions (Zn/Cu = 1). The experimental results show that accurate measurements can be obtained when the Zn/Cu ratio is greater than 3:1 and less than 3:2 (Fig. 2a and Table 4).
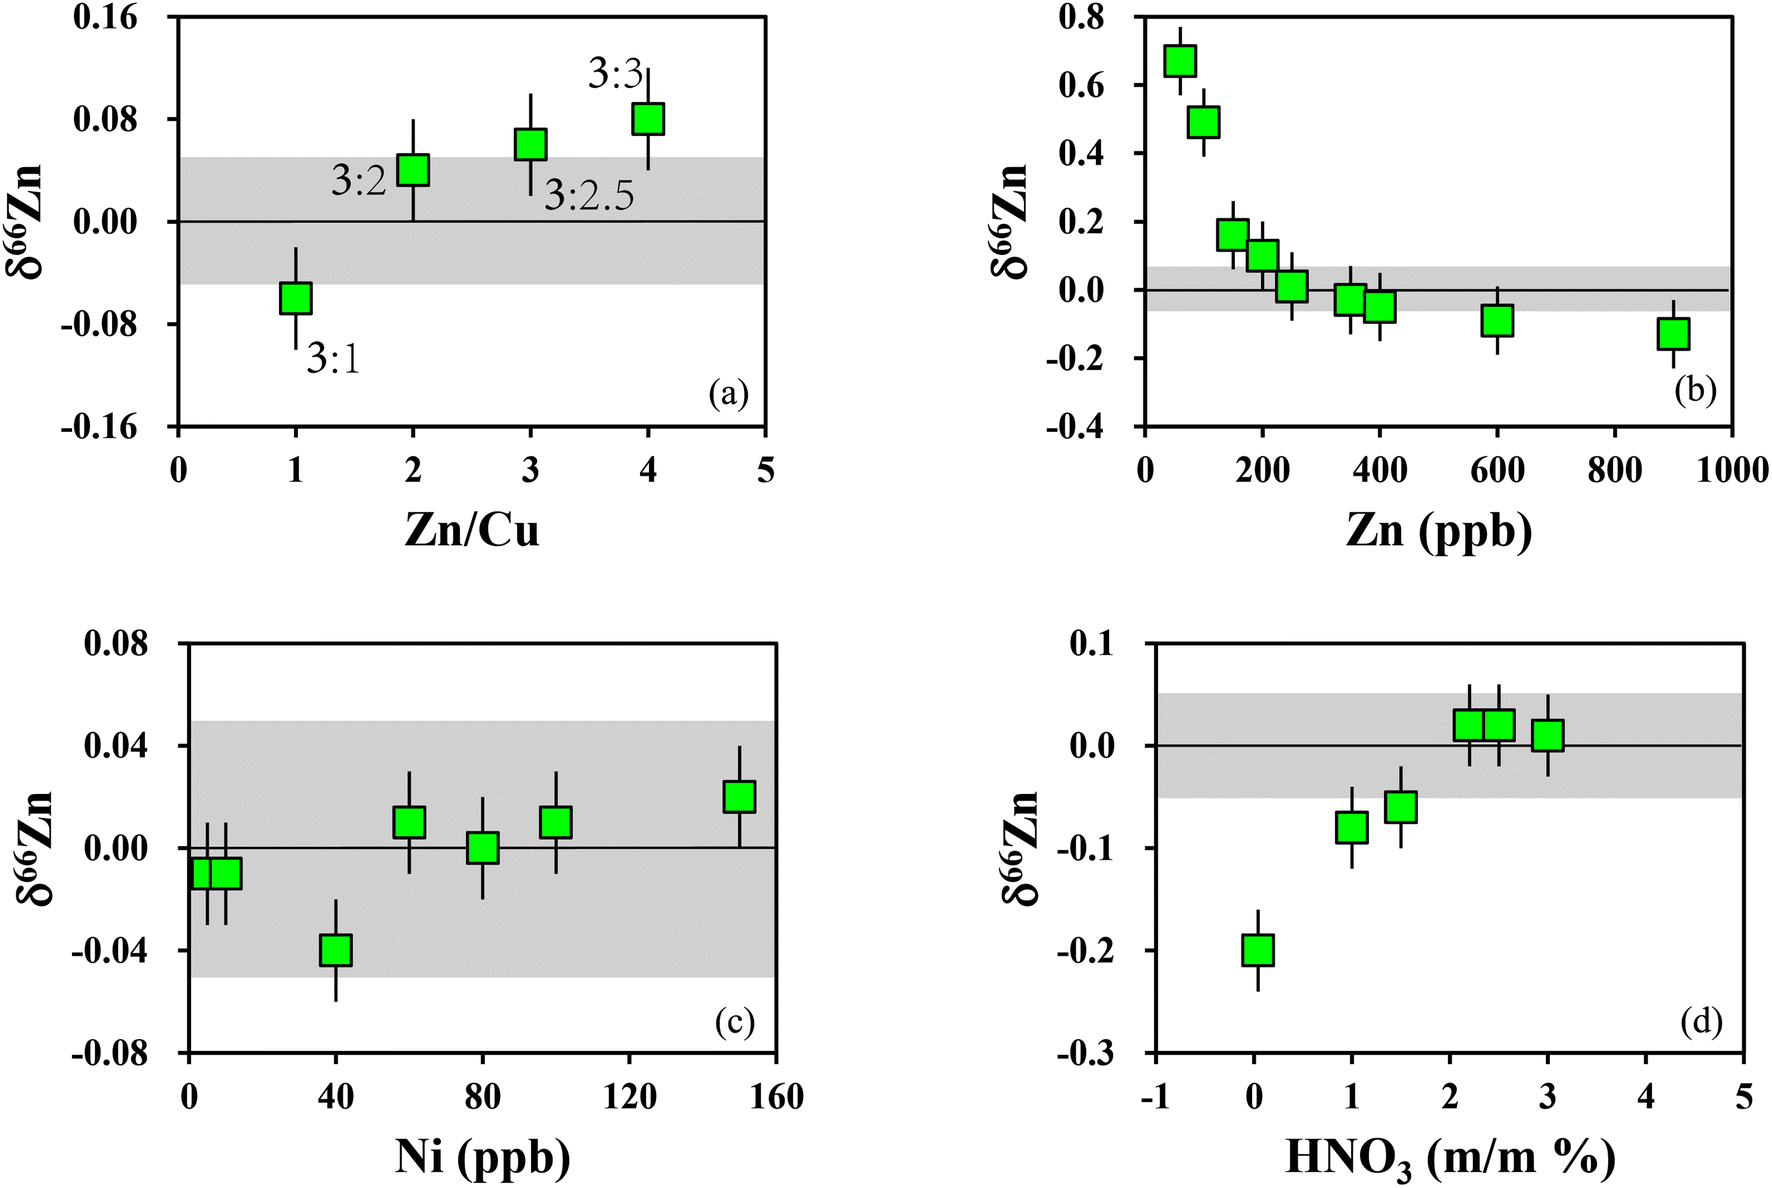 | ||
| Fig. 2 (a) The results of conditioning experiments of different Zn/Cu; (b) the results of conditioning experiments of different Zn concentrations; (c) the experimental results after Ni correction; (d) the experimental results of acidity matching. | ||
Mass bias drift along the regression line was observed for isotope measurements on GSB standard solutions with Zn concentrations varying from 60 ng g−1 to 900 ng g−1 (Zn/Cu = 2). The results show that when the Zn concentration is greater than 250 ng g−1 and less than 400 ng g−1, the zinc isotopic analysis error will be less than 0.05‰ (Fig. 2b). Thus, Zn concentration in sample solutions does not need to match exactly that of the standard solution using the EEN correction method. However, according to an experiment performed with Zn-GSB concentration varying from 60 ng g−1 to 200 ng g−1, at these lower concentrations, the blank effect on measured Zn isotope ratios is noticeable. Based on the above data, we chose to work mainly with Zn concentrations higher than 250 ng g−1 and lower than 400 ng g−1.
3.2 Effect of Ni concentration and solution acidity
Zinc (Zn) isotope determinations exhibit varying tolerances with different matrix elements. The δ66Zn values are particularly sensitive to the presence of nickel (Ni) in the sample solutions due to the potential for severe isobaric interferences caused by 64Ni+ on 64Zn+. Previous research has indicated that a significant shift in δ66Zn (>0.07‰) occurs when the [Ni]/[Zn] ratio reaches 0.001.33 The chemical purification procedure previously employed for soil reference materials proved to be ineffective for samples with high [Ni]/[Zn] ratios. Following a two-column separation of certain samples (e.g., GSS-7a), we observed that the [Ni]/[Zn] ratio in the Zn aliquot exceeded 0.001. Consequently, a third ion-exchange column was necessary to further separate Zn from the interfering matrices. After three-column separations, all purified Zn solutions contained matrices with levels lower than 0.001.However, the three-column approach resulted in a noticeable deviation (the average value being approximately 0.02‰ heavier than that obtained using the two-column method) in the δ66Zn values in this study, primarily due to the imperfect yield of Zn (around 97%). As a result, when dealing with samples characterized by low Zn content and high [Ni]/[Zn] ratios, employing additional column chemistry may exacerbate the chemical procedure blank and reduce the yield of Zn, thus negatively impacting high-precision Zn isotope measurements. Therefore, we reinvestigated and reexamined the impact of different [Ni]/[Zn] ratios on the final accuracy of Zn isotopic ratios through doping experiments.
Analytical results, as shown in Fig. 2c, demonstrate that there is no drift in the mass deviation of isotope measurements on standard solutions when the Ni concentrations vary from 5 ng g−1 to 150 ng g−1. This illustrates that the method can provide an accurate correction for the Zn isotope value of the samples as long as the [Ni]/[Zn] ratio is <0.5. The aforementioned method offers improved compatibility and stability by addressing the issue of Ni isobaric interference. Unlike the previous method where [Ni]/[Zn] had to be <0.001, this approach allows for a wider range of [Ni]/[Zn] ratios while maintaining accurate Zn isotope measurements.
Previous studies found that the mismatch of HNO3 acid molarities and element mass fractions between the samples and bracketing measurement standard can produce incorrect data when using SSB.36 In this study, a series of tests was performed to examine and eliminate these effects. First, a high-purity Zn solution (GSB-Zn), which is an in-house reference solution used in our laboratory, was diluted to 300 ng g−1 using 2% m/m HNO3 as a bracketing measurement standard, while aliquots of the same tested material were diluted to 200 ng g−1 using HNO3 with mass fractions varying from 0.042% m/m to 3% m/m as unknown samples. As illustrated in Fig. 2d, the accurate measurements can be obtained when the medium nitric acid concentration is between 1.5% m/m to 3% m/m, and the lower acid concentration may lead to poor accuracy and precision. To eliminate this possible effect, we always used the same bottle of newly diluted 2% m/m HNO3 for the whole isotope determination process.
3.3 Precision and accuracy of Zn isotope measurement
As shown in Fig. 3, the proposed correction model by doping with Cu solution can effectively eliminate the influence of environmental factors, especially temperature fluctuations, on the isotope measurements and significantly reduce the fluctuation range of the measured value of 66/64Zn (Fig. 3), thus giving high analytical precision. The long-term measurements of IRMM-3702 (0.27 ± 0.05‰, relative to JMC-Lyon Zn standard 3-0749L) in our laboratory were similar to those of other laboratories.37–41 The long-term external reproducibility of δ66Zn for the Zn standard solution (IRMM-3702) was better than ±0.06‰ (2SD) over one year. Analytical uncertainties are reported as 2SD (standard deviation of ‘n’ repeated sample analyses).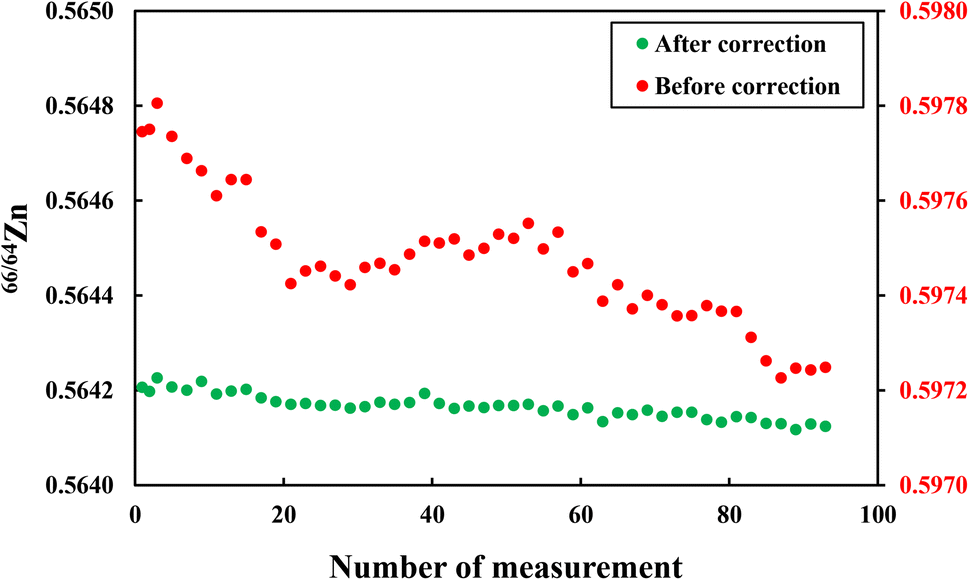 | ||
| Fig. 3 The changes in the measured values of 66/64Zn before and after Cu correction. | ||
Using the method presented here, measurements were taken to determine the Zn isotopic compositions of 12 rock standard reference materials and 20 soil standard reference materials. These results, together with previously reported results, are listed in Tables 5 and 6. These data were found to be consistent with the data published previously.33,42–49 To further verify the accuracy of the analytical method, we analyzed the δ66Zn values of several international petrological standard samples, and the results are consistent with the recommended Zn isotope values (Table 5), which indicates the reliability of our data.
| Sample | δ66Zn | 2SD | δ68Zn | 2SD | N | |
|---|---|---|---|---|---|---|
| a N = testing frequency. | ||||||
| AGV-2 | 0.29 | 0.03 | 0.61 | 0.06 | This study | |
| 0.28 | 0.05 | 0.56 | 0.10 | 18 | 1 | |
| 0.32 | 0.04 | 0.62 | 0.05 | 2 | ||
| 0.25 | 0.09 | 0.55 | 0.27 | 3 | ||
| BCR-2 | 0.28 | 0.01 | 0.58 | 0.01 | This study | |
| 0.25 | 0.03 | 0.48 | 0.03 | |||
| 0.27 | 0.06 | 0.54 | 0.10 | |||
| 0.27 | 0.03 | 0.53 | 0.10 | 3 | Average | |
| 0.25 | 0.04 | 0.51 | 0.09 | 14 | 1 | |
| 0.33 | 0.09 | 0.69 | 0.30 | 4 | ||
| 0.25 | 0.02 | 0.48 | 0.03 | 14 | 5 | |
| 0.25 | 0.01 | 6 | ||||
| 0.27 | 0.03 | 0.53 | 0.08 | 8 | 7 | |
| BHVO-2 | 0.31 | 0.02 | 0.62 | 0.03 | This study | |
| 0.35 | 0.02 | 1.01 | 0.03 | |||
| 0.30 | 0.01 | 0.59 | 0.03 | |||
| 0.31 | 0.02 | 0.64 | 0.03 | |||
| 0.32 | 0.04 | 0.71 | 0.40 | 4 | Average | |
| 0.31 | 0.03 | 0.62 | 0.06 | 46 | 1 | |
| 0.29 | 0.09 | 0.60 | 0.30 | 4 | ||
| 0.27 | 0.06 | 6 | ||||
| 0.33 | 0.04 | 0.65 | 0.06 | 2 | ||
| 0.21 | 0.09 | 0.50 | 0.27 | 3 | ||
| 0.28 | 0.04 | 8 | ||||
| 0.31 | 0.04 | 0.61 | 0.07 | 21 | 7 | |
| BIR-1 | 0.24 | 0.05 | 0.56 | 0.09 | This study | |
| 0.26 | 0.09 | 0.54 | 0.3 | 4 | ||
| 0.31 | 0.04 | 0.61 | 0.06 | 2 | ||
| 0.2 | 0.04 | 6 | ||||
| 0.23 | 0.05 | 0.48 | 0.06 | 1 | ||
| COQ-1 | 0.25 | 0.01 | 0.49 | 0.02 | This study | |
| 0.24 | 0.02 | 0.45 | 0.10 | |||
| 0.25 | 0.05 | 0.50 | 0.07 | |||
| 0.25 | 0.01 | 0.48 | 0.05 | 3 | Average | |
| 0.27 | 0.03 | 9 | ||||
| 0.27 | 0.04 | 8 | ||||
| GSP-2 | 1.05 | 0.05 | 1.70 | 0.08 | This study | |
| 1.07 | 0.06 | 1.74 | 0.10 | 12 | 1 | |
| JB-2 | 0.25 | 0.03 | 0.49 | 0.05 | This study | |
| 0.24 | 0.01 | 0.47 | 0.03 | |||
| 0.24 | 0.01 | 0.48 | 0.04 | 3 | Average | |
| 0.23 | 0.04 | 0.46 | 0.08 | 9 | 1 | |
| 0.22 | 0.07 | 6 | ||||
| 0.23 | 0.03 | 0.46 | 0.05 | 2 | 7 | |
| QLO-1 | 0.32 | 0.04 | 0.63 | 0.05 | This study | |
| QLO-1 | 0.27 | 0.04 | 0.53 | 0.09 | 14 | 1 |
| 0.29 | 0.03 | 9 | ||||
| RGM-1 | 0.33 | 0.04 | 0.68 | 0.07 | This study | |
| 0.36 | 0.05 | 0.72 | 0.09 | 12 | 1 | |
| RGM-2 | 0.38 | 0.05 | 0.76 | 0.06 | This study | |
| 0.44 | 0.02 | 9 | ||||
| W-2 | 0.28 | 0.03 | 0.56 | 0.02 | This study | |
| 0.22 | 0.05 | 0.46 | 0.08 | 11 | 1 | |
| Sample | δ66Zn | 2SD | δ68Zn | 2SD | N |
|---|---|---|---|---|---|
| a N = testing frequency. | |||||
| GSS-1a | 0.33 | 0.02 | 0.68 | 0.05 | 6 |
| GSS-1a-R | 0.31 | 0.04 | 0.64 | 0.06 | 6 |
| GSS-2a | 0.25 | 0.01 | 0.54 | 0.03 | 6 |
| GSS-3a | 0.21 | 0.03 | 0.44 | 0.01 | 6 |
| GSS-4a | 0.25 | 0.02 | 0.50 | 0.05 | 6 |
| GSS-5a | 0.25 | 0.02 | 0.46 | 0.11 | 6 |
| GSS-6a | 0.61 | 0.02 | 1.23 | 0.06 | 6 |
| GSS-6a-R | 0.60 | 0.05 | 1.21 | 0.08 | 6 |
| GSS-7a | 0.35 | 0.04 | 0.70 | 0.04 | 6 |
| GSS-8a | 0.19 | 0.04 | 0.42 | 0.07 | 6 |
| GSS-13 | 0.27 | 0.03 | 0.53 | 0.07 | 6 |
| GSS-14 | 0.25 | 0.03 | 0.52 | 0.02 | 6 |
| GSS-17 | 0.20 | 0.05 | 0.47 | 0.12 | 6 |
| GSS-18 | 0.27 | 0.05 | 0.54 | 0.09 | 6 |
| GSS-19 | 0.23 | 0.03 | 0.52 | 0.11 | 6 |
| GSS-20 | 0.30 | 0.04 | 0.62 | 0.09 | 6 |
| GSS-21 | 0.27 | 0.04 | 0.55 | 0.08 | 6 |
| GSS-22 | 0.21 | 0.06 | 0.40 | 0.06 | 6 |
| GSS-23 | 0.24 | 0.03 | 0.51 | 0.03 | 6 |
| GSS-24 | 0.29 | 0.04 | 0.58 | 0.12 | 6 |
| GSS-26 | 0.23 | 0.03 | 0.46 | 0.07 | 6 |
| GSS-27 | 0.28 | 0.05 | 0.55 | 0.03 | 6 |
| GSS-28 | 0.31 | 0.01 | 0.66 | 0.06 | 6 |
| GSS-28-R | 0.28 | 0.06 | 0.57 | 0.04 | 6 |
| HTSB-2 | 0.23 | 0.06 | 0.47 | 0.12 | 6 |
| HTSB-5 | 0.32 | 0.04 | 0.64 | 0.01 | 6 |
| NSA-1 | 0.14 | 0.06 | 0.29 | 0.10 | 6 |
| NSA-5 | 0.23 | 0.02 | 0.47 | 0.04 | 6 |
| NSA-6 | 0.28 | 0.01 | 0.55 | 0.05 | 6 |
Here, we present the first zinc isotopic study on 20 soil standard reference materials. All the soil reference materials were determined twice using column chemistry and six independent measurements were made. The average δ66Zn values of the 20 soil standards were listed in Table 6. This comprehensive data set can serve as a reference for zinc isotopic studies of soils across a range of geological and biological applications for both quality assurance and inter-laboratory calibration.
3.4 Application of Zn isotopes in soil
To facilitate comparison of the loss or relative enrichment of Zn in soils, the τZn value was calculated as follows:50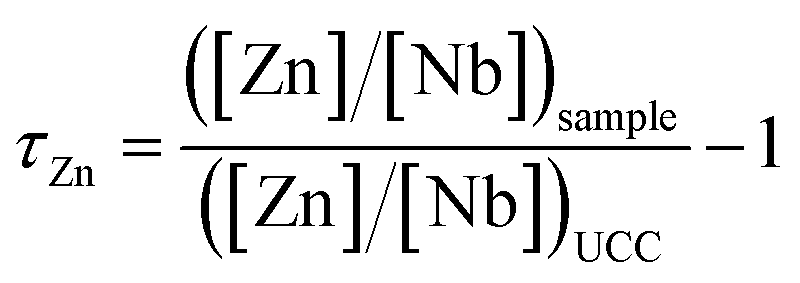
[Zn] and [Nb] represent the concentration of Zn and Nb, and UCC represents the average composition of the upper crust.51 A value of τZn greater than 0 indicates enrichment of Zn, whereas a value less than 0 indicates depletion relative to the average composition of the upper crust. It should be pointed out that the values calculated here and the actual enrichment or loss may vary due to possible differences in the parent rock values for individual soils from the average composition of the upper crust.
As shown in Fig. 4 and Table 6, the Zn isotopic composition of most soils reference materials ranges from 0.14‰ to 0.35‰, which is consistent with the values of igneous rocks (δ66Zn = 0.31 ± 0.12‰) and clastic sediments (δ66Zn = 0.28 ± 0.13‰). The exceptional sample is GSS-6a with δ66Zn value of 0.61 ± 0.02‰, which is much heavier than all other reference materials. The Zn content of this soil was as high as 1529 ppm, which was significantly higher than the average content of the upper crust. This sample is a yellow-red soil, collecting in the Xishan tungsten-tin polymetallic mining area from Yangchun City, Guangdong Province. Hence it is likely that the soil was contaminated, as it has been demonstrated that the Zn isotopic value of waste gases related to production processes are generally relatively light (−0.66‰ to 0.21‰), while the isotopic value of Zn slag is generally relatively heavy (0.13‰ to 1.49‰).52 Thus, the extreme enrichment of heavier Zn isotopes can be attributed to Zn contamination by slag.
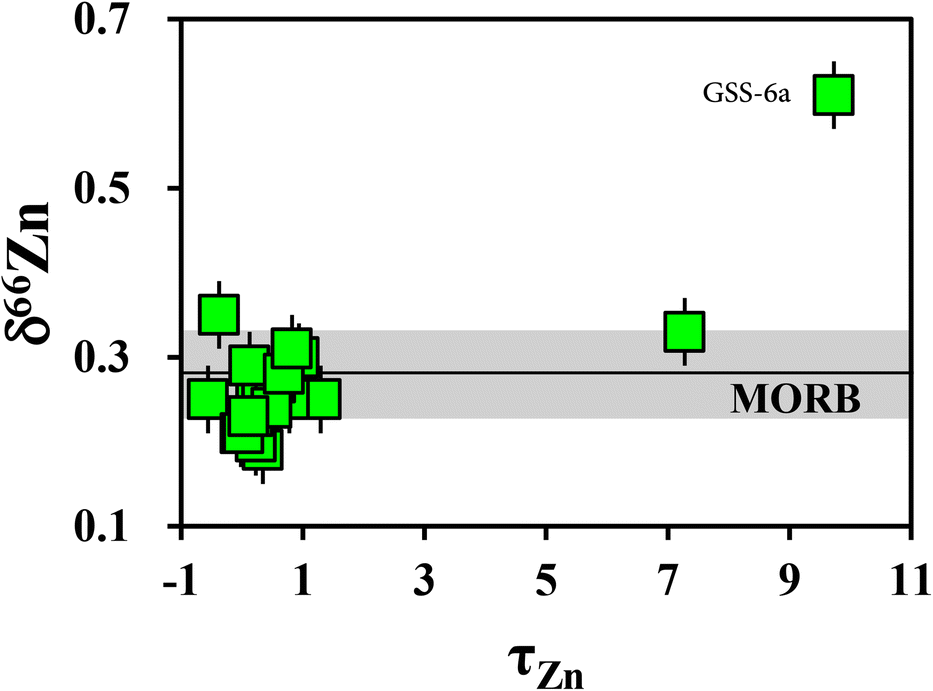 | ||
| Fig. 4 The correlation of Zn isotopic composition and τZn. | ||
4. Conclusions
Zinc isotopes plays a crucial role in understanding the migration of Zn in soil and tracing the source of Zn contamination. In this study, we present a novel analytical method for obtaining highly accurate and precise Zn isotopic measurements in soil samples using MC-ICP-MS (Multicollector Inductively Coupled Plasma Mass Spectrometry). By employing a two-step anion-exchange chromatography with AG MP-1M resin columns, we achieve an exceptional total Zn yield of nearly 100%.To assess the accuracy of our analysis, we conducted repeated measurements of a pure Zn solution (NIST SRM683) over an extended period. The results demonstrate an accuracy of 0.06‰, showcasing the reliability and precision of our method. Furthermore, the external reproducibility obtained from analyzing a suite of soil reference materials exhibited a range between 0.02 and 0.06‰ (2SD). These findings highlight the excellent analytical precision and long-term reproducibility of the Zn isotopic compositions obtained in this study, establishing a robust baseline for quality assurance and facilitating inter-laboratory comparisons.
Overall, our novel analytical approach ensures high accuracy and precision in determining Zn isotopes in soil samples, enhancing our ability to investigate Zn migration and identify contamination sources.
Conflicts of interest
The authors declare that they have no known competing financial interests or personal relationships that could have appeared to influence the work reported in this paper.Acknowledgements
We are grateful to Prof. Sheng-Ao Liu for providing Zn standard IRMM-3702 and GSB Zn, to Ying-Zeng Gong, Lu Yin, Huan Zhao, Yan-Jie Zhang and Ying-Jie Tian for help in the laboratory and discussions during the preparation of this manuscript. This work is supported by the National Science Foundation of China (42273011) and the Fundamental Research Key Project of Yunnan Province (202001BB050015) and Hebei Key Laboratory of Strategic Critical Mineral Resources, Hebei GEO University (HGU-SCMR2243).References
- R. C. Paniello, J. M. D. Day and F. Moynier, Nature, 2012, 490, 376–379 CrossRef CAS PubMed.
- J.-X. Zhou, Z.-L. Huang, Z.-C. Lv, X.-K. Zhu, J.-G. Gao and H. Mirnejad, Ore Geol. Rev., 2014, 63, 209–225 CrossRef.
- M. Kunzmann, G. P. Halverson, P. A. Sossi, T. D. Raub, J. L. Payne and J. Kirby, Geology, 2013, 41, 27–30 CrossRef CAS.
- D. J. Weiss, T. Mason, F. J. Zhao, G. Kirk and B. Horstwood, New Phytol., 2005, 165, 703–710 CrossRef CAS PubMed.
- C. Maréchal, E. Nicolas, C. Douchet and F. Albarède, Geochem., Geophys., Geosyst., 2000, 1 DOI:10.1029/1999GC000029.
- S. Pichat, C. Douchet and F. Albarède, Earth Planet. Sci. Lett., 2003, 210, 167–178 CrossRef CAS.
- D. J. Weiss, N. Rausch, T. F. D. Mason, B. J. Coles, J. J. Wilkinson, L. Ukonmaanaho, T. Arnold and T. M. Nieminen, Geochim. Cosmochim. Acta, 2007, 71, 3498–3517 CrossRef CAS.
- J. Chen, J. r. Gaillardet and P. Louvat, Environ. Sci. Technol., 2008, 42, 6494–6501 CrossRef CAS PubMed.
- C. Cloquet, J. Carignan, M. F. Lehmann and F. Vanhaecke, Anal. Bioanal. Chem., 2008, 390, 451–463 CrossRef CAS PubMed.
- S. G. John, O. J. Rouxel, P. R. Craddock, A. M. Engwall and E. A. Boyle, Earth Planet. Sci. Lett., 2008, 269, 17–28 CrossRef CAS.
- G. E. Hutchinson and L. Tonolli, Bioscience, 1967, 17, 843–844 CrossRef.
- W. Mathys, Physiol. Plant., 1975, 33, 161–165 CrossRef CAS.
- J. Zhang, J. a. Wang, J. Dang, X. Pei, D. Zhang, D. Li and P. Yang, Chin. Agric. Sci. Bull., 2015, 31, 229–233 Search PubMed.
- A. V. Andronikov, M. Novak, F. Oulehle, V. Chrastny, O. Sebek, I. E. Andronikova, M. Stepanova, A. Sipkova, J. Hruska, O. Myska, T. Chuman, F. Veselovsky, J. Curik, E. Prechova and A. Komarek, Environ. Sci. Technol., 2021, 55, 8035–8044 CrossRef CAS PubMed.
- D. F. Araújo, W. Machado, D. Weiss, D. S. Mulholland, J. Garnier, C. E. Souto-Oliveira and M. Babinski, Appl. Geochem., 2018, 95, 25–32 CrossRef.
- C. Caldelas and D. J. Weiss, Plant Soil, 2017, 411, 17–46 CrossRef CAS.
- M. S. Tonhá, J. Garnier, D. F. Araújo, B. C. A. Cunha, W. Machado, E. Dantas, R. Araújo, V. T. Kutter, M.-P. Bonnet and P. Seyler, Sci. Total Environ., 2020, 743, 140610 CrossRef PubMed.
- D. F. Araújo, E. Ponzevera, D. J. Weiss, J. Knoery, N. Briant, S. Yepez, S. Bruzac, T. Sireau and C. Brach-Papa, ACS ES&T Water, 2021, 1, 1035–1046 Search PubMed.
- B. Liang, G. Han, M. Liu and X. Li, Catena, 2021, 206, 105565 CrossRef.
- S. Opfergelt, J. T. Cornélis, D. Houben, C. Givron, K. W. Burton and N. Mattielli, Chem. Geol., 2017, 466, 140–148 CrossRef CAS.
- N. Suhr, R. Schoenberg, D. Chew, C. Rosca, M. Widdowson and B. S. Kamber, Sci. Total Environ., 2018, 619–620, 1451–1463 CrossRef CAS PubMed.
- N.-H. Yin, E. D. van Hullebusch, M. Benedetti, P. N. L. Lens and Y. Sivry, Chemosphere, 2018, 195, 483–490 CrossRef CAS PubMed.
- F. Moynier, D. Vance, T. Fujii, P. Savage, F.-Z. Teng, J. Watkins, N. Dauphas and D. Gruyter, Rev. Mineral. Geochem., 2017, 82, 543–600 CrossRef CAS.
- F.-C. A. Kafantaris and D. M. Borrok, Chem. Geol., 2014, 366, 42–51 CrossRef CAS.
- D. Vance, A. Matthews, A. Keech, C. Archer, G. Hudson, J. Pett-Ridge and O. A. Chadwick, Chem. Geol., 2016, 445, 36–53 CrossRef CAS.
- F. Albarède, P. Telouk, J. Blichert-Toft, M. Boyet, A. Agranier and B. Nelson, Geochim. Cosmochim. Acta, 2004, 68, 2725–2744 CrossRef.
- C. N. Maréchal, P. Télouk and F. Albarède, Chem. Geol., 1999, 156, 251–273 CrossRef.
- C. Archer and D. Vance, J. Anal. At. Spectrom., 2004, 19, 656–665 RSC.
- D. Vance, C. Archer, J. Bermin, G. Kennaway, E. J. Cox, P. J. Statham, M. C. Lohan and M. J. Ellwood, Geochim. Cosmochim. Acta, 2006, 70, A666 CrossRef.
- S.-A. Liu, Z.-Z. Wang, S.-G. Li, J. Huang and W. Yang, Earth Planet. Sci. Lett., 2016, 444, 169–178 CrossRef CAS.
- J.-B. Chen, P. Louvat, J. Gaillardet and J.-L. Birck, Chem. Geol., 2009, 259, 120–130 CrossRef CAS.
- T. Mason, D. J. Weiss, M. Horstwood, R. R. Parrish, S. S. Russell, E. Mullane and B. J. Coles, J. Anal. At. Spectrom., 2004, 19, 218–226 RSC.
- S. Chen, Y. Liu, J. Hu, Z. Zhang, Z. Hou, F. Huang and H. Yu, Geostand. Geoanal. Res., 2016, 40, 417–432 CrossRef CAS.
- F. Albarède and B. Beard, Rev. Mineral. Geochem., 2004, 55, 113–152 CrossRef.
- W. R. Shields, T. J. Murphy and E. L. Garner, J. Res. Natl. Bur. Stand., 1964, 68A, 589–592 CrossRef CAS PubMed.
- F. Huang, J. Glessner, A. Ianno, C. Lundstrom and Z. Zhang, Chem. Geol., 2009, 268, 15–23 CrossRef CAS.
- D. M. Borrok, R. Giere, M. Ren and E. R. Landa, Environ. Sci. Technol., 2010, 44, 9219–9224 CrossRef CAS PubMed.
- C. Cloquet, J. Carignan and G. Libourel, Environ. Sci. Technol., 2006, 40, 6594–6600 CrossRef CAS PubMed.
- K. Moeller, R. Schoenberg, R.-B. Pedersen, D. Weiss and S. Dong, Geostand. Geoanal. Res., 2012, 36, 177–199 CrossRef CAS.
- J. C. J. Petit, J. de Jong, L. Chou and N. Mattielli, Geostand. Geoanal. Res., 2008, 1–18 Search PubMed.
- L. Van Heghe, E. Engstrom, I. Rodushkin, C. Cloquet and F. Vanhaecke, J. Anal. At. Spectrom., 2012, 27, 1327–1334 RSC.
- H. Chen, P. S. Savage, F.-Z. Teng, R. T. Helz and F. Moynier, Earth Planet. Sci. Lett., 2013, 369–370, 34–42 CrossRef CAS.
- F. Moynier, P. Beck, Q.-Z. Yin, T. Ferroir, J.-A. Barrat, R. Paniello, P. Telouk and P. Gillet, Chem. Geol., 2010, 276, 374–379 CrossRef CAS.
- G. F. Herzog, F. Moynier, F. Albarède and A. A. Berezhnoy, Geochim. Cosmochim. Acta, 2009, 73, 5884–5904 CrossRef CAS.
- F. Moynier, R. C. Paniello, M. Gounelle, F. Albarède, P. Beck, F. Podosek and B. Zanda, Geochim. Cosmochim. Acta, 2011, 75, 297–307 CrossRef CAS.
- P. A. Sossi, G. P. Halverson, O. Nebel and S. M. Eggins, Geostand. Geoanal. Res., 2015, 39, 129–149 CrossRef CAS.
- Z.-Z. Wang, S.-A. Liu, J. Liu, J. Huang, Y. Xiao, Z.-Y. Chu, X.-M. Zhao and L. Tang, Geochim. Cosmochim. Acta, 2017, 198, 151–167 CrossRef CAS.
- Y. Lv, S.-A. Liu, H. Wu, S. V. Hohl, S. Chen and S. Li, Geochim. Cosmochim. Acta, 2018, 239, 330–345 CrossRef CAS.
- M. Druce, C. Stirling and J. Rolison, Geostand. Geoanal. Res., 2020, 44, 711–732 CrossRef CAS.
- H. W. Nesbitt, Nature, 1979, 279, 206–210 CrossRef CAS.
- S. Gao, T.-C. Luo, B.-R. Zhang, H.-F. Zhang, Y.-w. Han, Z.-D. Zhao and Y.-K. Hu, Geochim. Cosmochim. Acta, 1998, 62, 1959–1975 CrossRef CAS.
- Y. Sivry, J. Riotte, J. E. Sonke, S. Audry, J. Schäfer, J. Viers, G. Blanc, R. Freydier and B. Dupré, Chem. Geol., 2008, 255, 295–304 CrossRef CAS.
| This journal is © The Royal Society of Chemistry 2023 |