
 Open Access Article
 This Open Access Article is licensed under a Creative Commons Attribution-Non Commercial 3.0 Unported Licence
Application of 5V spinel material LiNi0.5Mn1.5O4 in Li-ion batteries: single crystalline or polycrystalline?
Jia Jin *ab,
Jinping Weibc,
Zhen Zhoubc and
Zhaojun Xiebc
*ab,
Jinping Weibc,
Zhen Zhoubc and
Zhaojun Xiebc
aTianjin Guoan Mengguli New Materials Science and Technology Co., Ltd, Tianjin 301800, China. E-mail: 277282047@qq.com
bTianjin Enterprise Key Laboratory of Key Materials and Technology for Solid State Batteries, Tianjin 300182, China
cInstitute of New Energy Material Chemistry, Nankai University, Tianjin 300350, China
First published on 20th April 2023
Abstract
The 5V spinel LiNi0.5Mn1.5O4 cathode materials with different morphology were prepared by a solid state calcination method and characterized by X-ray diffraction (XRD), inductively coupled plasma (ICP), field emission scanning electron microscope (FE-SEM). Electrochemical properties of cathode material were investigated by electrochemical impedance spectroscopy (EIS), galvanostatic intermittent titration technique (GITT) and electrochemical performance tests. Compared with polycrystalline morphology (PLNMO), LiNi0.5Mn1.5O4 material with single crystalline morphology (SLNMO) proved smaller electrochemical polarization or voltage difference, lower internal resistance, faster lithium-ion diffusivity, arising from higher Mn3+ content. Differential scanning calorimetry (DSC) showed that SLNMO was more stable than PLNMO at full charged state with organic electrolyte, which exhibited initial discharge capacity of 140.2 mA h g−1 at 0.1C, coulombic efficiency of 96.1%, and specific capacity retention of 89.2% after 200 cycles at 2.5C, a little inferior to that of 91.7% for PLNMO.
1. Introduction
The great price fluctuation of lithium and cobalt resources especially in the last two years has led scientists to study cathode materials with no cobalt and low lithium content. Because of its lithium content of 3.8%, even less than LiFePO4 of 4.4% and cobalt free, 5V spinel material LiNi0.5Mn1.5O4 appeals researchers' great interests. In addition to crystal structure, macro/micro morphologies also affect the final electrochemical performance of the LiNi0.5Mn1.5O4 cells because of its corresponding different parameters such as electronic & ionic conductivities, and electrode/electrolyte interfacial stability.1,2 LiNi0.5Mn1.5O4 with various morphologies had been synthesized for different application in the academic research. Nanostructured materials, such as nanoparticles,3,4 porous nanorods,5 hollow microspheres and microcubes with nanosized subunits,6 had been fabricated to improve the rate capability. However, they were much more reactive toward electrolyte species than micrometric sized particles and difficult to batch production.In this work, we synthesized two different morphologies of LiNi0.5Mn1.5O4 material including single crystalline and polycrystalline morphology through industrialized solid-state reaction method, analyzed Mn3+ content of the samples, assessed the half coin-cell electrochemical performances, and discussed why the voltage difference between charge and discharge exists and why it becomes larger as cycle increases, thereafter we found the single crystalline sample assembled half coin-cell exhibited smaller electrochemical polarization or voltage difference, lower internal resistance, faster lithium-ion diffusivity, and excellent thermal stability at full charged state with organic electrolyte when compared with PLNMO sample.
2. Experimental
2.1 Preparation of LiNi0.5Mn1.5O4 material
The spinel material LiNi0.5Mn1.5O4 was prepared via solid-state reaction by high-speed mixing lithium carbonate (Li2CO3) and nickel–manganese hydroxide (Ni0.25Mn0.75(OH)2) with a Li/metal molar ratio of 1![[thin space (1/6-em)]](https://www.rsc.org/images/entities/char_2009.gif) :2, then followed by heat treatment at 900 °C for 12 h in air atmosphere for single crystalline morphology (marked as SLNMO) and at 800 °C for 12 h in air atmosphere for polycrystalline morphology (marked as PLNMO) respectively.
:2, then followed by heat treatment at 900 °C for 12 h in air atmosphere for single crystalline morphology (marked as SLNMO) and at 800 °C for 12 h in air atmosphere for polycrystalline morphology (marked as PLNMO) respectively.
Ni0.25Mn0.75(OH)2 precursor powder was synthesized via an inert atmosphere coprecipitation reaction from a stoichiometric amount of NiSO4·6H2O, MnSO4·H2O as metallic salt aqueous solution, a specified amount of NaOH as base aqueous solution and a desired amount of NH4·H2O as chelating agent aqueous solution. Then precipitate was filtered, washed with distilled water and dried in a vacuum oven. Precursor with different morphologies could be obtained through carefully controlling parameters such as chelating mole ratio of metal/NH4, the concentration and flow speed of the above solution pumping into the tank reactor, pH, temperature, stirring speed, and so on. (SLNMO precursor parameter: mole ratio of metal/NH4 was 2, concentration of NiSO4·6H2O, MnSO4·H2O, NaOH solu. and NH4·H2O were 0.6 mol L−1, 1.8 mol L−1, 10 mol L−1, 13 mol L−1, corresponding flow speeds were 10 ml min−1, 10 ml min−1, 8 ml min−1, 1 ml min−1, pH = 11.6–11.8, reaction temperature was 50 °C, stirring speed was 1000 rpm. PLNMO precursor parameter: mole ratio of metal/NH4 was 0.5, concentration of NiSO4·6H2O, MnSO4·H2O, NaOH solu. and NH4·H2O were 0.6 mol L−1, 1.8 mol L−1, 10 mol L−1, 13 mol L−1, corresponding flow speeds were 10 ml min−1, 10 ml min−1, 5 ml min−1, 2 ml min−1, pH = 10.8–11.1, reaction temperature was 50 °C, stirring speed was 600 rpm.)
2.2 Characterization of LiNi0.5Mn1.5O4 material
The main element contents of each samples were determined using inductively coupled plasma (ICP, Agilent5110, America), and the accuracy or error of the method was 10−4. The specific surface area (SSA) calculated by Brunauer–Emmet–Teller (BET) method was measured via BET Analyser (Micromeritics TriStar II 3020, America). Particle size distributions (D50) were measured by the Mastersizer 3000 instrument (Malvern 3000). The X-ray diffraction (XRD) was measured on a Rigaku MiniFlex 600 instrument equipped with Cu-Kα source at a scan rate of 1° min−1. For the field-emission scanning electron microscopy (FESEM) test, Hitachi Regulus 8100 was applied with 3 kV accelerating voltage. Differential scanning calorimetry (DSC, Mettler-Toledo) was carried out to study the thermal stability of the materials in contact with electrolyte at delithiated state. The cathode materials (containing Super P carbon and PVDF) were scraped from disassembled Al current collector after the coin cells were charged to upper cut-off voltage of 4.95 V, rinsed with absolute ethyl alcohol and dried to remove residual solvent. 1.5 mg cathode materials and 1.5 μL organic electrolyte were sealed in 25 μL gilded high pressure crucibles before DSC measurements from 30 °C to 400 °C at heating rate of 10 °C min−1.2.3 Cell assemblies and electrochemical measurements
Li/electrolytes/LiNi0.5Mn1.5O4 coin cells were used for electrochemical measurements. The LiNi0.5Mn1.5O4 cathode electrode was made up of LiNi0.5Mn1.5O4, Super P carbon, polyvinylidene difluoride (PVDF) binder with a weight ratio of 90:5:5. The prepared cathode electrodes were both punched and calendered to 2.8 g cm−3 for better comparison, then dried in vacuum at 90 °C for 24 h. The active material loading was 7.5 mg cm−2 for the LiNi0.5Mn1.5O4 electrode. The Li anode, UP3085-25 μm separator, high voltage organic electrolyte purchased from Shandong Hairong (HR8825, the main components of the electrolyte were LiPF6 and solvent (DMC + FEC + EC + additives)), and LiNi0.5Mn1.5O4 cathode were assembled in sequence into CR2032 coin cells in argon-filled dry glove box. To avoid test error caused by electrolyte exhaustion, enough amount of 400 μL electrolyte was added into every coin cells. Normally the porosity of the electrodes was not controlled in coin cells, and excessive electrolyte was added to the cells assembly, however it was indeed controlled in full cells' manufacture through mercury porosimetry issued by ISO 15901-1-2016. The formation process of coin cells was different from that of full cells. Assembled coin cells were rested at open circuit voltage (OCV) for 24 h before electrochemical measurements. The author set the capacity of 1C rate to be 140 mA h g−1, so the current density of 1C rate was 140 mA g−1. The current density of the initial galvanostatic charge–discharge, cycle performance and GITT were 14 mA g−1 (0.1C), 350 mA g−1 (2.5C) and 28 mA g−1 (0.2C) respectively. And the current density was 14 mA g−1 (0.1C) when the coin cell was charged to upper cut-off voltage of 4.95 V for DSC test. Charge–discharge tests were performed at 3.0–4.95 V (vs. Li+/Li) at room temperature under the Land CT2001A battery tester, and the coin cell was cathode limited. Electrochemical impedance spectroscopy (EIS) before and after room temperature cycle performance at open circuit voltage was measured through the ac impedance method on a Metrohm M204 Autolab with the frequency ranging from 100 kHz to 10 mHz and an AC signal of 5 mV in amplitude as the perturbation at room temperature. For the galvanostatic intermittent titration technique (GITT) measurements, the coin cells were charged at a current density of 0.2C for 30 min, followed by an open circuit relaxation for 30 min also on the Metrohm M204 Autolab. The procedure ran until the upper limit voltage of 4.95 V, then discharged at the same current density and relaxation time until the lower limit voltage of 3 V.
3. Results and discussion
3.1 Sample characterization
XRD patterns of as-prepared LiNi0.5Mn1.5O4 with single crystal and poly crystal morphologies were compared in Fig. 1. All sample peaks could be corresponded to spinel structures of JCPDS 80-2162 with disordered Fd![[3 with combining macron]](https://www.rsc.org/images/entities/char_0033_0304.gif) m space group, except that trace amount of NiO of JCPDS 01-1239, characterized by 2θ = 37.44°(hkl 111), 43.47°(hkl 200), 63.20°(hkl 220), was indexed in single crystal sample, while previous literature considered the impurities as LiNixOy.7 The lattice parameters and Rwp% calculated from XRD using Rietveld refinement, main element contents, surface area, Mn3+ content and D50 for the samples were summarized in Table 1.
m space group, except that trace amount of NiO of JCPDS 01-1239, characterized by 2θ = 37.44°(hkl 111), 43.47°(hkl 200), 63.20°(hkl 220), was indexed in single crystal sample, while previous literature considered the impurities as LiNixOy.7 The lattice parameters and Rwp% calculated from XRD using Rietveld refinement, main element contents, surface area, Mn3+ content and D50 for the samples were summarized in Table 1.
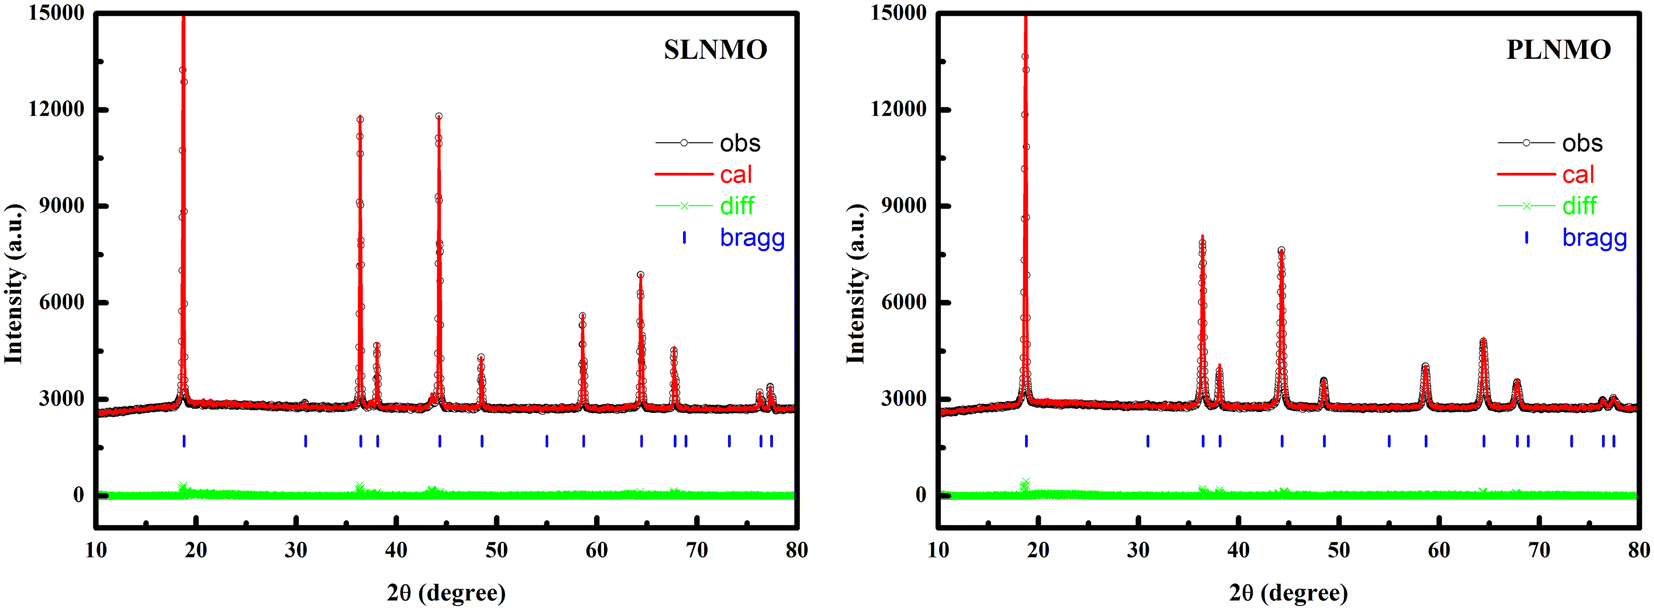 | ||
| Fig. 1 Rietveld refinement results of prepared two samples. | ||
| Sample | Li, % | Ni, % | Mn, % | BET, m2 g−1 | D50, μm | Mn3+*, % | a/b/c, Å | Rwp, % |
|---|---|---|---|---|---|---|---|---|
| a Mn3+* (ref. 7–9) denote: the ratio of the initial discharge capacity between 4.4 V and 3.0 V to the theoretical capacity (147 mA h g−1). | ||||||||
| SLNMO | 3.86 | 15.82 | 45.15 | 0.655 | 5.565 | 11.2 | 8.177 | 3.9 |
| PLNMO | 3.72 | 16.18 | 45.00 | 0.636 | 6.848 | 4.1 | 8.165 | 3.4 |
The main element contents of Li/Ni/Mn were in good agreement with designed formula from ICP analysis. BET of single crystal material was similar with poly crystal material in Table 1.
Fig. 2 shows FESEM images of single crystal and poly crystal of LiNi0.5Mn1.5O4. Particle size was 5.565 μm for single crystal and 6.848 μm for poly crystal.
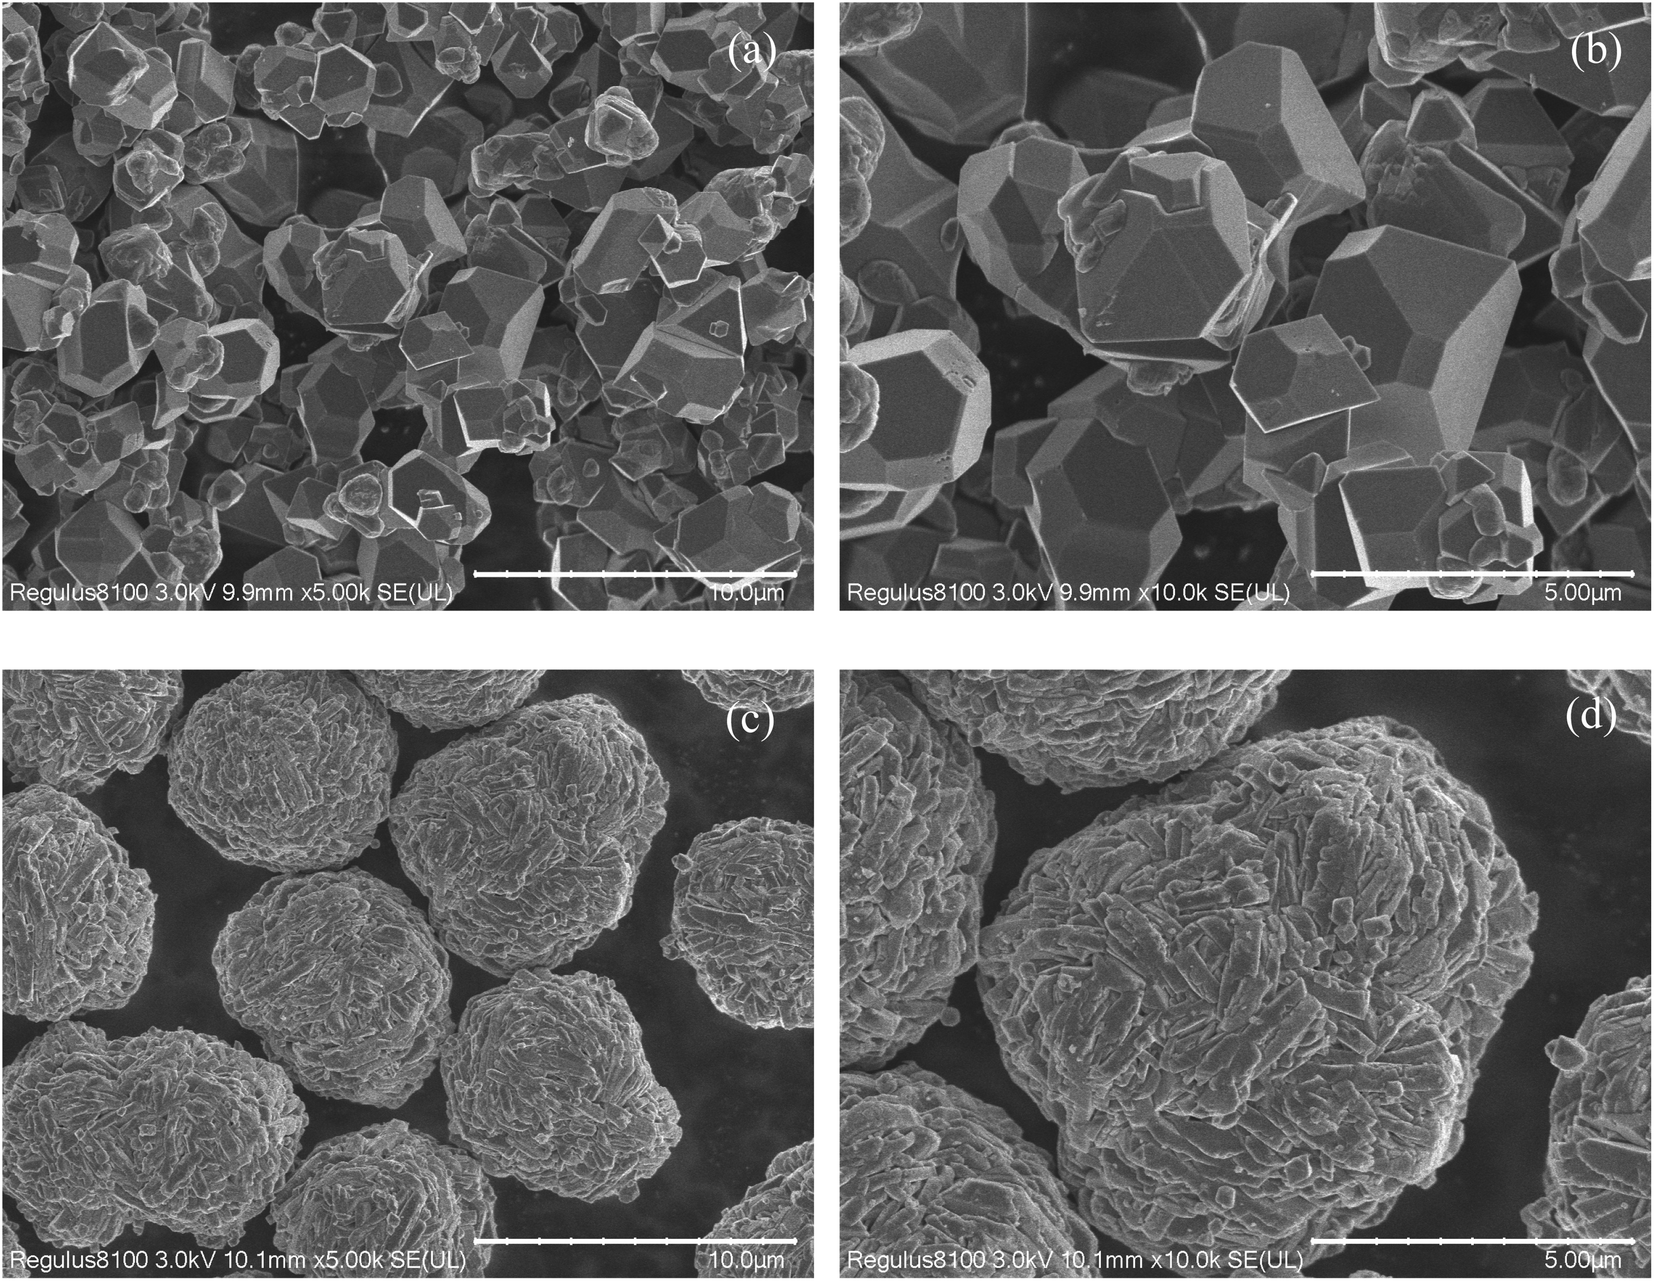 | ||
| Fig. 2 FESEM images of SLNMO (a and b) sample and PLNMO (c and d) sample. | ||
3.2 Battery tests
The Mn ion valence of ordered LiNi0.5Mn1.5O4 is usually at +4. When phase transition occurs from ordered to disordered or preparation process differs, some amount of Mn3+ ions appear accompanied by oxygen deficiency. Mn3+ displays a characteristic plateau at ∼4 V in the galvanostatic charge–discharge curves, therefore the capacity around 4 V can represent the relative amount of Mn3+ to some extent. A well-known classic theory10 is that Mn3+ is unstable and can easily transfer to Mn2+ via disproportionation reaction followed by dissolution, migration, deposition and reduction to Mn metal on anode, thereby exhausting the lithium and electrolyte, finally deteriorating self-discharge and cycle life of batteries. Hence the amount of Mn3+ ions becomes a key factor to determine electrochemical performance of LiNi0.5Mn1.5O4. Mn3+ content of SLNMO displayed in the Table 1 is twice higher than that of PLNMO sample. However it was not the only influenced factor, others also impacted.The initial galvanostatic charge–discharge curves for Li/LiNi0.5Mn1.5O4 coin cells with different morphologies were shown in Fig. 3a. Both samples show two charge and discharge plateau. The high plateau located at 4.7 V, represent the redox reaction of Ni ion, and another one located at 4.0 V, represent the redox reaction of Mn ion. The potential difference between charge and discharge plateaus for the both samples was similar, which reflects similar process of lithium deposition/dissolution in the first cycle smoothly and reversibly. The initial discharge capacities for SLNMO and PLNMO were 140.2 mA h g−1 and 138.9 mA h g−1 at the current density of 14 mA g−1 (0.1C) respectively. At the current density of 350 mA g−1 (2.5C), the discharge capacity of SLNMO was 125.2 mA h g−1 with capacity retention 89.2%, a little lower than 128.8 mA h g−1 that of PLNMO with capacity retention 91.7% after 200 cycles in Fig. 3b. PLNMO had better cycling performance than SLNMO sample before 140 cycles, however after 140 cycles, the degradation rate of PLNMO was significantly higher than that of SLNMO. Due to limited testing resources, only 200 cycles were tested in coin cells. The average coulombic efficiency of SLNMO cycled from 1st to 200th was 99.34%, similar to that of 99.35% for PLNMO.
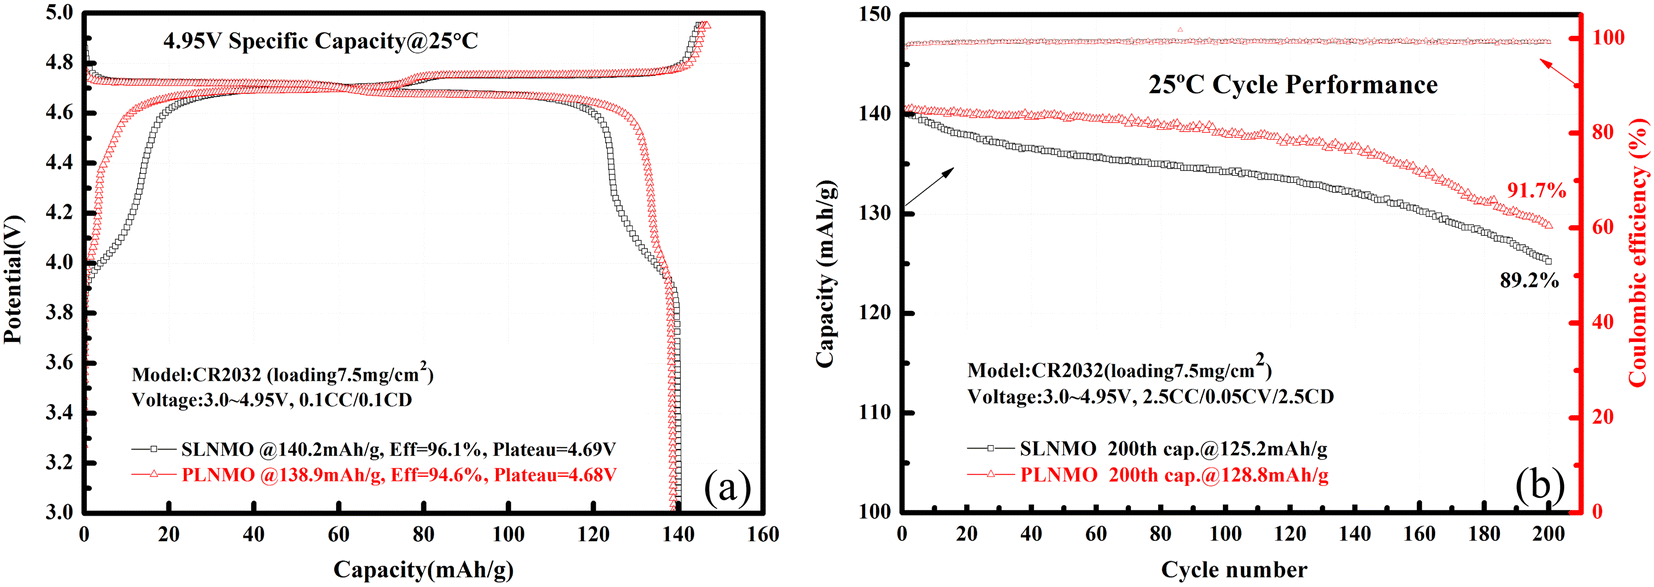 | ||
| Fig. 3 Initial charge/discharge profiles of Li/electrolytes/LiNi0.5Mn1.5O4 cells at 0.1C rate (a) and cycle performance at 2.5C rate at 25 °C (b). | ||
Other factors affecting electrochemical performances such as particle size and residual alkali were investigated. Different particle size of SLNMO with D50 = 6.804 μm was prepared to verify the effect of particle size on the electrochemical performance of samples with the same morphology. Experiments have shown that SLNMO samples of different particle sizes between D50 = 6.804 μm and D50 = 5.565 μm contributed a little difference to electrochemical performances. When the content of residual lithium salts is high, the influence on the battery performance is huge, especially in the high nickel cathode material (residual lithium salts 0.5–1.2%) and lithium-rich manganese-based cathode material (residual lithium salts 0.5–2.0%). High nickel materials generally need to wash to reduce the residual alkali on the surface of the materials. When the content of residual lithium salts is very low, usually lower than 0.1%, then its effect is negligible, and 5V spinel cathode material belongs to such category, with residual lithium salts 0.01–0.03%.
The cycle voltage differences at 25 °C between charge plateau and discharge plateau for both samples were different. The increase rate of the voltage difference for SLNMO was lower than the rate for PLNMO all over the 200 cycle in Fig. 4.
 | ||
| Fig. 4 The voltage differences of Li/electrolytes/LiNi0.5Mn1.5O4 cells cycled at 2.5C at 25 °C. | ||
Why the voltage difference between charge and discharge exists and why it becomes larger and larger as the number of cycles increase? The main reason lies in the overpotential (denote η), which is one of the core issues for battery dynamics. When the overpotential occurs, the chemical electrode potential or battery voltage (denote V) will deviate from the thermodynamic equilibrium potential (denote E), so the process can be expressed by eqn (1). In the charge process, the chemical electrode potential (denote Vc) can be expressed by eqn (2), and similarly in the discharge process, the chemical electrode potential (denote Vd) can be described as eqn (3).
| V(x) = E(x) ± η(x)± | (1) |
| Vc = εc + ΣIRc(i) | (2) |
| Vd = εd − ΣIRd(i) | (3) |
The internal resistance of both samples could be described in detail through Fig. 5, the Nyquist plots of the EIS measurements performed at open circuit voltage before and after room temperature cycle performance at 2.5C with the frequency range of 10 mHz to 100 kHz for Li/LiNi0.5Mn1.5O4 coin cells incorporating two different samples. Both samples exhibit a semicircle in the high-frequency range and an inclined line with angle over 45° before room temperature cycle performance and two semicircle in the high and middle-frequency range and an inclined line close to 45° in the low-frequency range after 200th cycle. The high-frequency semicircle represents the resistance of solid electrolyte interphase (RSEI), i.e., the resistance of the SEI layer on the anode electrode or CEI layer on the cathode electrode.10 The middle-frequency semicircle usually represents the charge transfer resistance (Rct), and the inclined line corresponds to the lithium-ion diffusion process, called Warburg diffusion.
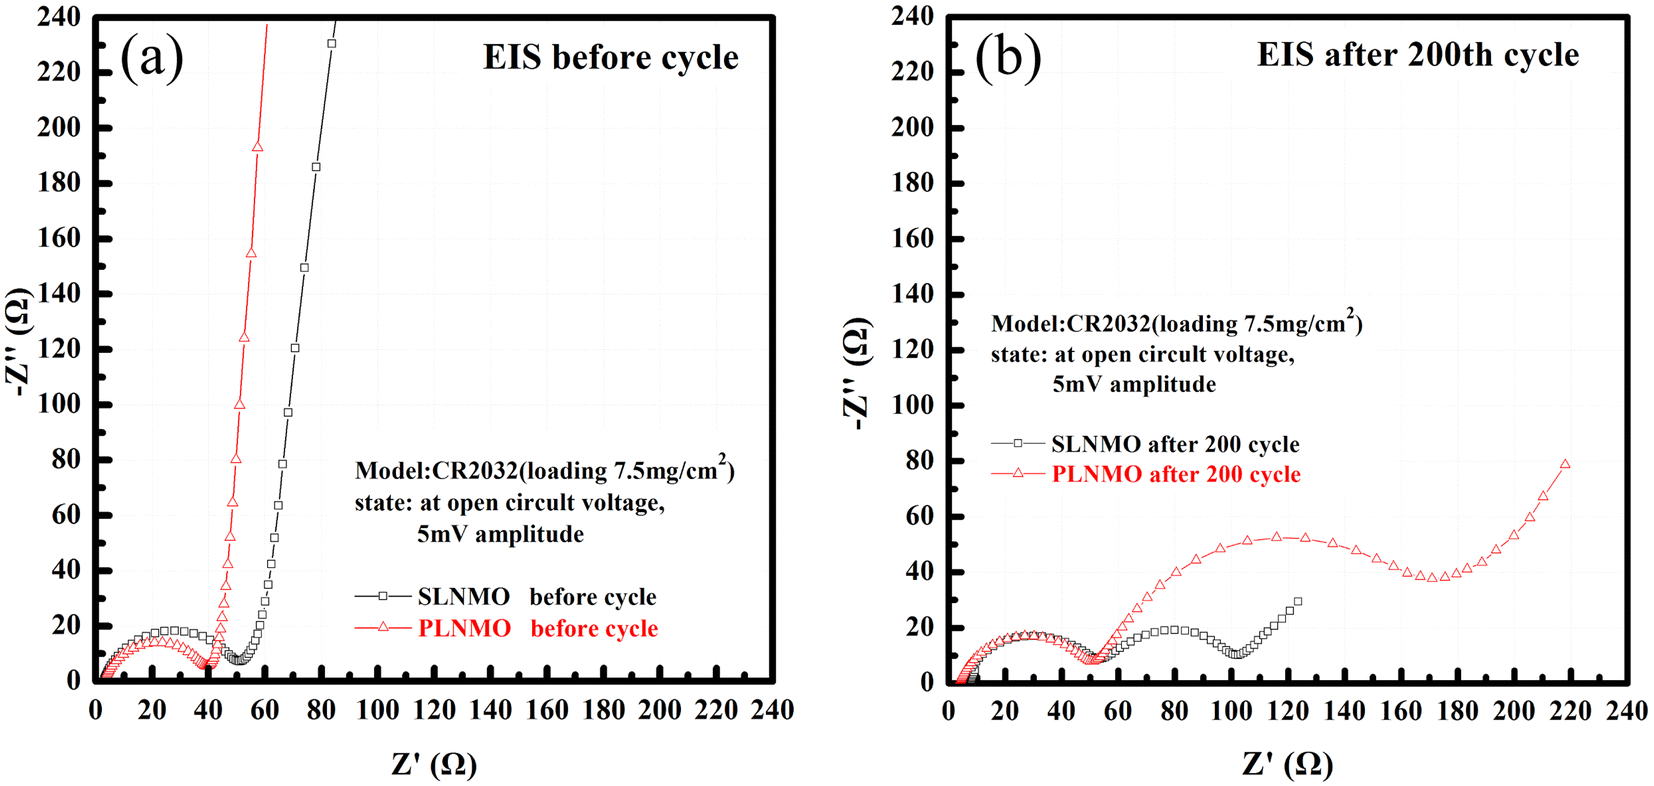 | ||
| Fig. 5 Nyquist plots of Li/electrolytes/LiNi0.5Mn1.5O4 cells measured at open circuit voltage before (a) and after 25 °C cycle (b) at 2.5C. | ||
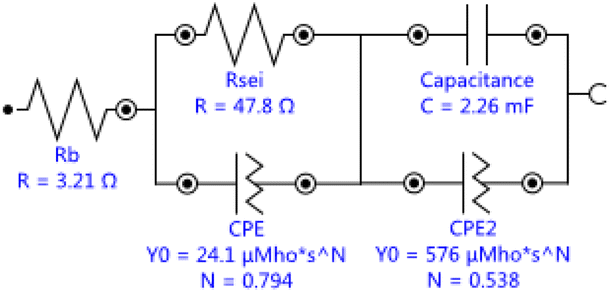
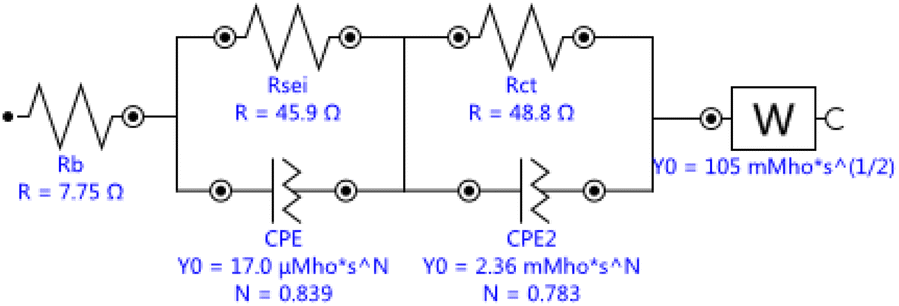
Single crystal is mainly composed of a single primary particle, while polycrystalline is formed by the agglomeration of many nano/micron-sized primary particles into micron-sized secondary particles. The agglomerated polycrystalline materials have shortened diffusion lengths within their primary particles and an increased number of pores, which accelerates Li+ transport, however, single crystalline materials have reduced surface areas, reduced grain boundaries, and more integrated crystal structures, similar to LiCoO2. Before cycling, different crystallinity of the electrode has different press density, porosity, and contacting area with the electrolyte, thus forming different SEI impedance. With electrochemical charging and discharging cycles, grain boundary cracks, voids, metal dissolution, electrolyte decomposition, gas generation, phase transition or other degradation behaviors of the electrode may occur, leading to the changes of solid state electrolyte impedance, charge transfer impedance and lithium ion diffusion kinetics. The EIS measurements were carried out to further understand the impact of these different material design on the kinetic and mass transport behaviors.11 The equivalent circuits for Fig. 5 were fitted by Nova 2.1 software and fitted data were in Table 2. Before cycle (Fig. 5a and Table 2), Li/LiNi0.5Mn1.5O4 coin cell incorporating SLNMO sample showed a little larger RSEI of 47.8 Ω than 36.3 Ω for PLNMO sample. After 200 cycles (Fig. 5b and Table 2): the RSEI decreased a little to 45.9 Ω for the cell with SLNMO, however increased to 46.6 Ω for the cell with PLNMO. A dramatically different appeared that Rct was 48.8 Ω for SLNMO, much lower than that was 120.3 Ω for PLNMO. Because chemical reaction involving intercalation/deintercalation continually occurs in/on the electrodes as the number of cycles increase, the internal resistance of RSEI and Rct become larger, as a result the electrochemical polarization is obvious. The EIS results demonstrated that SLNMO sample could form lower RSEI and Rct than PLNMO sample during cycling, thus decreased the impedance on the electrode/electrolyte interphase, therefore exhibited smaller electrochemical polarization or voltage difference.
| Nova fitting | Before cycle | After 200 cycle | |||
|---|---|---|---|---|---|
| Equivalent circuits (SLNMO for example, PLNMO is similar) |
|
|
|||
| Sample | RSEI (Ω) | Estimated error (%) | RSEI (Ω) | Rct (Ω) | Estimated error (%) |
| SLNMO | 47.8 | 0.124 | 45.9 | 48.8 | 0.074 |
| PLNMO | 36.3 | 0.034 | 46.6 | 120.3 | 0.012 |
The cycle performance depends not only on the interfacial reaction resistance of the redox reaction on both the cathode and anode electrode,12,13 but also on the speed of Li-ion diffusion.
Lithium-ion diffusion coefficient is one of the most crucial parameters determining the kinetics of intercalation compounds. Usually it can be quantitatively evaluated by electrochemical techniques such as galvanostatic intermittent titration technique (GITT), potentiostatic intermittent titration technique (PITT), electrochemical impedance spectroscopy (EIS), or cyclic voltammetry (CV).14,15 In Fig. 6, lithium-ion diffusion coefficient at different state of charge (SOC) before room temperature cycle performance for Li/LiNi0.5Mn1.5O4 coin cells incorporating two different samples was evaluated via GITT method,16 which can be obtained by the equation:
| DLi+ = 4/π(I0Vm/FA)2[(dE/dx)/(dE/dt1/2)]2 | (4) |
486 C mol−1, I0 (A) is the applied current, A (cm2) is the surface area of the electrode, E (V) is the galvanic cell potential, and x is the deviation from the initial stoichiometry, t (s) is the pulse time, L (cm) is the diffusion length.
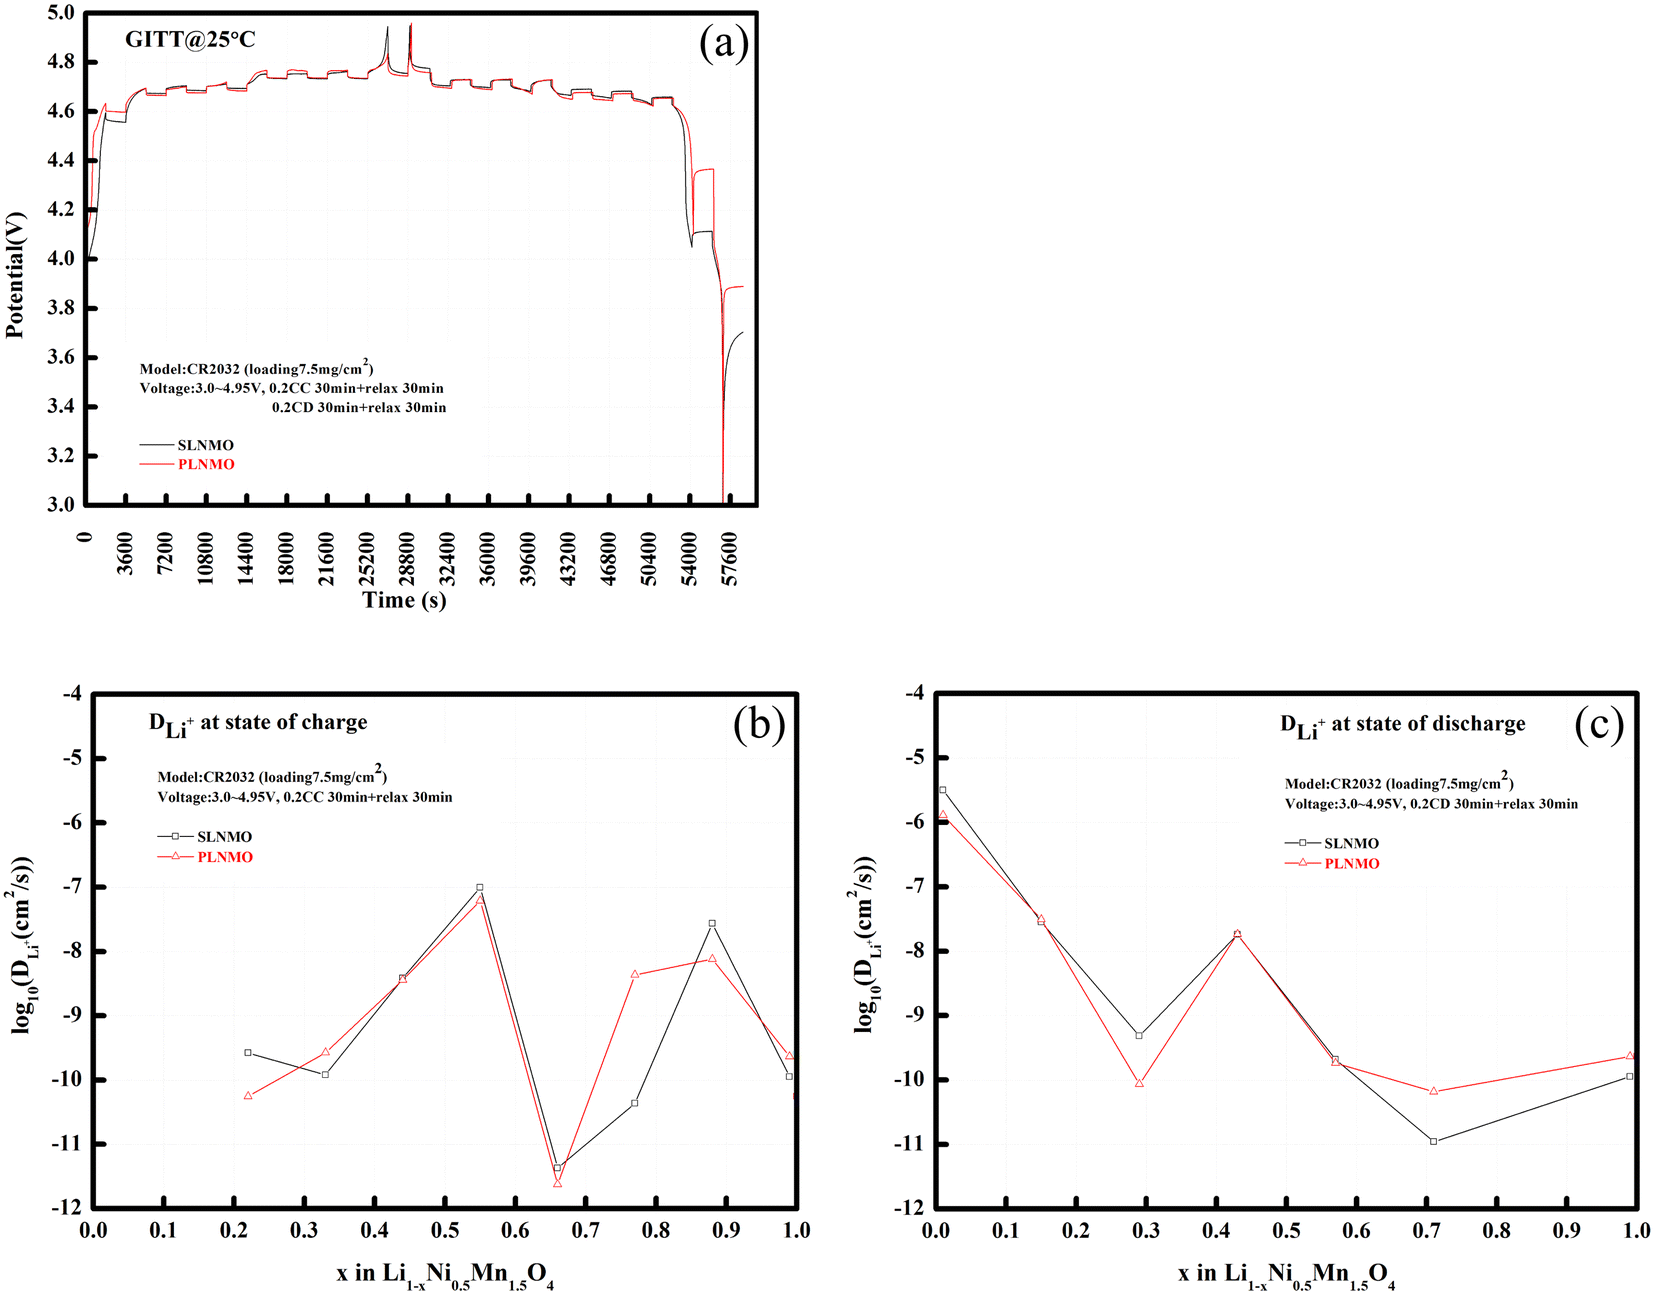 | ||
| Fig. 6 GITT curves of Li/electrolytes/LiNi0.5Mn1.5O4 cells (a), and DLi+ at different state of charge (b) and discharge (c) from GITT method. | ||
The GITT results proved that lithium-ion diffusion behavior is faster for SLNMO sample. During the charge process from x = 0.22–1.0 in Fig. 6b, lithium-ion diffusion coefficient increased initially and decreased afterwards, then increased again and decreased afterwards, resembling closely in the interlayer spacing variation tendency of lattice parameter, just like the capital letter of “M”, and the fastest lithium-ion diffusion occurred at the state of charge (SOC) ∼ 50% (x = ∼0.5), with DLi+ = 9.86 × 10⁻⁸ cm2 s−1 for SLNMO sample and DLi+ = 6.16 × 10⁻⁸ cm2 s−1 for PLNMO sample. During the discharge process from x = 1.0–0 in Fig. 6c, lithium-ion diffusion coefficient decreased initially and increased afterwards, then decreased again and increased afterwards, just like the capital letter of “W”, and the fastest lithium-ion diffusion occurred at the state of discharge (SOD) ∼ 100% (x = ∼0), with DLi+ = 3.16 × 10⁻⁶ cm2 s−1 for SLNMO sample and DLi+ = 1.28 × 10⁻⁶ cm2 s−1 for PLNMO sample. Lithium-ion diffusion coefficient was cross-checked by electrochemical impedance spectroscopy (EIS) method, and the fastest lithium-ion diffusion also occurred at the state of charge (SOC) 50% (x = 0.5), with DLi+ = 2.12 × 10⁻⁹ cm2 s−1 for SLNMO sample and DLi+ = 1.56 × 10⁻⁹ cm2 s−1 for PLNMO sample.
The heat flow (Φ) measured by DSC is composed of two parts, one is the sensible heat flow caused by the temperature rise, the other is the latent heat flow caused by the internal structure change of samples. According to formula (5), the heat flow is proportional to the heating rate. The higher the heating rate, the more significant the thermal effect. In order to make the thermal effect more obvious, DSC instrument experts recommend that our heating rate is 10 °C min−1. The occurrence time of thermal runaway is generally very short and the heating rate is very fast. DSC test also attempts to simulate the scene of thermal runaway of battery. Large volume crucible can hold more samples, which is beneficial to measure the weak thermal effect. Smaller crucible is beneficial to separate overlapping thermal effects due to better thermal conductivity and smaller temperature gradient, so we chose to use 25 μL crucibles.
| Φ = m × Cp × β + ΔHp × (dα/dt) | (5) |
Fig. 7 showed the DSC heat flow curves of the two samples' powder at electrochemically delithiated of 100% SOC with the same high voltage organic electrolyte. The decomposition of SLNMO started at higher onset temperature at 218 °C with less heat released than PLNMO at 200 °C. The peak temperature and heat generation of exothermic reaction profile for SLNMO was 227.8 °C and 438.6 J g−1, higher than that of the corresponding peak of PLNMO at 212.7 °C and 412.8 J g−1, thus confirmed the excellent thermal stability of SLNMO against PLNMO. Theoretically, Mn3+ content of SLNMO was higher, so the stable Mn4+ was less, and the thermal stability would be worse.17 Conversely, the better thermal stability of SLNMO could be ascribed to less oxygen release18 accompanied by higher Mn3+, and relatively inactive big primary grain particle relieving the intense reaction with electrolyte at high voltage.
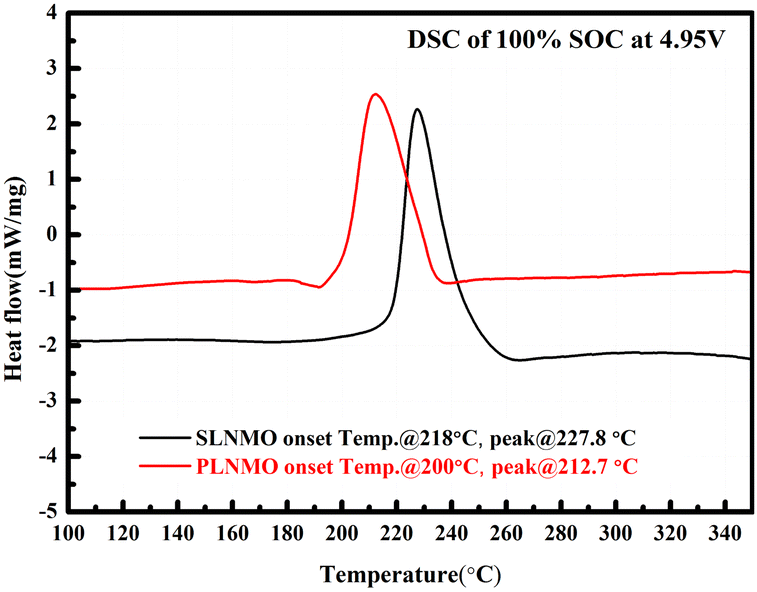 | ||
| Fig. 7 DSC profiles of the two samples disassembled at 100% SOC. | ||
Compared with the obvious thermal effect of 5V spinel materials, the thermal effect of the electrolyte was too weak to show under the heating rate of 10 °C min−1. Because the amount of electrolyte added was too small considering serious thermal runaway are likely to occur if large amount of electrolyte added. We conducted DSC under the heating rate of 10 °C min−1 with bare electrolyte and increasing the amount of electrolyte to 6 μL, and the exothermal peak of electrolyte can be apparent. The reason why the electrolyte with small amount did not have apparent exothermal peak could be attributed to the higher thermal stability of the salt–solvent pairs used in the electrolyte. In addition, fluorinated ether and carbonate solvents could have superior thermal resilience over non-fluorinated carbonate and ether solvents.19 Moreover, solvent additives can help passivate the reactive surface of the charged LNMO cathode, thereby limiting the side reactions between the electrode surfaces and the electrolyte, thus improving thermal stability.
4. Conclusion
In summary, two different morphologies of LiNi0.5Mn1.5O4 material with high purity were fabricated by solid-state reaction method. Furthermore, when applied as cathode materials for rechargeable lithium ion battery, the as-prepared SLNMO exhibited initial discharge capacity of 140.2 mA h g−1, good long-term cyclability at high-rate, smaller electrochemical polarization, lower internal resistance, faster lithium-ion diffusivity, and excellent thermal stability at full charged state with organic electrolyte. These results illustrated that LiNi0.5Mn1.5O4 material with single crystalline morphology is more suitable for the practical application of near future lithium secondary batteries.Author contributions
Jia Jin: conceptualization, methodology, validation, formal analysis, investigation, writing – original draft. Jin Ping Wei: resources, supervision. Zhen Zhou: writing – review & editing. Zhao Jun Xie: project administration, funding acquisition.Conflicts of interest
There are no conflicts of interest to declare.Acknowledgements
This work was financially supported by the National Natural Science Foundation of China (21972070).References
- B. Chen, L. B. Ben and Y. Y. Chen, et al., Understanding the formation of the truncated morphology of high−voltage spinel LiNi0.5Mn1.5O4 via direct atomic−level structural observations, Chem. Mater., 2018, 30, 2174–2182 CrossRef CAS.
- Z. J. Chen, R. R. Zhao and P. Du, et al., Polyhedral LiNi0.5Mn1.5O4 with excellent electrochemical properties for lithium−ion batteries, J. Mater. Chem. A, 2014, 2, 12835–12848 RSC.
- Y. Talyosef, B. Markovsky and R. Lavi, et al., Comparing the behavior of nano− and microsized particles of LiNi0.5Mn1.5O4 spinel as cathode materials for Li−ion batteries, J. Electrochem. Soc., 2007, 154, A682–A691 CrossRef CAS.
- H. F. Deng, P. Nie and H. F. Luo, et al., Highly enhanced lithium storage capability of LiNi0.5Mn1.5O4 by coating with Li2TiO3 for Li−ion batteries, J. Mater. Chem. A, 2014, 2, 18256–18262 RSC.
- X. L. Zhang, F. Y. Cheng and J. G. Yang, et al., LiNi0.5Mn1.5O4 porous nanorods as high−rate and long−life cathode for Li−ion batteries, Nano Lett., 2013, 13, 2822–2825 CrossRef CAS PubMed.
- L. Zhou, D. Y. Zhao and X. W. Lou, LiNi0.5Mn1.5O4 hollow structures as high−performance cathodes for lithium−ion batteries, Angew. Chem., Int. Ed., 2012, 51, 239–241 CrossRef CAS PubMed.
- J. Xiao, X. L. Chen and P. V. Sushko, et al., High−performance LiNi0.5Mn1.5O4 spinel controlled by Mn3+ concentration and site disorder, Adv. Mater., 2012, 24, 2109–2116 CrossRef CAS PubMed.
- M. Kunduraci and G. G. Amatucci, Effect of oxygen non−stoichiometry and temperature on cation ordering in LiMn2−xNixO4 (0.50≥x≥0.36) spinels, J. Power Sources, 2007, 165, 359–367 CrossRef CAS.
- H. D. Liu, J. Wang and X. F. Zhang, et al., Morphological evolution of high−voltage spinel LiNi0.5Mn1.5O4 cathode materials for lithium−ion batteries: the critical effects of surface orientations and particle size, ACS Appl. Mater. Interfaces, 2016, 8, 4661–4675 CrossRef CAS PubMed.
- M. S. Whittingham, Lithium batteries and cathode materials, Chem. Rev., 2004, 104, 4271–4301 CrossRef CAS.
- V. Vivier and M. E. Orazem, Impedance analysis of electrochemical systems, Chem. Rev., 2022, 122, 11131–11168 CrossRef CAS PubMed.
- J. Cabana, B. J. Kwon and L. H. Hu, Mechanisms of degradation and strategies for the stabilization of cathode−electrolyte interfaces in Li−Ion batteries, Acc. Chem. Res., 2018, 51, 299–308 CrossRef CAS PubMed.
- J. Ma, P. Hu and G. L. Cui, et al., Surface and interface issues in spinel LiNi0.5Mn1.5O4: insights into a potential cathode material for high energy density lithium ion batteries, Chem. Mater., 2016, 28, 3578–3606 CrossRef CAS.
- Y. J. Zhu, T. Gao and X. L. Fan, et al., Electrochemical techniques for intercalation electrode materials in rechargeable batteries, Acc. Chem. Res., 2017, 50, 1022–1031 CrossRef CAS PubMed.
- T. F. Yi, J. Mei and Y. R. Zhu, Key strategies for enhancing the cycling stability and rate capacity of LiNi0.5Mn1.5O4 as high−voltage cathode materials for high power lithium−ion batteries, J. Power Sources, 2016, 316, 85–105 CrossRef CAS.
- K. Tang, X. Q. Yu and J. P. Sun, et al., Kinetic analysis on LiFePO4 thin films by CV, GITT, and EIS, Electrochim. Acta, 2011, 56, 4869–4875 CrossRef CAS.
- H. J. Noh, S. J. Youn and C. S. Yoon, et al., Comparison of the structural and electrochemical properties of layered Li[NixCoyMnz]O2 (x=1/3, 0.5, 0.6, 0.7, 0.8 and 0.85) cathode material for lithium−ion batteries, J. Power Sources, 2013, 233, 121–130 CrossRef CAS.
- H. F. Xiang, H. Wang and C. H. Chen, et al., Thermal stability of LiPF6−based electrolyte and effect of contact with various delithiated cathodes of Li−ion batteries, J. Power Sources, 2009, 191, 575–581 CrossRef CAS.
- I. S. Buyuker, B. Pei and H. Zhou, et al., Voltage and temperature limits of advanced electrolytes for lithium–metal batteries, ACS Energy Lett., 2023, 8, 1735–1743 CrossRef CAS.
| This journal is © The Royal Society of Chemistry 2023 |