 Open Access Article
Revealing the improved sensitivity of PEDOT:PSS/PVA thin films through secondary doping and their strain sensors application†
Dania Adila Ahmad Ruzaidi ab,
Muni Raj Mauryaa,
Swathi Yempallya,
Sajeel Abdul Gafoora,
Mithra Geethaa,
Nazreen Che Roslanab,
John-John Cabibihanc,
Kishor Kumar Sadasivuni
 *a and
Mohd Muzamir Mahat
 *b
*b
aCenter for Advanced Materials, Qatar University, P. O. Box 2713, Doha, Qatar. E-mail: kishorkumars@qu.edu.qa
bFaculty of Applied Sciences, Universiti Teknologi MARA, Shah Alam 40450, Malaysia. E-mail: mmuzamir@uitm.edu.my
cMechanical and Industrial Engineering Department, College of Engineering, Qatar University, P. O. Box 2713, Doha, Qatar
First published on 13th March 2023
Abstract
The field of strain sensing involves the ability to measure an electrical response that corresponds to a strain. The integration of synthetic and conducting polymers can create a flexible strain sensor with a wide range of applications, including soft robotics, sport performance monitoring, gaming and virtual reality, and healthcare and biomedical engineering. However, the use of insulating synthetic polymers can impede the semiconducting properties of sensors, which may reduce sensor sensitivity. Previous research has shown that the doping process can significantly enhance the electrical performance and ionic conduction of conducting polymers, thereby strengthening their potential for use in electronic devices. However the full effects of secondary doping on the crystallinity, stretchability, conductivity, and sensitivity of conducting polymer blends have not been studied. In this study, we investigated the effects of secondary doping on the properties of poly(3,4-ethylenedioxythiophene):poly(styrene sulfonate)/poly(vinyl alcohol) (PEDOT:PSS/PVA) polymer blend thin films and their potential use as strain sensors. The thin films were prepared using a facile drop-casting method. Morphology analysis using profilometry and atomic force microscopy confirmed the occurrence of phase segregation and revealed surface roughness values. This evidence provided a comprehensive understanding of the chemical interactions and physical properties of the thin films, and the effects of doping on these properties. The best films were selected and applied as sensitive strain sensors. EG-PEDOT:PSS/PVA thin films showing a significant increase of conductivity values from the addition of 1 vol% to 12 vol% addition, with conductivity values of 8.51 × 10⁻⁵ to 9.42 × 10⁻³ S cm−1. Our 12% EG-PEDOT:PSS/PVA sensors had the highest GF value of 2000 too. We compared our results with previous studies on polymeric sensors, and it was found that our sensors quantitatively had better GF values. Illustration that demonstrates the DMSO and EG dopant effects on PEDOT:PSS structure through bonding interaction, crystallinity, thermal stability, surface roughness, conductivity and stretchability was also provided. This study suggests a new aspect of doping interaction that can enhance the conductivity and sensitivity of PEDOT:PSS for device applications.
1. Introduction
In recent years, conductive materials such as metals have been utilized to develop smart electronic sensors for environmental treatment, health monitoring, and renewable energy.1–3 Electronic sensors potentially can be used for vibration detection and weak physiological signal monitoring, thus high sensitivity and stretchability are essential for the sensors to capture subtle signals.4 Various electronic sensors that have been developed before are gas sensors, temperature sensors, humidity sensors, strain sensors and biosensors.5 One of the major drawbacks of these sensors generally is in their materials, as they are composed of metals that have very low stretching-ability, low sensitivity and are not wearable.6 Due to that, conducting polymers (CP) such as polyaniline (PANI), polypyrrole (PPy), poly(3,4-ethylenedioxythiophene) (PEDOT), and polythiophene (PTh) are usually implemented as sensor materials due to their chemical and physical properties that can be significantly changed in response to external stimuli such as temperature, pH, stress, moisture, electric fields, magnetic fields, light and chemical compounds.7–10 CP based thin films can exhibit some advantages over metal-based thin films in terms of their flexibility, easy-processing, low-cost and manageable-waste. They can be fabricated through spin coating, drop casting, dipping, chemical grafting or chemical vapour deposition method.11Nowadays, most researchers focus on obtaining light-weight conductive materials which are advantageous over metallic materials. For a strain sensor application, conducting polymers such as PEDOT:PSS have been extensively developed for strain sensors application due to their conductivity, biocompatibility and low redox potential, and their being cost-effective, and light-weight.12 PEDOT:PSS has semi-crystalline properties exhibited by PEDOT particles which can create grain boundaries that leads to the fragility of thin films. Due to that, in most previous work on thin film strain sensors, they mixed PEDOT:PSS with other synthetic polymers such as polyvinyl alcohol (PVA), poly(methyl methacrylate) (PMMA), polyethylene glycol (PEG) or poly lactic acid (PLA).13–16 Moreover, strain sensors have to be stretchable for its applications in detecting any strain changes through derivation of its electrical changes output with respect to its strain changes stimulus. Good sensitivity properties are important for a sensor to obtain higher measurement accuracy. In any application, sensors with unstable and low sensitivity can wrongly diagnose the input and hence create severe complications. To overcome this problem, secondary doping process was introduced to enhance the conductivity of CPs based sensors. Examples of dopants are dimethyl sulfoxide (DMSO), ethylene glycol (EG), Zonyl, or acids.
The introduction of such dopants can chemically re-structure the molecular arrangement of PEDOT:PSS that facilitates ionic conductions and electron hopping. The addition of dopants highly affects the crystallinity properties, molecular arrangement, phase segregation and bonding strength of the films and hence can tune the sensitivity performance. Dopants can cause PEDOT:PSS to behave as crystalline or amorphous materials depending on the chemical interaction and molecular arrangements that occurred. The crystalline and amorphous behaviour of PEDOT:PSS has its own way of propagating electron transfer along the PEDOT backbone structure. The most common mechanisms that have been reported are the phase segregation between PEDOT and PSS, and the conformational change or molecular arrangement of PEDOT chains from a coil structure to an extended coil or linear structure. Moreover, it has been reported that bonding strength is the main reason for the well dispersity of the PEDOT:PSS grains.17 The inherent molecular structure of PEDOT:PSS, which includes the conjugated bonds existing within the polymer chains and doping effects toward the energy band of the PEDOT:PSS would also affect the electrical performance.18 Since the sensitivity of sensors was measured from relative resistance values which comes from electrical behaviour of sensors, thus those above-mentioned properties are important to tune the sensitivity of sensors. As far as we have a concern, there is no complete and sufficient mechanism explained on the crystallinity, stretchability and conductivity effects upon secondary doping of PEDOT:PSS.19–22 To date, it is still a challenge to fabricate polymer-based strain sensors with desired mechanical properties and sensing performance by intoxicated materials and facile preparation methods.
Herein, we present a conductive thin film strain sensor based on PVA synthetic polymers blended with doped-PEDOT:PSS dispersion by using a simple drop-casting method. To effectively improve the conductivity and sensitivity properties of this thin film for sensors application, two different dopants, DMSO and EG were used as secondary dopants. Fourier transmittance infrared spectroscopy (FTIR), X-ray diffraction spectroscopy (XRD) and thermal gravimetric analyser (TGA) were used to analyse the chemical interactions occurs through functional groups detection, crystallinity and thermal properties of the films, respectively. The morphology and surface roughness of the thin films were analysed by means of profilometer and atomic force microscope (AFM). The electrical behaviour of prepared thin films was further evaluated and measured using a multimeter, broadband dielectric spectroscopy (BDS) and four-point probe to prove the secondary doping effect concept. The stretchability of thin films was also characterized by Lloyd Friction/Peel Tester. Based on this evidence, a relatively complete consideration upon chemical interactions, thermal stability, surface morphology, crystallinity, and conductivity effects were revealed to an extent of portraying how the conduction mechanism occurs upon doping process. Finally, utilising a silver paste and copper circuit system to evaluate the sensitivity performance, the best films were chosen and used as sensitive strain sensors. The improved sensitivity through doping effects on thin film strain sensors proposed here may open up new opportunities for the easiest fabrication of other flexible devices such as actuators and health monitoring applications.
2. Experimental section
2.1 Materials
Conductive grade of poly(3,4-ethylenedioxythiophene):poly(4-styrenesulfonate) (PEDOT:PSS) with 1.3wt% dispersion in H2O, dimethyl sulfoxide (DMSO) (≥99.9%), ethylene glycol (EG) (≥99.7%), poly(vinyl) alcohol (PVA) powder, conductive silver printing ink with resistivity 9–10 μΩ cm and xylene solution (reagent grade) were all purchased from Sigma-Aldrich Corporation (St. Louis, MO, USA). No changes were made to the chemicals, and they were used without further modification. The PVA was initially dissolved in deionized water at 80 °C for 6 h, before blending. DMSO and EG solution acted as a secondary dopant for PEDOT:PSS and their volume percentage was prepared as 0, 1, 3, 5, 7, 9, and 12 v/v%. The volume fractions described in this study were the secondary dopant volumes to the total volumes of secondary dopants and soft polymers PEDOT:PSS. After doping process, the doped-PEDOT:PSS solution was added with 7 wt% PVA with 1 mL![[thin space (1/6-em)]](https://www.rsc.org/images/entities/char_2009.gif) :
:![[thin space (1/6-em)]](https://www.rsc.org/images/entities/char_2009.gif) 4 mL ratio. The polymer blending solution was stirred overnight before use.
4 mL ratio. The polymer blending solution was stirred overnight before use.
2.2 Samples preparation
Glass slides as film substrates of area 25 mm × 75 mm were rinsed with acetone for 15 min. Exactly 5 mL of the polymer blending solution was dropped onto glass substrate and was left to dry at room temperature overnight. The film was then annealed in the ambient atmosphere at 65 °C for 3 h. The thickness of all fabricated thin films was about the same (0.065 mm < thickness < 0.15 mm) due to a fixed amount of solution drop. All thin films samples were peeled off from the glass substrate for further characterization. The samples for multi-meter resistivity measurement (preliminary steps in this study) were fabricated almost the same way, only the substrates were indium tin oxide (ITO) – glass with an interdigital electrode circuit and 3 drops of blending solutions were required.2.3 Fabrication of doped-PEDOT:PSS/PVA strain sensors
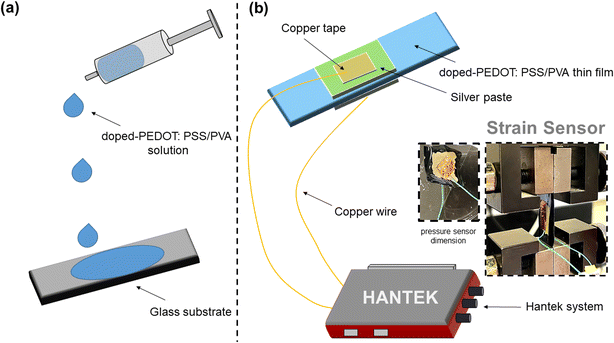
The prepared PEDOT:PSS thin films were designed to obtain strain sensors; the conductive silver ink and xylene solution were used to coat the thin films and were left drying for 3 h at 50 °C. Copper tape was used to connect the copper wire with thin films. A complete circuit for strain sensors was prepared by having the Hantek system as a relative resistivity detector. Fig. 1 illustrates the preparation of PEDOT:PSS/PVA thin film through drop-casting method and the experimental set-up to evaluate strain sensors performance. The fabrication method for pressure sensors was the same as strain sensors, and it was made 3 times thicker than strain sensors. They were annealed at 65 °C for 24 h. However, in this study we only run preliminary relative resistivity measurements on the pressure sensors.2.4 Characterization and testing
The IR spectra of thin films were measured by Fourier-transform infrared spectroscopy (FTIR) from PerkinElmer Spectrum 3 with the wavenumber range from 500 to 4000 cm−1 and were baseline corrected. The crystallinity properties were characterized using X-Ray Diffractometer (XRD) – PANalytical Empyrean machine. The parameters were set with CuKα radiation of wavelength 1.541 Å and a scanning angle 2θ over a range of 5–90°. The thermogravimetric analysis (TGA) 4000 from PerkinElmer was used for thermal analysis with a heating rate of 20 °C min−1 from room temperature to 500 °C. The surface roughness of thin films was 3D captured, contoured and measured using the 3D optical surface metrology system (profilometer) Leica DCM8 (Leica, Germany). The morphology of thin films was captured from field emission-scanning electron microscopy (FESEM), Thermo Scientific brand (Apreo 2s) at magnification of 2000×. The surface topography of thin films was further pictured using atomic force microscope (AFM) MFP-3D system (Asylum Research, USA) equipped with a cantilever containing a sharp tip (Al reflex coated Veeco model-OLTESPA, Olympus, Japan).The resistivity of drop casted films onto interdigital electrodes was preliminary measured using Fluke 27 handheld digital multimeter. The sheet-conductivity of thin films was measured using Ossila four-point probe with its system software. The electrical properties of thin films such as their electrical conductivity, permittivity and tan delta spectra were further analysed through broad dielectric spectrometry (BDS) Novocontrol from frequency of Hz to MHz. All direct conductivity measurements were conducted at room temperature. We have re-measured the conductivity of films using four-point probe after they were left for 2 weeks to study their conductivity stability. The tensile strength of thin films was evaluated using Lloyd Friction/Peel Tester (Model: LF 1K Plus) of 1 kN capacity. The dimension of thin film was as in ASTM D882, a standard test method for tensile properties of thin plastic sheeting. For the strain sensor evaluation, both sides of the sensor were connected to the Hantek (6022BL PC USB Oscilloscope 2 Digital Channels) using silver paste and copper wires to record its relative resistivity. Both ends of the sensors were connected to the Lloyd Friction Tester grip, to exert a specific amount of pulling force onto the sensors. The relative resistance changes were recorded over the stress-strain condition.
3. Results and discussion
3.1 Functional groups detection, crystallinity and thermal properties of doped-PEDOT:PSS/PVA thin films
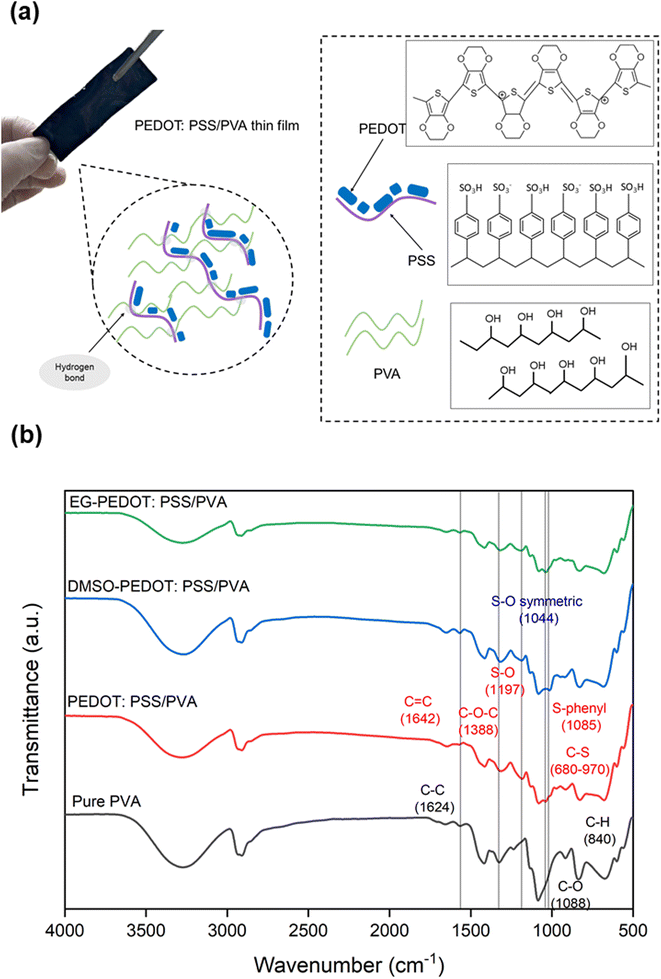
The fabricated PEDOT:PSS/PVA thin films are dark-blue in colour. The chemical structures of PEDOT:PSS and PVA, and the chemical interactions of their blends are illustrated in Fig. 2a. PEDOT backbone structure is composed of π–π interaction between its thiophene rings which conduct a certain amount of electric current. To produce thin film, PVA is required as a plasticizer due its great modulus strength. However, the insulating properties of PVA might decrease the electrical properties of PEDOT:PSS. Due to that, two different dopants which are DMSO and EG with varied volume percentage (0, 1, 3, 5, 7, 9, 12 vol%) were utilized to counter the conductivity loss. The conductivity of EG-PEDOT:PSS/PVA thin films is better compared to DMSO-PEDOT:PSS/PVA thin films in terms of its stability and sensitivity to be used as sensors. This can be explained through chemical interactions, surface morphology and crystallinity analysis which greatly affects the conductivity properties of thin films.FTIR analysis was conducted to estimate the bonding and functional groups present in the thin films. The characteristic peaks of the O–H group can be clearly seen at a wavenumber of ≈3350 cm−1. According to previous studies, the addition of PEDOT:PSS into the PVA polymer chain should increase the intensity of O–H peak due to the formation of more hydrogen bonding between sulfonic groups of PSS and the hydroxy group of PVA.17 However, obtained results show less intensity of O–H peak for both PEDOT:PSS/PVA and EG-PEDOT:PSS/PVA thin films. This might be due to fast moisture loss during the annealing process of the films. With the addition of PEDOT:PSS conducting polymer, C![[double bond, length as m-dash]](https://www.rsc.org/images/entities/char_e001.gif) C, C–O–C, S–O, S–phenyl and C S bonds were all can be detected at a wavenumber of 1642, 1388, 1197, 1088 and 970 cm−1 respectively (Fig. 2b).23 DMSO as a secondary dopant intensified its characteristic peak of S–O symmetric bonding at a wavenumber of 1044 cm−1.
C, C–O–C, S–O, S–phenyl and C S bonds were all can be detected at a wavenumber of 1642, 1388, 1197, 1088 and 970 cm−1 respectively (Fig. 2b).23 DMSO as a secondary dopant intensified its characteristic peak of S–O symmetric bonding at a wavenumber of 1044 cm−1.
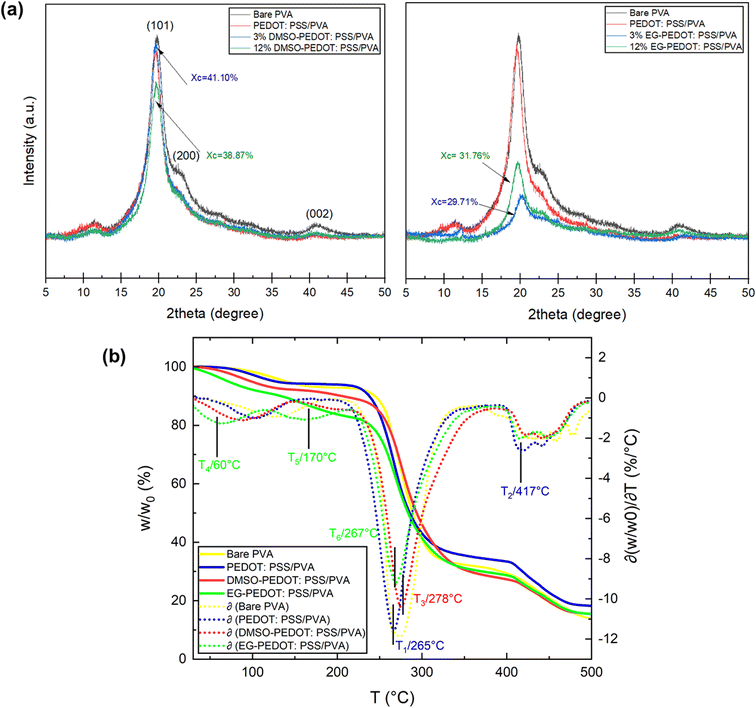
We have conducted the XRD analysis to further analyse the crystallinity effects on the secondarily doped thin films. The degree of interaction between PVA and PEDOT:PSS with the addition of secondary dopants at different vol% will impact the crystallinity of the final doped PEDOT:PSS/PVA thin films because both PVA and PEDOT:PSS are semi-crystalline polymers. From the results plotted in Fig. 3a, the bare PVA thin films exhibit two characteristic peaks at 2θ of 19.5° and 41.5°, which are related to the characteristic peaks of PVA membrane.24 Normally, PVA should have two peaks at (101) and (200), but if the crystal is not strong enough, the two peaks will merge into one.25 The crystallinity values, shown in the XRD graph, reveal the degree of crystallinity of doped PEDOT:PSS/PVA. For the DMSO-doped thin films, with the increasing DMSO vol%, the crystallinity decreases from 41.10% (for 3 vol% DMSO) to 38.87% (for 12 vol% DMSO). For DMSO dopant effects, it was reported previously that PEDOT:PSS's conductivity was boosted by up to two orders of magnitude at room temperature. This is due to the high dielectric constant of added polar solvents, the screening effect was assumed to occur between the charge carriers and counter-ions. This lowers the coulombic interaction between PEDOT and PSS, thereby improving the PEDOT:PSS conductivity.26 According to the obtained XRD results, the crystallinity of PEDOT:PSS/PVA thin film decreases with the increase in addition of DMSO vol%. This is due to the chain expansion in the amorphous PSS cell where the hydrogen bonding of PSSH with DMSO easily replaces intra-chain hydrogen bonds of PSSH and causes the number of PSSH-DMSO hydrogen bonds to increase.18 Meanwhile, for EG-doped thin films, the crystallinity increases from 29.71% (for 3 vol% EG) to 31.76% (for 12 vol% EG). However, both 3 and 12 vol% EG-PEDOT:PSS/PVA demonstrates low crystallinity compared to PEDOT:PSS/PVA with no addition of dopants. This result proves the crystallinity effects of doped thin films can be differentiated through chemical interaction between PEDOT:PSS/PVA at low and high amounts of EG dopant. Secondarily doping of EG does affect the crystallinity, structure and electrical conductivity of PEDOT:PSS/PVA thin films. EG helps to remove insulating PSS from the surface of PEDOT/PSS grains and helps to crystallize PEDOT, thus resulting in the formation of large numbers of highly conductive grains that improve charge carrier transport within the PEDOT:PSS system.27 Theoretically, the improved electrical conductivity of semiconductors comes from the ionic conduction mechanism due to the motion of ionic charge. Materials with low crystallinity properties like PEDOT:PSS/PVA thin films can be known as ionically charged.
The TGA curves and its thermogravimetric derivatives of thin film samples were measured and presented in Fig. 3b. Both doped PEDOT:PSS/PVA with the highest (12 vol%) of dopants were chosen for this thermal analysis. Three decomposition stages were measured in bare PVA and PEDOT:PSS/PVA thins films. Meanwhile, DMSO-PEDOT:PSS/PVA and EG-PEDOT:PSS/PVA thin films showed four decomposition stages. Bare PVA thin films showed slight weight loss below 110 °C, which was assigned to the evaporation of imbibed water. The second rapid weight loss around 110–280 °C was accompanied by the decomposition of hydroxyl groups of the PVA and the third stage of weight loss in PVA specimens was at 280–390 °C. The blending of PEDOT:PSS and PVA acutely decreases the thermal stability of thin films which can be observed at T1 and T2. The addition of DMSO and EG as secondary dopants increases the thermal stability of the thin film, where both plots have better thermo-derivatives at T3 and T6. It should be noted that EG-PEDOT:PSS/PVA thin films experienced weight loss at T4 and T5 which can be attributed to the weak thermal properties of EG.
As compared to the bare PVA thin films, the addition of dopants does decrease the crystallinity properties but improves the thermal stability of thin films. Thin films with high crystallinity properties often resembled fragile and brittle. Meanwhile, thin films with low crystallinity are amorphous and might have better stretchability properties. When related to the improved thermal stability of doped PEDOT:PSS/PVA thin film, it can be concluded that dopants cause a formation of strong inter-bonding within the structure of PEDOT:PSS/PVA blending.
3.2 Surface morphology and topography of doped-PEDOT:PSS/PVA thin films
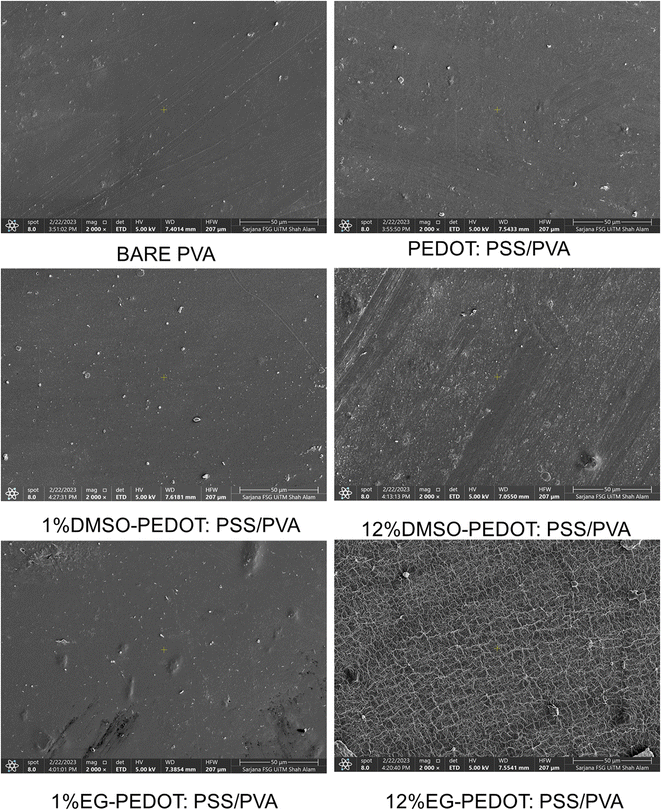
We further analyse the morphology and topography of thin films to have a better understanding of the dopant's effects. All scales cannot be measured by a single measurement; hence it is essential to establish strategies for combining data from various instruments. Thus, in this study, we have employed three characterization techniques; FESEM, profilometer and AFM. FESEM analysis captures the morphology of films while the profilometer technology offers a wider field of view, making it possible to fully measure and then identify a bigger surface area of films. On the other hand, the AFM approach expands the range of capabilities, providing 3D measurement at higher lateral and vertical resolution than the range of the profilometer. Fig. 4 shows the surface FESEM images of thin films. The bare PVA films show a smooth surface and for films with the presence of PEDOT:PSS, the randomly distributed PEDOT particles in PVA matrix can be seen. The effects of dopant addition on the PEDOT:PSS/PVA thin films were investigated, and it was found that DMSO and EG dopants individually cause morphology changes to thin films. For instance, the addition of 12% DMSO originating smaller PEDOT particles over the surface of films. Meanwhile for EG dopants, the “network” of grain boundaries can be seen clearly with the addition of 12% EG. High concentration of EG does cause dominant morphology changes. According to previous studies, the bright region of the network often resembles phase-separated PEDOT:PSS chains.28 We further analyse this phenomenon with the aid of a profilometer and AFM.Contour pictures captured from the profilometry analysis were as in Fig. S1.† Bare PVA thin film exhibits mono-contour properties, while other thin films incorporating PEDOT:PSS and dopants depict 4 different contour colours. Also, contour intensity increases after adding DMSO and EG dopants. This can be attributed to the dopant's binding interaction that occurs within the structure of thin films and hence causes the distribution of different surface roughness all over the thin film surfaces.
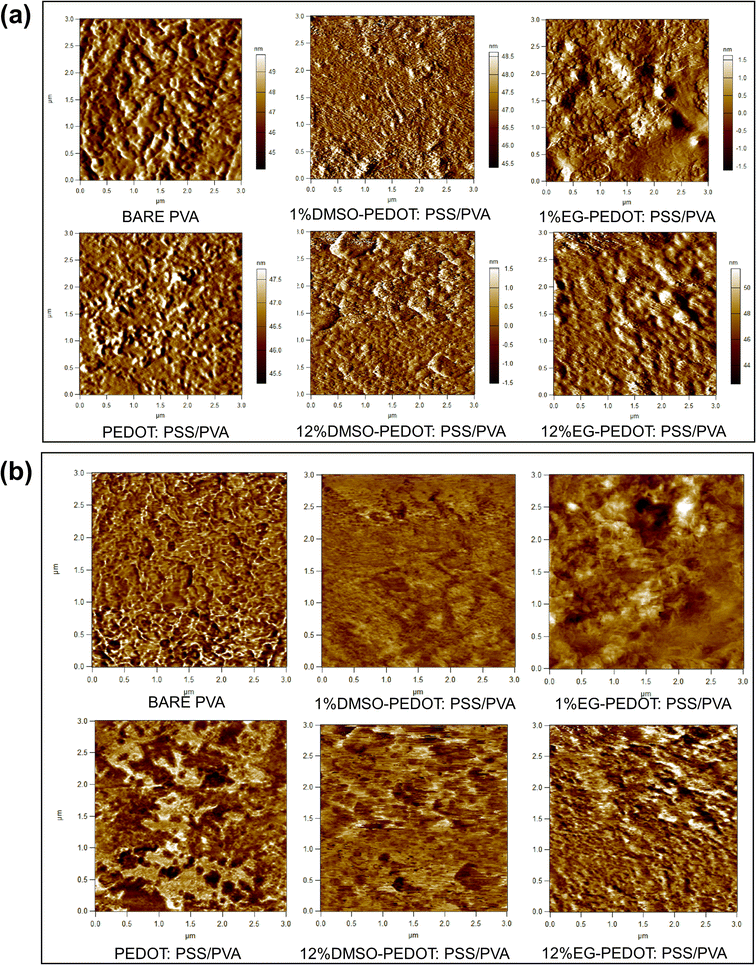
Fig. 5 and Table 1 shows the 3D isometric view from profilometry and surface roughness value of selected thin films, respectively. Grossly from the obtained results, it can be said that with the increase of dopants vol%, the surface roughness of thin films increases. The topology of thin films analysed from AFM 2D images in Fig. 6a confirms the surface roughness trends determined by optical profilometry. Additional information and evidence on AFM 3D images of thin films and their surface roughness distribution graph were attached in Fig. S2.† As from the AFM 3D images, the PVA film is relatively rough (rms 4.80 nm). Upon the addition of 75% PEDOT:PSS, the films became smoother (rms 1.698 nm). This can be attributed to the formation of more hydrogen bonding between PVA and PEDOT:PSS, hence minimizing the vertical stacking or agglomeration of PVA. Moreover, there is a substantial increase in surface roughness upon adding 1% DMSO (rms 2.162 nm) and 1% EG dopants (rms 4.636 nm) when compared to PEDOT:PSS/PVA. Maximum addition of dopants (12 vol%) recorded higher surface roughness of thin films (12% DMSO = rms 3.503 nm, 12% EG = rms 7.352 nm). This might be due to the segregation occurring involving PEDOT:PSS.
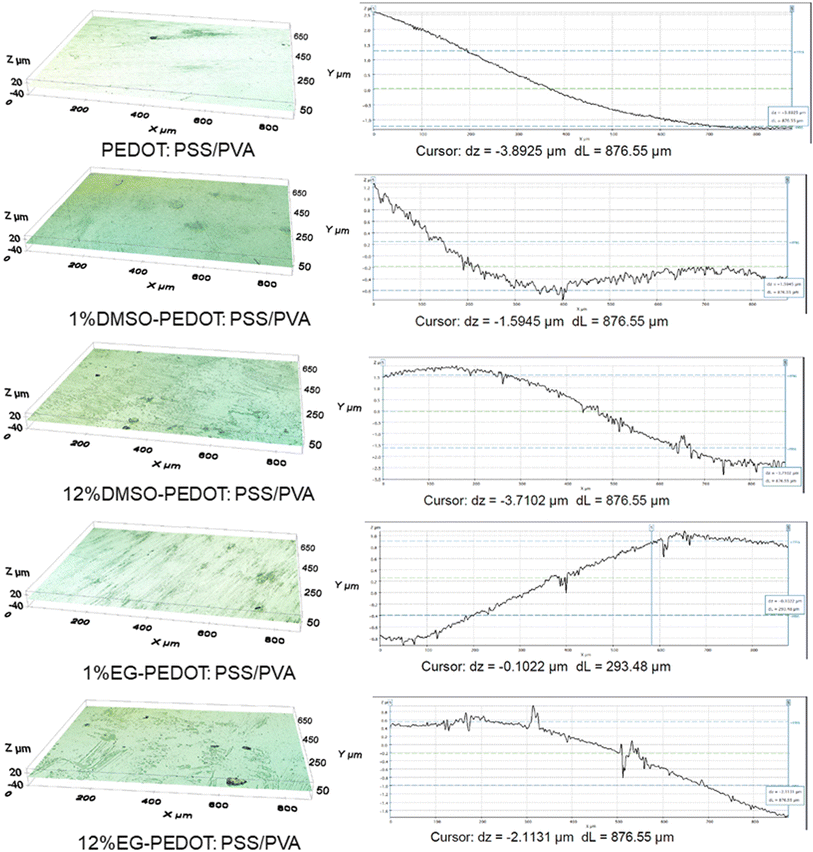 | ||
| Fig. 5 The isometric profilometry of fabricated PEDOT:PSS/PVA thin films with its surface roughness distribution value. | ||
| Thin films | Surface roughness from profilometer (μm) | Surface roughness from AFM (rms @ nm) |
|---|---|---|
| Bare PVA | 0.233 | 4.800 |
| PEDOT:PSS/PVA | 1.102 | 1.698 |
| 3% DMSO-PEDOT:PSS/PVA | 0.315 | 2.162 |
| 12% DMSO-PEDOT:PSS/PVA | 1.477 | 3.503 |
| 3% EG-PEDOT:PSS/PVA | 0.581 | 4.636 |
| 12% EG-PEDOT:PSS/PVA | 0.678 | 7.352 |
From the XRD and AFM results, a gradually increased aggregation formed with the addition of more DMSO dopants slightly lowers the crystallinity of thin films. According to previous research, the addition of DMSO decreased the thickness of the PSS and enhanced the electrical conductivity through significant morphology changes.29 The mechanism behind these changes is due to the interactions between the PEDOT chains and DMSO which induce conformational changes from coil, linear, and expanded coil structures to linear and expanded coil structures (i.e. from benzoid to quinoid).30 The interactions are initiated by the hydrogen bonding between the sulfonic acid groups in PEDOT:PSS and the polar groups (SO and SCH3) of the DMSO additive. High charge-carrier mobility results from these interactions with the increased conductivity of the PEDOT:PSS thin film.31 Furthermore, another study also claimed that the coulombic attraction between PEDOT and PSS chains is expected to reduce with the increase of DMSO concentration, caused by the change in the shape of the domains, from spheroidal to ellipsoidal. Such asymmetric domains in PEDOT:PSS are known to have thinner boundaries of PSS and hence less energy barrier and increased hole injection.32
The increase in surface roughness in the EG-PEDOT:PSS/PVA might be due to the PSS segment's thinning effect due to its interaction with EG. Since EG has two hydroxyl groups that can readily interact with the PEDOT and PSS segments, we can expect a compact morphology of the doped PEDOT:PSS thin film.33 When relate to the XRD results, this compact morphology of EG-PEDOT:PSS/PVA thin films also shows higher crystallinity index with increasing amount of EG. The addition of EG allows the PSS chains to reorganize and the PEDOT nanocrystals to pack together and form a layered structure with a higher order, which with an increasing number of bi-polarons of PEDOT.34 This causes transitions between quinoid- and benzoid-dominated structures. The PEDOT chain stores charge in the form of polarons/bi-polarons; continuously propagates an electrical current along the polymer chain.35 Phase separation between the conducting PEDOT and insulating PSS was expected to occur based on the AFM results from phase retrace mode. As shown in Fig. 6b, the high concentration of DMSO and EG dopants addition caused the segregation of phases. The polar additions were proposed to reduce the electrostatic connections between PEDOT and PSS, allowing the two polymers to separate.36 During the screening process, PEDOT on PSS chains may be redistributed, allowing the “release” of free PSS. PSS and EG can combine forming sulfonic esters.37 Polyalcohols, such as glycerol and ethylene glycol, have been shown to cross-link sulfonated polymer films via this reaction. These interactions provide the free energy that promotes the dissolution of PSS in the additive phase. They can also impede the electrostatic contacts between PEDOT and PSS, promoting reorganisation and separation.38
3.3 Electrical behaviour of doped-PEDOT:PSS/PVA thin films
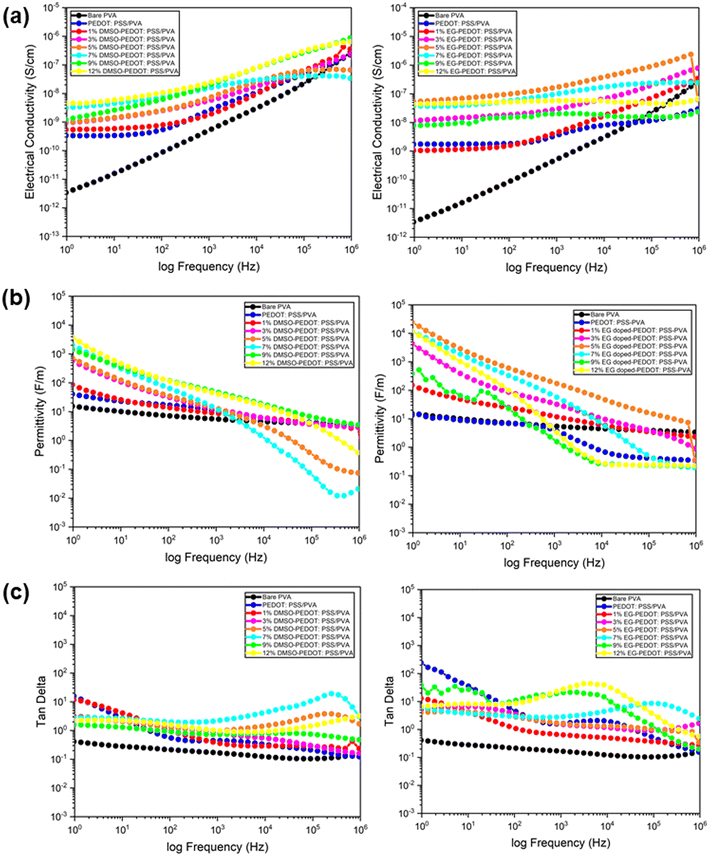
Electrical behaviour of thin films was investigated by using broadband dielectric spectroscopy (BDS) and four-point probe to prove all the results obtained in the previous section. The resistivity of dried doped-PEDOT:PSS/PVA blending on interdigital electrode ITO glass was preliminary tested by using a multimeter and their reading was recorded as in Fig. S3.† All blending was provenly having an amount of resistivity values at kΩ scale which reflects their semi-conducting properties except for bare PVA. From the BDS analysis, we obtained the thin films' electrical conductivity, permittivity and tangent loss over a frequency range from 100 to 106 Hz (Fig. 7a–c). All samples exhibit similar behaviour for the frequency dependence of conductivity (S cm−1). The conductivity of bare PVA cannot be read by four-point probe due to the very low resistance detected. According to a previous study, PVA exhibits the electrical conductivity of 1.63 × 10⁻¹² S cm−1 at room temperature.39 We have used this value to compare the performance of doped PEDOT:PSS/PVA films. We have and both DMSO- and EG-PEDOT:PSS/PVA thin films increases with increasing frequencies, obeying the universal power law. The DMSO-PEDOT:PSS/PVA thin films behave slightly dependent with increasing frequency. The addition of higher vol% of DMSO increases the conductivity performance of thin films from 10−9 to 10−6 S cm−1 over a frequency range from 100 to 106 Hz. This is due to the favourable hopping conduction caused by segregated grains forming dipole polarization effects and facilitating the migration of charge carriers.40 Among all prepared DMSO doped thin films, PEDOT:PSS/PVA with 12 vol% of DMSO shows the highest conductivity of the order 10−6 S cm−1 at 106 Hz. For EG-PEDOT:PSS/PVA thin films, the conductivity of all thin films is almost constant, which can be described as independent and stable from exerted frequencies. Thin films with the addition of 5 vol% of EG portray better conductivity behaviour. Previous study stated that the doping of EG in PEDOT:PSS led to the creation of large grains with a compact morphology and facilitated the charge transport mechanism in the form of polarons and bipolarons, which resulted in a significant enhancement in the frequency-dependent conductivity.33Also, conductivity permittivity properties of DMSO- and EG-PEDOT:PSS/PVA thin films were measured. In this study, the conductivity permittivity or real part of dielectric constant explains the ability of thin film materials to store electrical energy in the electric field. The results showed that the permittivity of both DMSO- and EG-PEDOT:PSS/PVA thin films decreased gradually as a function of applied frequency. An obvious decrement pattern of permittivity can be observed from PEDOT:PSS/PVA thin films with higher dopants vol% (7 to 12 vol% of DMSO and EG). The permittivity of the thin films was found to be high at lower frequencies due to polarisation effects, but decreased at higher frequencies due to the switching action of dipoles to the applied electric field. With the addition of dopants in PEDOT:PSS/PVA, the drop in permittivity values (from 104 to 10−2 F m−1) may be primarily caused by resonant electronic transitions or molecular vibrations in the polymer matrix as well as interfacial electrode polarisation at the grain boundaries.
The tangent loss of thin films quantifies the way in which thin film material absorbs and disperses the energy. Thin films with DMSO and EG dopants show a gradually decreasing pattern over a gradually increasing frequency. However, PEDOT:PSS/PVA thin films, with 7, 9 and 12 vol% of DMSO and EG dopants, demonstrate an increase-decrease pattern of tangent loss. This explains that the dissipation of the electrical energy happens due to different electrical conduction, as the frequency increases.41
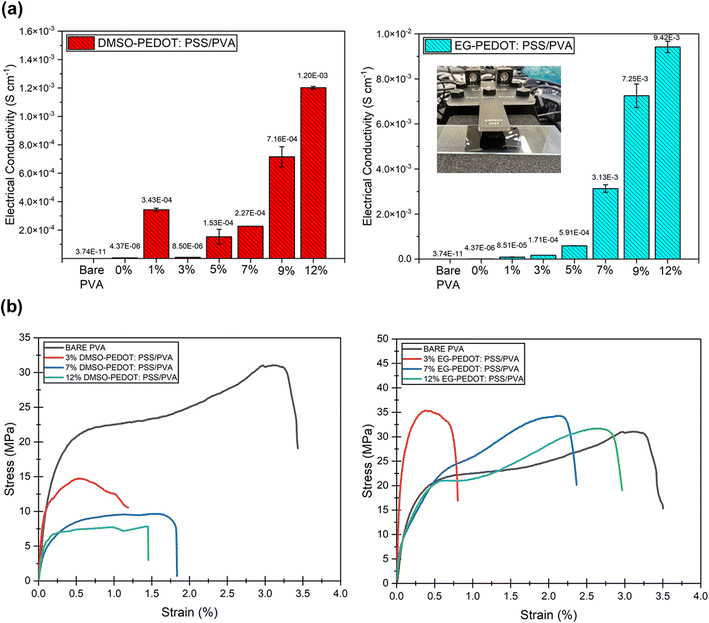
We did measure the surface conductivity of the thin films by using a four-point probe to analyse the electrical performance of thin films when it is in-touch with any external materials exerted on the surface of the thin films. For the thin film to be used as sensor, its surface must have an adequate amount of electric current to facilitate the transportation of electrical changes from the thin film to any materials that act as a “bridge” in the sensor system. The average conductivity reading was recorded in Table 2 and Fig. 8a for both DMSO- and EG-PEDOT:PSS/PVA thin films. The conductivity pattern of DMSO-PEDOT:PSS/PVA has slightly fluctuated with low addition of DMSO (3 vol%) and it continue to gradually increase from 1.53 × 10⁻⁴ (5% DMSO) to 1.20 × 10⁻³ S cm−1 (12% DMSO). EG-PEDOT:PSS/PVA thin films showing a significant increase of conductivity values from the addition of 1 vol% to 12 vol% addition, with conductivity values of 8.51 × 10⁻⁵ to 9.42 × 10⁻³ S cm−1. Both DMSO and EG, which act as dopants to PEDOT:PSS/PVA thin films have their own conductivity mechanism. However, it can be clearly seen that EG-PEDOT:PSS/PVA thin films show better properties in terms of their conducting-stability. It should be highlighted that all obtained conductivity results support the morphological observation, including the crystallinity and thermal behaviour findings on thin films.
| Thin films | Electrical conductivity (S cm−1) |
|---|---|
| Bare PVA | 1.63 × 10⁻¹² (ref. 33) |
| PEDOT:PSS/PVA | 4.37 × 10⁻⁶ ± 2.08 × 10⁻⁷ |
| 1% DMSO-PEDOT:PSS/PVA | 3.43 × 10⁻⁴ ± 1.13 × 10⁻⁵ |
| 3% DMSO-PEDOT:PSS/PVA | 8.50 × 10⁻⁶ ± 1.94 × 10⁻⁷ |
| 5% DMSO-PEDOT:PSS/PVA | 1.53 × 10⁻⁴ ± 5.20 × 10⁻⁵ |
| 7% DMSO-PEDOT:PSS/PVA | 2.27 × 10⁻⁴ ± 3.32 × 10⁻⁷ |
| 9% DMSO-PEDOT:PSS/PVA | 7.16 × 10⁻⁴ ± 7.05 × 10⁻⁵ |
| 12% DMSO-PEDOT:PSS/PVA | 1.20 × 10⁻³ ± 9.64 × 10⁻⁶ |
| 1% EG-PEDOT:PSS/PVA | 8.51 × 10⁻⁵ ± 1.12 × 10⁻⁵ |
| 3% EG-PEDOT:PSS/PVA | 1.71 × 10⁻⁴ ± 1.25 × 10⁻⁶ |
| 5% EG-PEDOT:PSS/PVA | 5.91 × 10⁻⁴ ± 7.27 × 10⁻⁶ |
| 7% EG-PEDOT:PSS/PVA | 3.13 × 10⁻³ ± 1.67 × 10⁻⁴ |
| 9% EG-PEDOT:PSS/PVA | 7.25 × 10⁻³ ± 5.25 × 10⁻⁴ |
| 12% EG-PEDOT:PSS/PVA | 9.42 × 10⁻³ ± 2.50 × 10⁻⁴ |
In addition to analyzing the behavior of molecules in a magnetic field, it should be noted that the purpose of the BDS analyzer is also to study the movement of electronic dipoles in the presence of an electric field. The frequency at which a particular dipole response is related to the “relaxation time” of that system. From our BDS results, the conductivity pattern of all fabricated films can be said to be stable at frequency of 1 Hz to 1 MHz. In addition to proving the conductivity stability of fabricated films, we did re-measure the average conductivity of films after they were left at room temperature for 2 weeks. From Table 3, it can be said that the electrical conductivity of all films is quite similar to their first conductivity reading and their magnitude value remained the same. This concludes that the electrical conductivity of fabricated films is stable at room temperature.
| Thin films | Electrical conductivity (S cm−1) |
|---|---|
| Bare PVA | 1.63 × 10⁻¹² (ref. 32) |
| PEDOT:PSS/PVA | 4.82 × 10⁻⁶ ± 3.47 × 10⁻⁷ |
| 1% DMSO-PEDOT:PSS/PVA | 2.87 × 10⁻⁴ ± 3.37 × 10⁻⁷ |
| 3% DMSO-PEDOT:PSS/PVA | 8.78 × 10⁻⁶ ± 4.12 × 10⁻⁷ |
| 5% DMSO-PEDOT:PSS/PVA | 1.60 × 10⁻⁴ ± 1.27 × 10⁻⁶ |
| 7% DMSO-PEDOT:PSS/PVA | 2.04 × 10⁻⁴ ± 1.40 × 10⁻⁶ |
| 9% DMSO-PEDOT:PSS/PVA | 7.77 × 10⁻⁴ ± 2.48 × 10⁻⁶ |
| 12% DMSO-PEDOT:PSS/PVA | 1.28 × 10⁻³ ± 1.72 × 10⁻⁶ |
| 1% EG-PEDOT:PSS/PVA | 8.52 × 10⁻⁵ ± 1.55 × 10⁻⁶ |
| 3% EG-PEDOT:PSS/PVA | 1.73 × 10⁻⁴ ± 1.44 × 10⁻⁶ |
| 5% EG-PEDOT:PSS/PVA | 5.26 × 10⁻⁴ ± 1.93 × 10⁻⁶ |
| 7% EG-PEDOT:PSS/PVA | 3.52 × 10⁻³ ± 1.79 × 10⁻⁶ |
| 9% EG-PEDOT:PSS/PVA | 6.94 × 10⁻³ ± 3.61 × 10⁻⁶ |
| 12% EG-PEDOT:PSS/PVA | 9.76 × 10⁻³ ± 1.17 × 10⁻⁵ |
3.4 Tensile properties of doped-PEDOT:PSS/PVA thin films
Tensile testing was conducted to evaluate the mechanical properties of selected thin films by adding different vol% of dopants (3, 7 and 12 vol% to see their stretchability trend). The stretching direction is parallel to the longitude side of the thin films. From the results obtained (Fig. 8b), all thin films with DMSO dopants have very low strain at break (%) and behave less stretchable compared to the bare PVA. The stress-strain pattern shows a decrement in tensile properties as the vol% of DMSO dopants increases. For example, at a stress below 10 MPa, the DMSO doped-thin film starts losing its stretchability. The 12% PEDOT:PSS/PVA thin films show the lowest stress-withstanding value (≈7 MPa), and break when the strain nearly achieves 1.5%. According to a previous study, the addition of DMSO enhanced inter-PEDOT connection, resulting in high cohesion energy. This will cause thin films to become brittle leading to fracture behaviour under tensile loading.42 Fig. 9a illustrates the DMSO dopant effects on PEDOT:PSS structure through bonding interaction, crystallinity, thermal stability, surface roughness, conductivity and stretchability. When related to the AFM and electrical conductivity results, the addition of DMSO into PEDOT:PSS/PVA increase the surface roughness of the thin films and cause the film to be more brittle. This finding supports the previous study reported by Dhar et al. in 2018.43 The increasing surface roughness with the addition of DMSO as PEDOT:PSS's dopant is due to the removal of insulating PSS layers which creates PEDOT rich grains that facilitates the conductivity of charge along the π-conjugated polymer chain of PEDOT.43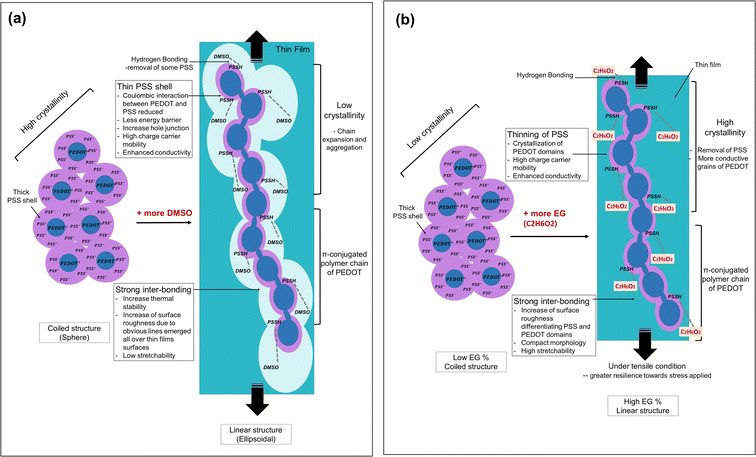 | ||
| Fig. 9 (a) The illustration on DMSO dopants effects on PEDOT:PSS structure through analysed bonding interaction, crystallinity, thermal stability, surface roughness, conductivity and stretchability. Illustration inspired from ref. 29, 32 and 43. (b) The illustration on EG dopants effects on PEDOT:PSS structure through analysed films' bonding interaction, crystallinity, thermal stability, surface roughness, conductivity and stretchability. Illustration inspired from ref. 27, 33, 35, 45 and 46. | ||
Meanwhile, for the case of EG dopant, all prepared PEDOT:PSS/PVA thin films showed greater resilience towards stress applied compared to bare PVA. 3 vol% EG-PEDOT:PSS/PVA thin film is very low in stretchability but can bear the stress up to 35 MPa and elongation at a break of <0.5%. The thin films become more stretchable as the EG vol% addition increases. Among all the tested thin films, PEDOT:PSS/PVA thin films with the addition of 12 vol% EG showed greater stretchability (with elongation at break of 2.5% strain). When related to the obtained XRD results, the addition of a high amount (12 vol%) of EG slightly increases the films' crystallinity. However, the 12% EG-PEDOT:PSS/PVA recorded a great tensile strength among all films. The improved crystallinity properties of thin films have often been related to the strong inter-packing of molecular arrangement which resembles the brittle properties of films. In this case, the crystallinity enhancement in EG-PEDOT:PSS/PVA thin films can also be attributed to the great inter-bonding formed between EG and PEDOT:PSS, causing the film to have better stretchability performance. The improved inter-bonding between EG, PEDOT:PSS and PVA might be due to the good miscibility of those soft polymers.44 From the obtained conductivity results, the presence of EG is proven to effectively increase the electrical conductivity properties of thin films.45 In another note, the addition of EG removes some insulating PSS and causes conformational changes of PEDOT:PSS from coiled to linear structure.46 During the tensile testing condition, this linear arrangement of PEDOT:PSS probably supports and withholds the film from tensile break resulting in higher stretchability performance. Fig. 9b demonstrates the EG dopant effects on PEDOT:PSS structure through bonding interaction, crystallinity, thermal stability, surface roughness, conductivity and stretchability.
3.5 Strain sensor application of doped-PEDOT:PSS/PVA thin films
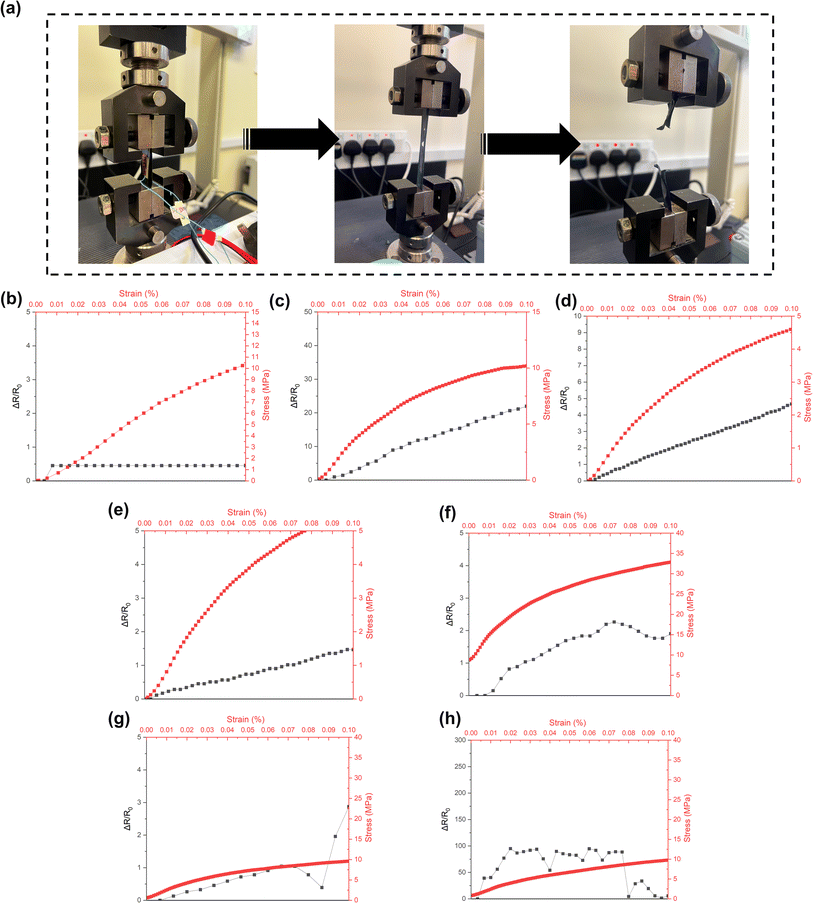
After investigating the conductivity and stretchability performance, selected doped-PEDOT:PSS/PVA thin films are applied as strain sensors. To prepare the sensors, thin film was coated with conductive silver paste and connected to a copper wire circuit using copper tape. All obtained results were recorded by using the Hantek system and software. For the purpose of exploiting stretchable sensors, keeping the electrical properties under strain operation is one of the most important issues. The setup of this experiment is shown in Fig. 10a. In the beginning of when tensile force was applied, copper wire was perfectly connected. However, when the sensor's elongation starts to reach 0.3% strain, the electrical circuit loses its connection due to the cracking of long polymer chain. The mechanism entails the movement of strain during stretching from the substrate to the conductive layer, which causes cracks and subsequently raises electrical resistance. As a result, the resistance-strain behaviour of the conductive film is substantially determined by the strain distribution of polymer substrates, which in turn dictates sensitivity.47 Most of the tested thin films were having tensile breaks at strain of >0.5%. The relative resistance (ΔR/R0) change of doped-PEDOT:PSS/PVA polymer blends thin films under 1 kN tensile force was plotted as in Fig. 10b–h.In this experiment, the relative resistance difference was calculated in percentage by considering the initial and final readings of resistivity. ΔR was denoted as resistivity changes while R0 was denoted as initial resistance. Bare PVA sensors show no change in resistance at all up to 0.1% of strain. For DMSO-based sensors, it can be said that thin films with 3 and 9 vol% DMSO addition shows high sensitivity over the stress-strain changes. For EG-based sensors, the obtained resistivity changes are not stable. However, with the addition of 12% EG, PEDOT:PSS/PVA sensors showing highest sensitivity with relative resistance value of ≈100 under 0.02% < strain < 0.07%. It can be said that the 12% EG-PEDOT:PSS/PVA sensors have very low detection limits in the small strain range. When compared to one previous study on PEDOT:PSS/PVA strain sensor, our sensors have better sensitivity since they only secured a relative resistance value of 20 at 50% strain.48 It should be noted that there is a fluctuation pattern of relative resistance for 9% EG- and 12% EG-doped PEDOT:PSS/PVA films. This might be due to the high sensitivity of the samples to detect any slight changes of strain during the stretching of strain sensors. According to the literature, the slight fluctuation in resistance with strain is also an attribute that is highly advantageous in resistive-type pressure sensors, in which the electrical signal change should reflect the pressure response but not the tensile strain.49 The slight fluctuation in resistance with strain is also an attribute that is highly advantageous in resistive-type pressure sensors, in which the electrical signal change should reflect the pressure response but not the tensile strain. In addition, the fluctuation pattern is usually detected by strain sensors due to properties changes of samples either of their dimensions, crystallinity or conductivity changes. Previous studies reported that vibrations and fluctuations often occur for the case of strain sensors applied for chewing several times and micro-strains of the human body such as respiratory-breathing rate detection.50,51
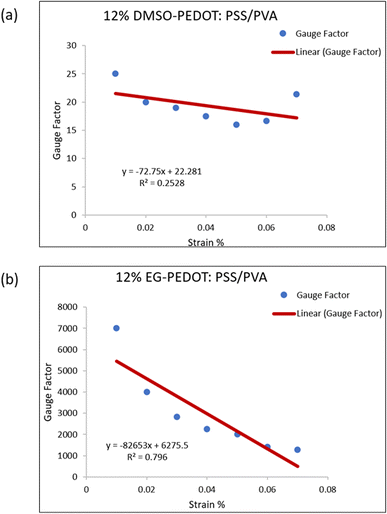
The gauge factor (GF) value of sensors was also calculated and tabulated in Table 4. The sensitivity of strain sensors can be calculated as gauge factor (GF), representing the ratio of relative change in electrical resistance to their mechanical strain. A resistive strain gauge as sensor, is often used because resistance is easier to be measured with a simple processing circuit and is less susceptible to vibration.52 From the data, it can be said that 12% EG-PEDOT:PSS/PVA sensors acquire the highest GF value, 2000. We compared our work with some previous experimental work on polymeric sensors and found that our sensors quantitatively gave better GF value (Table 5).
| Thin film sensors | Gauge factor (GF) |
|---|---|
| Bare PVA | 10 |
| 3% DMSO-PEDOT:PSS/PVA | 300 |
| 9% DMSO-PEDOT:PSS/PVA | 60 |
| 12% DMSO-PEDOT:PSS/PVA | 10 |
| 3% EG-PEDOT:PSS/PVA | 40 |
| 9% EG-PEDOT:PSS/PVA | 20 |
| 12% EG-PEDOT:PSS/PVA | 2000 |
| Materials used | Strain exerted | Gauge factor (k) | Potential application | Ref. |
|---|---|---|---|---|
| SnS2–PDMS | 1.25% | 3933 | Body movements detector | 53 |
| Mxene/polypyrrole/PVDF | 34–44% | 352.86 | Health care diagnostic and physical management | 54 |
| Graphene/PVDF/PU | 5–8% | 87 | Commercial bandage as wearable sensors | 55 |
| TER/PEDOT:PSS (40/60) | n/a | 680.86 | Stable piezoresistive sensors | 56 |
| MWCNT/PDMS | 5% | 513.2 | Structural health monitoring or wearable electronic devices | 57 |
| PVA/PEDOT:PSS | 100% | 4.4 | Flexible electronic skin | 58 |
| PAANa/PEDOT:PSS/PVA | 200% | 0.57 | Flexible wearable electronics | 59 |
| PEDOT:PSS/PVA/glycerin | 130% | 5.4 | Humans' complex movements sensors | 60 |
| TPU/PEDOT:PSS | 0–40% | 20 | Flexible strain sensor | 61 |
| PEDOT:PSS/0.75% EG | 37.5% | 0.16 | Stretchable strain sensor by the use of a wearable polymer dies coating and a slitting apparatus | 62 |
| CNCs/PEDOT:PSS | 0–50% | 25 | Electronic skins, artificial intelligence and health/structure monitoring | 63 |
| HCPN/PDMS-SS doped by 0.1 M H2SO4 | 0–70% | 32 | General strain sensors | 64 |
| PEDOT:PSS in PDMS microchannel | 10% | 12![[thin space (1/6-em)]](https://www.rsc.org/images/entities/char_2009.gif) 000 000 |
Stretchable strain sensor | 65 |
| oCVD–PEDOT:PSS/H2SO4 | ≈0.35% | 11.4 | Piezoresistive sensor | 66 |
| Ag NWs–PEDOT:PSS | 0–100% | 10.2 | Transparent and stretchable strain sensors | 67 |
| PVA/PEDOT:PSS | 100% | 4.4 | Wearable electronics and healthcare devices | 68 |
| MWCNT–PEDOT:PSS nanocomposite | 6% | 22.8 | Piezoresistive strain sensing | 69 |
| Gr–PEDOT:PSS/MnO2 nanowires/Ecoflex composite | 0–320% | 0.8 | Stretchable sensor | 70 |
| EG-doped PEDOT:PSS/PVA | 0.05% | 2000 | Conductive strain sensor | This work |
As from the four-point probe results, 3% DMSO-, 9% DMSO- and 12% EG-PEDOT:PSS/PVA have conductivity value of 8.80 × 10⁻⁶, 7.16 × 10⁻⁴ and 9.42 × 10⁻³ S cm−1, respectively. Among all prepared thin films, the 12% EG-PEDOT:PSS/PVA films have greater conductivity and tensile properties to be applied as strain sensors. Apparently, the 12% addition of EG dopants is the best-prepared thin film among other films. In another note, considering the sensor's fabrication method, we must further analyse the physical attachment occurring between the surface of thin films and silver paste that might affect the relative resistance changes reading.71 Fig. 11 shows the linear regression plots of 2 selected samples; 12% DMSO- and 12% EG-PEDOT:PSS/PVA sensors. Initially, the sensor can respond well to tensile strain. The negative slope from the graph indicates the reduction of gauge factor as the exerted strain increases. This commonly occurred phenomenon for strain sensor is due to the polymer chain disruption within the sensor materials that disturb the electron transfer along PEDOT backbone.72 The strain also results in the loss of conductive path which causes difficult electron pass, and a crack generation led to electrical breakdown at higher strain.73 We did run a simple resistivity measurement on 12% EG-PEDOT:PSS/PVA thin films by using finger-touching, to see its potential to be applied as pressure sensors. The setup is shown in Fig. S4† where a multimeter is used to check the sensors' resistivity changes. When pressure is applied between both film surfaces, the resistivity changes (decreases) in values. The measurement was repeated three times proving that the prepared thin film can potentially be applied as a pressure sensor. This work will be carried out in the near future. Fig. S5† shows some images of fabricated films applied as strain sensors. The ability of films to be bend promising a variety of potential applications.
4. Conclusions
In this study, the crystallinity and other physical properties that lead to the conductivity performance of PEDOT:PSS/PVA thin films were investigated. Secondarily doping effects of DMSO and EG were comparatively studied. The 12% EG-PEDOT:PSS/PVA films recorded the highest sensitivity value of ≈100 under 0.02% < strain < 0.07% as strain sensors compared to other previous studies on PEDOT:PSS/PVA films. It also acquires a huge GF value; 2000. All obtained data from XRD, TGA and AFM analyses support the findings on the conductivity performance of thin films where the conductivity is highly dependent on their crystallinity, phase segregation and bonding strength. By comparing both DMSO and EG as dopants, it can be concluded that EG dopants contribute towards better properties of thin films. EG PEDOT:PSS thin films also demonstrates great tensile strength due to the improved inter-bonding and good miscibility which supports and withholds the film from tensile break resulting in higher stretchability performance. This study suggested a new doping interaction aspect of crystallinity properties to enhance the sensitivity performance of PEDOT:PSS for device applications.Author contributions
Conceptualization, K. K. S., M. M. M. and D. A. A. R.; methodology, D. A. A. R., K. K. S., M. R. M., S. A. G., S. Y. and M. G.; formal analysis, D. A. A. R., M. R. M., K. K. S. and M. M. M.; writing—original draft preparation D. A. A. R. and M. R. M. writing—review and editing, D. A. A. R., M. R. M., S. Y., S. A. G., M. G., N. C. R., J. J. C., K. K. S. and M. M. M.; visualization, D. A. A. R.; supervision, K. K. S., J. J. C. and M. M. M.; funding, J. J. C. All authors have read and agreed to the published version of the manuscript.Conflicts of interest
The authors declare no conflict of interest.Acknowledgements
This work was supported by Qatar National Research Fund under grant no. NPRP12S-0131-190030. The statements made herein are solely the responsibility of the authors.References
- Y. Wang, W. Zhu, Y. Deng, B. Fu, P. Zhu, Y. Yu, J. Li and J. Guo, Nano Energy, 2020, 73, 104773 CrossRef CAS.
- D. Zhao, Y. Zhu, W. Cheng, W. Chen, Y. Wu and H. Yu, Adv. Mater., 2021, 33(28), 2000619 CrossRef CAS PubMed.
- M. Ha, S. Lim and H. Ko, J. Mater. Chem. B, 2018, 6(24), 4043–4064 RSC.
- J. Zhu, X. Wu, J. Jan, S. Du, J. Evans and A. C. Arias, ACS Appl. Mater. Interfaces, 2021, 13(32), 38105–38113 CrossRef CAS PubMed.
- H. Liu, Q. Li, S. Zhang, R. Yin, X. Liu, Y. He and Z. Guo, J. Mater. Chem. C, 2018, 6(45), 12121–12141 RSC.
- Z. Ma, W. Shi, K. Yan, L. Pan and G. Yu, Chem. Sci., 2019, 10(25), 6232–6244 RSC.
- Y. Wang, A. Liu, Y. Han and T. Li, Polym. Int., 2020, 69(1), 7–17 CrossRef CAS.
- Y. Wang, Y. Ding, X. Guo and G. Yu, Nano Res., 2019, 12(9), 1978–1987 CrossRef CAS.
- S. Meer, A. Kausar and T. Iqbal, Polym.-Plast. Technol. Eng., 2016, 55(13), 1416–1440 CrossRef CAS.
- M. Shanmugam, A. Augustin, S. Mohan, B. Honnappa, C. Chuaicham, S. Rajendran and K. Sekar, Fuel, 2022, 325, 124899 CrossRef CAS.
- K. Xie, Q. Fu, G. G. Qiao and P. A. Webley, J. Membr. Sci., 2019, 572, 38–60 CrossRef CAS.
- D. A. A. Ruzaidi, F. A. Suhaimi, M. A. Saripudin, R. Ramli, H. Osman, N. I. M. Nadzri and M. M. Mahat, J. Phys.: Conf. Ser., 2022, 2169(1), 012004 CrossRef.
- D. Ding, L. Lanzetta, X. Liang, G. Min, M. Giza, T. J. Macdonald and S. A. Haque, Chem. Commun., 2021, 57(41), 5047–5050 RSC.
- A. Demir, S. Allı, A. Allı and A. Kösemen, J. Mater. Sci.: Mater. Electron., 2019, 30(12), 11034–11042 CrossRef CAS.
- K. K. Liu, Q. Jiang, C. Kacica, H. G. Derami, P. Biswas and S. Singamaneni, RSC Adv., 2018, 8(55), 31296–31302 RSC.
- M. Lerond, F. Cicoira and W. G. Skene, J. Mater. Chem. C, 2022, 10(32), 11739–11746 RSC.
- Y. T. Tseng, Y. C. Lin, C. C. Shih, H. C. Hsieh, W. Y. Lee, Y. C. Chiu and W. C. Chen, J. Mater. Chem. C, 2020, 8(18), 6013–6024 RSC.
- Z. Ahmad, A. W. Azman, Y. F. Buys and N. Sarifuddin, Mater. Adv., 2021, 2(22), 7118–7138 RSC.
- X. Li, Z. Liu, Z. Zhou, H. Gao, G. Liang, D. Rauber and P. Zhang, ACS Appl. Polym. Mater., 2020, 3(1), 98–103 CrossRef.
- A. Kumar Anbalagan, S. Gupta, M. Chaudhary, R. R. Kumar, Y. L. Chueh, N. H. Tai and C. H. Lee, RSC Adv., 2021, 11(34), 20752–20759 RSC.
- H. Cho, W. Cho, Y. Kim, J. G. Lee and J. H. Kim, RSC Adv., 2018, 8(51), 29044–29050 RSC.
- J. G. Lee, W. Cho, Y. Kim, H. Cho, H. Lee and J. H. Kim, RSC Adv., 2019, 9(8), 4428–4434 RSC.
- D. A. Ahmad Ruzaidi, M. M. Mahat, Z. Mohamed Sofian, N. A. Nor Hashim, H. Osman, M. A. Nawawi and H. H. Hamzah, Polymers, 2021, 13(17), 2901 CrossRef CAS PubMed.
- S. B. Aziz, R. T. Abdulwahid, M. A. Rasheed, O. G. Abdullah and H. M. Ahmed, Polymers, 2017, 9(10), 486 CrossRef PubMed.
- H. Pingan, J. Mengjun, Z. Yanyan and H. Ling, RSC Adv., 2017, 7(5), 2450–2459 RSC.
- N. Terasawa and K. Asaka, RSC Adv., 2018, 8(32), 17732–17738 RSC.
- E. Yildirim, G. Wu, X. Yong, T. L. Tan, Q. Zhu, J. Xu and S. W. Yang, J. Mater. Chem. C, 2018, 6(19), 5122–5131 RSC.
- M. N. Gueye, A. Carella, J. Faure-Vincent, R. Demadrille and J. P. Simonato, Prog. Mater. Sci., 2020, 108, 100616 CrossRef CAS.
- I. Lee, G. W. Kim, M. Yang and T. S. Kim, ACS Appl. Mater. Interfaces, 2016, 8(1), 302–310 CrossRef CAS PubMed.
- C. Deetuam, D. Weise, C. Samthong, P. Praserthdam, R. R. Baumann and A. Somwangthanaroj, J. Appl. Polym. Sci., 2015, 132(24), 42108 CrossRef.
- I. Lee, G. W. Kim, M. Yang and T. S. Kim, ACS Appl. Mater. Interfaces, 2016, 8(1), 302–310 CrossRef CAS PubMed.
- S. Mahato, J. Puigdollers, C. Voz, M. Mukhopadhyay, M. Mukherjee and S. Hazra, Appl. Surf. Sci., 2020, 499, 143967 CrossRef CAS.
- A. Pasha, S. Khasim, O. A. Al-Hartomy, M. Lakshmi and K. G. Manjunatha, RSC Adv., 2018, 8(32), 18074–18083 RSC.
- S. Xu, X. L. Shi, M. Dargusch, C. Di, J. Zou and Z. G. Chen, Prog. Mater. Sci., 2021, 121, 100840 CrossRef CAS.
- Y. J. Lin, W. S. Ni and J. Y. Lee, J. Appl. Phys., 2015, 117(21), 215501 CrossRef.
- M. Fabretto, C. Hall, T. Vaithianathan, P. C. Innis, J. Mazurkiewicz, G. G. Wallace and P. Murphy, Thin Solid Films, 2008, 516(21), 7828–7835 CrossRef CAS.
- C. Subramanian, M. Giotto, R. A. Weiss and M. T. Shaw, Macromolecules, 2012, 45(7), 3104–3111 CrossRef CAS.
- L. Ouyang, C. Musumeci, M. J. Jafari, T. Ederth and O. Inganas, ACS Appl. Mater. Interfaces, 2015, 7(35), 19764–19773 CrossRef CAS PubMed.
- S. Ningaraju and H. B. Ravikumar, J. Polym. Res., 2017, 24(1), 1–11 CrossRef.
- A. Pasha, A. S. Roy, M. V. Murugendrappa, O. A. Al-Hartomy and S. Khasim, J. Mater. Sci.: Mater. Electron., 2016, 27(8), 8332–8339 CrossRef CAS.
- M. T. Sebastian, M. A. S. Silva, A. S. B. Sombra, H. Jantunen and R. Ubic, in Microwave Materials and Applications 2V Set, Wiley, 2017, p. 1e51 Search PubMed.
- I. Lee, G. W. Kim, M. Yang and T. S. Kim, ACS Appl. Mater. Interfaces, 2016, 8(1), 302–310 CrossRef CAS PubMed.
- S. Dhar, T. Majumder, P. Chakraborty and S. P. Mondal, Org. Electron., 2018, 53, 101–110 CrossRef CAS.
- X. Fan, W. Nie, H. Tsai, N. Wang, H. Huang, Y. Cheng and Y. Xia, Adv. Sci., 2019, 6(19), 1900813 CrossRef CAS PubMed.
- S. K. Kim, J. H. Mo, J. Y. Kim and K. S. Jang, e-Polym., 2017, 17(6), 501–506 CAS.
- I. Paulraj, T. F. Liang, T. S. Yang, C. H. Wang, J. L. Chen, Y. W. Wang and C. J. Liu, ACS Appl. Energy Mater., 2020, 3(12), 12447–12459 CrossRef CAS.
- S. Pan, Z. Liu, M. Wang, Y. Jiang, Y. Luo, C. Wan and X. Chen, Adv. Mater., 2019, 31(35), 1903130 CrossRef PubMed.
- J. Y. Gong, F. C. Sun, Y. C. Pan, A. M. Fei, S. F. Leicheng, F. P. Du and Y. F. Zhang, Mater. Today Commun., 2022, 33, 104324 CrossRef CAS.
- C. L. Choong, M. B. Shim, B. S. Lee, S. Jeon, D. S. Ko, T. H. Kang and U. I. Chung, Adv. Mater., 2014, 26(21), 3451–3458 CrossRef CAS PubMed.
- Z. Liu, Y. Zheng, L. Jin, K. Chen, H. Zhai, Q. Huang and Z. Zheng, Adv. Funct. Mater., 2021, 31(14), 2007622 CrossRef CAS.
- S. Liu, R. Zheng, S. Chen, Y. Wu, H. Liu, P. Wang and L. Liu, J. Mater. Chem. C, 2018, 6(15), 4183–4190 RSC.
- Q. Li, S. Luo, Y. Wang and Q. M. Wang, Sens. Actuators, A, 2019, 300, 111664 CrossRef CAS.
- P. Tan, H. Wang, F. Xiao, X. Lu, W. Shang, X. Deng and X. Zhou, Nat. Commun., 2022, 13(1), 1–12 CrossRef.
- W. Yan, H. R. Fuh, Y. Lv, K. Q. hen, T. Y. Tsai, Y. R. Wu and H. C. Wu, Nat. Commun., 2021, 12(1), 1–9 CrossRef PubMed.
- W. X. R. Leong, A. M. Al-Dhahebi, M. R. Ahmad and M. S. M. Saheed, Micromachines, 2022, 13(8), 1302 CrossRef PubMed.
- T. Huang, P. He, R. Wang, S. Yang, J. Sun, X. Xie and G. Ding, Adv. Funct. Mater., 2019, 29(45), 1903732 CrossRef CAS.
- V. Panwar and G. Anoop, Measurement, 2021, 168, 108406 CrossRef.
- K. Huang, H. Ning, N. Hu, F. Liu, X. Wu, S. Wang and L. Wu, Compos. Sci. Technol., 2020, 192, 108105 CrossRef CAS.
- Y. F. Zhang, M. M. Guo, Y. Zhang, C. Y. Tang, C. Jiang, Y. Dong and F. P. Du, Polym. Test., 2020, 81, 106213 CrossRef CAS.
- J. Y. Gong, F. C. Sun, Y. C. Pan, A. M. Fei, S. F. Leicheng, F. P. Du and Y. F. Zhang, Mater. Today Commun., 2022, 33, 104324 CrossRef CAS.
- W. Shi, Z. Wang, H. Song, Y. Chang, W. Hou, Y. Li and G. Han, ACS Appl. Mater. Interfaces, 2022, 14(30), 35114–35125 CrossRef CAS PubMed.
- A. Shaker, A. H. Hassanin, N. M. Shaalan, M. A. Hassan and A. Abd El-Moneim, Smart Mater. Struct., 2019, 28(7), 075029 CrossRef CAS.
- S. Takamatsu, K. Minami and T. Itoh, Sens. Mater., 2021, 33, 1091 CAS.
- S. Xu, Z. Fan, S. Yang, Y. Zhao and L. Pan, Chem. Eng. J., 2021, 404, 126064 CrossRef CAS.
- H. Wu, H. Chen, P. Yao and R. Wang, Nano Sel., 2021, 2(4), 802–809 CrossRef.
- M. Bhattacharjee, M. Soni, P. Escobedo and R. Dahiya, Adv. Electron. Mater., 2020, 6(8), 2000445 CrossRef CAS.
- F. Muralter, A. M. Coclite and K. K. Lau, Adv. Electron. Mater., 2021, 7(2), 2000871 CrossRef CAS.
- G. Shen, B. Chen, T. Liang, Z. Liu, S. Zhao, J. Liu and X. He, Adv. Electron. Mater., 2020, 6(8), 1901360 CrossRef CAS.
- Y. F. Zhang, M. M. Guo, Y. Zhang, C. Y. Tang, C. Jiang, Y. Dong and F. P. Du, Polym. Test., 2020, 81, 106213 CrossRef CAS.
- R. Hegde, K. Ramji, S. Peravali, Y. Shiralgi, G. Hegde and L. Bathini, Adv. Polym. Technol., 2019, 1–9 CrossRef CAS.
- M. A. U. Khalid and S. H. Chang, Compos. Struct., 2023, 116824 CrossRef.
- L. W. Lo, J. Zhao, H. Wan, Y. Wang, S. Chakrabartty and C. Wang, ACS Appl. Mater. Interfaces, 2022, 14(7), 9570–9578 CrossRef CAS PubMed.
- K. Thana, N. Petchsang and R. Jaisutti, IOP Conf. Ser.: Mater. Sci. Eng., 2020, 773(1), 012049 CAS.
Footnote |
| † Electronic supplementary information (ESI) available. See DOI: https://doi.org/10.1039/d3ra00584d |
| This journal is © The Royal Society of Chemistry 2023 |

