DOI:
10.1039/D3RA00512G
(Paper)
RSC Adv., 2023,
13, 9603-9614
Electrochemical biosensor based on cellulose nanofibers/graphene oxide and acetylcholinesterase for the detection of chlorpyrifos pesticide in water and fruit juice†
Received
24th January 2023
, Accepted 2nd March 2023
First published on 24th March 2023
Abstract
In this work, cellulose nanofibers and graphene oxide are used to fabricate a simple and reliable electrochemical biosensor, based on acetylcholinesterase (AChE) for the detection of highly dangerous organophosphates (OPs), utilizing chlorpyrifos as a representative sample. AChE is an enzyme that is essential for neurotransmission and catalyzes the conversion of acetylcholine (ATCh) into thiocholine and acetic acid. The pesticide used in this work, chlorpyrifos, inhibits the catalytic activity of AChE on ATCh, and this inhibition can be measured using square wave voltammetry (SWV). Utilizing a process of surface modification, layers of cellulose nanofibers, graphene oxide, a chitosan-graphene oxide composite, and acetylcholinesterase (AChE/CS-GO/GO/CNFs) were immobilized on a screen-printed carbon electrode (SPCE). The modified SPCE working electrode was characterized using scanning electron microscopy and graphene oxide trapped in the cellulose nanofibers was found to increase the sensitivity of the biosensor. The modified biosensor demonstrated good performance for detection of chlorpyrifos over a linear range of 25–1000 nM under optimum conditions, and the limits of detection and quantification were 2.2 nM and 73 nM, respectively. Our sophisticated technique might offer a more precise, straightforward, quick, and environmentally friendly way to assess chlorpyrifos contamination in water and juice samples.
1. Introduction
To protect crops from insects and pests, organophosphates (OPs), esters of phosphoric acid derivatives, are frequently employed today in agriculture, primarily in developing nations. Due to their effectiveness at killing and controlling insects and other pests, OPs are employed in 30% of global pesticide sales.1–4 OPs have the advantages of being simple to synthesize, highly soluble in water and easy to biodegrade, as well as effectively killing pests, and thus OPs are increasingly the first option for farmers and agricultural workers.5 On the other hand, overuse of OPs damages the environment, because of their relatively harmful effects, and leaves residues and contaminants in water, vegetables and fruits.6,7
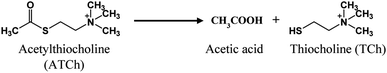
Chlorpyrifos (O,O-diethyl O-3,5,6-trichloro-2-pyridyl phosphorothioate) is an organophosphorus pesticide, one of several types of pesticides, that is mostly used in residential applications, such as building maintenance, agriculture, plant and animal production to eliminate pests including insects and worms. It is typically used on crops including almonds, maize, cotton, peaches, and fruit trees, like apple, orange and banana trees, mostly in agricultural countries.8,9 The widespread, abundant and long-term use of chlorpyrifos causes health problems and neurological illnesses, by blocking the activity of the acetylcholinesterase enzyme, in humans and other living creatures, especially in those with pre-existing medical conditions, infants, children and pregnant women.10,11 Humans who are exposed to chlorpyrifos may experience acute poisoning, which manifests as nausea, vomiting, increased perspiration, muscle spasms, unconsciousness, convulsions and even death.12–14 Acetylcholinesterase (AChE) is an essential enzyme involved in the transmission of brain impulses. AChE can also speed up the breakdown of the central neurotransmitter acetylcholine (ATCh) into acetic acid and choline.15 Pesticides like chlorpyrifos can impair the vital AChE activity that causes the disorders and diseases mentioned above. Because of its impact on humans and the environmental harm it causes, the use of chlorpyrifos needs to be restricted.
To identify pesticide contamination in the environment, a number of techniques have been developed, including immunoassays such as ELISA (enzyme-linked immunosorbent assay),16 FIA (fluorescence immunoassay),17 chromatographic assays like high-performance liquid chromatography (HPLC),18 gas chromatography (GC),19 gas chromatography-mass spectrophotometry (GC-MS),20 colorimetric and fluorometric biosensors,21,22 dual-signal sensors with both colorimetric and fluorometric techniques23,24 and electrochemical biosensors.25–27 In recent years, biosensors containing AChE as a bio-recognition element,28 and a signal transducer29 based on an enzyme inhibition method have become rapid, highly sensitive and specific, time-saving, cost-effective and reliable methods for the detection of OP compounds. In this work, chlorpyrifos was detected based on its inhibition of the catalytic activity of AChE on ATCh, where AChE catalyzes the conversion of ATCh into thiocholine (TCh), as measured using a modified electrochemical biosensor.
Given that the use of nanomaterials in the biosensor fabrication process improves the conductivity, sensitivity, stability and biosensor performance, whilst compensating for the poor conductive activity of AChE, electrochemical biosensors with nanomaterial applications have become increasingly popular.4,26 AChE immobilization and signal amplification are perpetual issues that necessitate taking the biocompatibility and conductivity of an AChE biosensor into account. In order to improve the performance of biosensors for the detection of OPs, nanomaterials and nano-composites, such as 3D graphene,30 multi-walled carbon nanotubes (MWCNTs),31 NiO nanoparticles,32 CuO nanowires,33 gold–platinum (Au–Pt) bimetallic nanoparticles34 and CdS quantum dots,35 have been frequently used.
“Nanocellulose” refers to tiny fibers with nanoscale dimensions that are produced from cellulose using a variety of processes, the most popular of which is alkali or acid hydrolysis.36 Nanocellulose has emerged as a valuable green material for a wide range of applications, from reinforcement materials to sensing platforms that are particularly important for the food, pharmaceutical and environmental protection industries.37 Additionally, biomass-derived renewable nanocellulose has a low density, an anisotropic structure, good optical properties, superior mechanical properties, and is chemically resistant.38,39 Cellulose nanomaterials have attracted interest for their applications in everything from paper, textile, packaging, sensors, water purification, drug delivery and biomedical devices, due to their advantageous qualities like low density, high surface area, and good mechanical strength with excellent biocompatibility and renewability.40–42 Due to the extremely large surface area of cellulosic nanofibers, their adhesion properties are the major element that must be managed for their use in nanocomposite applications.43 Therefore, we opted to use cellulosic nanofibers as a foundation material in our electrode fabrication system, along with graphene oxide and an electrode modification approach in this work that uses cellulose nanofibers made by ultrasonication from the biomass “sugarcane bagasse”.44,45 We have discovered, via electrochemical analysis, that the conductivity of graphene oxide is also enhanced and promoted by the cellulose nanofibers synthesized from sugarcane bagasse. The sensing platform of our biosensors was a screen-printed carbon electrode (SPCE) modified using cellulose nanofibers (CNFs), graphene oxide (GO), graphene oxide-chitosan (CS-GO) and acetylcholinesterase (AChE) (AChE/CS-GO/GO/CNFs) composites. We then tested the biosensor as a chlorpyrifos biosensor (Scheme 1). The AChE/CS-GO/GO/CNFs layers demonstrated excellent surface conductivity due to the presence of the GO, which has a large surface area, high electrical conductivity, a high electron transfer rate, and the ability to immobilize various molecules.46 AChE was loaded deeply into the layers with the aid of a chitosan adhesive agent,47 enhancing the sensitivity and stability of the modified electrode. Then, in order to confirm the sensitivity and viability of our biosensor for the detection of chlorpyrifos and other metal ions in actual applications, we tested it on commercial drinking water and juice samples.
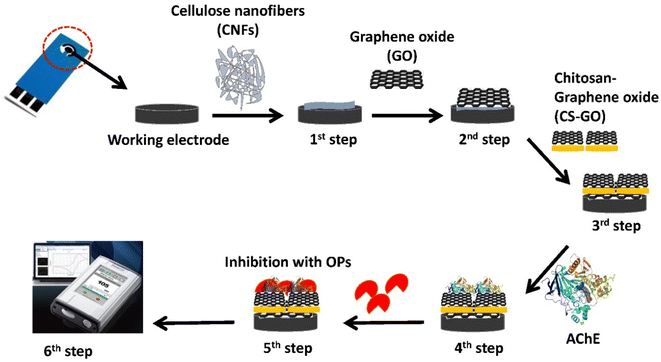 |
| | Scheme 1 Schematic diagram showing the process of modifying a screen-printed carbon electrode (SPCE). | |
2. Materials and methods
2.1 Materials
Acetylcholinesterase (AChE) from electric eels, acetylthiocholine chloride (ATCh), potassium ferricyanide (K3Fe(CN6), 99%) and chlorpyrifos were purchased from Sigma-Aldrich Co, Ltd, China. Hydrochloric acid (HCl, 37%), sodium chloride (NaCl, 99%), potassium chloride (KCl, <100%), acetone (CH3COOH3, ≥99.8%), and ethanol (C2H5OH, ≥99.7) were purchased from RCI Labscan, Thailand. Magnesium nitrate (Mg(NO3)2, ≥99.4%) and cobalt(II) nitrate hexahydrate (Co(NO3)2·6H2O, ≥98%) were purchased from Univar, Australia. Calcium chloride (CaCl2, ≥95%) was purchased from Scharlau, Spain. Mercury(II) chloride (HgCl2, ≥99.5%) was purchased from QRec™, New Zealand. Chitosan ((C6H11O4)n, 100![[thin space (1/6-em)]](https://www.rsc.org/images/entities/char_2009.gif) 000–300000) was purchased from ACROS, China. Phosphate buffer saline (PBS, 1× concentration, osmolarity 280–315 mOsm kg−1) was purchased from Cepham Life Science, USA. Hydrogen peroxide (H2O2, 30%, ISO grade) was purchased from Merck Millipore, USA. Deionized water (DI) with specific resistivity of 18.2 MΩ cm was obtained from a RiOs™ Type I Simplicity 185 Millipore water purification system. Alkaline hydrogen peroxide (AHP) solution was prepared by adding 1 N NaOH to a 3% H2O2 solution, adjusted to a pH of 11.5. Water and juices were bought from a convenience store in Khon Kaen, Thailand. Sugarcane bagasse was bought from a local market in Khon Kaen, Thailand.
000–300000) was purchased from ACROS, China. Phosphate buffer saline (PBS, 1× concentration, osmolarity 280–315 mOsm kg−1) was purchased from Cepham Life Science, USA. Hydrogen peroxide (H2O2, 30%, ISO grade) was purchased from Merck Millipore, USA. Deionized water (DI) with specific resistivity of 18.2 MΩ cm was obtained from a RiOs™ Type I Simplicity 185 Millipore water purification system. Alkaline hydrogen peroxide (AHP) solution was prepared by adding 1 N NaOH to a 3% H2O2 solution, adjusted to a pH of 11.5. Water and juices were bought from a convenience store in Khon Kaen, Thailand. Sugarcane bagasse was bought from a local market in Khon Kaen, Thailand.
2.2 Instrumentation and cell setup
The surface morphology of the synthesized cellulose nanofibers was characterized using focused ion beam scanning electron microscopy (FIB-SEM, FEI Helios NanoLab G3 CX, Czech Republic) and field emission scanning electron microscope (FE-SEM, TESCAN, Model: MIRA). Size distribution plot of cellulose nanofibers was done by using Image J and Origin programs. Characterization of each layer of the modified electrodes was performed using scanning electron microscopy (SEM) Brand LEO Model 1450V. The surface functional groups on the CNFs were determined using attenuated total reflection-Fourier transform infrared (ATR-FTIR) spectroscopy (Bruker TENSOR 27 scanning from 4000 to 600 cm−1). Square wave voltammetry (SWV) was performed using an electrochemical workstation (ECAS100, Zensor Co., Ltd, Taichung, Taiwan). The biosensors were fabricated on screen-printed carbon electrodes (SPCEs, Zensor Co., Ltd, Taichung, Taiwan) with a three-electrode system: a carbon electrode (d = 3.0 mm/active surface area = 0.071 cm2) was used as the working electrode, another carbon electrode was used as a counter electrode, and an Ag/AgCl electrode was used as a reference electrode. Solution pH was determined using a HI 5221 pH meter (Hanna Instruments, Thailand). A laboratory centrifuge (Rotina 380 R) was used for the purpose of precipitation of the c-AgNPs solution. The CNF extraction process was achieved using an ultrasound processor (Sonics and Materials Inc., Vibra Cell, VC-750, USA).
2.3 Synthesis of the cellulose nanofibers (CNFs) from sugarcane bagasse
Cellulose nanofibers were synthesized from sugarcane bagasse (SCB) via the alkaline hydrogen peroxide (AHP) hydrolysis method and extraction of the CNFs was achieved using ultrasonication.48,49 The raw bagasse from the sugarcane must first be washed and cleaned before being dried completely prior to synthesis of the cellulose nanofibers. Following that, raw bagasse was broken into pieces 2–5 cm in length and pulverized into a fine powder, sieved through a 250 μm diameter mesh, and then stored in a desiccator for further use. Secondly, the alkaline hydrogen peroxide (AHP) hydrolysis was performed to remove hemicellulose and lignin from the SCB. Then the dry powder was mixed constantly in an AHP solution at a temperature of 40 °C for four hours using a magnetic stirrer. The pH of the solution was periodically adjusted to 11.5 during the AHP hydrolysis. After pulping, 2 N H2SO4 was added to the mixture to bring the pH level to a neutral range. To get rid of all the soluble elements, the insoluble residue was collected using vacuum filtering and rinsed three times with deionized water. The residual white residue from the cellulose pulp was dried and given the name “cellulose”. Finally, low-frequency (20 kHz) ultrasound was used to ultrasonically irradiate the AHP-hydrolyzed cellulose (0.5% w/v) for 2 hours in a 1% H2O2 solution on an ice bath support to prevent overheating the samples. A 13 mm diameter cylindrical titanium alloy probe tip was installed in the processor. Other processor requirements included a 750 W output power, a 60% amplitude, and a 10 s on/5 s off cycle. To avoid the agglomeration of fragmented fibers, a few drops of 2 N H2SO4 were added to the suspension (pH 5.0) after the sonication treatments were complete. The suspension was then aggressively agitated using a vortex for two minutes. After ultrasonication, H2SO4 was added to avoid potential equipment corrosion. The obtained gel-like suspension was labelled “cellulose nanofiber” suspension and some amounts of the suspension were dried in order to perform characterization of the cellulose nanofibers.
2.4 Preparation of graphene oxide solution and chitosan-graphene oxide solution
2 mg of graphene oxide (GO) was dissolved in 5 mL of deionized water to obtain a GO concentration of 0.4 mg mL−1 and this GO solution was sonicated for 15 min 0.1 g of chitosan was dissolved in 10 mL of 1% glacial acetic acid to obtain a 1% chitosan solution. For the mixture of chitosan and graphene oxide, 500 μL of the GO solution was mixed with 2.5 mL of chitosan solution and the mixture was sonicated for 15 min in order to dissolve the GO in chitosan completely. The prepared solutions were stored in a refrigerator at 4 °C.
2.5 Preparation of acetylcholinesterase (AChE), acetylthiocholine (ATCh) and chlorpyrifos solutions
A solution of 0.3 mg mL−1 of AChE was prepared by weighing 0.0015 g of AChE, dissolving it in 1 mL of DI water and storing at 4 °C. Next, 1.0 M of ATCh solution was prepared by dissolving 0.1980 g of ATCh in 1 mL of DI water. This solution was kept as a stock solution for the preparation of solutions with various ATCh concentrations, which were stored at 4 °C. For the preparation of 1 mM stock solution of chlorpyrifos, 0.0035 g of chlorpyrifos was dissolved in 10 mL of acetone, and various concentrations of chlorpyrifos solutions were prepared from this stock solution. Chlorpyrifos is a colorless to white crystalline solid with an odor resembling mercaptan. It is only weakly soluble in water, but is soluble in the majority of organic solvents like acetone, dichloromethane, ethyl acetate and methanol.50 In addition, the preparation of all chlorpyrifos solutions was performed within a biosafety cabinet. All prepared solutions were stored at 4 °C for further experiments.
2.6 Preparation for the detection of chlorpyrifos in drinking water and juice samples
For the detection of chlorpyrifos in drinking water and juice samples, 100 μL of chlorpyrifos from a prepared 1 mM stock chlorpyrifos solution was spiked into 1 mL of drinking water and juice to obtain 1 μM chlorpyrifos-spiked drinking water and juice samples. From those spiked samples, 30 nM and 50 nM of chlorpyrifos solutions were prepared again and mixed with 1 mM ATCh and 2.5 mM ferri-ferrocyanide solutions. The modified SPCEs were incubated with the solutions for 15 min. Then, SWV analysis of the detection of the chlorpyrifos-incubated electrodes was performed.
2.7 Fabrication of the CNFs/GO/CS-GO/AChE-modified SPCE
First, 10 μL of the CNFs suspension was dropped on the surface of the working electrode of the SPCE and dried at room temperature for 1 h. Then, 10 μL of a GO solution was dropped on the SPCE as a second layer just before the layer of CNFs had dried entirely, and this second layer was allowed to dry at RT for 1 h. After drying the SPCE, 10 μL of the CS-GO solution was premixed with 10 μL of prepared AChE. 10 μL of the mixture of CS-GO/AChE was then immobilized on the surface of the CNFs/GO of the SPCE, dried and stored at 4 °C for 24 h. The immobilized enzymatic electrochemical biosensors were labelled as CNFs/GO/CS-GO/AChE-modified SPCE. Moreover, CNFs/SPCE, CNFs/GO/SPCE, and CNFs/GO/CS-GO/SPCE were prepared using a similar method for comparison. The diagram of the device and the fabrication process are shown in Scheme 1. Chlorpyrifos was spiked into commercial water and juice samples in order to assess the applicability of our modified electrode. For each concentration and the experiments for parameter screening, three electrodes were prepared and all experiments were repeated three times.
3. Results and discussion
3.1 Characterizations of the synthesized cellulose nanofibers (CNFs)
Cellulose nanofibers were synthesized from raw sugarcane bagasse by AHP hydrolysis followed by ultrasonication48 as described in Section 2.3. Following the synthesis, the surface morphology of the cellulose nanofibers was examined under a scanning electron microscope and compared to raw sugarcane bagasse and AHP-hydrolyzed cellulose, as depicted in Fig. 1a–c. Significant changes could be observed when comparing the raw sugarcane bagasse (Fig. 1a) and AHP-hydrolyzed cellulose (Fig. 1b). The intermolecular ester bonds between the lignin and carbohydrate were broken by the alkaline conditions during the hydrolysis of the raw bagasse in AHP solution.51 The rapid oxidation of lignin into low molecular weight and water-soluble oxidation products, which causes the dissolution of lignin, is caused by the extremely reactive OH radicals released during the degradation of H2O2.52 SEM images of the AHP-treated cellulose (Fig. 1b) indicated that most of the lignin and hemicellulose from the raw bagasse were successfully removed during AHP hydrolysis. After the cellulose was ultrasonicated for 2 hours in 1% H2O2 at a low frequency (20 kHz) in an ice bath, the mesh layers of the strongly entangled porous networks of the cellulose nanofibers could be observed, as shown in Fig. 1c. Compared to the cellulose sample, the fiber shapes of the ultrasonicated sample displayed notable changes due to the synergistic effects of the H2O2 and ultrasonication treatments.48,53 After the ultrasonication process, cellulose nanofibers were generated, which are made up of a bundle of stretched cellulose chain molecules with long, web-like and highly entangled nanofibers.Furthermore, the elongated and intertwined structure of CNFs could be seen as shown in Fig. S1a† and the average diameter of CNFs was calculated using the Image J program; resulting in an average size of 83.55 ± 1.32 nm (n = 106) as shown in Fig. S1b.†
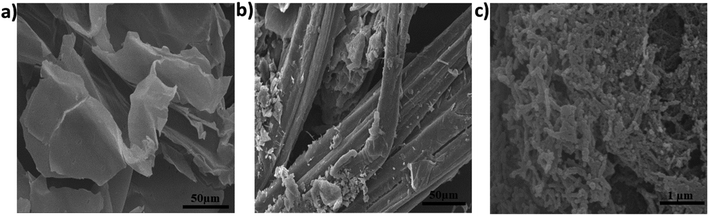 |
| | Fig. 1 SEM images of (a) raw sugarcane bagasse, (b) AHP-hydrolyzed cellulose and (c) cellulose nanofibers (CNFs). | |
Additionally, the functional groups on the surface of the cellulose nanofibers (CNFs) were evaluated using attenuated total reflectance-Fourier transform infrared spectroscopy (ATR-FTIR) (Fig. S1†) by comparison with raw bagasse and AHP-treated cellulose. The results shown in Fig. S2† indicate that the change of lignocellulose composition throughout the AHP hydrolysis process was successful. The prominent peak at 3354 cm−1 in the spectra of all the samples represents the O–H and C–H stretching of the OH– and CH– groups, respectively. The peak seen at 1024 cm−1 in the spectra of all the samples represents the cellulose C–O–C pyranose ring stretching.54 Another peak at 2912 cm−1 in the spectra of the raw SCB and AHP-treated cellulose samples corresponds to the C–H stretching of the methyl groups that could be present in the hemicellulose and lignin. A sharp peak at 1701 cm−1 in the spectrum of the raw SCB sample represents the C![[double bond, length as m-dash]](https://www.rsc.org/images/entities/char_e001.gif) O–O vibration of the acetyl and uronic ester groups of the hemicelluloses,55 this peak was not observed in the spectra of the AHP-treated cellulose and CNFs. Similarly, a peak at 1568 cm−1 in the spectra of the raw SCB and AHP-treated cellulose samples represents the aromatic CC vibration in lignin, and this peak was also not observed in the CNFs spectrum. Other peaks at 1380 cm−1 and 1249 cm−1 represent the C–H bending and C–H stretching of hemicellulose and lignin.55,56 This indicates that hemicellulose and lignin were successfully removed during the ultrasonication process.
O–O vibration of the acetyl and uronic ester groups of the hemicelluloses,55 this peak was not observed in the spectra of the AHP-treated cellulose and CNFs. Similarly, a peak at 1568 cm−1 in the spectra of the raw SCB and AHP-treated cellulose samples represents the aromatic CC vibration in lignin, and this peak was also not observed in the CNFs spectrum. Other peaks at 1380 cm−1 and 1249 cm−1 represent the C–H bending and C–H stretching of hemicellulose and lignin.55,56 This indicates that hemicellulose and lignin were successfully removed during the ultrasonication process.
3.2 Fabrication of the biosensor and its morphological and electrochemical characterization
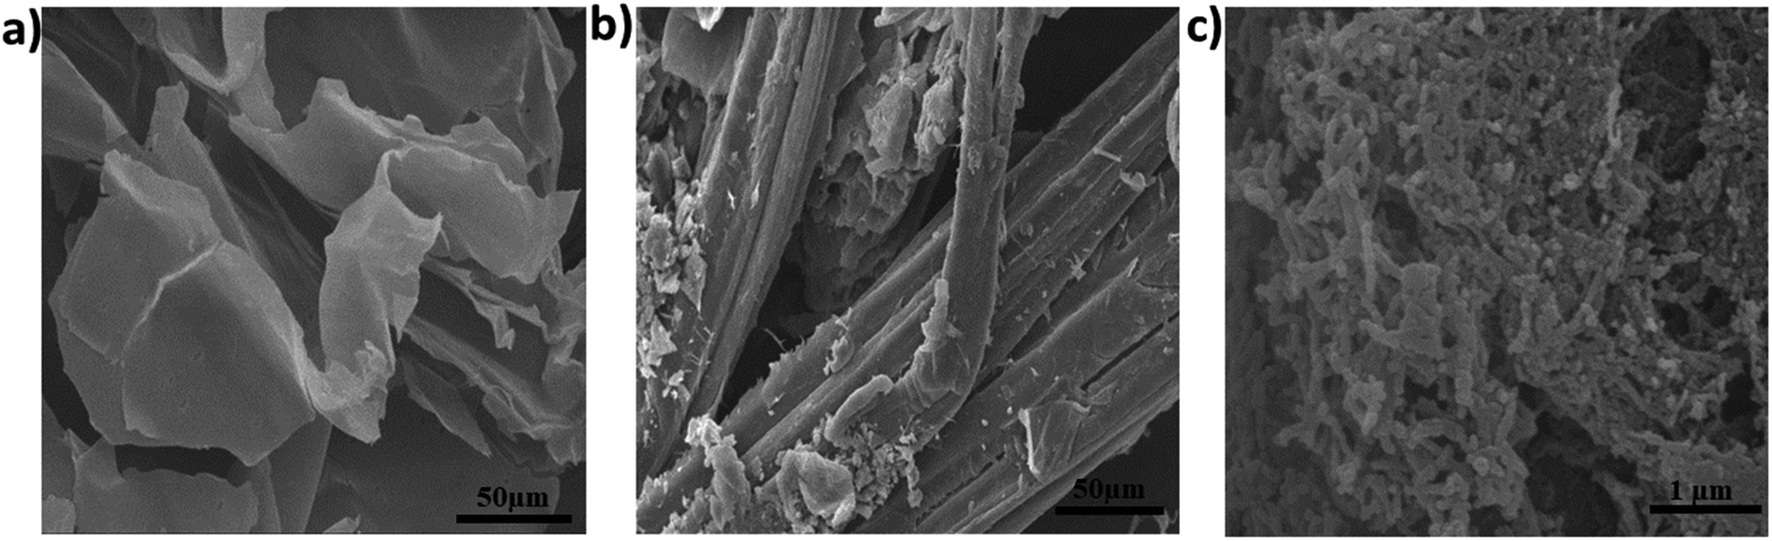
In this study, the nanocomposite materials CS-GO/GO/CNFs were coated on the surface of the SPCE's working electrode via a casting method. The enzyme AChE was immobilized on the electrode via a physical adsorption approach. Additionally, as our detection method relies on the reversible activity of the AChE enzyme, it is important to increase the AChE activity as much as possible. The enzyme structure was unaltered by this immobilization, allowing the enzyme to maintain its activity and facilitating the delivery of substrates to the enzyme's active region.57 Surface morphological characterizations at each stage of the SPCE modification, including of the bare SPCE, the CNFs-coated SPCE, GO/CNFs/SPCE and AChE/CS-GO/GO/CNFs/SPCE, were carried out using SEM, as depicted in Fig. 2a–d. On the surface of the SPCE, a highly entangled, mesh-layered, interpenetrated network of CNFs was visible, as shown in Fig. 2b. The enormous surface areas of the GO sheets covered nearly the entire surface of the CNFs when GO was deposited on the CNFs, increasing the large electroconductive working area of the SPCE (Fig. 2c). After AChE was immobilized with the chitosan-graphene oxide mixture, a uniform, smooth and even layer could be seen on the electrode's surface (Fig. 2d).
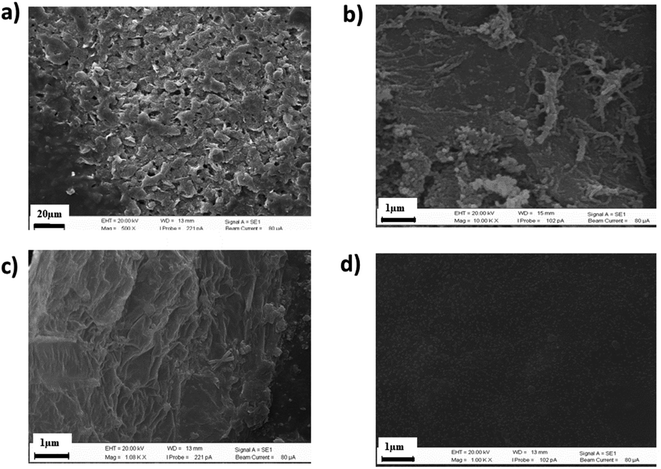 |
| | Fig. 2 SEM images of the surface of (a) bare SPCE, (b) CNFs/SPCE, (c) GO/CNFs/SPCE and (d) AChE/CS-GO/GO/CNFs/SPCE . | |
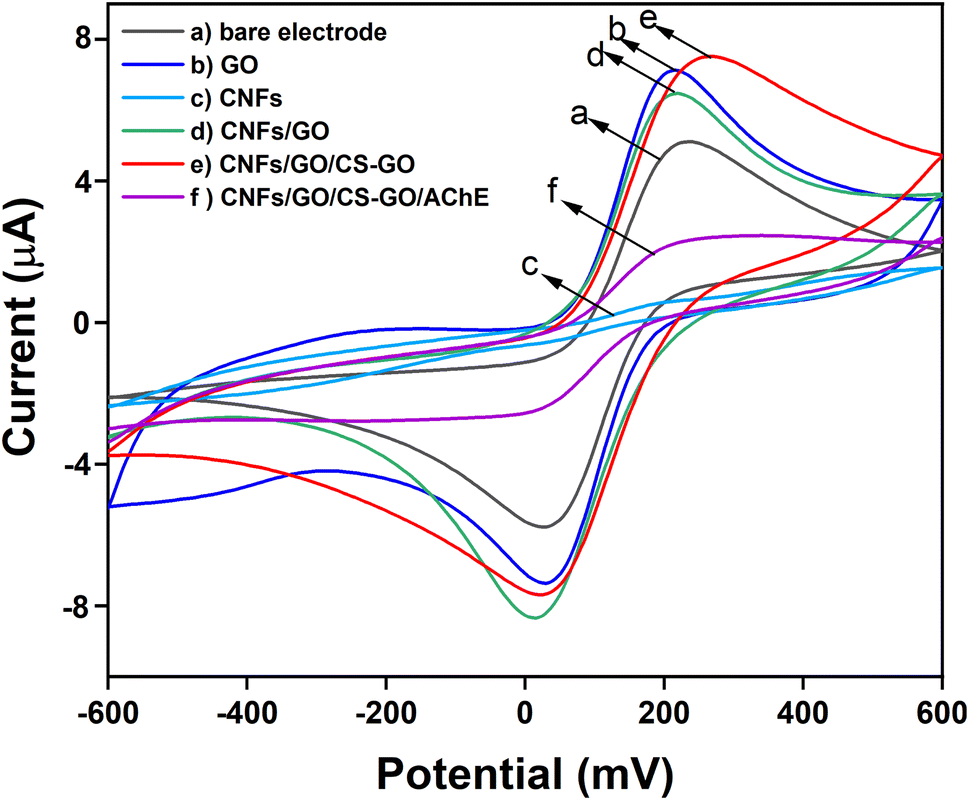
Cyclic voltammograms (CVs) were measured to characterize the electrochemical reactions of the modified SPCEs. The results shown in Fig. 3a and b, indicate that after the CNFs were coated on the surface of the SPCE's working electrode, the cathodic current decreased because of the non-conductivity of the CNFs. However, the electro-conductivity and the surface area of the working electrode could be enhanced by coating the CNFs with graphene oxide, as shown by the increase in the peak current of GO/CNFs to 6.94 × 10⁻⁵ A (Fig. 3d). The compatibility of the CNFs with GO was confirmed by the morphological characterization using SEM. Additionally, the CS-GO/GO/CNFs peak was clearly visible at 7.94 × 10⁻⁵ A (Fig. 3e), indicating that coating with the mixture of chitosan and GO might improve the signal amplification of the electrode's oxidation current. Even when compared with the current of the sample with only GO coated on SPCE, the CS-GO/GO/CNFs peak exhibited a higher current. Finally, when the AChE enzyme was coated on CS-GO/GO/CNFs, curve f in Fig. 3, the current was observed to decrease slightly to 2.68 × 10⁻⁵ A, due to the non-conductivity of AChE.
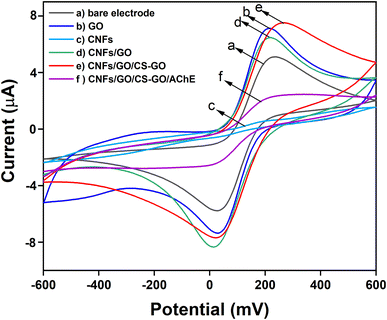 |
| | Fig. 3 CV curves for (a) a bare electrode, (b) GO/SPCE, (c) CNFs/SPCE, (d) GO/CNFs/SPCE, (e) CS-GO/GO/CNFs/SPCE, (f) AChE/CS-GO/GO/CNFs/SPCE, in the presence of 5 mM K3[Fe(CN)6]/0.1 M KCl. | |
3.3 Reaction mechanisms of ATCh and chlorpyrifos on the modified AChE/CS-GO/GO/CNFs/SPCE
The modified AChE/CS-GO/GO/CNFs/SPCE electrode was studied using CV and SWV techniques, with ferri-ferrocyanide as a mediator solution for studying the mechanisms. Since acetylthiocholine serves as the substrate for the mono-enzymatic AChE biosensor, the first objective was to create a highly sensitive enzymatic product thiocholine (RSH) sensor. The major weakness in terms of electrochemical thiocholine detection is the large overpotential required on most common electrode surfaces (gold, platinum and carbon paste), as well as the fouling of the working electrode surface.58,59 Utilizing nanostructured materials or redox mediators can help to overcome these problems and allow for the electrochemical detection of thiocholine. Our choice was to use cellulose nanofibers and the electrochemical mediator ferricyanide in solution, since it has the ability to electro-catalyze the oxidation of thiocholine.60–63 ATCh is a substrate that AChE normally catalyzes into acetic acid and TCh. However, the pesticide organophosphate chlorpyrifos can inhibit the enzyme's function, stopping ATCh from being broken down into acetic acid and TCh, and halting the oxidative reaction. Based on the activity of AChE on ATCh, CV and SWV studies of the modified SPCE were performed, as shown in the following equations (eqn (1)–(3)).| |
 | (1) |
| |
 | (2) |
| | |
Ferricyanide + TCh ↔ Ferrocyanide
| (3) |
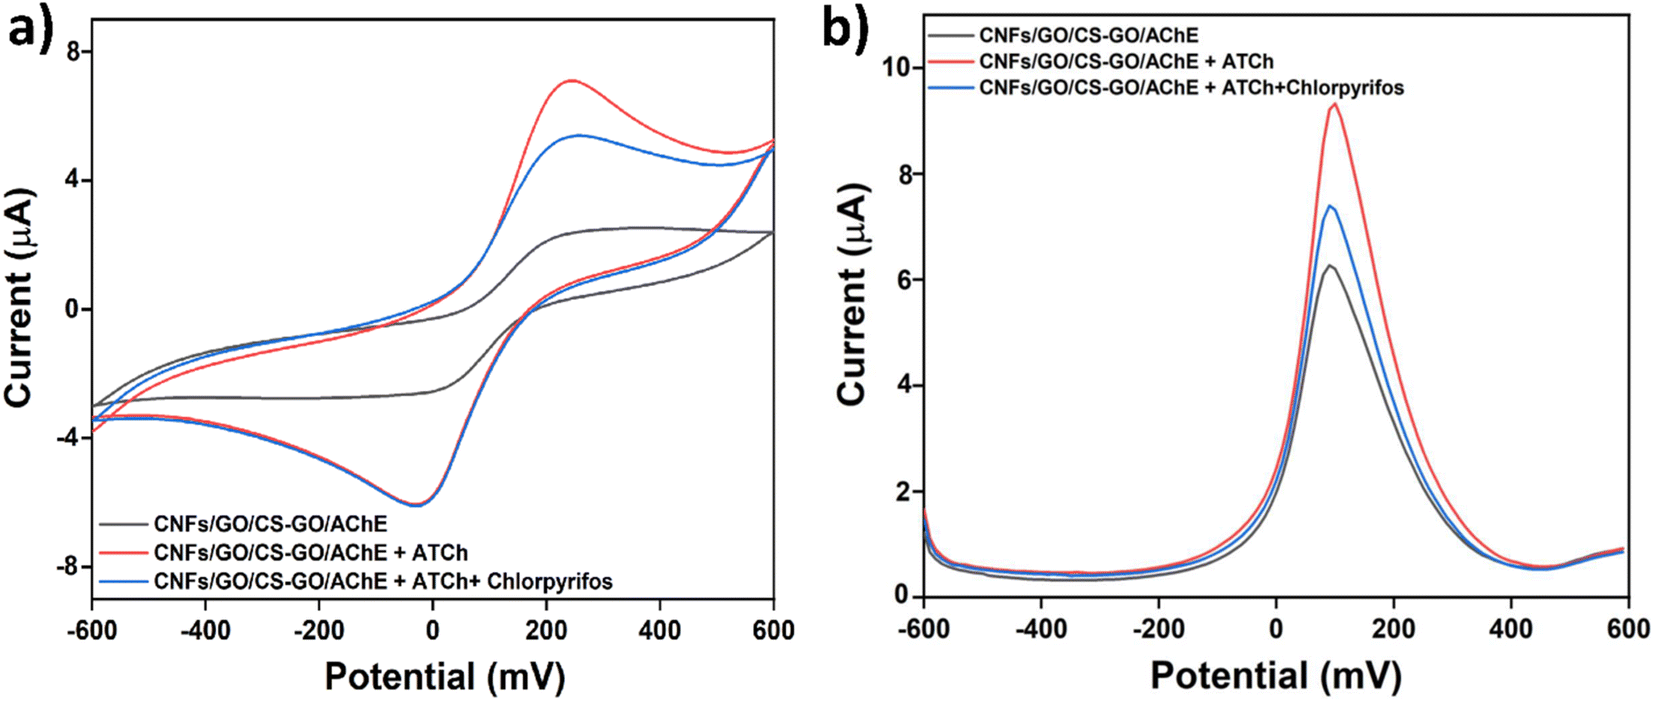
While performing the CV on the modified SPCE with ATCh (red line in Fig. 4a), a significant anodic current was observed, compared with the current of the modified electrode (black line). The anodic current of the modified SPCE in the presence of ATCh and chlorpyrifos (blue line) appeared to be reduced when chlorpyrifos was added, possibly as a result of chlorpyrifos' potential to suppress the activity of AChE. Similarly, the SWV response of the modified biosensor in the presence of ATCh (red line in Fig. 4b) showed the highest current compared with the modified SPCE (black line). The current of the modified SPCE in the presence of both ATCh and chlorpyrifos (blue line) significantly declined because chlorpyrifos inhibited the action of AChE, and the level of inhibition depended on the amount of chlorpyrifos added.
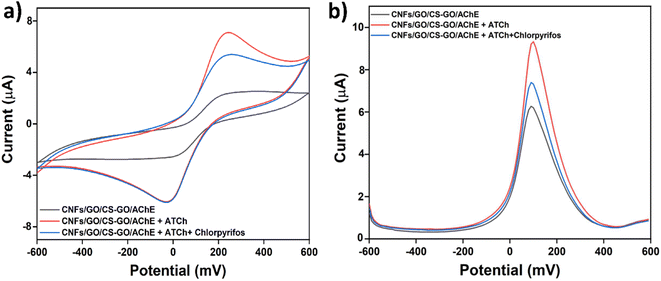 |
| | Fig. 4 (a) CV and (b) SWV responses for the modified SPCE in the presence of ATCh (red line) and in the presence of both ATCh and chlorpyrifos (blue line). | |
3.4 Effect of ATCh concentration and incubation time with ATCh on the modified SPCEs
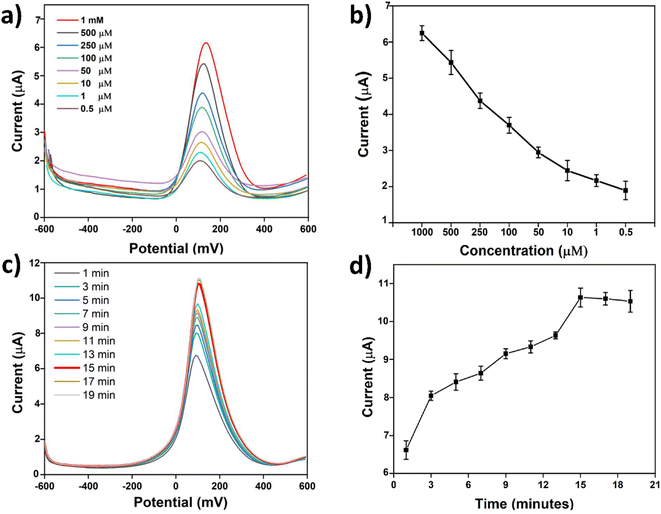
The effect of various concentrations of ATCh on the modified electrodes immobilized with AChE was examined using SWV. The substrate ATCh can be converted into acetic acid and thiocholine (TCh) in the presence of AChE, as explained in Section 3.3. The TCh oxidation peak can be followed using SWV, as shown in Fig. 5a. The electrode currents gradually decreased as the ATCh concentration was changed from higher to lower concentrations (Fig. 5a and b). These results indicate that the working ability of the AChE-immobilized modified electrodes could be properly examined by using different concentrations of ATCh. With the highest current obtained, 1 mM of ATCh was selected as the optimum concentration for further experiments on our biosensor. Then, the AChE/CS-GO/GO/CNFs modified SPCEs were treated with 1 mM of ATCh and it was observed that the TCh oxidation current peaks increased as a function of time. However, the TCh oxidation peaks stabilized after 15 min, as depicted in Fig. 5c and d. Therefore, the optimal time for incubation of ATCh on the modified electrodes was chosen as 15 min and utilized for further experiments.
 |
| | Fig. 5 SWV response for (a) the modified SPCEs to various concentrations of ATCh, (b) the corresponding line graph for the data in (a), (c) the currents of the modified SPCEs after incubation with 1 mM ATCh for different lengths of time, and (d) the corresponding line graph for the data in (c). | |
3.5 Effect of pH on the modified SPCEs
In this experiment, the electrochemical performance of the AChE/CS-GO/GO/CNFs/SPCE modified SPCEs at different pH values (4, 6, 7, 8 and 10) was studied using the SWV technique. The AChE/CS-GO/GO/CNFs/SPCE modified SPCEs were incubated in 1:1 mixed solutions of 1 mM ATCh and 1 M phosphate buffer solutions with various pH values for 15 min. The results shown in Fig. 6a and b indicate that the modified electrodes show the highest current value following incubation in a buffer solution at pH 7. The enzyme activity decreases as the pH value increases above or decreases below the optimal pH. The optimum pH for the AChE enzyme is 7-7 and the catalytic activity of AChE on acetylcholine is at its maximum at the optimum pH. Therefore, the current of the modified SPCE shows the highest peak at pH = 7 in our sensing system. Following this outcome, pH 7 was selected as the optimum pH for further analysis.
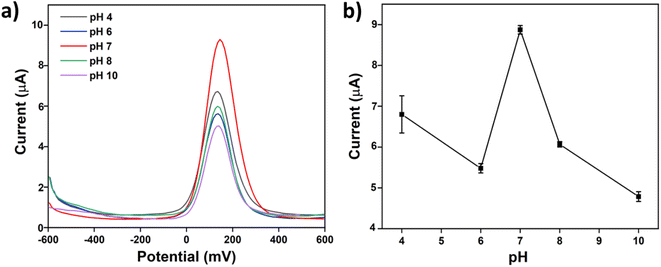 |
| | Fig. 6 (a) SWV response of the SPCEs in the presence of 1 mM ATCh and different phosphate buffer solutions (pH 4, 6, 7, 8 and 10). (b) The corresponding line graph for the data in (a). | |
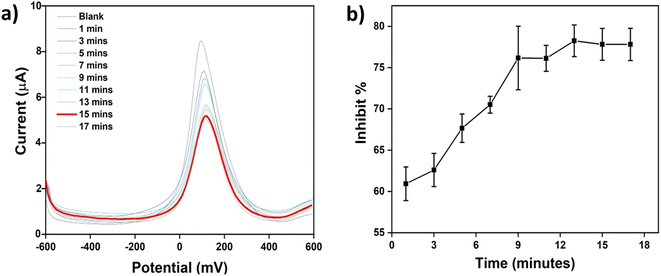
3.6 Effect of chlorpyrifos inhibition time on the modified SPCE biosensors
The organophosphate chlorpyrifos is an inhibitor of acetylcholine esterase, as illustrated above. Here in this part, SWV was used to follow the inhibition of the enzyme by the inhibitor. A solution of 1 mM ATCh and 5 μM chlorpyrifos was incubated on AChE/CS-GO/GO/CNFs modified electrodes in a ferri-ferrocyanide solution and experiments were conducted to determine the optimum time to inhibit the function of AChE. As seen in Fig. 7a, the TCh oxidation peak on the modified SPCEs gradually reduced as a function of time. The results show that after 15 min, there was no further decrease in current. To simplify the term inhibition, the percentage of inhibition (inhibit%) for the modified SPCEs was calculated and is shown in Fig. 7b (inhibit% was calculated using the equation inhibit% = Io − I/I, where Io is the peak current of the modified SPCEs in the presence of 1 mM ATCh and in the absence of chlorpyrifos and I is the peak current of the modified SPCEs in the presence of 1 mM ATCh and in the presence of 5 μM chlorpyrifos). The inhibit% of the modified SPCEs did not rise after 15 min, implying that the activity of the AChE enzyme was completely prohibited by chlorpyrifos. Thus, an inhibition time of 15 min was selected as the optimum time to inhibit the function of the AChE enzyme and was used in further chlorpyrifos detection processes.
 |
| | Fig. 7 (a) SWV response and (b) the inhibit% for the modified SPCEs as a function of increasing incubation time with chlorpyrifos. The concentration of chlorpyrifos is 5 μM. | |
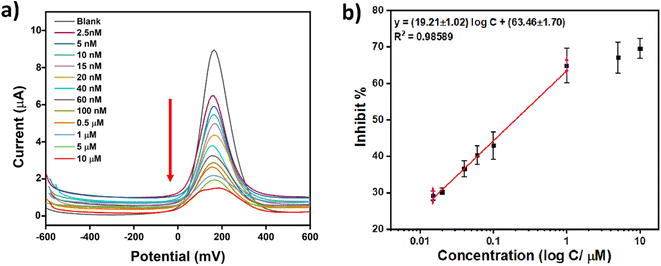
3.7 Analytical performance of the modified electrode for the detection of chlorpyrifos
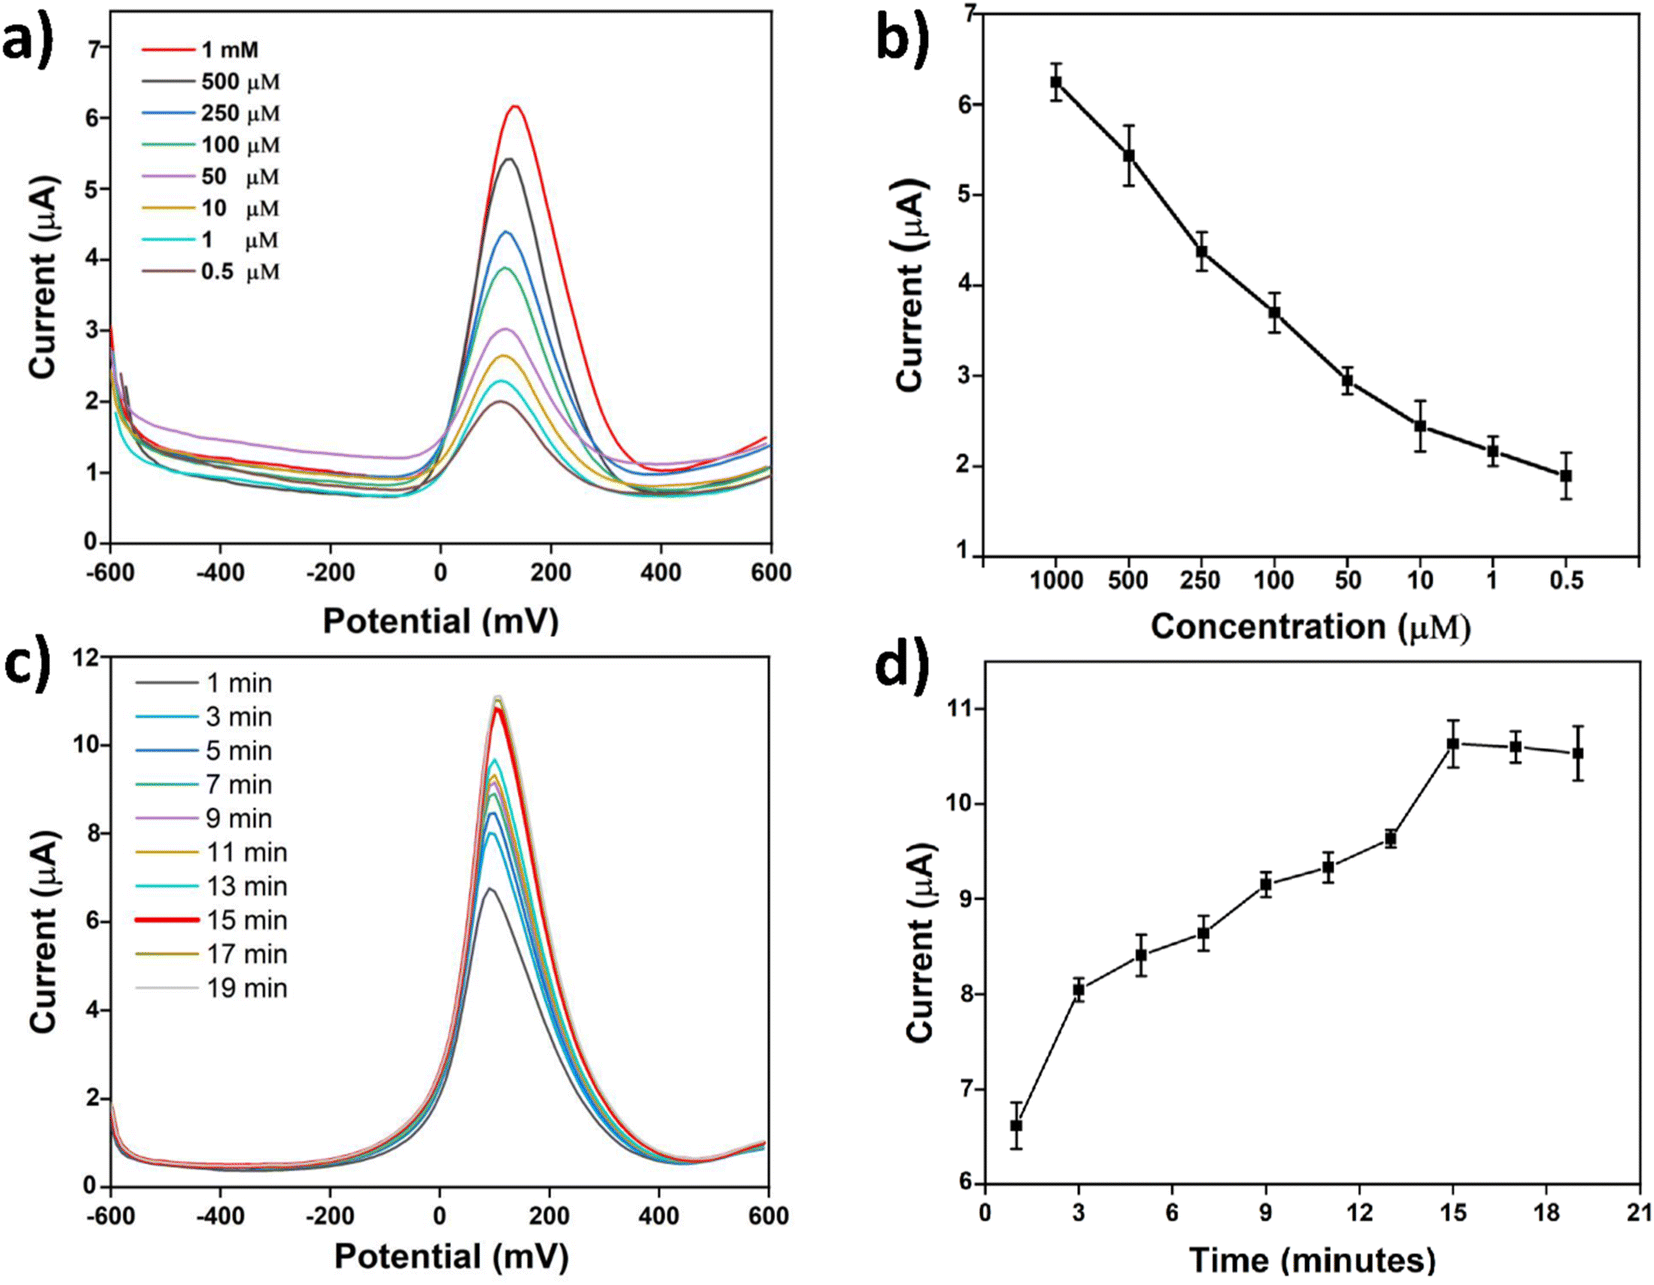
After optimization of all the experimental parameters, chlorpyrifos was used as an analyte to determine the performance of the modified electrode. The modified AChE/CS-GO/GO/CNFs electrodes were treated with solutions of 1 mM ATCh and the following different concentrations of chlorpyrifos: 2.5 nM, 5 nM, 10 nM, 15 nM, 20 nM, 40 nM, 60 nM, 80 nM, 0.1 μM, 0.5 μM, 1 μM, 5 μM and 10 μM. Then the AChE/CS-GO/GO/CNFs modified electrodes were incubated for 15 min in the presence of chlorpyrifos, and SWV measurements were taken between −600 mV and +600 mV. The TCh peak currents of the modified SPCEs declined gradually as the concentration of chlorpyrifos was increased incrementally, as shown in Fig. 8a. The inhibit% for the enzyme biosensor in the presence of different concentrations of chlorpyrifos was calculated using the equation inhibit% = Io − I/I, as defined in the above section, and a linear relationship was obtained as depicted in Fig. 8b. The least squares method was used to obtain the following linear relationship between the inhibition rate and the chlorpyrifos concentration: y = (19.21 ± 1.02) logC + (63.47 ± 1.7) (R2 = 0.98589). Then the limit of detection (LOD) and limit of quantitation (LOQ) were calculated, resulting in the values 2.2 nM and 73 nM, respectively. These values represent the concentration of chlorpyrifos required to give a current change equal to 3 standard deviations (3σ; 10 replicate measurements of blank sample (Io)) for the LOD, and 10 standard deviations (10σ) of Io for the LOQ.
 |
| | Fig. 8 (a) SWV response for the AChE/CS-GO/GO/CNFs modified SPCE treated with different concentrations of chlorpyrifos and 1 mM ATCh in phosphate buffer at pH 7. (b) The linear graph of chlorpyrifos concentration versus inhibit%. | |
3.8 Selectivity and stability studies of the AChE/CS-GO/GO/CNFs modified SPCE
The selectivity of the modified AChE/CS-GO/GO/CNFs/SPCEs for the detection of chlorpyrifos spiked in water and in the presence of different analytes was measured using SWV. Generally, water samples might commonly contain many organic and inorganic substances which may interfere with the analysis of chlorpyrifos. Consequently, as shown in Fig. S3† and the corresponding histogram summarizing the results in Fig. S4,† the sensing tests were conducted in the presence of potential interfering materials that may coexist with the detection of OPs in water samples, such as Na+, K+, Mg2+, Mn2+, Ca2+, Zn2+, Co2+, Fe2+, Hg2+ and As3+. The current response of the electrode modified with substrate ATCh showed no apparent decrease in the presence of other analytes. The current of CNFs/GO/CS-GO/AChE/SPCE decreased significantly when a modified electrode was treated with chlorpyrifos, as seen in Fig. S3,† and the current difference (Io − I) for chlorpyrifos on the modified electrode is greater than that of the other analytes, as shown in Fig. S4.† These experiments confirmed that the fabricated biosensors are robust even in the presence of possible interfering ions in the testing samples. Furthermore, the modified areas of the electrode were covered with 1× phosphate buffer saline (PBS) solution and stored at 4 °C, then stability tests were performed on the modified AChE/CS-GO/GO/CNFs/SPCEs. The modified electrode's sensing stability was subsequently tested for 21 days (Fig. S5a and b†) using 5 mM K3[Fe(CN)6]/0.1 M KCl and 0.5 μM chlorpyrifos. The study revealed that even after 21 days, the current of the modified SPCEs remained nearly equal to the original current recorded on the first day.
3.9 Determination of chlorpyrifos content in water and juice samples
Next, known concentrations of chlorpyrifos (30 nM and 50 nM) were spiked in the water and lychee juice samples (see Section 2.6), and the chlorpyrifos was assayed using the calibration curve shown in Fig. 8b. The results are depicted in Table 1 and reveal a satisfactory recovery percentage of 94.85–101.4% and a relative standard deviation (RSD%) of 3.03–4.39. These results suggest that this fabricated biosensor could be a practical option for the determination of chlorpyrifos content in water and juice samples.
Table 1 Determination of chlorpyrifos content in water and juice samples
| Sample (n = 3) |
Added (nM) |
Found (nM) |
Recovery (%) |
RSD (%) |
| Drinking water |
50 |
50.70 ± 1.56 |
101.4 |
3.08 |
| 30 |
29.41 ± 1.29 |
98.03 |
4.39 |
| Lychee juice |
50 |
48.86 ± 1.65 |
97.72 |
3.38 |
| 30 |
28.45 ± 0.86 |
94.85 |
3.03 |
3.10 Comparison with other methods for chlorpyrifos detection
Chlorpyrifos breaks down into the harmless molecule 3,5,6-trichloro-2-pyridinol (TCP), which then gradually breaks down into carbon dioxide and organochlorine chemicals via both aerobic and anaerobic processes in the soil; it has a half-life of 60–12 days.11,64 However, in naturally occurring water systems with microbial activity, chlorpyrifos has a half-life of less than a week and migrates to sediments, thus the risk to aquatic creatures arises from brief exposures to chlorpyrifos. The environmentally acceptable concentration for various applications of chlorpyrifos, as laid out by the World Health Organization, is 1 μg l−1.65 Organophosphates including chlorpyrifos can be detected using a variety of assay techniques, some of which are electrochemical (amperometric), fluorometric and colorimetric, as listed in Table 2. Of these methods, electrochemical detection provides satisfactory results and has the benefit of being reasonably fast and accurate. We point out that, in comparison to previous approaches, our sensor system's limit of detection (LOD) for chlorpyrifos is lower than for other techniques.
Table 2 Analytical performance of our fabricated biosensors compared with other methods
| Method |
Materials |
Target OPs |
Application |
LOD |
Linear range |
Ref. |
| Fluorometric assays |
Nitrogen-doped graphene quantum dots (N-GQD) |
Fenoxycrab |
River water |
3.15 μM |
6–70 μM |
66 |
| Mn(II)-doped ZnS quantum dots |
Chlorpyrifos |
River water |
17 nM |
0.3–60 μM |
67 |
| Colorimetric assays |
Ascorbic acid capped AuNPs |
Dichlorvos |
Wheat, water (tap, river and canal) and apple juice |
42.9 μM |
N.D. |
68 |
| c-AgNPs |
Dichlorvos |
Drinking water and lychee juice |
0.65 μM |
1–7 μM |
69 |
| Al2O3 sol–gel matrix SPE |
Dichlorvos |
Sea water |
0.01 μM |
0.1–80 μM |
70 |
| Peroxidase like CuFe2O4/GODs magnetic nanoparticles |
Chlorpyrifos |
— |
10.7 nM |
32–600 nM |
71 |
| Electrochemical biosensors |
AChE/Fe3O4–CH/GCE |
Carbofuran |
Cabbage |
3.6 nM |
5.0–90 nM |
72 |
| MPs-AChE |
Carbofuran |
— |
20 nM |
39–625 nM |
73 |
| Molecularly imprinted polymer (MIP) |
Chlorpyrifos |
River water and lettuce |
4.08 nM |
0.1 nM–10 μM |
74 |
| CNFs/GO/CS-GO/AChE/SPCE |
Chlorpyrifos |
Drinking water and juice |
2.2 nM |
2.5 nM–1 μM |
This work |
4. Conclusions
The biocompatible and biodegradable cellulose nanofibers (CNFs) used in this study were created and loaded onto a screen-printed carbon electrode (SPCE) along with graphene oxide (GO), taking advantage of the compatibility of the CNFs with the GO layer. This increased the working surface area of the electrode, improved the conductivity of the graphene oxide, and increased the electrochemical activity of the electrode, all of which was confirmed using both cyclic voltammetry and square wave voltammetry techniques. The sensor is inexpensive, operates well at room temperature, and does not require the use of any complicated apparatus. This biosensor is hence disposable; however, it displays great stability for at least 21 days. In addition, a linear relationship between the concentration of chlorpyrifos and the level of acetylcholinesterase (AChE) inhibition was obtained in the range 25–1000 nM. The limit of detection (LOD) and limit of quantitation were observed to be 2.2 nM and 73 nM, respectively, indicating the highly sensitive and selective inhibition of AChE by chlorpyrifos. Furthermore, the biosensor was employed to examine the chlorpyrifos content in actual water samples, producing results that were satisfactory and had a high recovery rate. Our proposed method may provide a more accessible, rapid and inexpensive way of measuring the chlorpyrifos contamination in water and juice. It is expected to be employed for analysis of chlorpyrifos in other environmental samples in the future.
Conflicts of interest
There are no conflicts to declare.
Acknowledgements
We thank the department of Research and Graduate Studies, Khon Kaen University, Thailand for financial support. W. S. T. T. thanks the scholarship program for ASEAN and GMS Countries' Personnel for the Academic Year 2020 by Khon Kaen University for financial support. S. K. is grateful for the financial and laboratory support from the Department of Chemistry, Faculty of Science, Khon Kaen University.
References
- A. Sharma, V. Kumar, B. Shahzad, M. Tanveer, G. P. S. Sidhu, N. Handa, S. K. Kohli, P. Yadav, A. S. Bali, R. D. Parihar, O. I. Dar, K. Singh, S. Jasrotia, P. Bakshi, M. Ramakrishnan, S. Kumar, R. Bhardwaj and A. K. Thukral, SN Appl. Sci., 2019, 1, 1446 CrossRef CAS.
- S. Kumar, G. Kaushik and J. F. Villarreal-Chiu, Environ. Sci. Pollut. Res., 2016, 23, 9480–9491 CrossRef CAS PubMed.
- F. P. Carvalho, Food Energy Secur., 2017, 6(2), 48–60 CrossRef.
- C. S. Pundir, A. Malik and Preety, Biosens. Bioelectron., 2019, 140, 111348 CrossRef CAS PubMed.
- M. Balderacchi, P. Benoit, P. Cambier, O. M. Eklo, A. Gargini, A. Gemitzi, M. Gurel, B. Kløve, Z. Nakic, E. Predaa, S. Ruzicic, P. Wachniew and M. Trevisan, Crit. Rev. Environ. Sci. Technol., 2013, 43, 323–408 CrossRef CAS.
- N. Munro, Environ. Health Perspect., 1994, 102, 18–37 CrossRef CAS PubMed.
- H. Fu, Y. Xia, Y. Chen, T. Xu, L. Xu, Z. Guo, H. Xu, H. Q. Xie and B. Zhao, Environ. Sci. Technol., 2018, 52, 8065–8074 CrossRef CAS PubMed.
- R. Alizadeh, L. Rafati, A. A. Ebrahimi and S. Sedighi Khavidak, J. environ. health sustain. dev., 2018, 3, 606–615 CAS.
- S. Y. Foong, N. L. Ma, S. S. Lam, W. Peng, F. Low, B. H. K. Lee, A. K. O. Alstrup and C. Sonne, J. Hazard. Mater., 2020, 400, 123006 CrossRef CAS PubMed.
- E. Taheri, M. M. Amin, S. S. Daniali, I. Abdollahpour, A. Fatehizadeh and R. Kelishadi, PloS one, 2022, 17, e0262127 CrossRef CAS PubMed.
- N. K. Nandi, A. Vyas, M. J. Akhtar and B. Kumar, Pestic. Biochem. Physiol., 2022, 185, 105138 CrossRef CAS PubMed.
- N. MESHRAM, A. SINGH and R. SHRIVASTAVA, J. Ind. Pollut. Control, 2014, 30(2), 181–184 Search PubMed.
- M. Jokanović and M. Kosanović, Environ. Toxicol. Pharmacol., 2010, 29, 195–201 CrossRef PubMed.
- D. L. Eaton, R. B. Daroff, H. Autrup, J. Bridges, P. Buffler, L. G. Costa, J. Coyle, G. McKhann, W. C. Mobley, L. Nadel, D. Neubert, R. Schulte-Hermann and P. S. Spencer, Crit. Rev. Toxicol., 2008, 38, 1–125 CrossRef CAS PubMed.
- Š. Štěpánková and K. Vorčáková, J. Enzyme Inhib. Med. Chem., 2016, 31, 180–193 CrossRef PubMed.
- E. M. Brun, M. Garcés-García, R. Puchades and Á. Maquieira, J. Immunol. Methods, 2004, 295, 21–35 CrossRef CAS PubMed.
- P. Carullo, G. P. Cetrangolo, L. Mandrich, G. Manco and F. Febbraio, Sensors, 2015, 15(2), 3932–3951 CrossRef CAS PubMed.
- G. Huang, J. Ouyang, W. R. G. Baeyens, Y. Yang and C. Tao, Anal. Chim. Acta, 2002, 474, 21–29 CrossRef CAS.
- S. Berijani, Y. Assadi, M. Anbia, M.-R. M. Hosseini and E. Aghaee, J. Chromatogr. A, 2006, 1123, 1–9 CrossRef CAS PubMed.
- M. LeDoux, J. Chromatogr. A, 2011, 1218, 1021–1036 CrossRef CAS PubMed.
- P. Liu, D. Chen, Y. Wang, X. Tang, H. Li, J. Shi, B. Tong and Y. Dong, Biosens. Bioelectron., 2017, 92, 536–541 CrossRef CAS PubMed.
- M. J. Kangas, R. M. Burks, J. Atwater, R. M. Lukowicz, P. Williams and A. E. Holmes, Crit. Rev. Anal. Chem., 2017, 47, 138–153 CrossRef CAS PubMed.
- Y. Li, M. Wan, G. Yan, P. Qiu and X. Wang, J. Pharm. Anal., 2021, 11, 183–190 CrossRef PubMed.
- M. Wang, M. Li, J. Lu, B. Fan, Y. He, Y. Huang and F. Wang, RSC Adv., 2018, 8, 11551–11556 RSC.
- M. Wei and J. Wang, Sens. Actuators B Chem., 2015, 211, 290–296 CrossRef CAS.
- R. Luo, Z. Feng, G. Shen, Y. Xiu, Y. Zhou, X. Niu and H. Wang, Sensors, 2018, 18, 4429 CrossRef PubMed.
- B. Wang, Y. Li, H. Hu, W. Shu, L. Yang and J. Zhang, PLoS One, 2020, 15, e0231981 CrossRef CAS PubMed.
- C. S. Pundir and N. Chauhan, Anal. Biochem., 2012, 429, 19–31 CrossRef CAS PubMed.
- P. Prosposito, L. Burratti and I. Venditti, Chemosensors, 2020, 8, 26 CrossRef CAS.
- T. Kuila, S. Bose, P. Khanra, A. K. Mishra, N. H. Kim and J. H. Lee, Biosens. Bioelectron., 2011, 26, 4637–4648 CrossRef CAS PubMed.
- D. Du, X. Ye, J. Cai, J. Liu and A. Zhang, Biosens. Bioelectron., 2010, 25, 2503–2508 CrossRef CAS PubMed.
- L. Yang, G. Wang, Y. Liu and M. Wang, Talanta, 2013, 113, 135–141 CrossRef CAS PubMed.
- D. Huo, Q. Li, Y. Zhang, C. Hou and Y. Lei, Sens. Actuators B Chem., 2014, 199, 410–417 CrossRef CAS.
- S. Upadhyay, G. R. Rao, M. K. Sharma, B. K. Bhattacharya, V. K. Rao and R. Vijayaraghavan, Biosens. Bioelectron., 2009, 25, 832–838 CrossRef CAS PubMed.
- G. Yang, Y. He, J. Zhao, S. Chen and R. Yuan, Sens. Actuators B Chem., 2021, 341, 130008 CrossRef CAS.
- K. Dhali, M. Ghasemlou, F. Daver, P. Cass and B. Adhikari, Sci. Total Environ., 2021, 775, 145871 CrossRef CAS PubMed.
- T. S. Anirudhan, S. S. Gopal and S. R. Rejeena, Int. J. Polym. Mater. Polym. Biomater., 2015, 64, 772–784 CrossRef CAS.
- A. Barhoum, H. Li, M. Chen, L. Cheng, W. Yang and A. Dufresne, in Handbook of Nanofibers, 2019, pp. 1131–1156 Search PubMed.
- D. H. Milanez, R. M. do Amaral, L. I. L. de Faria and J. A. R. Gregolin, Mater. Res., 2013, 16, 635–641 CrossRef.
- H. Orelma, A. Hokkanen, I. Leppänen, K. Kammiovirta, M. Kapulainen and A. Harlin, Cellulose, 2020, 27, 1543–1553 CrossRef CAS.
- A. Khan, Y. Wen, T. Huq and Y. Ni, J. Agric. Food Chem., 2018, 66, 8–19 CrossRef CAS PubMed.
- S. Ummartyotin and H. Manuspiya, Renew. Sust. Energ. Rev., 2015, 41, 402–412 CrossRef CAS.
- D. J. Gardner, G. S. Oporto, R. Mills and M. A. S. A. Samir, J. Adhes. Sci. Technol., 2008, 22, 545–567 CrossRef CAS.
- L. Wang, W. Guo, H. Zhu, H. He and S. Wang, J. Hazard. Mater., 2021, 403, 123921 CrossRef CAS PubMed.
- E. Syafri, A. Kasim, H. Abral, Sudirman, G. T. Sulungbudi, M. R. Sanjay and N. H. Sari, Int. J. Biol. Macromol., 2018, 120, 578–586 CrossRef CAS PubMed.
- T. Li, D. Shang, S. Gao, B. Wang, H. Kong, G. Yang, W. Shu, P. Xu and G. Wei, Biosensors, 2022, 12, 314 CrossRef CAS PubMed.
- M. Mashuni, H. Ritonga, M. Jahiding, B. Rubak and F. H. Hamid, Chemosensors, 2022, 10, 138 CrossRef CAS.
- N. Shahi, B. Min, B. Sapkota and V. K. Rangari, Sustainability, 2020, 12, 6015 CrossRef CAS.
- K. Zhang, A. Barhoum, C. Xiaoqing, H. Li and P. Samyn, in Handbook of Nanofibers, 2019, pp. 409–449 Search PubMed.
- E. Testai, F. M. Buratti and E. Di Consiglio, in Hayes' Handbook of Pesticide Toxicology, ed. R. Krieger, Academic Press, New York, 3rd edn, 2010, pp. 1505–1526 Search PubMed.
- N. Johar, I. Ahmad and A. Dufresne, Ind. Crops Prod., 2012, 37, 93–99 CrossRef CAS.
- J. M. Gould, Biotechnol. Bioeng., 1985, 27, 225–231 CrossRef CAS PubMed.
- T. A. Hassan, V. K. Rangari, R. K. Rana and S. Jeelani, Ultrason. Sonochem., 2013, 20, 1308–1315 CrossRef CAS PubMed.
- N. Gierlinger, T. Keplinger, M. Harrington and M. Schwanninger, Cellul.: Biomass Convers., 2013, 159–192 Search PubMed.
- J. Sun, X. Sun, R. Sun and Y. Su, Carbohydr. Polym., 2004, 56, 195–204 CrossRef CAS.
- Y.-H. Feng, T.-Y. Cheng, W.-G. Yang, P.-T. Ma, H.-Z. He, X.-C. Yin and X.-X. Yu, Ind. Crops Prod., 2018, 111, 285–291 CrossRef CAS.
- T. Jesionowski, J. Zdarta and B. Krajewska, Adsorption, 2014, 20, 801–821 CrossRef CAS.
- A. Kousar, E. Peltola and T. Laurila, ACS Omega, 2021, 6, 26391–26403 CrossRef CAS PubMed.
- G. Liu, S. L. Riechers, M. C. Mellen and Y. Lin, Electrochem. Commun., 2005, 7, 1163–1169 CrossRef CAS.
- F. Arduini, S. Guidone, A. Amine, G. Palleschi and D. Moscone, Sens. Actuators, B, 2013, 179, 201–208 CrossRef CAS.
- T. Neufeld, I. Eshkenazi, E. Cohen and J. Rishpon, Biosens. Bioelectron., 2000, 15, 323–329 CrossRef CAS PubMed.
- F. Arduini, A. Cassisi, A. Amine, F. Ricci, D. Moscone and G. Palleschi, J. Electroanal. Chem., 2009, 626, 66–74 CrossRef CAS.
- J. P. Hart and I. C. Hartley, Analyst, 1994, 119, 259–263 RSC.
- G. Solomon, O. A. Oguseitan and J. Kirsch, Pesticides and Human Health A Resource for Health Care Professionals, UC Irvine, 2000 Search PubMed.
- W. H. Organization, The WHO recommended classification of pesticides by hazard and guidelines to classification 2019, World Health Organization, 2020 Search PubMed.
- E. Caballero-Diaz, S. Benitez-Martinez and M. Valcárcel, Sens. Actuators B Chem., 2017, 240, 90–99 CrossRef CAS.
- X. Ren, H. Liu and L. Chen, Microchim. Acta, 2015, 182, 193–200 CrossRef CAS.
- S. L. D’souza, R. K. Pati and S. K. Kailasa, Anal. Methods, 2014, 6, 9007–9014 RSC.
- W. S. T. Tun, S. Kulchat, C. Talodthaisong, S. Daduang, J. Daduang, K. Rongchai and R. Patramanon, Mater. Chem. Front., 2022, 6(11), 1487–1498 RSC.
- M. Shi, J. Xu, S. Zhang, B. Liu and J. Kong, Talanta, 2006, 68, 1089–1095 CrossRef CAS PubMed.
- H. Mao, N. Y. J. S. H. Z. Zuo and Y. Ya, J. Residuals Sci. Technol., 2017, 14, 255–269 CrossRef CAS PubMed.
- T. Jeyapragasam and R. Saraswathi, Sens. Actuators B Chem., 2014, 191, 681–687 CrossRef CAS.
- A. Kostelnik, P. Kopel, A. Cegan and M. Pohanka, Sensors, 2017, 17(4), 676 CrossRef PubMed.
- W. Xu, Q. Wang, W. Huang and W. Yang, J. Sep. Sci., 2017, 40, 4839–4846 CrossRef CAS PubMed.
|
| This journal is © The Royal Society of Chemistry 2023 |
Click here to see how this site uses Cookies. View our privacy policy here. 
 Open Access Article
 This Open Access Article is licensed under a Creative Commons Attribution-Non Commercial 3.0 Unported Licence
 d,
Sirinan Kulchat
d,
Sirinan Kulchat