 Open Access Article
Insight into the structural, optoelectronic, and thermoelectric properties of Fe2HfSi Heusler by DFT investigation
Abida Azama,
Ramesh Sharma *b,
Debidatta Beherac,
Hafiz Hamid Razaa,
H. Saad Alia,
Shaimaa A. M. Abdelmohsend,
Ashraf M. M. Abdelbackie and
Sanat Kumar Mukherjeec
aCentre for Advanced Studies in Physics, GC University, Lahore-54000, Pakistan
bDept. of Applied Science, Feroze Gandhi Institute of Engineering and Technology, Raebareli-229001, Uttarpradesh, India. E-mail: sharmadft@gmail.com
cDept. of Physics, Birla Institute of Technology, Mesra Ranchi, Jharkhand, India
dDepartment of Physics, College of Science, Princess Nourah Bint Abdulrahman University, P.O. Box 84428, Riyadh 11671, Saudi Arabia
ePlant Pathology Department, Faculty of Agriculture, Cairo University, Cairo 12613, Egypt
First published on 22nd May 2023
Abstract
At high pressure, the pressure dependencies of the structural, electronic, optical, and thermoelectric properties of Fe2HfSi Heusler were calculated using the FP-LAPW method within the framework of the density functional theory. The calculations were carried out using the modified Becke–Johnson (mBJ) scheme. Our calculations showed that the Born mechanical stability criteria confirmed the mechanical stability in the cubic phase. Further, through Poisson and Pugh's ratios critical limits, the findings of the ductile strength were computed. At a pressure of 0 GPa, the indirect nature of the material may be deduced from the electronic band structures of Fe2HfSi as well as the estimations for its density of states. Under pressure, the real and imaginary dielectric function responses, optical conductivity, absorption coefficient, energy loss function, refractive index, reflectivity, and extinction coefficient were computed in the 0–12 eV range. Using semi-classical Boltzmann theory, a thermal response is also studied. As the pressure rises, the Seebeck coefficient decreases, while the electrical conductivity rises. The figure of merit (ZT) and Seebeck coefficients were determined at temperatures of 300 K, 600 K, 900 K, and 1200 K in order to better understand the thermoelectric properties of a material at these different temperatures. Despite the fact that the ideal Seebeck coefficient for Fe2HfSi was discovered at 300 K and was determined to be superior to that reported previously. Materials with a thermoelectric reaction has been shown to be suitable for reusing waste heat in systems. As a result, Fe2HfSi functional material may aid in the development of new energy harvesting and optoelectronic technologies.
1. Introduction
The serious threat to our society is day-by-day increasing due to the increased demand for energy caused by the deterioration of fossil fuels in addition to hazardous elements increasing in the environment leading to global warming. It turns the world's interest in renewable sources of energy. The direct conversion between thermal and electrical energies known to be thermoelectricity is a very promising way for renewable energy generation through which the wasted heat of the system can be beneficial to meet needs.1,2 The efficiency of thermoelectric (TE) materials can be described by their known parameter figure of merit (ZT), which can be defined with the expression ZT = (S2σT)/(κe + κl), where S is the thermos-power (Seebeck coefficient), σ is electrical conductivity, T is absolute temperature, and κe and κl are the electronic and lattice contributions, respectively, to the thermal conductivity. More than fifty years ago with the discovery of Bi2Te3-based alloys heaving ZT ∼ 1,3 though ZT > 3 for TE devices in comparison to becoming more efficient than other energy conservation resources, still a challenge to achieve high ZT. Among the various TE materials, chalcogenides,4,5 skutterudites,6,7 and half-Heusler alloys,8–14 have also emerged as appropriate nominees in the stream. Owing to features, such as phase transitions, strong spin polarization, and half-metallicity for device application TEs and spintronics, Heusler alloys have been the centre of interest in the scientific community.15–17 Iron-based Heusler alloys have been enormously explored and reported. They have a wide range of electronic structures, from metallic to semiconducting. Experimentally, half-metallic Fe2YSi (Y = Co, Ni, Mn, Cr, and Fe) compounds were produced.18 Other research groups examined iron-based half-metallic compounds that were in great demand for TE device production, such as Fe2YZ (Z = Y = Zr, Ta, Hf, V, Ti, and Nb, and Sn, Ge, Si, Al, Ga, and In), and a recent study revealed a high-power factor at room temperature (RT).19,20 The TE response of the Fe2Val material and full Heusler Fe2ZrSi at 700 K up to 40 GPa have been testified under pressure by S. Masuda et al. and Sofi et al., respectively.21,22 Following this, we investigate the influence of pressure on the TE analysis of L21-type Heusler alloys, which would allow us to gain a better understanding of the numerous factors contributing to the alloy's improved TE response. To the best of our knowledge comprehensive study to calculate structural, electronic, elastic, optical, and transport properties under high pressure of Fe2HfSi was performed for the first time to reveal the characteristics of the studied half Heusler alloy. This study is divided into sections, Section 1 consists of structural details, Section 2 involves theoretical calculations lastly Section 3 describes the results and detailed discussions along with the summary.2. Computational approach
First-principles calculations by the Full Potential Linearized Augmented Plane Wave (FP-LAPW) method embedded in the WIEN2k code were used to explore the current study on half Heusler alloy.23 The electronic configuration of the constituent atoms is as follows: Fe = [Ar] 3d6 4s2, Hf = Hf: [Xe] 4f14 5d2 6s2, Si = [Ne] 3s2 3p2. Prior to exploring the findings of experimental results for the materials, the DFT was proven as a key tool for defining the various attributes. The FP-LAPW approach, as implemented in the WEIN2k code, was used to complete the task. By treating the onsite strong correlation of the 3d electrons, we applied the Perdew–Burke–Ernzerhof scheme of the generalised gradient approximation (PBE-GGA) for the exchange-correlation functional.24 However, the modified Becke–Johnson (mBJ) approach may be used to predict the nature of the band structure at optimized lattice constants.25 At diverse pressures of 0 GPa, 15 GPa, and 30 GPa the different physical properties were computed. Energy and charge convergence were achieved at 0.0001 Ry and 0.0001e respectively, whereas, the plane wave number was obtained as KMAX = 7.0/RMT, and a 5000 k-point-mesh was employed. The thermoelectric properties were calculated using the Boltzmann transport theory,26 with the relaxation time constant for charge carriers approximation. To comprehend the convergence criterion, a compact mesh of 46 × 46 × 46 k-points was used.3. Results and discussion
3.1. Structural properties
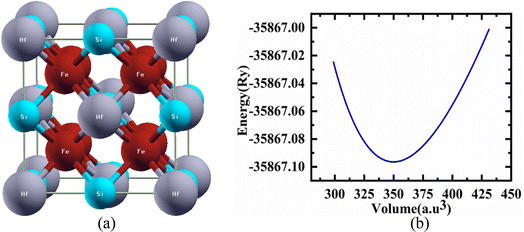
Structural characteristics of the studied half Heusler compounds were exposed within pressure dependencies. Fe2HfSi structure crystallizes (prototype Cu2MnAl) in the Fm![[3 with combining macron]](https://www.rsc.org/images/entities/char_0033_0304.gif) m space group with Y atom (Hf) occupying 4b (0, 0, 0), Z atom (Si) sit 4a (1/2, 1/2, 1/2) and the 8c (1/4, 1/4, 1/4) position was occupied by the Fe atoms. The optimal crystal structure and total energy as a volume-dependent function were predicted using the Murnaghan equation27 of state and shown in Fig. 1 is given as.
m space group with Y atom (Hf) occupying 4b (0, 0, 0), Z atom (Si) sit 4a (1/2, 1/2, 1/2) and the 8c (1/4, 1/4, 1/4) position was occupied by the Fe atoms. The optimal crystal structure and total energy as a volume-dependent function were predicted using the Murnaghan equation27 of state and shown in Fig. 1 is given as.
 | (1) |
 , and V are the bulk modulus, pressure derivative of the bulk modulus, and volume, respectively. The minimum energy at the optimized volume is found in the ferromagnetic (FM) phase at pressure 0 GPa with a lattice parameter of 5.920 Å and agrees with experimentally/theoretically reported values of 5.884 Å and 5.930 Å at room temperature from the family of these compounds.22,28,29 The estimated parameters of the examined Heusler compound lattice constant, its pressure derivative, unit cell volume, bulk modulus, minimum ground-state energy, and cohesive energy are presented in Table 1. The comparison30 shows that the lattice constant increases in Fe2YSi as the atomic number at Y place changes, a lesser B value anticipates that the studied compound is much easier to press as Fe2ZrSi.
3.2. Mechanical stability and thermodynamic behavior
The effect of pressure on the mechanical properties of the studied compound was computed employing the IR-elast method31 implemented in WIEN2k software. In order to de describe the mechanical properties of cubic structured Fe2HfSi three elastic constants C11, C12, and C44 were determined.31 They were found to satisfy the essential Born mechanical stability criteria expressed as C11–C12 > 0, C11 < 2C12 > 0, C44 > 0 and C12 < B < C11 suggesting mechanical stability. The various elastic constants at different external pressure are represented in Table 2. The elastic constants are observed to increase with pressure. The elastic constants bulk modulus (B), Young modulus (E), and shear modulus (G) were observed to increase with applied pressure, which is associated with the reorientation of the electronic states. Other elastic properties such as Cauchy pressure (C11–C12), Poisson's ratio (y), and Pough's index of ductility (B/G) are computed to estimate the brittle and ductile nature, as shown in Table 2. The Cauchy pressure is noticed to be positive revealing the investigated compound is ductile in nature. Bulk modulus (B) is computed as B = (C11 + 2C12)/3 and is, therefore, a linear combination of C12 and C11. The B for the compound under investigation was determined and is given in Table 2. The strong consistency between the bulk moduli of Murnaghan's state equation (Table 1) and the bulk moduli of the elastic constant calculation is an indication of the correctness of the evaluated Fe2HfSi elastic constants. Moreover, Poisson's ratio (σ) has a critical 0.26. For the ductile nature, its value is more than 0.26 otherwise brittle. For all the applied pressures, it was observed to be brittle in nature, as evidenced by the data in Table 2. The anisotropic factor A is another key parameter that gives information regarding the nature of micro-cracks. The magnitude equal to 1 suggests isotropic nature whereas any deviation from this value suggests anisotropic nature. As noticed in Table 2, at all the investigated pressure the compound is anisotropic in nature. The thermodynamic properties of the compounds were calculated by Debye temperature (θD) from elastic constants as expressed by relationship.
 | (2) |
 | (3) |
 | (4) |
| Material property | 0 GPa | 15 GPa | 30 GPa |
|---|---|---|---|
| C11 (GPa) | 383.15 | 500.74 | 595.68 |
| C12 (GPa) | 116.89 | 155.96 | 192.17 |
| C44 (GPa) | 133.93 | 184.91 | 223.71 |
| Bulk modulus, B (GPa) | 205.65 | 270.88 | 326.67 |
| Shear modulus, G (GPa) | 133.61 | 179.79 | 214.65 |
| Young modulus, Y (GPa) | 329.486 | 441.67 | 528.81 |
| Poisson ratio, σ (GPa) | 0.232 | 0.228 | 0.230 |
| Pugh ratio, B/G (GPa) | 1.53 | 1.506 | 1.521 |
| Frantsevich ratio, G/B (GPa) | 0.649 | 0.663 | 0.657 |
| Shear anisotropy factor, A (GPa) | 1.006 | 1.150 | 1.108 |
| Cauchy pressure CP (GPa) | −17.04 | −28.95 | −31.54 |
| Transverse sound velocity (m s−1) | 3617.11 | 4066.55 | 4334.17 |
| Longitudinal sound velocity (m s−1) | 6130.4 | 6853.02 | 7323.61 |
| Average sound velocity (m s−1) | 4007.8 | 4503.38 | 4800.95 |
| Temperature θD (K) | 508.27 | 583.176 | 632.10 |
| Melting temperature Tm (K) | 2817.47 ± 300 K | 3512.39 | 4073.48 |
Table 2 provides the computed values of ϑt, ϑl, Vm, θD, and Tm
3.3. Electronic properties
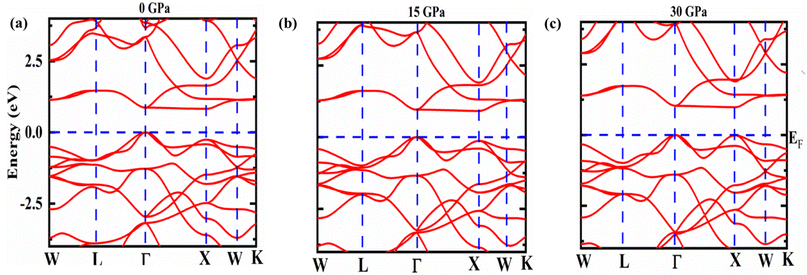
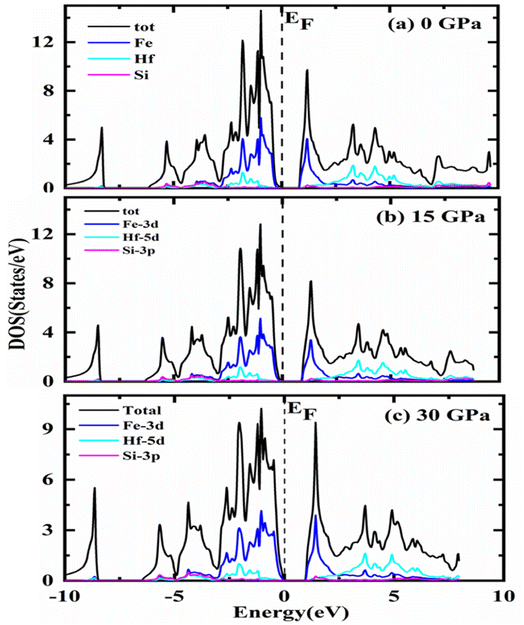
This part of the exploration constitutes the electronic behavior within the material around the Fermi energy (EF) level. These electronic details are depicted in the electronic band structure and density of electronic states as shown in Fig. 2 and 3, respectively under the chosen pressure range 0–30 GPa. A definite gap between the conduction and valence band is observed that categorized Fe2ZrSi as semiconducting material. The bands are plotted in the first Brillouin zone (BZ) with a blue dotted line on the energy axis in Fig. 2 showing the EF while W–L–Γ X–W–K are the high symmetry points in the first BZ.The conduction band's bottom and the valence band's top do not meet at the same symmetry point, as such is indirect in nature with a small shift in band gap around EF as pressure increases from 0 GPa to 30 GPa. This variation is exposed in Fig. 3 and also in Fig. 4. That means as pressure increases, the material tends towards more stability. As a result, pressure-induced expansion of the semiconductor heaving indirect bandgap is rather slight. The gap value rises with the addition of mBJ up to 0.6 eV in Fe2HfSi at P = 0 GPa disclosing an increase of more than 33%, as depicted in Table 3.
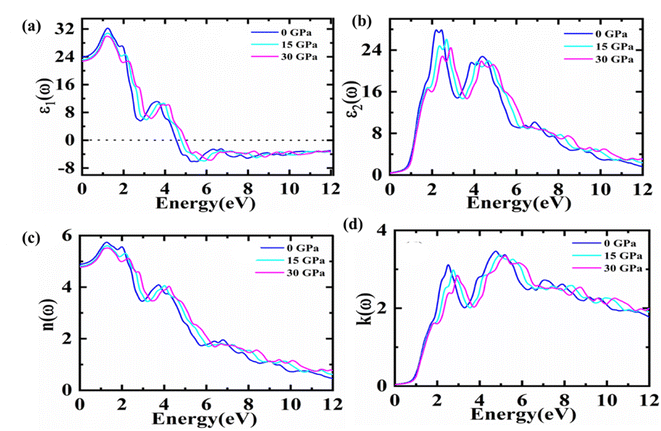 | ||
| Fig. 4 Complex dielectric function (a) real, (b) imaginary part and refractive index (c) real, (d) imaginary part for Fe2HfSi at 0, 15, 30 GPa. | ||
To explore more about electronic characteristics, the densities of states (DOS) are depicted relative to EF in Fig. 4, displaying the total and partial densities of state (PDOS) over the specified range of pressure in gigapascal units. The black line indicates the overall contribution of the compound with constituent atoms Fe-3d, Hf-5d, and Si-3p at zero, fifteen, and thirty gigapascals orderly. The s-orbital of Si slightly contributes to electronic investigations of Fe2HfSi as compared to the other atoms, while the stronger contribution comes from the Fe d-orbital, Hf d-orbital whereas for the Si it is p-orbital. When the pressure is increased, there is very little discernible shift in the profile of the DOS. Moreover, there is a significant disparity in the locations of the peaks. Fe2HfSi exhibits equal contributions of Fe-3d, Hf-5d, and orbital 3p of the Si at 0–5 eV. Fe-3d is the main contributor to the unoccupied states. For Fe2HfSi, the DOS matches well with the experimental results reported in literature.33
3.4. Optical properties
Materials with suitable optical features play a key role in optoelectronic applications. As optical properties are demonstrated under pressure ranges 0–30 GPa of Fe2HfSi in cubic phase in this work and plotted in the energy range up to 12 eV. The complex dielectric function ε(ω) = ε1(ω) + iε2(ω)34 with real ε1(ω) and imaginary part ε2(ω) characterizes the linear response of studied material towards incoming electromagnetic radiations, as shown in Fig. 4.The ε1(ω) component indicates the extent to which a material may be polarised.35 The static dielectric constant was found to be dependent upon the bandgap (Eg) of the material. While with the pressure climbing from 15 to 30 GPa, the static dielectric function declines, as the actual dielectric function falls and approaches zero at 4.8–5.0 eV. If more energy increases, the dielectric function becomes negative, which made this material might be as that of meta-material as shown in Fig. 4(a).35,36 By increasing the pressure to 30 GPa, a little movement towards higher energy areas was observed in this graph.
The imaginary part ε2(ω) contributes significantly to defining more about the optical illustration for any material. Greater values correspond to the higher absorption of explored medium. This proposes a deep effect on absorption. Fig. 4(b) depicts the relationship between the imaginary component of the dielectric function and energy, showing how the material's absorption zone thickens as pressure increases. To put it simply, the absorption peaks at 0 GPa and dips at 30 GPa due to indirect bandgap transitions at high symmetry sites between the valence band maximum and conduction band minimum. There also exist some peaks because of the inter-band transitions. To figure out the surface behaviour, the ratio of the incident power to the reflected power is used to figure out reflectivity. The dielectric pattern nearly follows as reported previously.37 The refractive index and extinction coefficient versus energy spectrum are presented in Fig. 4(c) and (d). The static index n (0) values of 4.89, 4.81, and 4.77 may be observed in the figure for cubic Fe2HfSi at 0, 15, and 30 GPa pressure, respectively. As the pressure rises over 0–30 GPa, the refractive index peaks shift somewhat toward higher energy values. However, various peaks may be seen in the graph centre, which disappears with higher energies. It is certain that the material transparency will be lost at a particular level of energy, and high-energy photons will be available to be absorbed at that point. Fig. 4(c) shows that the refractive index is lower than unity at specified energies. The group velocity of incoming radiation was found to be higher than the speed of light, based on lower than unity values of refractive index. It constitutes that the group velocity exposes a shift towards negative values reflecting the non-linear nature of the medium. Thus, it may be deduced that the material transforms into a superluminal medium for photons with high energies.38,39
Fig. 4(d) depicts a plot of extinction coefficients. It gives an idea about the light absorption and absorption characterizes the extremes of the band at the same time.40 It is an imaginary part of the refractive index with prominent peaks probably due to the transitions among the valence and the conduction bands. At varying pressures, the reaction in Fig. 5(d) is precisely connected to the imaginary component of the dielectric function.32 This constitutes the same trend of absorption with the same footprints of refractive index.
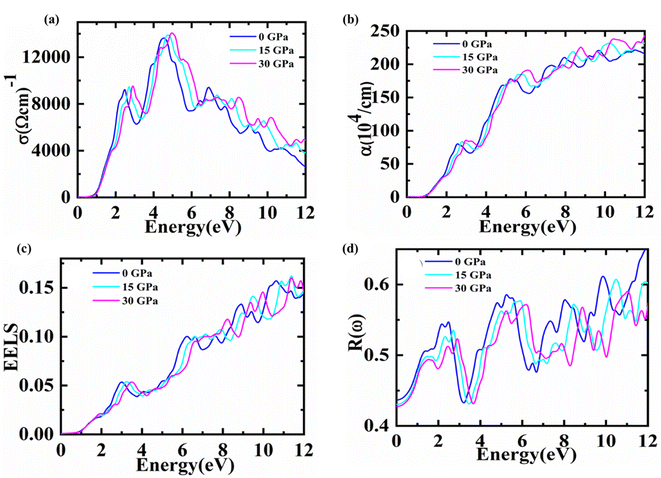 | ||
| Fig. 5 For Fe2HfSi (a) optical conductivity (b) absorption coefficient (c) EELS and (d) reflectivity data is plotted at 0, 15, 30 Gpa. | ||
One of the key optical parameters used to describe how electrons are transported in the electromagnetic radiation that is being produced in the current state is called optical conductivity. This parameter obtained for a substance demonstrates its efficacy in optoelectronic devices and system applications. At various pressures, the optical conductivity of Fe2HfSi may be shown in Fig. 5(a) as a photon energy function and we can note conductivity values are zero for energy values 0.78, 0.89, 0.90 eV at pressures of 0, 15, and 30 GPa, respectively. This is in line with the material's bandgap under varying pressures. Increasing the photon energy results in an increase in these values, which peak at 4.21, 4.42, and 4.63 eV against 0, 15, and 30 GPa pressures, respectively. It is possible to observe that the peak moves into the higher energy zone as the pressure continues to grow up to 30 GPa. After securing peak values, the graph starts showing a decreasing trend with a further increase in the energy of the photon. Practically, the optical conductivity line form is similar to that of the extinction coefficient and dielectric imaginary part spectrums. The light intensity decreases with increasing distance as it passes through a material, and this decrease is represented by the absorption coefficient. Fig. 5(b) shows the cubic Fe2HfSi absorption coefficient in relation to the frequency at different pressure values. The energy range from 0 to 12 eV is used to describe its fluctuation. Pressures of 0, 15, and 30 GPa produce maximum maxima of 11.3, 12.02, and 12.0, respectively. It has been seen that when the pressure goes up, the absorption peak moves up, with further increasing pressure, it may go towards higher values of energy as the trend shown in the presented data. It can also be noted that no absorption is observed for photon energy less than 1 eV for this pressure range. However, with greater energy than this value, it starts increasing, which is aided by the indirect bandgap values calculated Fe2HfSi at different pressures respectively.
Fig. 5(c) represents the energy loss function in the 0–30 GPa pressure range. The plasma resonance/plasma frequency features are depicted in the graph by the prominent peaks. In this pressure range, no energy loss has been observed for the photons with energy less than 1 eV. For further increase in photonic energy, energy losses start increasing and come to the maximum value in the 10.3–11.12 eV energy range for 0–30 GPa, respectively. Peak shifts toward higher energies are observed by increasing pressure up to 30 GPa. An interface between the metallic and dielectric expressions may be found in the observed data.
The zero frequency limits of reflectivity shown in Fig. 5(d) also demonstrate a rise with increasing pressure and the potential to achieve an optimal value. In comparison, the energy range from 0 to 11 eV has the lowest reflectivity due to collective plasma resonance. Additionally, the imaginary part of the dielectric function can account for plasma resonance.41 This pattern is consistent with the dielectric function imaginary portion as the reflectivity peak changes toward greater energy when the pressure is increased.33,34 The energy loss spectrum, which is often significant at plasma energies, depicts the energy loss of a fast-moving electron through a material. It is known that the frequency associated with the peak in the loss function is the plasma frequency. These bumps correlate to the spectrum's uneven edges.
3.5. Thermoelectric properties
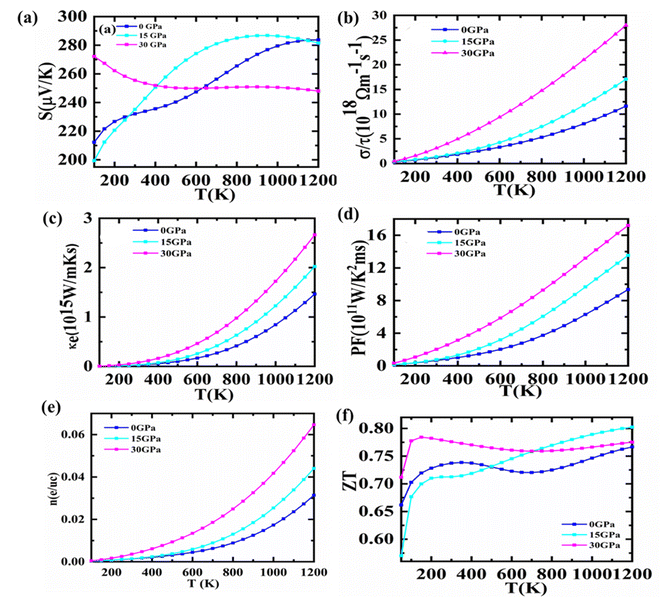
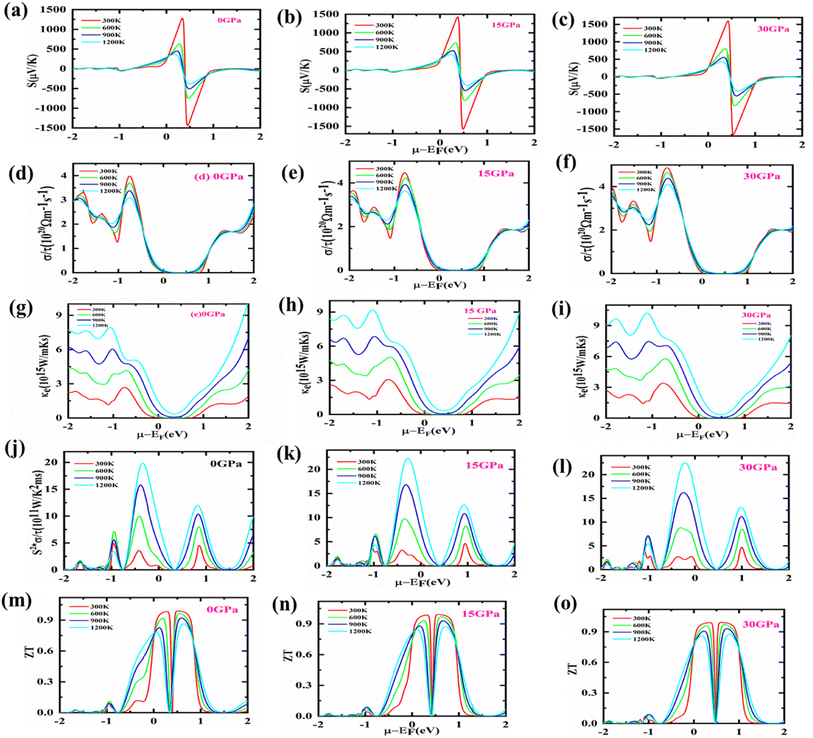
There is a solution to the current energy crisis in TE materials, which turns lost heat energy into functional electricity. Because of their competence and environmentally friendly energy management, such a diversity of materials is presently being investigated more quickly than other technologically notable materials. Waste heat reuse is one of TE's many innovative uses that makes them highly sought after for conserving or reducing fuel usage, notably in transportation.Semiconductors have a substantial Seebeck coefficient (S) that is highly reliant on DOS in the vicinity of the EF. The computed S for Fe2HfSi as a function of temperature is shown in Fig. 6(a). The band structure study anticipated that holes (p-type) would be the dominant charge carriers for the material in the temperature range of 150–1200 K, and this is supported by the positive Seebeck coefficient. Additionally, Fe2HfSi has a higher S than other Fe-based Heusler alloys.42,43 Because of this, the Seebeck coefficient and indirect band gap of these alloys are rather large. Aiming for a high S value to obtain a high-efficiency TE and a close ZT is a fruitful endeavor. Utilizing the electrical conductivity and S, it gets the stuff. The charge packets must be either p/n type. We estimated the S versus chemical potential at various pressures, generally up to 30 GPa, to increase the performance of TE. Fig. 7(a)–(c) demonstrates that S is entirely boosted in the area where μ − EF = 0, indicating that a sufficiently large S value may be obtained with a lower p or n-type of doping. Therefore, we should emphasize whether the material's conductivity in the Fermi zone is n or p-type. This setting controls the number of transporters in the lead position. It presents n-type materials with a negative S value and p-type materials with a positive S value. Therefore, both p and n doping types are optimal for attaining a high S value. As pressure rises, the Seebeck coefficient falls, showing that Fe2ZrSi is an excellent thermoelectric material.
The electrical conductivity parameter, which is carrier concentration-dependent, is presented in Fig. 6(b). The electrical conductivity of cubic Fe2HfSi was measured at a spectrum of pressures and temperatures (ranging from 150 to 1200 K). It shows how many conduction-ready electrons are available. A semiconductor's band structure determines its electrical conductivity, with the most important factors being the kind and concentration of carriers, as well as the band gap.44 Fig. 6(b) illustrates that a rise in temperature and pressure causes an increase in electrical conductivity. In the pressure range of 0–30 GPa, there is an exponential increase in conductivity as temperature rises. Despite the fact that electrical conductivity increases with pressure from 0 to 15 GPa, the maximum value of electrical conductivity is found at 30 GPa and 1200 K. Where there will concentration high results in high electrical conductivity. As per the reported data with an increase in pressure, electrical conductivity goes high for that material. Electrical conductivity is shown in Fig. 7(d)–(f) in relation to chemical potential while pressures range from 0 to 30 GPa. The graph shows that the alloy is very effective in making TE systems work well. At zero chemical potential, the electrical conductivity is at its lowest, and it goes up as the chemical potential goes up. For n-type doping, the highest level of electrical conductivity is seen. The phase of the material changes because the pressure goes up as the temperature goes up.
Furthermore, the electronic thermal conductivity of a material is an important thermoelectric property that fluctuates with chemical potential and affects the material's TE response. It is shown in Fig. 7(c) that how the predicted electronic thermal conductivity changes with the change in chemical potential (μ = μ − EF) at various temperatures. It can be seen from the graph that as the temperature rises, the thermal conductivity of electrical components increases significantly. At 1200 Kelvin, κe/τ has attained its maximum value, whereas, at 300 Kelvin, it has dropped to its minimum. Even though there are no theoretical or experimental numbers to compare it to, the present change in the electronic thermal conductivity with chemical potential demonstrates that it is comparable to other Heusler alloys.45,46 However, it is based on the concentration of electronic contributions. The electronic part of thermal conductivity is under consideration because of the omission of its lattice part due to high-temperature ranges.
Power factor is a dynamic tool that shows how well TE materials work. It is written as S2σ. For a huge power factor to be reached, both σ and S must be high. At pressures from 0 to 30 GPa, the effect of chemical potential between −2 eV and 2 eV on the power factor was looked at. The results are shown in Fig. 7(j)–(l). Around −1.57 GPa, the PF goes up very quickly, and slight changes have been seen as the pressure goes from 0 to 30 GPa, but it does not go any higher than 4 GPa. Nonetheless, the best PF could be reached with p-type doping carriers. Although for the n-type doping carrier, a PF as large as p-type is unattainable, and the optimal value is challenging to achieve experimentally.47 Fig. 7(e) shows the variation of charge carrier concentration with temperature. The increasing trend suggests charge carrier concentration increases with an increase in temperature and pressure. The figure of merit (ZT) used to determine the efficiency of TE materials is based on four variables: absolute temperature, electrical conductivity, Seebeck coefficient, and thermal conductivity. A dimensionless number that has a direct relationship with the S and an inverse relation with K. Materials that have a high S value and low K values are more efficient. The largest ZT value reported is 0.80 at 15 GPa. At 30 GPa, rather than 0 or 15 GPa, the ZT value of the proposed compound is larger at ambient temperature, as observed in Fig. 6(e). As shown in Fig. 7(m)–(o), ZT climbs fast as the chemical potential approaches its maximum value. At a specific chemical potential, it is stable over a broad range of chemical potentials before rapidly dissipating. ZT appears to be close to unity (∼1) for the investigated material at all tested temperatures. In n-type regions, however, this response to a higher ZT is more prominent.
4. Conclusions
Fe2HfSi pressure-induced calculations were performed using density functional theory with FP-LAPW and the modified Becke–Johnson potential (TB-mBJ). Thermal, chemical, and pressure-dependent properties of the material were taken into account in the calculation of the band structure and density of states. The stability of the cubic phase with the Fm![[3 with combining macron]](https://www.rsc.org/images/entities/char_0033_0304.gif) m space group was supported by optimization. Pressure has a tendency to widen the band-gap. At 30 GPa, band gaps can reach a maximum of 0.98 eV. A linear increase in pressure to 30 GPa results in a decrease in the static dielectric constant, plasma frequency, and static refractive index. In spite of this, pressure-induced increases in optical bandgap are consistent with Penn's model. The positive refractive index indicates that Fe2HfSi has not become metamaterial at this pressure. Under extreme pressure, the material shows no stability in terms of plasma frequency, which has been found to rise in frequency as pressure increases. The suggested results could be extremely valuable in understanding and developing optoelectronic devices based on Fe2HfSi under severe pressure settings. The power factor and Seebeck coefficient of Fe2HfSi are precisely determined by the material's unique composition. As a result, understanding how temperature and pressure affect ZT's maximum value will be critical in the coming years. Understanding the doping contribution of half of Heusler alloys requires an understanding of chemical potential dependence. This type of material is in high demand for TE harvesting technologies.
m space group was supported by optimization. Pressure has a tendency to widen the band-gap. At 30 GPa, band gaps can reach a maximum of 0.98 eV. A linear increase in pressure to 30 GPa results in a decrease in the static dielectric constant, plasma frequency, and static refractive index. In spite of this, pressure-induced increases in optical bandgap are consistent with Penn's model. The positive refractive index indicates that Fe2HfSi has not become metamaterial at this pressure. Under extreme pressure, the material shows no stability in terms of plasma frequency, which has been found to rise in frequency as pressure increases. The suggested results could be extremely valuable in understanding and developing optoelectronic devices based on Fe2HfSi under severe pressure settings. The power factor and Seebeck coefficient of Fe2HfSi are precisely determined by the material's unique composition. As a result, understanding how temperature and pressure affect ZT's maximum value will be critical in the coming years. Understanding the doping contribution of half of Heusler alloys requires an understanding of chemical potential dependence. This type of material is in high demand for TE harvesting technologies.
Conflicts of interest
There are no conflicts to declare.Acknowledgements
The authors express their gratitude to Princess Nourah bint Abdulrahman University Researchers Supporting Project number (PNURSP2023R61), Princess Nourah bint Abdulrahman University, Riyadh, Saudi Arabia.References
- T. M. Tritt and M. A. Subramanian, Thermoelectric materials, phenomena, and applications: a bird's eye view, MRS Bull., 2006, 31, 188–198 CrossRef.
- C. J. Vineis, A. Shakouri, A. Majumdar and M. G. Kanatzidis, Nanostructured thermoelectrics: big efficiency gains from small features, Adv. Mater., 2010, 22, 3970–3980 CrossRef CAS PubMed.
- H. J. Goldsmid and R. W. Douglas, The use of semiconductors in thermoelectric refrigeration, Br. J. Appl. Phys., 1954, 5, 386 CrossRef.
- Y. Lee, S.-H. Lo, J. Androulakis, C.-I. Wu, L.-D. Zhao, D.-Y. Chung, T. P. Hogan, V. P. Dravid and M. G. Kanatzidis, High-performance tellurium-free thermoelectrics: all-scale hierarchical structuring of p-Type PbSe–MSe Systems (M= Ca, Sr, Ba), J. Am. Chem. Soc., 2013, 135, 5152–5160 CrossRef CAS PubMed.
- Y.-L. Pei and Y. Liu, Electrical and thermal transport properties of Pb-based chalcogenides: PbTe, PbSe, and PbS, J. Alloys Compd., 2012, 514, 40–44 CrossRef CAS.
- G. Rogl, A. Grytsiv, F. Failamani, M. Hochenhofer, E. Bauer and P. Rogl, Attempts to further enhance ZT in skutterudites via nano-composites, J. Alloys Compd., 2017, 695, 682–696 CrossRef CAS.
- X. Shi, J. Yang, J. R. Salvador, M. Chi, J. Y. Cho, H. Wang, S. Bai, J. Yang, W. Zhang and L. Chen, Multiple-filled skutterudites: high thermoelectric figure of merit through separately optimizing electrical and thermal transports, J. Am. Chem. Soc., 2011, 133, 7837–7846 CrossRef CAS PubMed.
- L. Huang, Q. Zhang, B. Yuan, X. Lai, X. Yan and Z. Ren, Recent progress in half-Heusler thermoelectric materials, Mater. Res. Bull., 2016, 76, 107–112 CrossRef CAS.
- S. J. Poon, D. Wu, S. Zhu, W. Xie, T. M. Tritt, P. Thomas and R. Venkatasubramanian, Half-Heusler phases and nanocomposites as emerging high-ZT thermoelectric materials, J. Mater. Res., 2011, 26, 2795–2802 CrossRef CAS.
- J. Wei and G. Wang, Thermoelectric and optical properties of half-Heusler compound TaCoSn: a first-principle study, J. Alloys Compd., 2018, 757, 118–123 CrossRef CAS.
- W. Xie, A. Weidenkaff, X. Tang, Q. Zhang, J. Poon and T. M. Tritt, Recent advances in nanostructured thermoelectric half-Heusler compounds, Nanomaterials, 2012, 2, 379–412 CrossRef CAS PubMed.
- S. Chen and Z. Ren, Recent progress of half-Heusler for moderate temperature thermoelectric applications, Mater. Today, 2013, 16, 387–395 CrossRef CAS.
- J.-W. G. Bos and R. A. Downie, Half-Heusler thermoelectrics: a complex class of materials, J. Phys.: Condens. Matter, 2014, 26, 433201 CrossRef PubMed.
- T. Zhu, C. Fu, H. Xie, Y. Liu and X. Zhao, High efficiency half-Heusler thermoelectric materials for energy harvesting, Adv. Energy Mater., 2015, 5, 1500588 CrossRef.
- I. Galanakis, P. H. Dederichs and N. Papanikolaou, Slater-Pauling behavior and origin of the half-metallicity of the full-Heusler alloys, Phys. Rev. B: Condens. Matter Mater. Phys., 2002, 66, 174429 CrossRef.
- S. Yousuf and D. C. Gupta, Insight into half-metallicity, spin-polarization and mechanical properties of L21 structured MnY2Z (Z= Al, Si, Ga, Ge, Sn, Sb) Heusler alloys, J. Alloys Compd., 2018, 735, 1245–1252 CrossRef CAS.
- C. Felser, G. H. Fecher and B. Balke, Spintronics: a challenge for materials science and solid-state chemistry, Angew. Chem., Int. Ed., 2007, 46, 668–699 CrossRef CAS PubMed.
- H. Luo, Z. Zhu, L. Ma, S. Xu, H. Liu, J. Qu, Y. Li and G. Wu, Electronic structure and magnetic properties of Fe2YSi (Y= Cr, Mn, Fe, Co, Ni) Heusler alloys: a theoretical and experimental study, J. Phys. D: Appl. Phys., 2007, 40, 7121 CrossRef CAS.
- S. A. Sofi, S. Yousuf, T. M. Bhat, S. Singh, A. Q. Seh, M. Nabi, S. A. Khandy, S. A. Mir, N. A. Ganie and R. A. Mir, Investigation of pressure induced phase transition and thermoelectrics of semiconducting Fe2ZrSi, in AIP Conference Proceedings, AIP Publishing LLC, 2020, p. 30346 Search PubMed.
- S. A. Khandy, I. Islam, D. C. Gupta, R. Khenata and A. Laref, Lattice dynamics, mechanical stability and electronic structure of Fe-based Heusler semiconductors, Sci. Rep., 2019, 9, 1–8 CrossRef CAS PubMed.
- S. Masuda, K. Tsuchiya, J. Qiang, H. Miyazaki and Y. Nishino, Effect of high-pressure torsion on the microstructure and thermoelectric properties of Fe2VAl-based compounds, J. Appl. Phys., 2018, 124, 35106 CrossRef.
- S. A. Sofi and D. C. Gupta, Investigation of high pressure and temperature study of thermo-physical properties in semiconducting Fe2ZrSi Heusler, Phys. B, 2020, 577, 411792 CrossRef CAS.
- P. Blaha, K. Schwarz, G. K. H. Madsen, D. Kvasnicka and J. Luitz, wien2k, An Augmented Plane Wave+ Local Orbitals Program for Calculating Crystal Properties, 2001, vol. 60 Search PubMed.
- J. P. Perdew, K. Burke and M. Ernzerhof, Generalized gradient approximation made simple, Phys. Rev. Lett., 1996, 77, 3865 CrossRef CAS PubMed.
- F. Tran and P. Blaha, Accurate band gaps of semiconductors and insulators with a semilocal exchange-correlation potential, Phys. Rev. Lett., 2009, 102, 226401 CrossRef PubMed.
- G. K. H. Madsen and D. J. Singh, BoltzTraP. A code for calculating band-structure dependent quantities, Comput. Phys. Commun., 2006, 175, 67–71 CrossRef CAS.
- F. D. Murnaghan, Proc. Natl. Acad. Sci. U. S. A., 1994, 244–247 Search PubMed.
- T. Gasi, V. Ksenofontov, J. Kiss, S. Chadov, A. K. Nayak, M. Nicklas, J. Winterlik, M. Schwall, P. Klaer and P. Adler, Iron-based Heusler compounds Fe 2 Y Z: Comparison with theoretical predictions of the crystal structure and magnetic properties, Phys. Rev. B: Condens. Matter Mater. Phys., 2013, 87, 64411 CrossRef.
- J. Winterlik, G. H. Fecher, B. Balke, T. Graf, V. Alijani, V. Ksenofontov, C. A. Jenkins, O. Meshcheriakova, C. Felser and G. Liu, Electronic, magnetic, and structural properties of the ferrimagnet Mn 2 CoSn, Phys. Rev. B: Condens. Matter Mater. Phys., 2011, 83, 174448 CrossRef.
- L. Wang, Y. Cao, C. Zhang, Y. Xu and S. Zhou, Theoretical study of structural, mechanical, electronic, magnetic and thermodynamic properties of Cu2MnAl-type Fe2YAl (Y= Cr, Mo and W) full-Heusler alloys, Mater. Sci. Eng., B, 2022, 278, 115639 CrossRef CAS.
- M. Jamal, M. Bilal, I. Ahmad and S. Jalali-Asadabadi, IRelast package, J. Alloys Compd., 2018, 735, 569–579 CrossRef CAS.
- O. Anderson, E. Schreiber and N. Soga, Elastic Constants and Their Measurements, 1973 Search PubMed.
- M. Meinert, M. P. Geisler, J. Schmalhorst, U. Heinzmann, E. Arenholz, W. Hetaba, M. Stöger-Pollach, A. Hütten and G. Reiss, Experimental realization of a semiconducting full-Heusler compound: Fe 2 TiSi, Phys. Rev. B: Condens. Matter Mater. Phys., 2014, 90, 85127 CrossRef CAS.
- J. Shiomi, K. Esfarjani and G. Chen, Thermal conductivity of half-Heusler compounds from first-principles calculations, Phys. Rev. B: Condens. Matter Mater. Phys., 2011, 84, 104302 CrossRef.
- D. Behera, R. Sharma, H. Ullah, H. S. Waheed and S. K. Mukherjee, Electronic, optical, and thermoelectric investigations of Zintl phase AAg2Se2 (A= Sr, Ba) compounds: A first first-principles approach, J. Solid State Chem., 2022, 123259 CrossRef CAS.
- D. Behera and S. K. Mukherjee, Theoretical Investigation of the Lead-free K2InBiX6 (X= Cl, Br) Double Perovskite Compounds Using First Principle Calculation, JETP Lett., 2022, 1–10 Search PubMed.
- V. Sharma and G. Pilania, Electronic, magnetic, optical and elastic properties of Fe2YAl (Y= Ti, V and Cr) using first principles methods, J. Magn. Magn. Mater., 2013, 339, 142–150 CrossRef CAS.
- M. Ahmad, G. Murtaza, R. Khenata, S. Bin Omran and A. Bouhemadou, Structural, elastic, electronic, magnetic and optical properties of RbSrX (C, SI, Ge) half-Heusler compounds, J. Magn. Magn. Mater., 2015, 377, 204–210 CrossRef CAS.
- G. Surucu, Investigation of structural, electronic, anisotropic elastic, and lattice dynamical properties of MAX phases borides: An Ab-initio study on hypothetical M2AB (M= Ti, Zr, Hf; A= Al, Ga, In) compounds, Mater. Chem. Phys., 2018, 203, 106–117 CrossRef CAS.
- D. Behera, M. Manzoor, M. W. Iqbal, S. Lakra and S. K. Mukherjee, Revealing Excellent Electronic, Optical, and Thermoelectric Behavior of EU Based Euag2y2 (Y= S/Se): For Solar Cell Applications, Comput. Condens. Matter, 2022, 32, e00723 CrossRef.
- Y. O. Ciftci and M. Evecen, First principle study of structural, electronic, mechanical, dynamic and optical properties of half-Heusler compound LiScSi under pressure, Phase Transitions, 2018, 91, 1206–1222 CrossRef CAS.
- T. M. Bhat and D. C. Gupta, Robust thermoelectric performance and high spin polarisation in CoMnTiAl and FeMnTiAl compounds, RSC Adv., 2016, 6, 80302–80309 RSC.
- S. Sharma and S. K. Pandey, Applicability of two-current model in understanding the electronic transport behavior of inverse Heusler alloy: Fe2CoSi, Phys. Lett. A, 2015, 379, 2357–2361 CrossRef CAS.
- A. Jayaraman, Diamond anvil cell and high-pressure physical investigations, Rev. Mod. Phys., 1983, 55, 65 CrossRef CAS.
- K. Kaur, TiPdSn: A half Heusler compound with high thermoelectric performance, Europhys. Lett., 2017, 117, 47002 CrossRef.
- T. Wu, W. Jiang, X. Li, Y. Zhou and L. Chen, Thermoelectric properties of p-type Fe-doped TiCoSb half-Heusler compounds, J. Appl. Phys., 2007, 102, 103705 CrossRef.
- J. L. Baker, R. S. Kumar, C. Park, N. Velisavljevic and A. Cornelius, Compressibility and thermoelectric behavior of TiCoSb half-Heusler compound at high pressures, Intermetallics, 2018, 95, 137–143 CrossRef CAS.
| This journal is © The Royal Society of Chemistry 2023 |

