 Open Access Article
Copper(II) and cobalt(III) Schiff base complexes with hydroxy anchors as sensitizers in dye-sensitized solar cells (DSSCs)†
Chiteri Gautama,
Devyani Srivastava a,
Gabriele Kociok-Köhn
 b,
Suresh W. Gosavic,
Vinod K. Sharmaa,
Ratna Chauhan*d,
Dattatray J. Late
 e,
Abhinav Kumar
 *a and
Mohd. Muddassir
 f
f
aDepartment of Chemistry, Faculty of Science, University of Lucknow, Lucknow 226 007, India. E-mail: abhinavmarshal@gmail.com
bMaterial and Chemical Characterisation Facility (MC2), University of Bath, Bath, BA27AY, UK
cDepartment of Physics, Faculty of Science, Savitribai Phule Pune University, Pune 411007, India
dDepartment of Environmental Science, Savitribai Phule Pune University, Pune 411007, India. E-mail: ratnasingh.bhu@gmail.com
eCentre for Nanoscience and Nanotechnology Amity University Maharashtra, Mumbai-Pune Expressway, Bhatan, Post Somatne, Panvel, Mumbai, Maharashtra 410206, India
fDepartment of Chemistry, College of Sciences, King Saud University, Riyadh 11451, Saudi Arabia
First published on 20th March 2023
Abstract
Two Schiff base complexes of copper(II) and cobalt(III) having the formulae [CuL2] (Cu-Sal) and [CoL3] (Co-Sal) (HL = 2-(((2-hydroxyethyl)imino)methyl)phenol) have been synthesized and characterized microanalytically, spectroscopically and in the case of Cu-Sal using single crystal X-ray diffraction technique. The single crystal X-ray analysis reveals a square planar geometry around Cu(II) satisfied by phenoxide oxygen and imine nitrogen of the L− ligand to generate a six membered chelate ring. The solid state structure of Cu-Sal is satisfied by varied intermolecular non-covalent interactions. The nature of these interactions has been addressed with the aid of Hirshfeld surface analysis. Both compounds have been used as sensitizers in TiO2 based dye sensitized solar cells (DSSCs) and the DSSC experiments revealed that Co-Sal offers better photovoltaic performance in comparison to Cu-Sal. The Co-Sal exhibited a Jsc of 9.75 mA cm−2 with a Voc of −0.648 V, incident photon to current conversion efficiency (IPCE) of 57% and η of 3.84%. The relatively better photovoltaic performance of Co-Sal could be attributed to better light absorption and dye loading than that of Cu-Sal.
1 Introduction
During the past few decades, exponential growth in population and rapid industrialization have led to the decline in conventional non-renewable sources of energy.1–5 Considering this and facing an energy crisis, several alternative renewable energy sources have to be searched and developed. Amongst several non-conventional sources of energy, dye-sensitized solar cells (DSSCs), sometimes regarded as third-generation photovoltaics, are gaining importance.1–5 The increasing interest in this class of photovoltaic systems is due to their advantages such as simple fabrication processes in ambient conditions, semi-transparent and colorful appearances, possible plasticity, and high efficiencies.6 The related power conversion efficiencies (PCEs) of various solar energy harvesting units continue to increase, targeting the Shockley–Queisser limit.7,8 The efficiency of dye-sensitized solar cells (DSSCs) was improved significantly by Gratzel and O'Regan.9 This impressive improvement in solar-to-electrical conversion efficiency has been achieved through device optimizations, use of transition metal redox couples in combination with suitable dyes, and low viscosity solvents, such as acetonitrile.10–12 Due to direct conversion of sunlight-to-electrical energy, dye-sensitized solar cells (DSSCs) are relatively low-priced and highly-processable photovoltaic devices.13–22 Their low cost and easy fabrication techniques can expand the commercialization and integration of these photovoltaic devices.23 Hence, this next generation commercial solar cells are one of the most promising candidates and have attracted significant interest in this field.24 Hence, from this viewpoint DSSCs can be the apt cost-efficient candidates with multifarious manufacturing possibilities and short energy-payback times.25All DSSCs are comprised of five primary components: a counter electrode; a transparent electrode enabling photoexcitation of the dye; a photoexcitable dye; a conductive semiconductor, and one or more redox mediators.26–46 Amongst all these components, the selection of a suitable photoexcitable dye plays a crucial role in deciding the overall photovoltaic performance of a DSSC set-up. Currently, varied coordination compounds especially ruthenium based N719, N3 dyes and their analogues have been used as possible sensitizers in DSSCs. Their selection can be accredited to their assorted metal-to-ligand charge transitions (MLCT), peculiar photo-excited stability and photo-physics.26–46 Due to the high cost of ruthenium salts, researchers are in quest for other alternatives to develop economical and abundant metal complexes as sensitizers.26–46 Amongst 3d transition series elements, Fe(II) ferrocene derivatives were found to behave like photosensitizer in DSSCs. In view of this, numerous homo- and heteroleptic complexes containing transition- or main group metal centers have been prepared using ferrocene-dithiocarbamates, dppf appended dithiolates and different heterocyclic ferrocene derivatives which were utilized in DSSCs.47 Apart from ferrocene the applicability of other 3d transition series elements as sensitizers have been explored26–46 amongst which the copper and cobalt based complexes have played a key role in uplifting the photovoltaic performance.
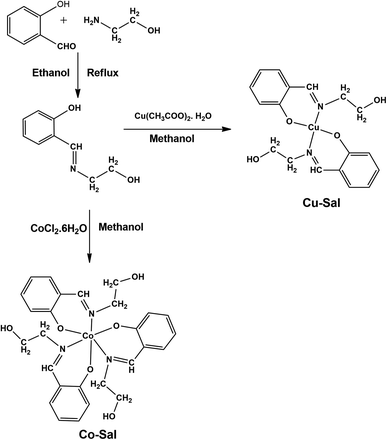
In our quest for new economical and higher performance sensitizers, we synthesized two Schiff base complexes of copper(II) and cobalt(III) viz. [CuL2] (Cu-Sal) and [CoL3] (Co-Sal) (HL = 2-(((2-hydroxyethyl)imino)methyl)phenol) and studied their use as sensitizers in DSSCs.
2 Experimental
2.1 Materials and methods
All synthetic procedures were carried out under ambient atmosphere. All solvents used for syntheses were distilled and dried prior to use by adopting standard methods. Fourier transform infra-red spectroscopy was performed using KBr discs on Shimadzu IR Affinity-1S spectrometer. 1H and 13C NMR spectroscopy were performed using Bruker Avance IIIHD NMR spectrometer using TMS as an internal standard. Microanalyses for both sensitizers were performed on a “Model CE-440 CHN analyser”, while UV-Vis spectral data in methanol solution were collected on a SPECORD210 PLUS-BU. Mass spectrometry was performed using Bruker QTOF mass spectrometer.2.2 Syntheses
2.2.1.1 Characterization data. Yellow oily solid. 1H NMR (DMSO-d6, 300 MHz, δ): 8.50 (s, 1H, CH
![[double bond, length as m-dash]](https://www.rsc.org/images/entities/char_e001.gif) N), 7.67 (d, 1H, C6H4), 7.43 (m, 1H, C6H4), 7.19 (m, 1H, C6H4), 7.11 (d, 1H, C6H4), 2.81 (s, 4H, –CH2). 13C NMR (DMSO-d6, 75.45 MHz, δ): 168.1, 162.1, 137.2, 123.8, 119.9, 118.1, 62.5, 58.2.
N), 7.67 (d, 1H, C6H4), 7.43 (m, 1H, C6H4), 7.19 (m, 1H, C6H4), 7.11 (d, 1H, C6H4), 2.81 (s, 4H, –CH2). 13C NMR (DMSO-d6, 75.45 MHz, δ): 168.1, 162.1, 137.2, 123.8, 119.9, 118.1, 62.5, 58.2.
2.2.2.1 Characterization data. Olive green; yield 0.276 g, 70.58%; m.p. 172 °C; IR (KBr, cm−1): 3328 (–OH), 1623 (C
![[double bond, length as m-dash]](https://www.rsc.org/images/entities/char_e001.gif) N), 1476 (–CH2) 2918 (Ar). Elemental analysis C18H20CuN2O4 (%): C, 55.16; H, 5.14; N, 7.15 found C, 55.82; H, 5.44; N, 7.45. ESI-MS: 389.0812 (C18H18CuN2O4).
N), 1476 (–CH2) 2918 (Ar). Elemental analysis C18H20CuN2O4 (%): C, 55.16; H, 5.14; N, 7.15 found C, 55.82; H, 5.44; N, 7.45. ESI-MS: 389.0812 (C18H18CuN2O4).
2.2.3.1 Characterization data. Dark red-brown; yield 0.173 g, 62.90%; m.p. 80 °C; IR (KBr, cm−1): 3352 (–OH), 1647 (C
![[double bond, length as m-dash]](https://www.rsc.org/images/entities/char_e001.gif) N), 1442 (–CH2). Elemental analysis C27H30CoN3O6 (%): C, 58.80; H, 5.48; N, 7.62. Found C, 59.18; H, 5.98; N, 7.93. ESI-MS 549.1467 (C27H30CoN3O6).
N), 1442 (–CH2). Elemental analysis C27H30CoN3O6 (%): C, 58.80; H, 5.48; N, 7.62. Found C, 59.18; H, 5.98; N, 7.93. ESI-MS 549.1467 (C27H30CoN3O6).
2.3 Crystallography
Intensity data for Cu-Sal were collected at 150(2) K on a Rigaku Xcalibur, EosS2 single crystal diffractometer using graphite monochromated Mo Kα radiation (λ = 0.71073 Å). Unit cell determination, data collection and data reduction were performed using the CrysAlisPro software.48 The structures were solved with SHELXT and refined by a full-matrix least-squares procedure based on F2 (SHELXL-2018/3).49 All non-hydrogen atoms were refined anisotropically. Hydrogen atoms were placed onto calculated positions and refined using a riding model.![[thin space (1/6-em)]](https://www.rsc.org/images/entities/char_2009.gif) 625, independent reflections 3859 [R(int) = 0.0294], GOF 1.024, final R indices [I > 2sigma(I)] R1 = 0.0330, wR2 = 0.0752, R indices (all data) R1 = 0.0480, wR2 = 0.0826 largest diff. peak and hole 0.287 and −0.464 e Å−3 CCDC no. 2202408.
625, independent reflections 3859 [R(int) = 0.0294], GOF 1.024, final R indices [I > 2sigma(I)] R1 = 0.0330, wR2 = 0.0752, R indices (all data) R1 = 0.0480, wR2 = 0.0826 largest diff. peak and hole 0.287 and −0.464 e Å−3 CCDC no. 2202408.2.4 Fabrication of DSSCs
For sandwich assembly of the DSSC, FTO glass plates (F-doped SnO2: purchased from Pilkington. Co. Ltd. 8 Ω/γ, cleaned in ethanol in an ultrasonic bath for 30 min) were used to prepare photo- and counter-electrodes. The TiO2 thin films were prepared using the doctor-blade technique by applying a TiO2 paste (Ti-Nanoxide T, Solaronix) onto the FTO substrate followed by calcination at 450 °C for 30 min. For the preparation of photo-anodes the annealed TiO2 thin films (∼6 μm) were immersed into the Co-Sal and Cu-Sal dye solution (1![[thin space (1/6-em)]](https://www.rsc.org/images/entities/char_2009.gif) :
:![[thin space (1/6-em)]](https://www.rsc.org/images/entities/char_2009.gif) 1 ratio of dichloromethane
1 ratio of dichloromethane![[thin space (1/6-em)]](https://www.rsc.org/images/entities/char_2009.gif) :
:![[thin space (1/6-em)]](https://www.rsc.org/images/entities/char_2009.gif) ethanol solution of Co-Sal and Cu-Sal dyes) for 6 h, then washing them with dichloromethane followed by ethanol and drying at room temperature. The Pt-counter-electrodes were prepared by screen printing of Pt catalyst (Solaronix) onto FTO and then sintered at 400 °C for 30 min. For the sandwich cell assembly, the dye-adsorbed TiO2 photoelectrodes and Pt counter-electrodes were stuck together in a face to face manner which is sealed from three sides by using a hot-melt sealant film (Solaronix) as a spacer between the electrodes by heating it at 80 °C. A drop of electrolytic solution (0.05 M iodine, 0.05 M LiI and 0.5 M 4-tert-butylpyridine in acetonitrile) is then placed on the remaining open side of the cell assembly which is driven inside the cell by capillary action. Finally, this side is closed with araldite. The external connections on both electrodes are made of copper wire, silver paste and araldite.
ethanol solution of Co-Sal and Cu-Sal dyes) for 6 h, then washing them with dichloromethane followed by ethanol and drying at room temperature. The Pt-counter-electrodes were prepared by screen printing of Pt catalyst (Solaronix) onto FTO and then sintered at 400 °C for 30 min. For the sandwich cell assembly, the dye-adsorbed TiO2 photoelectrodes and Pt counter-electrodes were stuck together in a face to face manner which is sealed from three sides by using a hot-melt sealant film (Solaronix) as a spacer between the electrodes by heating it at 80 °C. A drop of electrolytic solution (0.05 M iodine, 0.05 M LiI and 0.5 M 4-tert-butylpyridine in acetonitrile) is then placed on the remaining open side of the cell assembly which is driven inside the cell by capillary action. Finally, this side is closed with araldite. The external connections on both electrodes are made of copper wire, silver paste and araldite.
2.5 Characterization of DSSCs
The photoelectrochemical performance characteristics (short circuit current Jsc (mA cm−2), open-circuit voltage Voc (V), fill factor ff and overall conversion efficiency η) were measured under illumination with a 1000 W Xenon lamp (Oriel 91193) using a Kiethley Model 2400. The light intensity was confirmed to be homogenous over an 8 × 8 inch2 area by calibration with a Si solar cell for 1 sun light intensity (AM 1.5G, 100 mW cm−2). Accidental increase of temperature inside the cell was prevented by using an electric fan. Incident photon-to-current conversion efficiency (IPCE) for the dyes were measured as a function of wavelength from 400–700 nm (PV measurement Inc.) using a standard tungsten-halogen lamp as monochromatic light and a broadband bias light for approximating 1 sun light intensity.The electron transport properties were investigated using electrochemical impedance spectroscopy (EIS) with 10 mV alternative signal in the frequency range of 10−2 to 105 Hz and were performed on a CH 660C electrochemical analyzer (CH Instruments, Shanghai, China) with a two electrodes configuration. The photoanode was used as working electrode and the Pt electrode as counter electrode. The electron transport properties were investigated using electrochemical impedance spectroscopy (EIS) with 10 mV alternative signal in the frequency range of 10−2 to 105 Hz.
3 Results and discussion
3.1 Synthesis
The Cu(II) and Co(III) based sensitizers were synthesized by condensing salicylaldehyde and ethanolamine in equimolar ratio, which on reacting with Cu(II) and Co(II) in respective ratio in methanol yielded the corresponding complexes (Scheme 1). All these compounds were stable and characterized by microanalyses, FT-IR, and in one case by single crystal X-ray diffraction.The FTIR spectral data reveal that the bands at 3354 cm−1 and 3328 cm−1 signify the presence of hydroxyl groups in the Co-Sal and Cu-Sal complexes, respectively whereas the bands in the range of ∼1620–1650 cm−1 are due to the –C![[double bond, length as m-dash]](https://www.rsc.org/images/entities/char_e001.gif) N (imine group) in both complexes.
N (imine group) in both complexes.
3.2 Molecular structure and supramolecular architecture
The Cu-Sal crystallizes in the monoclinic space group P21/c with two independent molecules in the unit cell. The immediate geometry around Cu(II) in Cu-Sal is square planar, which is defined by two phenolic oxygen centers O1 and O1′ and two imine nitrogen atoms N1 and N1′ of two 2-(((2-hydroxyethyl)imino)methyl)phenoxy (L−) ligands. The two L− ligands form six membered chelate rings and the Cu1 is present at the center of inversion in the centrosymmetric structure (Fig. 1). The Cu–O1 and Cu–N1 bond distances are 1.8778(14) and 2.0071(16) Å, respectively. The bite angle O(1)–Cu(1)–N(1) is 91.96(6), while the N(1)#1–Cu(1)–N(1) and O(1)–Cu(1)–O(1)#1 are exactly 180.0°. Also, as evident from the structure, the alcoholic oxygen O2 remains protonated after complexation with the Cu(II).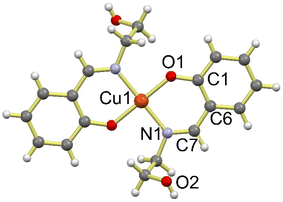 | ||
| Fig. 1 Perspective view of the molecular geometry of Cu-Sal. Only one molecule present in the asymmetric unit is presented. | ||
The solid state framework of Cu-Sal is stabilized by several interactions amongst which the most important interaction is the O4–H4A⋯O2 intermolecular hydrogen bonding interaction that is operating between the two independent molecules comprising of the Cu1 and Cu2 centers in the asymmetric unit (Fig. 2). The O4–H4A⋯O2 interaction is 2.716 Å long with almost linear ∠O4–H4A⋯O2 169.74°, which indicates the strong nature of these hydrogen bonds. These hydrogen bonds propagate all along the three axes to generate a supramolecular coordination network (Fig. 2). In addition to the O–H⋯O interactions, Cu-Sal also forms weak intermolecular C–H⋯π interactions between aromatic C5–H5⋯C5 centers with an interaction distance of 2.727 Å and an angle of 169.75° to form a one-dimensional chain like framework (Fig. 3).
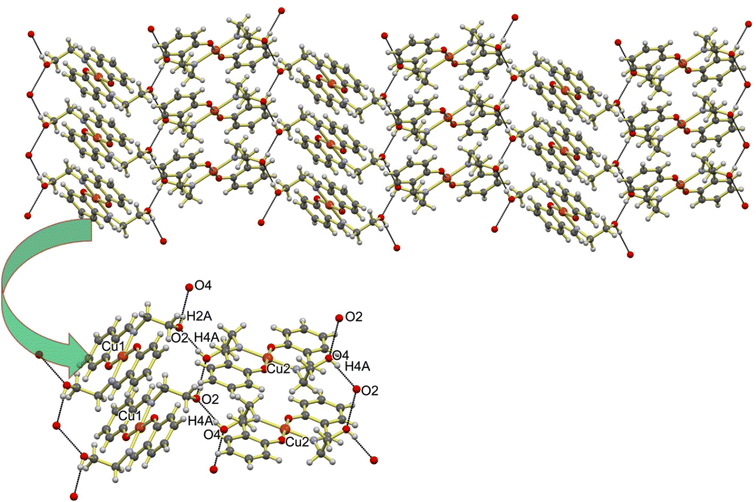 | ||
| Fig. 2 Supramolecular architecture of Cu-Sal stabilized by intermolecular H–O⋯H hydrogen bonding interactions. | ||
3.3 Hirshfeld surface analysis
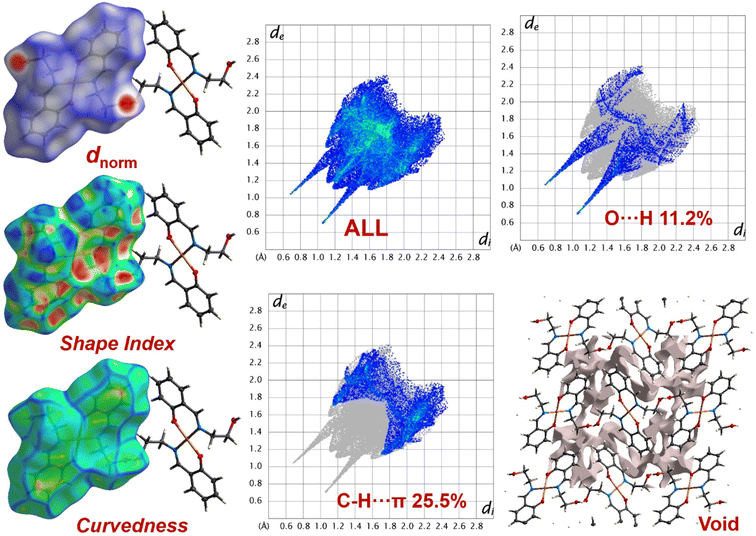
The Hirshfeld surfaces50–52 for Cu-Sal are shown in Fig. 4. The dnorm surfaces for the complex are mapped over a dnorm range of −0.5 to 1.5 Å. The weak non-covalent interactions discussed in the X-ray crystallography section summarize effectively as the deep red circular depressions in the dnorm surfaces indicating strong non-covalent interactions. The dominant O–H⋯O interactions are existing in Hirshfeld surface plots as the red shaded area. The small area and light colour on the surface represents weaker and C–H⋯π interactions.Also, in the fingerprint plots50–52 the complementary regions are shown, where one molecule acts as donor (de > di) and the other as acceptor (de < di) and have been decomposed to highlight particular atom-pair close contacts. In Cu-Sal, the O–H⋯O and C–H⋯π intermolecular interactions display distinct paired spike feature in their respective decomposed 2D fingerprint plots. The O–H⋯O interaction appears in the region of 0.6 Å < (de + di) < 2.4 Å with 11.2% contribution as light sky-blue pattern in full fingerprint 2D plots, while the C–H⋯π intermolecular interaction appears between 1.1 Å < (de + di) < 2.3 Å with 25.5% contribution. In the shape index plot that is sensitive to small variation in molecular shape due to irregular deformation induced from neighbouring crystalline environment, also indicates the mode of packing operating in the crystal. The surface of the shape index plot consists of several grooves and bumps and were constructed between −1 to 1. The reddish yellow hollow sections on the shape index plot governs the strong interactions in the crystal and is under the strong influence of the neighbouring environment, which is involved in supramolecular interaction. Apart from this, the bump like regions justified weak interactions or interactions least affected by the neighbouring crystalline environment in both compounds (Fig. 4). The surface curvedness, which is regarded as the function of RMS curvature of the surface has also been constructed for both cluster compounds. A closer inspection of the surface in Cu-Sal indicated yellow patches within the flat green surfaces. That reveals the isoenergetic supramolecular interactions in Cu-Sal (Fig. 4). For both compounds the crystal lattice void space has been assessed with standard void cluster parameter “unit cell + 5.0 Å” (Fig. 4). In the Cu-Sal lattice the void volume was 159.10 Å3 with a void area of 596.16 Å2 with asphericity and globular indices of 0.238 and 0.209 units, respectively. The larger magnitude of the void volume is a feature of the presence of weak non-covalent interactions in the single crystal supramolecular architecture. Also, the smaller globular index indicates that the supramolecular architecture in Cu-Sal is built-up by weak non-covalent interactions.
3.4 Optical properties
Fig. 5 presents the UV-vis absorption spectra for Co-Sal and Cu-Sal recorded in dichloromethane which display absorption bands in the visible range between 400–900 nm which arises because of the d–d transition. For Cu-Sal an absorption band appear from 450 to 550 nm in visible region, whereas for Co-Sal a broad band between 400–750 nm can be observed. The spectral response of Co-Sal reveals its superior light-harvesting ability. Both complexes display bands in the visible region, therefore they can be utilized as sensitizers in dye-sensitized solar cells.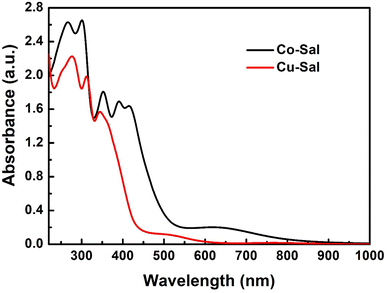 | ||
| Fig. 5 Electronic absorption spectra for the sensitizers recorded in 1 × 10⁻⁴ M dichloromethane solutions. | ||
3.5 Photovoltaic performance of DSSCs
The photovoltaic properties of these dyes were studied by fabricating the DSSCs under identical conditions. The subsequent photovoltaic parameters are listed in Table 1, calculated J–V curves of the DSSCs are shown in Fig. 6a. From the data it can be concluded that the highest PCE for the sensitization of the dyes in DSSC based on Co-Sal is 3.84%, with a Voc is 648 mV, Jsc is 9.75 mA cm−2, and FF is 61%, while the PCE for the Cu-Sal sensitized cell is 3.00%. Evidently, the high PCE for the Co-Sal is the result of improved open-circuit voltage and short-circuit current. The enhanced performance for Co-Sal is due to its better electron donation properties along with better light-harvesting ability in the visible region, which is favorable for improving the Jsc of the DSSCs. We calculated the incident photon-to-current conversion efficiency (IPCE) spectra of the DSSCs to evaluate a collective measure of light harvesting, charge separation and charge collection efficiency. From Fig. 6b it can be concluded that the IPCE curve has a photocurrent response range of about 500 to 600 nm for Co-Sal whereas it is 400 to 500 nm for the Cu complexes. The IPCE values for Co-Sal and Cu-Sal complexes are 57% and 51% respectively and the percentage IPCE plot shows that the response range of photocurrent is steady with the absorption spectrum of the respective dye. The maximum electronic absorption intensity in Co-Sal can be observed in visible region at 450 nm and 610 nm, after that absorption intensity starts declining. In the IPCE for Cu-Sal, the onset starts from 400 nm and ends at 700 nm, whereas in the IPCE spectrum for Co-Sal, the onset commence from 450 nm and ends at 750 nm. Also, there are a broad shoulder in IPCE spectra for the dyes in visible range. As compared to the absorption spectra, in Co-Sal the shoulder was shifted to the shorter wavelength, which is suggesting some agglomeration of dyes on TiO2 film. The broader IPCE spectra for both dyes suggest that dye sensitized DSSCs have a better competence in harvesting light as the absorption and IPCE spectra covered a wider wavelength range.| Sensitizers | Jsc (mA cm−2) | Voc (V) | FF | η (%) | IPCE (%) | Ref. |
|---|---|---|---|---|---|---|
| Co-Sal | 9.75 | −0.648 | 0.61 | 3.84 | 57 | This work |
| Cu-Sal | 7.84 | −0.632 | 0.60 | 3.00 | 51 | |
| N719 | 8.85 ± 0.07 | 0.734 ± 0.02 | 0.64 ± 0.02 | 4.20 ± 0.05 | 55 ± 2 | 52 |
| Zn-Fc | 6.08 ± 0.03 | 0.684 ± 0.02 | 0.67 ± 0.02 | 2.79 ± 0.03 | 52 ± 2 | 52 |
| Cd-Fc | 5.13 ± 0.04 | 0.664 ± 0.02 | 0.67 ± 0.01 | 2.30 ± 0.04 | 50 ± 1 | 52 |
| Hg-Fc | 4.44 ± 0.03 | 0.656 ± 0.03 | 0.66 ± 0.01 | 1.95 ± 0.03 | 48 ± 1 | 52 |
| RNPDA | 7.12 | 0.79 | — | 3.42 | — | 53 |
| PZn(Q)2-C | 2.52 | 0.745 | 0.586 | 1.11 | — | 54 |
| PNi(Q)2-C | 1.27 | 0.650 | 0.550 | 0.45 | — | 54 |
| Ni | 2.23 | 0.61 | 0.52 | 0.71 | — | 55 |
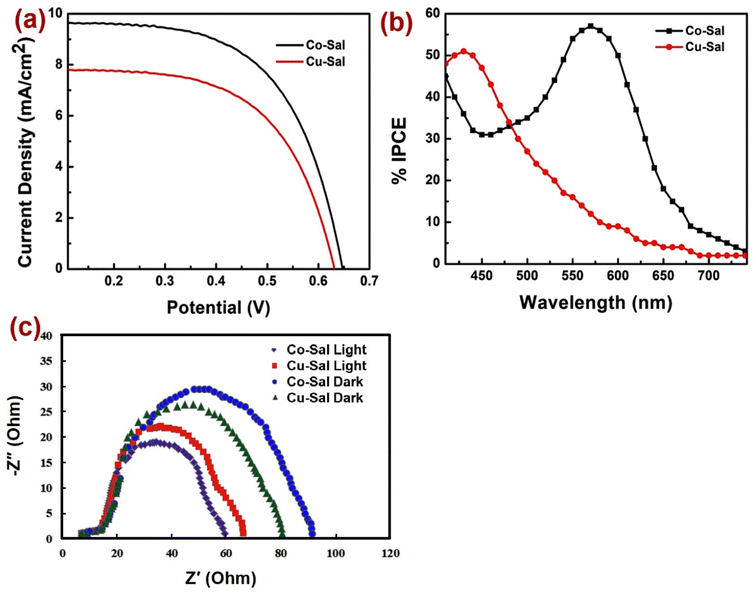 | ||
| Fig. 6 (a) Current density-potential curves; (b) incident photo to current conversion efficiency and (c) Nyquist plots for Cu-Sal and Co-Sal. | ||
Table 1 presents DSSC performances of previously reported analogous sensitizers comprising.52–55 The photovoltaic data suggested that performance of sensitizers investigated in presented study are comparable to the reported analogous sensitizers. However, the cell performance of the sensitizers are relatively inferior to that of the state of the art N719 dye,52 which partly may be attributed to the relatively poor spectral response and inferior photo-electron transfer. However, as compared to the Ru(II)-based N719 sensitizers the sensitizers investigated herein are easy to synthesize and cost effective. Hence, to avail better cell performance, sensitizers should exhibit panchromatic spectral response, better sensitizer anchorage and efficient photo-electron transfer to the conduction band of semiconductor.
3.6 Electrochemical impedance spectra (EIS)
Electrochemical impedance spectroscopy was performed to measure the kinetics of the electron transport properties and charge recombination (Fig. 6c). The Nyquist plots of sensitized and co-sensitized photoelectrodes were recorded under standard global AM 1.5 solar irradiation in light and under dark by applying at their open circuit a potential (OCP) over a frequency range of 10−2 to 105 Hz. In the EIS study, the semicircle in the middle frequency region is associated with the electron/charge transfer at the TiO2/dye/electrolyte interface.60 Figures show the Nyquist plots for DSSCs fabricated by using the Co-Sal and Cu-Sal in the dark and in the light respectively. Under light illumination, the two semicircles located in the high and middle frequency regions are attributed to the electrochemical reaction at the Pt/electrolyte interface and charge transfer at the TiO2/dye/electrolyte interface. The semicircle of the large radius positioned at the middle frequency regions in the Nyquist plots decreases more with the Co-Sal than with the Cu-Sal in the light, showing less charge recombination and a high charge transfer rate for the Co-Sal. The radius of the semicircle in the light and in the dark are in the order of Co-Sal < Cu-Sal and Co-Sal > Cu-Sal respectively, which signify a decreasing trend of the electron transfer impedance (Rct) as well as an increase in the charge transfer rate at this interface after sensitization.61 The EIS study under light and dark conditions confirms that the charge transfer rate increases and the charge recombination rate decreases after sensitization, which is favorable for enhancing the performance of DSSCs. Hence, overall, it could be concluded that the better photovoltaic performances of these sensitizers could be attributed to the presence of appropriate redox active center, ICT/MLCT moiety and apt anchoring groups, which provides the appropriate orientation of dyes on photoanode surface for its greater adsorption, greater electron lifetime and less recombination or delay in recombination at interfaces.624 Conclusion
In the investigation presented herewith, two Schiff base complexes of copper(II) and cobalt(III) have been synthesized using 2-(((2-hydroxyethyl)imino)methyl)phenol and for the copper complex the single crystal X-ray analysis revealed square planar geometry around Cu(II) satisfied by phenoxide oxygen and imine nitrogen of the 2-(((2-hydroxyethyl)imino)methyl)phenoxide ligand. The complex displayed varied intermolecular non-covalent interactions the nature of which has been addressed with the aid of Hirshfeld surface analysis. Both complexes were used as sensitizers in TiO2 based dye sensitized solar cells (DSSCs) with the cobalt complex exhibiting better photovoltaic performance in comparison to the copper complex. The relatively better photovoltaic performance of the cobalt complex relates to better light absorption properties than these of the copper complex. This investigation will pave a new pathway to develop new imine-based sensitizers which will improve the DSSC performance.Conflicts of interest
There are no conflicts to declare.Acknowledgements
Dr Mohd. Muddassir is grateful to Researchers Supporting Project Number (RSP2023R141), King Saud University, Riyadh, Saudi Arabia, for financial assistance.References
- M. Nicole, B. Matteo, F. Lucia, B. Nadia, G. Claudio, B. Federico and B. Claudia, Green Chem., 2020, 22, 7168–7218 RSC.
- A. M. Hisham, B. Vikas and K. B. Sanjay, Renewable Sustainable Energy Rev., 2020, 121, 109678 CrossRef.
- M. Mrinalini, N. Islavath, S. Prasanthkumar and L. Giribabu, Chem. Rec., 2019, 19, 661–674 CrossRef CAS PubMed.
- G. Jiawei, K. Sumathy, Q. Qiquano and Z. Zhengping, Renewable Sustainable Energy Rev., 2017, 68, 234–246 CrossRef.
- L. Giribabu, R. K. Kanaparthi and V. Velkannan, Chem. Rec., 2012, 12, 306–328 CrossRef CAS PubMed; B. O'Regan and M. Gratzel, Nature, 1991, 353, 737–740 CrossRef.
- C. P. Lee, C. T. Li and K. C. Ho, Mater. Today, 2017, 20, 267–283 CrossRef CAS.
- M. A. Green, Y. Hishikawa, W. Warta, E. D. Dunlop, D. H. Levi, J. Hohl-Ebinger and A. W. H. Ho-Baillie, Prog. Photovoltaics, 2017, 25, 668–676 Search PubMed.
- M. A. Green and S. P. Bremner, Nat. Mater., 2017, 16, 23–34 CrossRef PubMed.
- B. O'Regan and M. Gratzel, Nature, 1991, 353, 737–740 CrossRef.
- K. Kakiage, Y. Aoyama, T. Yano, K. Oya, J. Fujisawa and M. Hanaya, Chem. Commun., 2015, 51, 15894–15897 RSC.
- A. Yella, H. W. Lee, H. N. Tsao, C. Yi, A. K. Chandiran, M. K. Nazeeruddin, E. W. G. Diau, C. Y. Yeh, S. M. Zakeeruddin and M. Grätzel, Science, 2011, 334, 629–634 CrossRef CAS PubMed.
- S. Mathew, A. Yella, P. Gao, R. Humphry-Baker, B. F. E. Curchod, N. Ashari-Astani, I. Tavernelli, U. Rothlisberger, M. K. Nazeeruddin and M. Grätzel, Nat. Chem., 2014, 6, 242–247 CrossRef CAS PubMed.
- A. Mishra, M. K. Fischer and P. Bauerle, Angew. Chem., Int. Ed., 2009, 48, 2474–2499 CrossRef CAS PubMed.
- A. Hagfeldt, G. Boschloo, L. Sun, L. Kloo and H. Pettersson, Chem. Rev., 2010, 110, 6595–6663 CrossRef CAS PubMed.
- T. W. Hamann and J. W. Ondersma, Energy Environ. Sci., 2011, 4, 370–381 RSC.
- B. E. Hardin, H. J. Snaith and M. D. Mc Gehee, Nat. Photonics, 2012, 6, 162–169 CrossRef CAS.
- S. Zhang, X. Yang, Y. Numata and L. Han, Energy Environ. Sci., 2013, 6, 1443–1464 RSC.
- A. Fakharuddin, R. Jose, T. M. Brown, F. Fabregat-Santiago and J. Bisquert, Energy Environ. Sci., 2014, 7, 3952–3981 RSC.
- Y. Wu, W. H. Zhu, S. M. Zakeeruddin and M. Gratzel, ACS Appl. Mater. Interfaces, 2015, 7, 9307–9318 CrossRef CAS PubMed.
- A. Polman, M. Knight, E. C. Garnett, B. Ehrler and W. C. Sinke, Science, 2016, 352, 307 CrossRef CAS PubMed.
- J. M. Cole, G. Pepe, O. K. Al Bahri and C. B. Cooper, Chem. Rev., 2019, 119, 7279–7327 CrossRef CAS PubMed.
- Y. Saygili, M. Stojanovic, N. Flores-Díaz, S. M. Zakeeruddin, N. Vlachopoulos, M. Grätzel and A. Hagfeldt, Inorganics, 2019, 7, 30 CrossRef CAS.
- Y. Saygili, M. Stojanovic, H. Michaels, J. Tiepelt, J. Teuscher, A. Massaro, M. Pavone, F. Giordano, S. M. Zakeeruddin, G. Boschloo, J.-E. Moser, M. Grätzel, A. B. Muñoz-García, A. Hagfeldt and M. Freitag, ACS Appl. Energy Mater., 2018, 1, 4950–4962 CrossRef CAS.
- M. Gratzel, Nature, 2001, 414, 338–344 CrossRef CAS PubMed.
- B. O'Regan and M. A. Gratzel, Nature, 1991, 353, 737–740 CrossRef.
- Y. Bai, Q. Yu, N. Cai, Y. Wang, M. Zhang and P. Wang, Chem. Commun., 2011, 47, 4376–4378 RSC.
- B. Oregan and M. Gratzel, A Low-Cost, High-Efficiency Solar- Cell Based on Dye-Sensitized Colloidal TiO2 Films, Nature, 1991, 353, 737–740 CrossRef CAS.
- S. Hattori, Y. Wada, S. Yanagida and S. Fukuzumi, J. Am. Chem. Soc., 2005, 127, 9648–9654 CrossRef CAS PubMed.
- M. Brugnati, S. Caramori, S. Cazzanti, L. Marchini, R. Argazzi and C. A. Bignozzi, Int. J. Photoenergy., 2007, 2007, 80756 CrossRef.
- J. Cong, D. Kinschel, Q. Daniel, M. Safdari, E. Gabrielsson, H. Chen, P. H. Svensson, L. Sun and L. Kloo, J. Mater. Chem. A, 2016, 4, 14550–14554 RSC.
- M. Freitag, F. Giordano, W. Yang, M. Pazoki, Y. Hao, B. Zietz, M. Grätzel, A. Hagfeldt and G. Boschloo, J. Phys. Chem. C, 2016, 120, 9595–9603 CrossRef CAS.
- H. Michaels, I. Benesperi, T. Edvinsson, A. B. Muñoz-Garcia, M. Pavone, G. Boschloo and M. Freitag, Inorganics, 2018, 6, 53 CrossRef.
- E. C. Constable, A. H. Redondo, C. E. Housecroft, M. Neuburger and S. Schaffner, Dalton Trans., 2009, 6634–6644 RSC.
- M. Freitag, Q. Daniel, M. Pazoki, K. Sveinbjörnsson, J. Zhang, L. Sun, A. Hagfeldt and G. Boschloo, Energy Environ. Sci., 2015, 8, 2634–2637 RSC.
- Y. Saygili, M. Söderberg, N. Pellet, F. Giordano, Y. Cao, A. B. Muñoz-García, S. M. Zakeeruddin, N. Vlachopoulos, M. Pavone, G. Boschloo, L. Kavan, J. E. Moser, M. Grätzel, A. Hagfeldt and M. Freitag, J. Am. Chem. Soc., 2016, 138, 15087–15096 CrossRef CAS PubMed.
- A. N. M. Green, E. Palomares, S. A. Haque, J. M. Kroon and J. R. Durrant, J. Phys. Chem. B, 2005, 109, 12525–12533 CrossRef CAS PubMed.
- G. Boschloo and A. Hagfeldt, Characteristics of the Iodide/Triiodide Redox Mediator in Dye-Sensitized Solar Cells, Acc. Chem. Res., 2009, 42, 1819–1826 CrossRef CAS PubMed.
- H. Kusama, J. Photochem. Photobiol., A, 2019, 376, 255–262 CrossRef CAS.
- V. Chakrapani, D. Baker and P. V. Kamat, J. Am. Chem. Soc., 2011, 133, 9607–9615 CrossRef CAS PubMed.
- C. Teng, X. Yang, C. Yuan, C. Li, R. Chen, H. Tian, S. Li, A. Hagfeldt and L. Sun, Org. Lett., 2009, 11, 5542–5545 CrossRef CAS PubMed.
- Z. S. Wang, K. Sayama and H. Sugihara, J. Phys. Chem. B, 2005, 109, 22449–22455 CrossRef CAS PubMed.
- B. V. Bergeron, A. Marton, G. Oskam and G. J. Meyer, J. Phys. Chem. B, 2005, 109, 937–943 CrossRef CAS PubMed.
- F. Pichot and B. A. Gregg, J. Phys. Chem. B, 1999, 104, 6–10 CrossRef.
- K. S. Srivishnu, S. P. kumar and L. Giribabu, Mater. Adv., 2021, 2, 1229–1247 RSC.
- A. B. Muñoz-García, I. Benesperi, G. Boschloo, J. J. Concepcion, J. H. Delcamp, E. A. Gibson, G. J. Meyer, M. Pavone, H. Pettersson, A. Hagfeldt and M. Freitag, Chem. Soc. Rev., 2021, 50, 12450–12550 RSC.
- Y. Saygili, M. Stojanovic, H. Michaels, J. Tiepelt, J. Teuscher, A. Massaro, M. Pavone, F. Giordano, S. M. Zakeeruddin, G. Boschloo, J.-E. Moser, M. Grätzel, A. B. Muñoz-García, A. Hagfeldt and M. Freitag, ACS Appl. Energy Mater., 2018, 1, 4950–4962 CrossRef CAS.
- (a) R. Chauhan, M. Trivedi, L. Bahadur and A. Kumar, Chem.–Asian J., 2011, 6, 1525–1532 CrossRef CAS PubMed; (b) A. Singh, P. Singh, G. Kociok-Köhn, M. Trivedi, A. Kumar, R. Chauhan, S. B. Rane, C. Terashima, S. W. Gosavi and A. Fujishima, New J. Chem., 2018, 42, 9306–9316 RSC; (c) R. Chauhan, S. Auvinen, A. S. Aditya, M. Trivedi, R. Prasad, M. Alatalo, D. P. Amalnerkar and A. Kumar, Sol. Energy, 2014, 108, 560–569 CrossRef CAS; (d) R. Chauhan, M. Shahid, M. Trivedi, D. P. Amalnerkar and A. Kumar, Eur. J. Inorg. Chem., 2015, 3700–3707 CrossRef CAS; (e) R. Chauhan, R. Yadav, A. K. Singh, M. Trivedi, G. Kociok-Köhn, A. Kumar, S. Gosavi and S. Rane, RSC Adv., 2016, 6, 97664–97675 RSC; (f) R. Yadav, A. Singh, G. Kociok-Köhn, R. Chauhan, A. Kumar and S. Gosavi, New J. Chem., 2017, 41, 7312–7321 RSC; (g) R. Yadav, M. Trivedi, G. Kociok-Köhn, R. Chauhan, A. Kumar and S. W. Gosavi, Eur. J. Inorg. Chem., 2016, 6, 1013–1021 CrossRef.
- CrysAlisPro 1.171.41.122a, Rigaku Oxford Diffraction, 2021 Search PubMed.
- G. M. Sheldrick, Acta Crystallogr., Sect. C: Struct. Chem., 2015, 71, 3–8 Search PubMed.
- (a) R. Yadav, M. Trivedi, G. Kociok-Köhn, R. Prasad and A. Kumar, CrystEngComm, 2015, 17, 9175–9184 RSC; (b) A. Singh, A. Singh, D. Srivastava, G. Kociok-Köhn, R. D. Köhn, A. Kumar and M. Muddassir, CrystEngComm, 2022, 24, 4274–4282 RSC; (c) P. Singh, A. Singh, A. Singh, A. K. Singh, G. Kociok-Köhn, A. Alowais, N. A. Y. Abduh, M. Muddassir and A. Kumar, CrystEngComm, 2020, 22, 2049–2059 RSC.
- (a) A. Kumar, A. Singh, R. Yadav, S. Singh, G. Kociok-Köhn and M. Trivedi, Inorg. Chim. Acta, 2018, 471, 234–243 CrossRef CAS; (b) R. Yadav, M. Trivedi, R. Chauhan, R. Prasad, G. Kociok- Köhn and A. Kumar, Inorg. Chim. Acta, 2016, 450, 57–68 CrossRef CAS.
- C. Gautam, A. Singh, S. W. Gosavi, R. Chauhan, V. K. Sharma, A. Alarifi, M. Afzal, M. Muddassir and A. Kumar, Appl. Organomet. Chem., 2022, 36, e6608 CrossRef CAS.
- S. Kamalesu, A. A. Babu and K. Swarnalatha, Inorg. Chem. Commun., 2019, 104, 88–92 CrossRef.
- J. Deng, L. Guo, Q. Xiu, L. Zhang, G. Wen and C. Zhong, Mater. Chem. Phys., 2012, 133, 452–458 CrossRef CAS.
- D. Kilinc, O. Sahin and S. Horoz, J. Ovonic Res., 2018, 14, 71–77 CAS.
- K. E. Lee, M. A. Gomez, T. Regier, Y. Hu and G. P. Demopoulos, J. Phys. Chem. C, 2011, 115, 5692–5707 CrossRef CAS.
- G. W. Simmons and B. C. Beard, J. Phys. Chem., 1987, 91, 1143 CrossRef CAS.
- M. Takagi-Kawai, M. Soma, T. Onishi and K. Tamaru, Can. J. Chem., 1980, 58, 2132 CrossRef CAS.
- G. Jin, R. Park, H. Park, J. Seo, S. Lee and M. Lee, Chin. Med. J., 2010, 123, 3132 Search PubMed.
- C. S. Chou, R.-Y. Yang, C.-K. Kuo and Y.-J. Lin, Powder Technol., 2009, 194, 95–105 CrossRef CAS.
- K. Matsumoto, N. Saito, T. Mitate, J. Hojo, M. Inada and H. Haneda, Cryst. Growth Des., 2009, 9, 5014 CrossRef CAS.
- (a) S. A. Miltsov, V. S. Karavan and V. A. Borin, J. Gen. Chem., 2019, 89, 1055–1057 CrossRef CAS; (b) C. A. Goss and H. D. Abruηa, Inorg. Chem., 1985, 24, 4263–4267 CrossRef CAS; (c) L. Galucci, G. pampaloni, C. Pinzino and A. Prescimone, Inorg. Chim. Acta, 2006, 359, 3274–3278 Search PubMed.
Footnote |
| † Electronic supplementary information (ESI) available. CCDC 2202408. For ESI and crystallographic data in CIF or other electronic format see DOI: https://doi.org/10.1039/d3ra00344b |
| This journal is © The Royal Society of Chemistry 2023 |

