 Open Access Article
Quantitative analysis of biosurfactants in water samples by a modified oil spreading technique†
Haoshuai Liab,
Chao Fangb,
Xinrui Liub,
Kaiwen Baoc,
Yang Lid and
Mutai Bao *ab
*ab
aFrontiers Science Center for Deep Ocean Multispheres and Earth System, Key Laboratory of Marine Chemistry Theory and Technology, Ministry of Education, Ocean University of China, No. 238 Songling Road, Qingdao 266100, Shandong Province, China. E-mail: mtbao@ouc.edu.cn; Fax: +86-532-66782509; Tel: +86-532-66782509
bCollege of Chemistry and Chemical Engineering, Ocean University of China, Qingdao 266100, China
cUniversity of Leeds, LS2 9JT, UK
dChina Petrochemical Corporation (Sinopec Group), Beijing 100728, China
First published on 29th March 2023
Abstract
The oil spreading technique relies on biosurfactant to reduce the surface tension of an oil film and form an oil spreading ring in the center, and then judges the content of biosurfactant according to the diameter of the spreading ring. However, the instability and large errors of the traditional oil spreading technique limit its further application. In this paper, we modified the traditional oil spreading technique by optimizing the oily material, image acquisition and calculation method, which improves the accuracy and stability of the quantification of biosurfactant. We screened lipopeptides and glycolipid biosurfactants for rapid and quantitative analysis of biosurfactant concentrations. By selecting areas by color done by the software to modify image acquisition, the results showed that the modified oil spreading technique has a good quantitative effect, reflected in the concentration of biosurfactant being proportional to the diameter of the sample droplet. More importantly, using the pixel ratio method instead of the diameter measurement method to optimize the calculation method, the region selection was more exact, and the accuracy of the data results was high, and the calculation efficiency was improved significantly. Finally, the contents of rhamnolipid and lipopeptide in oilfield water samples were judged by the modified oil spreading technique, the relative errors were analyzed according to the different substances as the standard, and the quantitative measurement and analysis of oilfield water samples (the produced water of Zhan 3-X24 and the injected water of the estuary oil production plant) were realized. The study provides a new perspective on the accuracy and stability of the method in the quantification of biosurfactant, and provided some theoretical and data support for the study of the microbial oil displacement technology mechanism.
1. Introduction
Biosurfactants are metabolites with surface activity produced by a variety of microorganisms. They are different sets of compounds such as lipopeptides, lipoproteins, glycolipids, phospholipids and polysaccharide–lipid complexes. They have lower toxicity, higher biodegradability, better environmental compatibility and the ability to be produced using cheaper agricultural materials than chemically synthesized surfactants. The structural feature of biosurfactants is that they contain hydrophobic and hydrophilic groups, so biosurfactants have strong surface activity which can significantly reduce surface and interface tension.1–6 According to reports, biosurfactants not only have the ability to repair the environment but also have therapeutic and biomedical effects. In addition, biosurfactants in the process of microbial oil recovery can reduce the oil–water interface tension and improve oil displacement efficiency.7–20 However, the practical applications of biosurfactants are limited by their low yield and high cost of production.21 The development of rapid and accurate methods for estimating the concentration and yield of biosurfactants is an important factor for selecting strains with high production characteristics and routinely estimating the biosurfactants produced by various strains. In this paper, lipopeptide and glycolipid biosurfactants are used as the research objects for rapid quantitative analysis. Surfactin, which is a representative cyclic lipopeptide, is one of the most powerful microbial biosurfactants and is produced by Bacillus subtilis.22–27During the last few decades, researchers have performed much work in screening and quantifying biosurfactants. The drop-collapsing method is a traditional method, and it was demonstrated to be a rapid method for screening bacterial colonies that can produce surfactants.28 In addition, an improved drip collapse technique is used to quantify the concentration of biosurfactants. Studies have shown that the surfactant concentration is directly proportional to the diameter of the sample droplets.29 The turbidometric method is another way to rapidly quantify microbes. This method is based on the theory that the solubility of lipopeptide biosurfactants will decrease at low pH and this method is suitable for the quantitative analysis of high-concentration lipopeptide solutions.30 High-performance liquid chromatography (HPLC) is also used in the qualitative and quantitative analysis of lipopeptide biosurfactants. It is usually analyzed by ultraviolet detectors, but the ultraviolet absorption of lipopeptides is relatively weak, and it is not suitable for quantitative analysis of lower concentration lipopeptide solutions.31–33 When lipopeptides were derived from 1-bromoacetylpyrene, they could be analyzed by fluorescence detectors.34 Although the improved HPLC method overcomes the limitation of the trace detection of lipopeptide solution, the detection limit of lipopeptide is low, but the derivation process is complicated and the accurate quantification range is limited. In addition, a new quantitative method based on visible color shifts for screening surfactin production was reported.35 It is convenient to screen surfactin-producing strains by the change in color, but the quantitative accuracy of this method is not very good. Other methods or techniques have also been employed to estimate the yields of biosurfactants during screening strains producing biosurfactants through Fourier Transform Infrared (FT-IR) spectroscopy,36 hemolytic activity37 or interfacial tension tests. However, these methods are not suitable for rapid and accurate quantification of biosurfactants due to the complexity of the process or inconvenient calibration. The oil spreading technique is a good method for quantitatively analyzing the content of biosurfactants. It relies on biosurfactant to reduce the surface tension of the oil film to form an oil spreading ring in the center of the oil film, and then judges the content of biosurfactant according to the diameter of the spreading ring. However, the instability and large errors of traditional oil spreading technique limit its further application. Different analytical methods have their own characteristics, and the establishment of these analytical methods makes the quantitative analysis of biosurfactants and the screening of surfactant strains increasingly perfected, which also provides a theoretical basis for the development of this paper.
This study aimed to modify the qualitative oil spreading technique described previously38 so that it could be expediently applied to quantify the concentration of biosurfactants. It includes (1) the modified oil spreading technique was established by optimizing the oily material, image acquisition and calculation method. (2) Complete accurate quantification of 25–300 mg per L rhamnolipid standard solution, 5–200 mg per L lipopeptide standard solution, and rapid quantification of single class of biosurfactant solution. (3) By establishing quantitative standard curves of different biosurfactant standard solutions, the advantages of the improved technology and the traditional technology were compared and analyzed. Finally, the contents of rhamnolipid and lipopeptide in oilfield water samples were judged. The results provided some theoretical and data support for the study of the microbial oil displacement technology mechanism.
2. Materials and methods
2.1. Preparation of sample
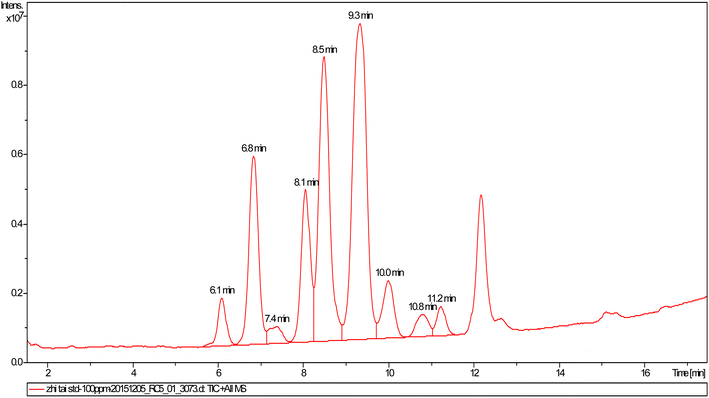
Surfactin is one of the approximately 20 families of lipopeptides and most families among the reported lipopeptides are found to be cyclic lipopeptides.39,40 The surfactin sample used in this study was from the culture broth of Bacillus subtilis HSO 121 by the State Key Laboratory of Bioreactor Engineering and Institute of Applied Chemistry, East China University of Science and Technology, and produced surfactin on a sucrose culture medium. The surfactin sample was obtained after separation from cell-free broth, acid precipitation, and extraction with ethyl ether.41,42 To remove the remaining solvent at room temperature, the surfactin sample was dissolved with methanol. Total ion chromatography (TIC) of the surfactin sample is shown as Fig. 1 and the molecular weights of the different components in the standard lipopeptide solution are shown as Table S1.† The rhamnolipids were obtained from Huzhou Zijin Biotechnology Limited Company, and the sophorolipids were obtained from Ocean University of China. The injection water was selected from the Hekou oil production plant in the Shengli oilfield, and the produced water was selected from the Zhan 3-X24 production well in the Shengli oilfield.2.2. Oil spreading technique
The oil spreading technique was first proposed to screen the production of surfactant strains.43 The mechanism of the technology is as follows. The density of polar solvents, such as water, was heavier than that of oily materials; when the solvent or surfactin solutions were delivered into the surface of oily materials, the oily material membrane would break because of the action of gravity.44 In the absence of biosurfactants, when the polar solvent methanol is added to the surface of the oily material, the polar solvent methanol will be repelled by the hydrophobic oily material and dissolve in the polar solvent water below the oily material, so the center of the area of the oily material cannot be formed. In contrast, if the solvent contains biosurfactant, when the biosurfactant solution is transported to the center of the oily substance film, the oil–water contact angle will change, and the interfacial tension between water and oily substance will decrease, so a clear area can be formed.45 At the same time, since the red organic dye Sudan Red III is insoluble in water and soluble in oil, fatty substances become orange when they encounter Sudan III. By adding Sudan Red III to the oily substance for dyeing, the small particles dyed orange were observed under an optical microscope. This solves the problem that there is no color difference between the oil phase and the water phase, which can only rely on the naked eye to observe the test results, and the oil drain ring cannot be observed in real-time photo recordings. It is widely used in the screening of surfactant-producing strains because of the intuitiveness of the oil spreading technique. For the same biosurfactant, the size of the formed clear zone is proportional to the content of the biosurfactant. Therefore, the method has also been gradually used to quantify the content of biosurfactants.43,46 The quantitative analysis of biosurfactants was realized by establishing a standard curve of different concentrations of biosurfactant solution and the diameter or area of corresponding clear zone.2.3. Quantitative experimental procedure of the improved oil spreading technique
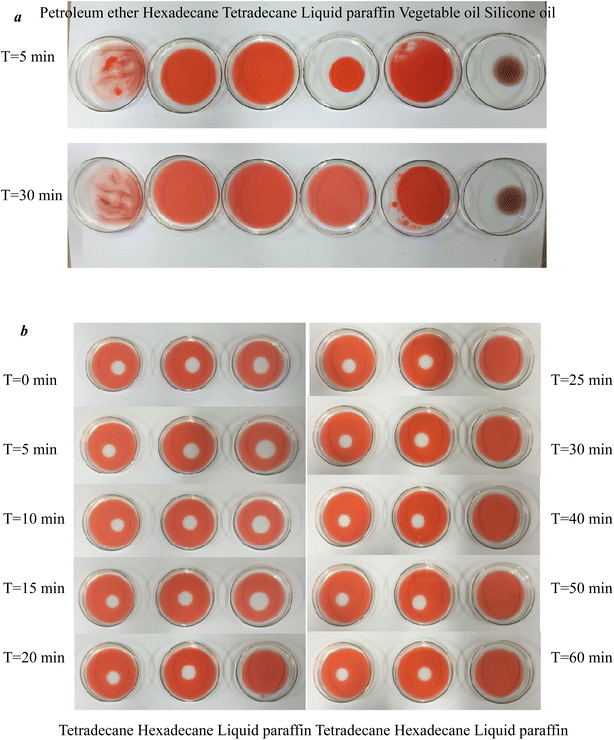
In this paper, six oily materials were selected for experimentation, namely, petroleum ether, hexadecane, tetradecane, liquid paraffin, vegetable oil, and silicone oil, to investigate whether there are more suitable oil film materials. Five milliliters of each oil film material was added to the water surface, and the spreading of different oil film materials on the water surface was recorded 5 min and 30 min after dripping. Three kinds of better oily materials were initially selected, and 5 mL of tetradecane, hexadecane and liquid paraffin used in the traditional oil spreading method were dropped onto the water surface. After the oil film was stabilized, 10 μL of 100 mg per L rhamnolipid standard solution was added to the above three oil films. The formation state of the oil drain ring formed in the 3 Petri dishes during the 0–60 min process was recorded separately by the images. By comparing the stability of the blank area formed, a better oil film material is further selected.
3. Results and discussion
3.1. Effect of various oily materials on the oil spreading technique
3.2. Biosurfactant concentration calibration by the traditional oil spreading technique
It has been shown that the oil spreading technique could roughly achieve the quantitative analysis of biosurfactants in the lower concentration range, and the concentration of surfactant has a linear relationship with the diameter of the oil spreading.48 By using the traditional oil spreading technique, we established standard curves with different concentrations of lipopeptide, rhamnolipid and sophorolipid standard solutions, and the corresponding diameters of the oil spreading and normal curve diagrams are shown in Fig. 4.The quantitative formula of lipopeptide was obtained in formula (1):
| D = 0.097 × C + 11.75 | (1) |
The standard curve R2 = 0.918. The linear relationship of the established lipopeptide quantitative standard curve was not ideal, and the accuracy of the accurate quantification of this surfactant was also lacking.
The conversion formula of quantitative rhamnolipid was obtained in formula (2):
| D = 0.16 × C + 12.05 | (2) |
The standard curve R2 = 0.885, and the linear relationship was poor in the experimental concentration range, so it was difficult to accurately quantify rhamnolipid.
The quantitative formula of sophorolipid was obtained in formula (3):
| D = 0.038 × C + 8.05 | (3) |
The standard curve R2 = 0.981, and the linear relationship of the sophorolipid quantitative standard curve was better in the experimental concentration range.
3.3. Biosurfactant concentration calibration by the improved oil spreading technique
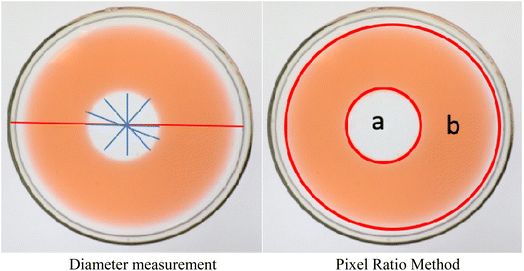
Through the preliminary comparison of several different oily materials, tetradecane and hexadecane can spread evenly on the water surface more quickly, and their stability was better, so they were ideal oily materials. Because of its more economical use than hexadecane, tetradecane was identified as an oily material. To improve the accuracy of the test results, the oil spreading image acquisition system was optimized. Using the pixel ratio method instead of the diameter measurement method to optimize the calculation method, the region selection was more scientific, and the accuracy of the data results was high, and the calculation efficiency was improved significantly. A schematic diagram of the two methods is shown in Fig. 3.Before improvement, the area of oil spreading was calculated by formula (4):
 | (4) |
 | (5) |
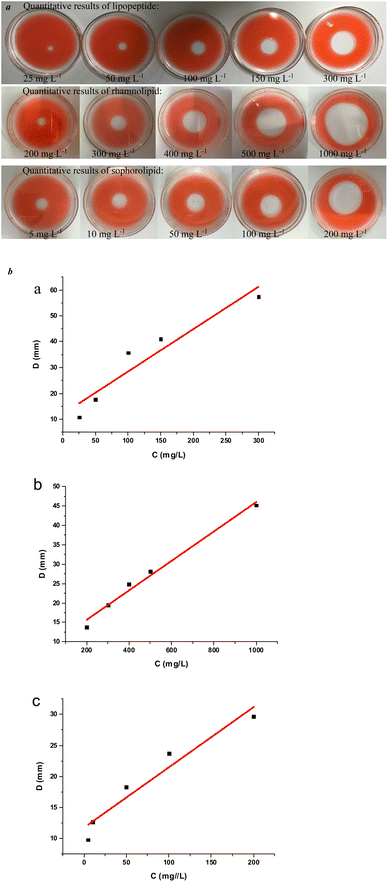
The traditional oiling technique does not give ideal results for the quantitative results of lipopeptides and rhamnolipids but for sophorolipids. Using the improved oil spreading technology, the standard curve of different concentrations of lipopeptides and rhamnolipid standard solutions and the corresponding oil spreading diameters are shown in Fig. 5.
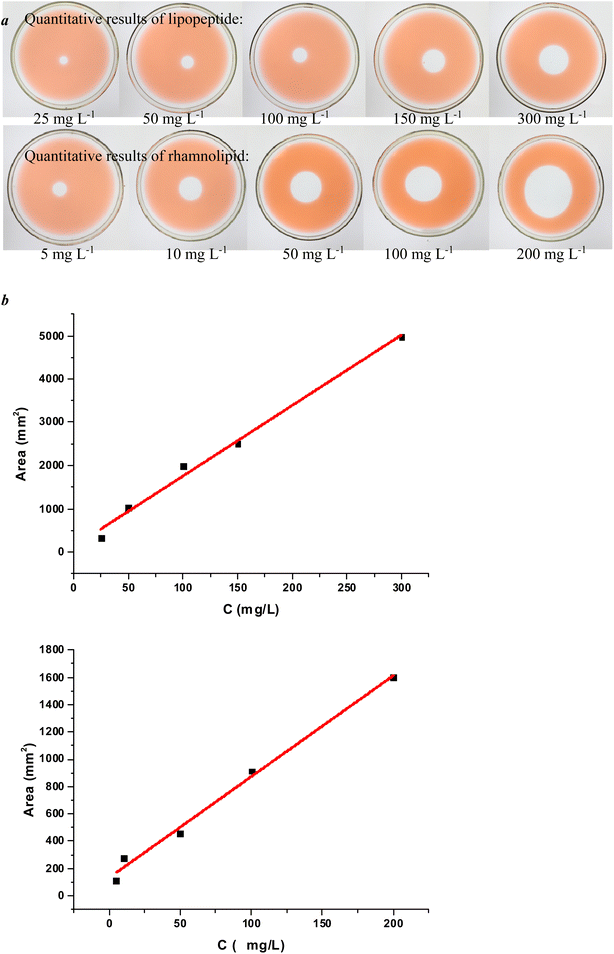 | ||
| Fig. 5 (a) Oil spreading formed by standard lipopeptide and rhamnolipid solutions. (b) The standard curves established by standard lipopeptide and rhamnolipid solutions and oil spreading area. | ||
Through the establishment of the standard curve, the quantitative formula of lipopeptide can also be obtained in formula (6):
| S = 7.40 × C + 132.58 | (6) |
The standard curve R2 = 0.989, the linear relationship of the established lipopeptide quantitative standard curve was good, and it can basically achieve accurate quantification of lipopeptides in the range of 5–200 mg L−1.
The quantitative formula of rhamnolipid can also be obtained in formula (7):
| S = 16.33 × C + 123.78 | (7) |
The standard curve R2 = 0.989, the linear relationship was good, and it can basically achieve accurate quantification of rhamnolipids in the range of 25–300 mg L−1.
Through the above experimental results, it can be concluded that the concentration of the same biosurfactant solution was basically proportional to the diameter of the oil spreading, which also shows that the rapid quantitative analysis of the oil spreading technique for biological surfactants is feasible. However, the linear relationship between the standard curves established by different kinds of biosurfactants varies, which may be related to the respective properties of biosurfactants.
3.4. Validation of the improved oil spreading technique by oilfield samples
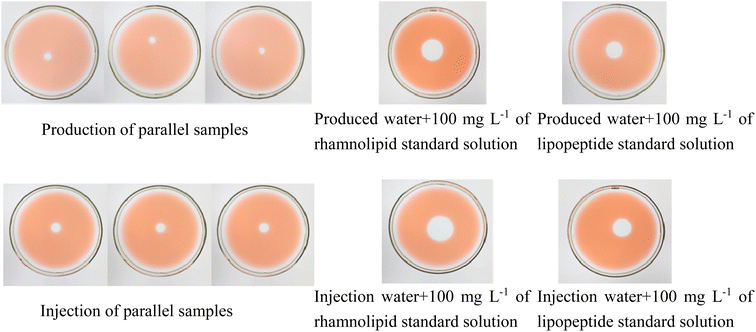
Improved oil diffusion technology has been used to achieve the quantitative determination of biosurfactants in oilfield water samples. The comparison of the concentration of biosurfactant in oilfield produced water and oilfield injected water and the data obtained by the internal standard method is shown in the Table S2† and Fig. 6.Because oilfield water samples are complex and contain a variety of biosurfactants,49 the quantitative standard curve of rhamnolipids (formula (6)) or lipopeptides (formula (7)) was used to estimate the content of biosurfactants in oilfield water samples. Since the area of the blank area formed by the produced water is too small to be calculated by the formula, the blank area formed by it is compared with the blank area formed by the standard solution of 100 mg per L lipopeptide or rhamnolipid. The content of biosurfactant in the produced water is estimated by the method of calculating the ratio (the calculated concentration is greater than the actual concentration). The calculated results are shown in Table 1.
| Sample content (mg L−1) | Average concentration of oilfield produced water | Average concentration of oilfield injection water | Oilfield produced water + 100 mg per L rhamnolipid standard solution | Oilfield produced water + 100 mg per L lipopeptide standard solution | Oilfield injection water + 100 mg per L rhamnolipid standard solution | Oilfield injection water + 100 mg per L lipopeptide standard solution |
|---|---|---|---|---|---|---|
| Calculated with rhamnolipid | 4.3 | 5.5 | 67.4 | — | 91.2 | — |
| Calculated with lipopeptide | 9.5 | 11.06 | — | 81.9 | — | 119.0 |
| Fractional error | — | — | 35.38% | 25.21% | 12.56% | 8.68% |
When rhamnolipids are used as the standard to calculate the biosurfactant content in oilfield water samples, the average concentration of oilfield produced water is 4.3 mg L−1, and the average concentration of oilfield water injection is 5.5 mg L−1. When the peptide is used as a standard for calculation, the average concentration of oilfield-produced water is 9.5 mg L−1, and the average concentration of oilfield water injection is 11.06 mg L−1. When the oilfield water sample plus 100 mg per L rhamnolipid solution is used as the standard to calculate the biosurfactant content in the oilfield water sample, the average concentration of oilfield produced water is 67.4 mg L−1, and the average concentration of oilfield water injection is 91.2 mg L−1. When the oilfield water sample plus 100 mg per L lipopeptide solution is used as the standard to calculate, the average concentration of oilfield produced water is 81.9 mg L−1, and the average concentration of oilfield water injection is 119.0 mg L−1.
The results showed that the content of biosurfactant in oilfield water samples calculated by different standards was quite different, but overall, the error of the measured result of oilfield injection water was smaller than that of oilfield produced water and the error of the calculated result with lipopeptide was smaller than that with rhamnolipid.
3.5. Discussion of the advantages of the improved oil spreading technique via rapid in situ reaction
The improved oil spreading technique has the advantages of being reasonable, stable and accurate. The stability of the improved oil spreading technique is mainly reflected in two aspects: the stabilized time of formation oil spreading is increased, and the size is basically unchanged. The technique has good repeatability, and it has a small error for three parallel tests. In addition, the linear relationship of the standard curve established by the improved oil spreading technique is very good, which is beneficial to practical applications. However, the content of biosurfactants in oilfield water samples calculated by different standards is quite different. Because the oilfield water samples are complex, there is more than one biosurfactant in water samples, and the ability of different biosurfactants to form oil spreading is different, there is still a large error in the quantity of biosurfactants used in oilfield water samples. From the experimental results of the mixed solution of oilfield water samples with lipopeptide or rhamnolipid standard solution, it can be seen that the interference of extracted water to the quantification of biosurfactant is greater than that of injected water, which may be because the extracted water matrix is more complex and contains more oil phase. The new oil spreading technique is more accurate for the quantification of a single biosurfactant solution, but it is difficult to achieve accurate quantification of a complex multicomponent mixed solution of oilfield water samples. Therefore, the new oil spreading technique can be improved continuously, using its simple and fast characteristics for better application in the production of surfactant strain screening and other aspects.4. Conclusion
On the basis of the previous research results, the modified oil spreading technique was established by optimizing the oily material, image acquisition and calculation method, and the new technique was applied to complete the accurate quantification of rhamnolipid standard solution in the range of 25–300 mg L−1, lipopeptide standard solution in the concentration range of 5–200 mg L−1, and the rapid quantification of single class biosurfactant solution. We screened lipopeptides and glycolipid biosurfactants for rapid and quantitative analysis of biosurfactant concentrations. By selecting areas by color done by the software to modify image acquisition, the results showed that the modified oil spreading technique has a good quantitative effect, reflected in that the concentration of biosurfactant is proportional to the diameter of the sample droplet. More importantly, using the pixel ratio method instead of the diameter measurement method to optimize the calculation method, the region selection was more scientific, and the accuracy of the data results was high, and the calculation efficiency was improved significantly. Finally, the contents of rhamnolipid and lipopeptide in oilfield water samples were judged, which provided some theoretical and data support for the study of the microbial oil displacement technology mechanism. However, because of the complexity of oilfield water samples, rapid and accurate quantitative analysis of biosurfactants in oilfield water samples cannot be realized completely. In addition, limited by the experimental conditions, time and their own research level, there were still some shortcomings that need to be further solved. Therefore, how to realize the quantitative analysis of mixed solutions of various biosurfactants by using the oil spreading technique needs further study. Alternatively, the new oil spreading technique is constantly being improved, using its simplicity and speed, in other aspects such as in the production of surfactant strain screening to better play its role.Conflicts of interest
The authors declare no competing financial interest.Acknowledgements
This work was funded by the National Key Research and Development Program (2016YFC1402301), the Shandong Provincial Natural Science Foundation of China (ZR2018MD017) and the Fundamental Research Funds for the Central Universities (201822009). The Guangdong Provincial Key Laboratory of Marine Resources and Coastal Engineering. This is MCTL Contribution No. 311.References
- A. R. Markande, D. Patel and S. Varjani, A review on biosurfactants: properties, applications and current developments, Bioresour. Technol., 2021, 330, 124963, DOI:10.1016/j.biortech.2021.124963.
- F. Q. Fan, B. Y. Zhang, J. B. Liu, Q. H. Cai, W. Y. Lin and B. Chen, Towards sulfide removal and sulfate reducing bacteria inhibition: function of biosurfactants produced by indigenous isolated nitrate reducing bacteria, Chemosphere, 2020, 238, 124655, DOI:10.1016/j.chemosphere.2019.124655.
- A. Saika, H. Koike, T. Fukuoka and T. Morita, Tailor-made mannosylerythritol lipids: current state and perspectives, Appl. Microbiol. Biotechnol., 2018, 102, 6877–6884, DOI:10.1007/s00253-018-9160-9.
- A. Wittgens and F. Rosenau, On the road towards tailor-made rhamnolipids: current state and perspectives, Appl. Microbiol. Biotechnol., 2018, 102, 8175–8185, DOI:10.1007/s00253-018-9240-x.
- P. Das, S. Mukherjee and R. Sen, Improved bioavailability and biodegradation of a model polyaromatic hydrocarbon by a biosurfactant producing bacterium of marine origin, Chemosphere, 2008, 72(9), 1229–1234, DOI:10.1016/j.chemosphere.2008.05.015.
- S. Mukherjee, P. Das and R. Sen, Towards commercial production of microbial surfactants, Trends Biotechnol., 2006, 24(11), 509–515, DOI:10.1016/j.tibtech.2006.09.005.
- S. Varjani, A. Pandey and V. N. Upasani, Oilfield waste treatment using novel hydrocarbon utilizing bacterial consortium – a microcosm approach, Sci. Total Environ., 2020, 745, 141043, DOI:10.1016/j.scitotenv.2020.141043.
- M. A. Nasiri and D. Biria, Extraction of the indigenous crude oil dissolved biosurfactants and their potential in enhanced oil recovery, Colloids Surf., A, 2020, 603, 125216, DOI:10.1016/j.colsurfa.2020.125216.
- M. Ohadi, A. Shahravan, N. Dehghannoudeh, T. Eslaminejad, I. M. Banat and G. Dehghannoudeh, Potential use of microbial surfactant in microemulsion drug delivery system: a systematic review, Drug Des., Dev. Ther., 2020, 14, 541–550, DOI:10.2147/DDDT.S232325.
- S. Patel, A. Homaei, S. Patil and A. Daverey, Microbial biosurfactants for oil spill remediation: pitfalls and potentials, Appl. Microbiol. Biotechnol., 2019, 103, 27–37, DOI:10.1007/s00253-018-9434-2.
- S. J. Geetha, I. M. Banat and S. J. Joshi, Biosurfactants: production and potential applications in microbial enhanced oil recovery (MEOR), Biocatal. Agric. Biotechnol., 2018, 14, 23–32, DOI:10.1016/j.bcab.2018.01.010.
- S. J. Varjani and V. N. Upasani, Carbon spectrum utilization by an indigenous strain of Pseudomonas aeruginosa NCIM 5514: production, characterization and surface active properties of biosurfactant, Bioresour. Technol., 2016, 221, 510–516, DOI:10.1016/j.biortech.2016.09.080.
- S. K. Satpute, I. M. Banat, P. K. Dhakephalkar, A. G. Banpurkar and B. A. Chopade, Biosurfactants, bioemulsifiers and exopolysaccharides from marine microorganisms, Biotechnol. Adv., 2010, 28, 436–450, DOI:10.1016/j.biotechadv.2010.02.006.
- S. K. Satpute, A. G. Banpurkar, P. K. Dhakephalkar, I. M. Banat and B. A. Chopade, Methods for investigating biosurfactants and bioemulsifiers: a review, Crit. Rev. Biotechnol., 2010, 30, 127–144, DOI:10.3109/07388550903427280.
- H. Suthar, K. Hingurao, A. Desai and A. Nerurkar, Selective plugging strategy-based microbial-enhanced oil recovery using Bacillus licheniformis TT33, J. Microbiol. Biotechnol., 2009, 19, 1230–1237, DOI:10.4014/jmb.0904.04043.
- P. Das, S. Mukherjee and R. Sen, Antimicrobial potential of a lipopeptide biosurfactant derived from a marine Bacillus circulans, J. Appl. Microbiol., 2008, 104(6), 1675–1684, DOI:10.1111/j.1365-2672.2007.03701.x.
- P. Das, S. Mukherjee and R. Sen, Substrate dependent production of extracellular biosurfactant by a marine bacterium, Bioresour. Technol., 2008, 100(2), 1015–1019, DOI:10.1016/j.biortech.2008.07.015.
- A. A. Juwarkar, A. Nair, K. V. Dubey, S. K. Singh and S. Devotta, Biosurfactant technology for remediation of cadmium and lead contaminated soils, Chemosphere, 2007, 68(10), 1996–2002, DOI:10.1016/j.chemosphere.2007.02.027.
- K. H. Shin, K. W. Kim and Y. Ahn, Use of biosurfactant to remediate phenanthrene-contaminated soil by the combined solubilization-biodegradation process, J. Hazard. Mater., 2006, 137(3), 1831–1837, DOI:10.1016/j.jhazmat.2006.05.025.
- P. Singh and S. S. Cameotra, Potential applications of microbial surfactants in biomedical sciences, Trends Biotechnol., 2004, 22(3), 142–146, DOI:10.1016/j.tibtech.2004.01.010.
- C. Y. Chen, S. C. Baker and R. C. Darton, The application of a high throughput analysis method for the screening of potential biosurfactants from natural sources, J. Microbiol. Methods, 2007, 70(3), 503–510, DOI:10.1016/j.mimet.2007.06.006.
- V. M. Alvarez, C. R. Guimarães, D. Jurelevicius, L. V. CastilhobJoa, J. S. Sousa and F. F. Mota, et al., Microbial enhanced oil recovery potential of surfactin-producing Bacillus subtilis AB2.0, Fuel, 2020, 272, 117730, DOI:10.1016/j.fuel.2020.117730.
- N. J. Hadia, C. Ottenheim, S. Li, N. Q. Hua, L. P. Stubbs and H. C. Lau, Experimental investigation of biosurfactant mixtures of surfactin produced by Bacillus Subtilis for EOR application, Fuel, 2019, 251, 789–799, DOI:10.1016/j.fuel.2019.03.111.
- F. Hu, Y. Liu and S. Li, Rational strain improvement for surfactin production: enhancing the yield and generating novel structures, Microb. Cell Factories, 2019, 18, 42, DOI:10.1186/s12934-019-1089-x.
- J. Vater, B. Kablitz, C. Wilde, P. Franke, N. Mehta and S. S. Cameotra, Matrix-Assisted Laser Desorption Ionization-Time of Flight Mass Spectrometry of Lipopeptide Biosurfactants in Whole Cells and Culture Filtrates of Bacillus subtilis C-1 Isolated from Petroleum Sludge, Appl. Environ. Microbiol., 2002, 68(12), 6210–6219, DOI:10.1128/AEM.68.12.6210-6219.2002.
- J. S. Tang, F. Zhao, H. Gao, Y. Dai, Z. H. Yao and K. Hong, et al., Characterization and online detection of surfactin isomers based on HPLC-MSn analyses and their inhibitory effects on the overproduction of nitric oxide and the release of TNF-α and IL-6 in LPS-induced macrophages, Mar. Drugs, 2010, 8(10), 2605–2618, DOI:10.3390/md8102605.
- J. M. Bonmatin, O. Laprévote and F. Peypoux, Diversity among microbial cyclic lipopeptides: iturins and surfactins. Activity-structure relationships to design new bioactive agents, Comb. Chem. High Throughput Screening, 2003, 6(6), 541–556, DOI:10.2174/138620703106298716.
- D. K. Jain, D. L. Collins-Thompson, H. Lee and J. T. Trevors, A drop-collapsing test for screening surfactant-producing microorganisms, J. Microbiol. Methods, 1991, 13(4), 271–279, DOI:10.1016/0167-7012(91)90064-W.
- A. A. Bodour and R. M. Miller-Maier, Application of a modified drop-collapse technique for surfactant quantitation and screening of biosurfactant-producing microorganisms, J. Environ. Manage., 1998, 32(3), 273–280, DOI:10.1016/S0167-7012(98)00031-1.
- S. Mukherjee, P. Das and R. Sen, Rapid quantification of a microbial surfactant by a simple turbidometric method, J. Microbiol. Methods, 2009, 76(1), 38–42, DOI:10.1016/j.mimet.2008.09.010.
- S. C. Lin, Y. C. Chen and Y. M. Lin, General approach for the development of high-performance liquid chromatography methods for biosurfactant analysis and purification, J. Chromatogr. A, 1998, 825(2), 149–159, DOI:10.1016/S0021-9673(98)00709-2.
- K. Kinsella, C. P. Schulthess, T. F. Morris and J. D. Stuart, Rapid quantification of Bacillus subtilis antibiotics in the rhizosphere, Soil Biol. Biochem., 2009, 41(2), 374–379, DOI:10.1016/j.soilbio.2008.11.019.
- J. Yuan, W. Raza, Q. Huang and Q. Shen, Quantification of the antifungal lipopeptide iturin A by high performance liquid chromatography coupled with aqueous two-phase extraction, J. Chromatogr. B: Anal. Technol. Biomed. Life Sci., 2011, 879(26), 2746–2750, DOI:10.1016/j.jchromb.2011.07.041.
- Y. Meng, J. F. Liu, S. Z. Yang, R. Q. Ye and B. Z. Mu, Quantification of Lipopeptides Using High-performance Liquid Chromatography with Fluorescence Detection after Derivatization, Anal. Sci., 2015, 31(5), 377–382, DOI:10.2116/analsci.31.377.
- H. Yang, H. Yu and Z. Shen, A novel high-throughput and quantitative method based on visible color shifts for screening Bacillus subtilis THY-15 for surfactin production, J. Ind. Microbiol. Biotechnol., 2015, 42(8), 1139–1147, DOI:10.1007/s10295-015-1635-4.
- J. Gartshore, Y. C. Lim and D. G. Cooper, Quantitative analysis of biosurfactants using Fourier Transform Infrared (FT-IR) spectroscopy, Biotechnol. Lett., 2000, 22, 169–172, DOI:10.1023/A:1005670031432.
- C. Ana, M. Morán, M. Alejandra and S. Faustino, Quantification of surfactin in culture supernatants by hemolytic activity, Biotechnol. Lett., 2002, 24, 177–180, DOI:10.1023/A:1014140820207.
- N. H. Youssef, K. E. Duncan, D. P. Nagle, K. N. Savage, R. M. Knapp and M. J. Mclnerney, Comparison of methods to detect biosurfactant production by diverse microorganisms, J. Microbiol. Methods, 2004, 56(3), 339–347, DOI:10.1016/j.mimet.2003.11.001.
- F. Peypoux, J. M. Bonmatin and J. Wallach, Recent trends in the biochemistry of surfactin, Appl. Microbiol. Biotechnol., 1999, 51(5), 553–563, DOI:10.1007/s002530051432.
- J. Vater, Lipopeptides, an attractive class of microbial surfactants, Prog. Colloid Polym. Sci., 1986, 72, 12–18, DOI:10.1007/BFb0114473.
- X. Liu, S. Yang and B. Mu, Isolation and characterization of a C12-lipopeptide produced by Bacillus subtilis HSO 121, J. Pept. Sci., 2008, 14(7), 864–875, DOI:10.1002/psc.1017.
- Y. Zhao, S. Z. Yang and B. Z. Mu, Quantitative Analyses of the Isoforms of Surfactin Produced by Bacillus subtilis HSO 121 Using GC-MS, Anal. Sci., 2012, 28(8), 789–793, DOI:10.2116/analsci.28.789.
- M. Morikawa, Y. Hirata and T. Imanaka, A study on the structure-function relationship of lipopeptide biosurfactants, Biochim. Biophys. Acta, Mol. Cell Biol. Lipids, 2000, 1488(3), 211–218, DOI:10.1016/S1388-1981(00)00124-4.
- X. Luo, H. Gong, Z. He, P. Zhang and L. He, Research on mechanism and characteristics of oil recovery from oily sludge in ultrasonic fields, J. Hazard. Mater., 2020, 399, 123137, DOI:10.1016/j.jhazmat.2020.123137.
- T. Park, M. K. Jeon, S. Yoon, K. S. Lee and T. H. Kwon, Modification of interfacial tension and wettability in oil-brine-quartz system by in situ bacterial biosurfactant production at reservoir conditions: implications to microbial enhanced oil recovery, Energy Fuels, 2019, 33(6), 4909–4920, DOI:10.1021/acs.energyfuels.9b00545.
- N. H. Youssef, K. E. Duncan, D. P. Nagle, K. N. Savage, R. M. Knapp and M. J. McInerney, Comparison of methods to detect biosurfactant production by diverse microorganisms, J. Microbiol. Methods, 2004, 56(3), 339–347, DOI:10.1016/j.mimet.2003.11.001.
- H. Li, M. Bao, Y. Li, L. Zhao, T. King and Y. Xie, Effects of suspended particulate matter, surface oil layer thickness and surfactants on the formation and transport of oil-sediment aggregates (OSA), Int. Biodeterior. Biodegrad., 2020, 149, 104925, DOI:10.1016/j.ibiod.2020.104925.
- N. D. Denkov, S. Tcholakova, K. G. Marinova and A. Hadjiiski, Role of oil spreading for the efficiency of mixed oil-solid antifoams, Langmuir, 2002, 18(15), 611–614 CrossRef.
- J. Wu, R. J. Zeng, F. Zhang and Z. Yuan, Application of iron-crosslinked sodium alginate for efficient sulfide control and reduction of oilfield produced water, Water Res., 2019, 154, 12–20, DOI:10.1016/j.watres.2019.01.030.
Footnote |
| † Electronic supplementary information (ESI) available. See DOI: https://doi.org/10.1039/d3ra00102d |
| This journal is © The Royal Society of Chemistry 2023 |

