
 Open Access Article
 This Open Access Article is licensed under a Creative Commons Attribution-Non Commercial 3.0 Unported Licence
Quantitative analysis of fucosylated glycoproteins by immobilized lectin-affinity fluorescent labeling†
Ziyuan Gao abi,
Sufeng Chenc,
Jing Duc,
Zhen Wud,
Wei Gebh,
Song Gaoe,
Zeyang Zhouf,
Xiaodong Yangf,
Yufei Xingg,
Minhua Shig,
Yunyun Huh,
Wen Tangh,
Jun Xiac,
Xumin Zhangd,
Junhong Jiang*ai and
Shuang Yang*b
abi,
Sufeng Chenc,
Jing Duc,
Zhen Wud,
Wei Gebh,
Song Gaoe,
Zeyang Zhouf,
Xiaodong Yangf,
Yufei Xingg,
Minhua Shig,
Yunyun Huh,
Wen Tangh,
Jun Xiac,
Xumin Zhangd,
Junhong Jiang*ai and
Shuang Yang*b
aDepartment of Respiratory Medicine, The First Affiliated Hospital of Soochow University, Suzhou 215006, China. E-mail: jiangjunhong1969@suda.edu.cn
bCenter for Clinical Mass Spectrometry, College of Pharmaceutical Sciences, Soochow University, Suzhou 215123, China. E-mail: yangs2020@suda.edu.cn
cClinical Laboratory Center, Zhejiang Provincial People's Hospital, Hangzhou, Zhejiang 310014, China
dState Key Laboratory of Genetic Engineering, Department of Biochemistry, School of Life Sciences, Fudan University, Shanghai 200438, China
eJiangsu Key Laboratory of Marine Pharmaceutical Compound Screening, Jiangsu Key Laboratory of Marine Biological Resources and Environment, Co-Innovation Center of Jiangsu Marine Bio-industry Technology, School of Pharmacy, Jiangsu Ocean University, Lianyungang 222005, China
fDepartment of General Surgery, The Second Affiliated Hospital of Soochow University, Suzhou 215004, China
gDepartment of Pulmonary and Critical Care Medicine, The Second Affiliated Hospital of Soochow University, Suzhou 215004, China
hDepartment of Gastroenterology, The Second Affiliated Hospital of Soochow University, Suzhou 215004, China
iDepartment of Respiratory and Critical Care Medicine, The First Affiliated Hospital of Soochow University, Suzhou 215006, China
First published on 27th February 2023
Abstract
Human biofluids are often used to discover disease-specific glycosylation, since abnormal changes in protein glycosylation can discern physiopathological states. Highly glycosylated proteins in biofluids make it possible to identify disease signatures. Glycoproteomic studies on saliva glycoproteins showed that fucosylation was significantly increased during tumorigenesis and that glycoproteins became hyperfucosylated in lung metastases, and tumor stage is associated with fucosylation. Quantification of salivary fucosylation can be achieved by mass spectrometric analysis of fucosylated glycoproteins or fucosylated glycans; however, the use of mass spectrometry is non-trivial for clinical practice. Here, we developed a high-throughput quantitative method, lectin-affinity fluorescent labeling quantification (LAFLQ), to quantify fucosylated glycoproteins without relying on mass spectrometry. Lectins with a specific affinity for fucoses are immobilized on the resin and effectively capture fluorescently labeled fucosylated glycoproteins, which are further quantitatively characterized by fluorescence detection in a 96-well plate. Our results demonstrated that serum IgG can be accurately quantified by lectin and fluorescence detection. Quantification in saliva showed significantly higher fucosylation in lung cancer patients compared to healthy controls or other non-cancer diseases, suggesting that this method has the potential to quantify stage-related fucosylation in lung cancer saliva.
Introduction
Alterations in glycosylation, a well-established hallmark of tumorigenesis and metastasis, occur on proteins, lipids and small RNA.1,2 The contribution of aberrant glycosylation to tumor progression is manifested by regulating tumor proliferation, invasion, metastasis, or angiogenesis.3 Galectin-3 has been found to promote the formation of the metastatic niche in lung cancer by binding to metastatic cellular carbohydrates such as T-antigen.4 Direct analysis of lung tumor tissues showed significant upregulation of high-mannose and galactosylated N-glycans compared to adjacent non-tumor tissue.5 Overexpression of sialyltransferases (SAT) and 1,3-fucosyltransferases (FUT) can modulate sialylation and fucosylation formation, which fundamentally alters cell surface receptor functions by inhibiting dimerization and phosphorylation of epidermal growth factor receptor (EGFR).6 Mouse studies have shown that prolow-density lipoprotein receptor-related protein 1 (LRP1) has distinct N-glycans at each glycosite between the liver and the brain.7 Statistical analysis of the glycosylation profiles of lung, salivary gland, cervix, and colon clearly revealed that some glycoproteins and their glycans are tissue-specific.8 This unique glycosylation pattern in lung tissue may be due to differentially expressed glycoenzymes (glycosyltransferases and glycosidases) in lung compared to other tissues.Tissue-specific glycosylation can be found in human biofluids. Recent studies of human tissue and urine/serum have shown that more than 300 N-glycoproteins are found in lung and serum, and more than 400 are found in lung and urine.9 Therefore, lung tissue-specific glycosylation present in biofluids can be identified. Our recent study found that changes in urinary glycoproteins were associated with lung cancer,10 whereas salivary fucosylation was significantly upregulated in lung adenocarcinomas (ADC) compared to healthy controls or non-cancer patients.11,12 Glycoform profiling of human salivary proteins such as zinc-α-2-glycoprotein shows that they contain fucose (α-1,6)-N-acetylglucosamine (GlcNAc) and fucose (α-1,3)-N-acetyllactosamine.13 Other studies have used lotus tetragonolobus lectin affinity to determine dysregulated fucosylated glycans in saliva from diseases caused by hepatitis B virus (HBV) such as chronic hepatitis, cirrhosis, or hepatocellular carcinoma.14 The Human Protein Atlas (HPA) analyzed the salivary gland-specific proteome15 and revealed that salivary gland or lung tissue shares the same genes as the esophagus, tongue, thyroid gland and stomach (Fig. 1A and B). These organs can be a source of proteins that are secreted and circulated into saliva. Proteomic analysis of lung tissue and saliva showed that salivary proteins and their glycoproteins are also present in lung tissue,16–18 so it is reasonable to use salivary glycoproteins for lung-specific disease analysis.
 | ||
| Fig. 1 Interactive network map of lung and salivary gland enriched genes associated with their respective tissues. (A) A lung interactive network with 23 tissues in which respiratory related tissues (esophagus, tongue or oral cavity) and glandular tissues (saliva or thyroid) contribute to the protein composition of saliva. (B) An interactive network of salivary glands with 21 tissues in which the esophagus, stomach, lung can alter protein composition and abundance in saliva. (C) Proteins identified in whole saliva are present in lung tissue, and saliva contains 66 glycoproteins that are potential targets of lung cancer. Red nodes represent the number of lung or salivary gland-enriched genes, and orange nodes represent the number of group-enriched genes. The size of each node represents the number of genes displayed within the node. The interactive network map is based on the Human Protein Atlas. | ||
Salivary fucosylation is expected to predict lung tumorigenesis and metastasis. Our work found that core and branch GlcNAc or Gal fucosylation was present in healthy individuals, but hyperfucosylation was consistently exhibited in the saliva of lung ADC patients.12 Fucosylation increases predominantly towards complex N-glycan branching, with a slight increase in fucosylation on high-mannose or hybrid N-glycans. Preliminary results suggest that fucosylation is proportional to the stage of lung ADC, so quantification of protein fucosylation may be a strategy for lung ADC diagnosis. Quantification of protein glycosylation can be achieved by mass-spectrometry,19,20 lectin-affinity,21,22 or metabolic labeling.23 Among these methods, lectin-affinity can be used for clinical applications of fluorescent quantification, since multiple lectins are available for specific enrichment of different linkages for fucosylation and fluorescent detection is fast and easy to implement.
There are more than a dozen fucose-specific lectins (FSL) widely used in fucosylated glycoproteins to enrich for a single or multiple fucose linkages, such as α1,6-fucose (core), α1,2-fucose, and α1,3-fucose.24 Lectin-based quantification has been applied to core fucosylation (α1,6) of α-fetoprotein (AFP) in hepatocellular carcinoma,25 prostate-specific antigen (PSA) in prostate cancer,26,27 or tumor-specific antigens on its glycan epitopes.28,29 Aleuria aurantia lectin (AAL) and aspergillus oryzae lectin (AOL) recognize almost all alpha fucose, other FSLs can specifically target 1,2, 1,3 or 1,6 fucose. For instance, ulex europaeus agglutinin I (UEA-I) binds with fucoseα1-2Galβ1-4GlcNAc,30 and lotus tetragonolobus (LTL) binds with Fucα1-3Galβ1-4GlcNAc and Fucα1-3GlcNAc motifs.24 Lens culinaris agglutinin (LCA or LCH) binds with fucoseα-1,6GlcNAc (core fucose).31 Therefore, it is possible to enrich for one or more fucose moieties using specific lectins. There are several lectins that have affinity for fucose. They can enrich for different linked forms of fucose. Detailed information of the lectins with known fucose specificity shown in Table S2.†
In this study, we used a combination of lectins (AAL, UEA-I, and LCA) for quantitative analysis of salivary protein fucosylation. The combination of AAL and LCA enhanced the identification of α1,6 fucosylated glycoproteins for better quantification,32 while UEA-I enriched for antennary α1,2 fucosylated glycoproteins in tumor cells.33 Lectins are first covalently bound to amine-reactive beads, while proteins extracted from saliva are labeled with fluorescein tags (Fig. 2). The lectins and fluorescently labeled proteins are incubated, and the fucosylated glycoproteins are bound to the lectin beads. The lectin bound glycoproteins are placed in a 96-well plate for fluorescence quantification. We can apply this method to quantify the saliva of patients with lung ADC at different tumor stages.
 | ||
| Fig. 2 Schematic diagram of lectin affinity fluorescent labeling quantification (LAFLQ) for quantitative determination of protein fucosylation. Proteins extracted from saliva are labeled with Alexa Fluor™ 488 (AF488), whose NHS ester reacts with N-terminus or lysine of proteins/glycoproteins. After quenching AF488 active NHS ester groups, the labeled proteins/glycoproteins were incubated with the lectin-beads. Glycoproteins bind to the beads via lectin affinity and proteins remain in solution. Unbound proteins or glycoproteins were removed by centrifugation in a SCSC. Glycoprotein-bound beads were loaded to a 96-well plate for further testing by a fluorescence detector. The relative abundance of glycoproteins is characterized by fluorescent intensity. | ||
Experimental procedures
Chemical and reagents
Lectins (AAL, LCA and UEA-I), binding buffer and elution buffer were purchased from Vector Laboratories (Burlingame, CA, USA). AminoLink™ plus resins (beads) and snap-cap spin column (SCSC) were purchased from Thermo Scientific (Waltham, MA, USA). PNGase F and fucosidase were ordered from New England BioLabs (Ipswich, MA, USA) and Genovis (Lund, Sweden). Sodium carbonate, iodoacetamide (IAA), dithiothreitol (DTT) and urea were purchased from Aladdin Chemical (Shanghai, China). Sodium cyanoborohydride (NaCNBH3) was obtained from Sigma-Aldrich (St. Louis, MO, USA). Phosphate buffered saline (PBS) and Tris–HCl were obtained from Beyotime Biotechnology (Shanghai, China). Sodium carbonate (Na2CO3), sodium bicarbonate (NaHCO3), ammonium bicarbonate (NH4HCO3) and formic acid were obtained from Sinopharm Chemical Reagent Co., Ltd (Shanghai, China). Tris(2-carboxyethyl) phosphine hydrochloride (TCEP), dimethylaniline (DMA), 2,5-dihydroxybenzoic acid (DHB) and trifluoroacetic acid (TFA) were obtained from Macklin Biochemical Co., Ltd (Shanghai, China). Acetonitrile (ACN) was purchased from Tedia (Fairfield, OH, USA). Protein inhibitor was purchased from MedChemExpress (Shanghai, China).Saliva collection procedure
All patients in the lung cancer group were histopathologically confirmed as lung adenocarcinoma, had no history of inflammatory diseases or other malignant tumors, and had not received chemotherapy or radiotherapy. In this study, there was no statistically significant difference between lung cancer (LC) and other diseases/healthy control (OD/HC) in terms of gender, medical history and other factors. All patient samples were collected according to protocols approved by the Institutional Review Board (IRB) of the First Affiliated Hospital of Soochow University, the Second Affiliated Hospital of Soochow University, Dushulake Affiliated Hospital of Soochow University and Zhejiang Provincial People's Hospital, and written informed consent was provided to patients in advance. All experiments were performed in accordance with the Guidelines of Soochow University. Saliva samples were collected from 50 individuals, including 25 LC patients, 21 OD patients, and 4 HCs. Saliva samples were collected in the morning (9–11 am). Patients and healthy volunteers were asked not to eat, drink, smoke, or use any oral cleaning products for at least one hour before collecting saliva to minimize the effect of smoking, food, alcohol or beverages on the final results of the experiment. All subjects rinsed their mouths 2–3 times with drinking water to ensure oral hygiene before collection. Collect naturally secreted whole saliva in a 50 ml centrifuge tube within 10 min in the absence of stimulation and must remain on ice throughout the procedure. Saliva samples were centrifuged at 120![[thin space (1/6-em)]](https://www.rsc.org/images/entities/char_2009.gif) 00× rpm for 25 min at 4 °C. After discarding the pellet and adding 1/10 volume of 100× protease inhibitor to the supernatant, samples were stored at −80 °C until further use.
00× rpm for 25 min at 4 °C. After discarding the pellet and adding 1/10 volume of 100× protease inhibitor to the supernatant, samples were stored at −80 °C until further use.
Protein extraction from saliva
500 μL of the solution containing TCA (trichloroacetic acid, 20% w/v), acetone (90% v/v), and DTT (20 mM) was mixed with 500 μL of saliva. The mixture was vortexed and allowed to settle overnight at −20 °C.34,35 The samples were then centrifugated at 15000× rpm for 30 min at 4 °C. Discard the supernatant and collect the pellet, then wash with 200 μL of cold acetone (90%) and 20 mM DTT, and finally with cold acetone (80%) and 10 mM DTT. To suspend the pellet in solution, the sample was sonicated for at least 5 min before washing with acetone-DTT. The pellet was placed at −20 °C for 20 min and centrifugated at 15000× rpm for 5 min at 4 °C. The pellet was collected and dried in Speed-Vac (∼5 min) and stored at −80 °C before further analysis.
Lectin immobilization on amine-reactive beads
The lectin immobilization procedure was the same as the protein immobilization for glycan enrichment discussed in our previous works.36,37 AminoLink Coupling Resin containing aldehyde groups was added to react with amines in the protein samples. Briefly, beads (200 μL) were was placed in a snap-cap spin-column (SCSC) (volume capacity up to 600 μL) and the supernatant was removed by centrifugation (3000× rpm, 10–30 s). The beads were washed with distilled water (DI) (500 μL) (twice) and further with PBS buffer (500 μL, pH 7.4) (twice). The lectin (40 μL, 5 μg μL−1) was mixed with the beads and additional 460 μL of binding buffer (pH 10) was added. The samples were incubated with head-to-toe mixing for 4 h at room temperature, and followed by the addition of 25 μL NaCNBH3 (1 M) for an additional 4 h. After centrifugation to remove the supernatant, the lectin-bead was washed with 1× PBS buffer (twice) and then incubated in PBS in the presence of 50 mM NaCNBH3 for 4 h. The active sites of the resin were then blocked with 1 M Tris–HCl (pH 7.4). The lectin-bead was finally washed with 1 M NaCl (thrice) and DI water (thrice) (500 μL). The immobilized lectin was stored in DI water (500 μL) at 4 °C.Lectin-affinity fluorescent labeling quantification (LAFLQ)
Proteins extracted from saliva immunoglobulin G (IgG) and bovine serum albumin (BSA) were labeled with fluorescent dyes, and the labeling procedure for Alexa Fluor 488 (AF488) NHS ester was described below. The previously treated solid-phase-bound lectin was washed with TBS buffer (pH 7.4). For comparison, two labeling workflows were applied: (A) lectin binding to proteins followed by fluorescence labeling, termed lectin-first fluorescent labeling (LF); (B) fluorescent labeling of proteins followed by lectin affinity of fluorescently labeled proteins, termed fluorescent-first lectin binding (FF). For the LF workflow, the extracted salivary proteins were incubated with AAL, LCA, and UEA-I immobilized beads and a mixture of three lectins (200 μg lectins, respectively) in 0.5 ml of TBS buffer. Samples and lectins were incubated overnight at 4 °C. Then centrifuge at 3000 × g for 1 minute and remove the supernatant. After five washes with 0.5 ml of DI water, fluorescence binding buffer (0.2 M sodium carbonate, 1 M sodium chloride) and excess AF488 NHS ester were added for labeling (Fig. S1†). The fluorescent tags were reacted at room temperature for 16 h, then the excess fluorescent tags were washed with TBS buffer, and 200 μL of fluorescently labeled beads were transferred to a 96-well plate for fluorescence detection. For the FF workflow, 200 μg of lyophilized salivary protein was first dissolved in fluorescence binding buffer to a final concentration of 10 μg μL−1. An excess of AF488 was added and allowed to react for 16 h at room temperature. The reaction was quenched with an equal volume of 2 M Tris–HCl (pH 7.5) to inactivate the NHS group, and purified from unreacted AF488 dye by ultrafiltration centrifuge dialysis. TBS buffer were added to make up the volume to 300 μL, and centrifuge twice for 20 min at 14000 × g. Fluorescently labeled samples were reacted with lectin overnight at 4 °C. Samples were transferred to a 96-well plate and the fluorescence was measured by reading excitation/emission (EX/EM) wavelengths at 495/519 nm using a multifunctional microplate reader (Tecan Infinite M1000 Pro; Tecan Group Ltd; Mannedorf, Switzerland). All measurements were background subtracted using blank beads.
Serum IgG quantification by turbidimetry
IgG was measured using immunonephelometry using an IMMAGE 800 turbidity analyzer (Beckman Coulter, Fullerton, CA) and the kit instructions were strictly followed. Serum protein electrophoresis and immunofixation electrophoresis (IF) were performed on agarose gels (Hydrasys and Hydragel; Sebia; Lisses, France). The immunoglobulin free kappa and free lambda light chain tests were performed on an Optilite nephelometer (The Binding Site Group Ltd, Birmingham, UK) according to the manufacturer's instructions. The normal reference interval for kappa FLC is 3.3–19.4 mg L−1, the reference range for lambda FLC is 5.7–26.3 mg L−1, and the reference interval for kappa/lambda ratio is 0.26–1.65.MALDI-MS analysis of IgG N-glycan
200 μg of IgG (Yuanye Bio-Technology Co., Shanghai) was dissolved in DI water (450 μL). N-Glycans were prepared following our previous procedure (Glycoprotein Immobilization of Glycan Enrichment (GIG)).36–38 The dried N-glycans from GIG were resuspended in 20 μL of 0.2% formic acid (prepared in 50% ACN) and tested using a Bruker ultrafleXtremeTM matrix-assisted laser desorption ionization (MALDI)-MS. The MALDI matrix was prepared by mixing 4 μL of DMA with 200 μL of DHB (100 μg μL−1 in 50% ACN, 0.1 mM NaCl). N-Glycans (2 μL) were spotted on a MALDI plate with 1 μL of MALDI matrix and dried in air or under vacuum to form crystals. Spectra were acquired in a positive reflector mode with a mass range of 900–6000 and a laser power of 50%. A total of 1000 shots were accumulated for each sample in triplicate. Glycan peak lists were created by Bruker flexAnalysis software (signal-to-noise ≥ 3). Glycan composition was determined manually by searching the database in the GlycoWorkbench.39Results
Efficient quantification of fluorescently labeled glycoproteins by LAFLQ
To understand whether lectin affinity enrichment or fluorescent labeling affects the quantification of glycoproteins, we tested two different schemes, lectin-first (LF) and fluorescence-first (FF) (Fig. 3). The LF enriched the targeted fucosylated glycoproteins using lectins of AAL, LCA and UEA-I (200 μg), followed by fluorescent labeling using AF488. The purpose of this scheme was to determine whether labeling on lectin-bound fucosylated glycoproteins could effectively quantify their abundance. A series of IgG loadings showed that the amount of IgG was independent of fluorescence intensity (Fig. 3C). This may be due to the simultaneous labeling of the lectin, which significantly increases the background intensity, suppressing the changes in IgG in the sample. We then first labelled fucosylated glycoproteins to prevent lectin labeling (Fig. 3B), and then enriched fluorescently labeled glycoproteins by lectin affinity. Quantitative analysis of IgG showed a good correlation between the amount of IgG and the fluorescence intensity, indicating that the fluorescent labelled glycoproteins can bind efficiently to the lectins. Thereafter, the procedure for LAFLQ followed a fluorescence-first scheme. | ||
| Fig. 3 Comparison of lectin-first and fluorescence-first quantification of glycoproteins. (A) Lectin-first (LF): glycoproteins bind to lectins, removing non-targeted glycoproteins/proteins. Lectin-bound glycoproteins are labeled with a fluorescent reagent (AF488), and excess reagents are washed away. The labeled glycoproteins are quantified by a fluorescent detector. (B) Fluorescence-first (FF): glycoproteins/proteins are labelled with a fluorescent reagent (AF488), and excess reagents are quenched and removed by ultrafiltration. The labeled glycoproteins are specifically enriched by lectin affinity, and other components are removed, followed by fluorescence quantification. (C) Quantification of IgG using LF (left) and FF (right), where LF quantification showed no linear relationship between fluorescence intensity and IgG quantity due to concomitant lectin labeling. Conversely, FF quantification showed that the amount of IgG was proportional to the fluorescence intensity, indicating that lectin affinity was not affected by fluorescent labeling of glycoproteins. | ||
Increased lectin immobilization efficiency at higher pH for better lectin affinity enrichment
The unbound lectins were used in our study, so they were first immobilized on amine-reactive beads for LAFLQ. To determine whether the binding buffer could affect lectin immobilization and further quantification, we tested the reductive amination conjugation of two basic buffers (Fig. 4A). Our previous studies found that N-terminal or primary amine can rapidly react with aldehydes at higher pH (≥10.0), and the resulting imines can be rapidly reduced to new amines at lower pH (7–8) in the presence of NaCNBH3.36,40 However, both the N-terminus and lysine reacted with aldehydes at pH 10.0, while only the N-terminus can be conjugated with aldehydes at pH 7.4 because protonated lysines are below their pI (isoelectric point). After lectin binding to the beads, IgG interacts with lectin affinity and is quantified by fluorescence detection. The results showed that the fluorescence intensity (FI) of lectin-conjugated sample in PBS was significantly lower than that in sodium citrate-sodium carbonate. Compared to the reaction in PBS buffer, the fluorescence intensity (FI) was more than 3-fold higher (Fig. 4A). This result indicates that (a) higher yields of lectin conjugation is achieved using pH 10 buffer that reacts with the N-terminus and lysine of the lectin, and (b) higher pH conjugation didn't impose determinantal effect on lectin affinity. Therefore, we subsequently performed lectin immobilization using buffer at pH 10.0. | ||
| Fig. 4 Quantification of fucosylated IgG by lectin affinity following fluorescent labeling of glycoproteins. (A) Lectins were immobilized on aldehyde-functionalized beads by reductive amination. Two binding buffers were tested, including pH 7.4 (1× PBS) and pH 10.0 (100 mM sodium citrate and 50 mM sodium carbonate). In higher pH buffers, the binding efficiency of the lectin to the beads increased, while the fluorescence intensity decreased to less than 1/3 when the lectin was immobilized with PBS. (B) Fluorescence intensity of IgG was investigated against different amounts of IgG using LAFLQ. Tests were performed in triplicate and a linear fit was obtained with an R2 above 0.98. (C) Analysis of N-glycans of IgG by GIG method and MALDI-MS. The most abundant N-glycans are G1F, G2F and G0F, while lower percentages of afucosylated N-glycans are present in IgG. | ||
We further investigated the performance of immobilized lectins for quantification of fucosylated glycoproteins. IgG contains fucosylated N-glycans mainly in its CH2 domain, of which G0F, G1F and G2F are the most abundant species (G = galactose, F = fucose, 0/1/2 = number of galactose).41,42 IgG N-glycan analysis using GIG showed that G1F was the most abundant species extracted from IgG, followed by G2F and G0F (Fig. 4C). Thus, IgG can be used to demonstrate the performance of LAFLQ by lectin affinity enrichment of fucosylated glycopeptides. After AF488 labeling, different amounts of IgG (0, 20, 50, 80, 100 μg) were bound to the same amount of immobilized lectin beads (200 μg). These tests were performed in triplicate. Each data point for the same IgG amount was from one test, thus three data points were collected for each IgG load (Fig. 4B). Our data showed that the amount of IgG was proportional to the fluorescence intensity. Based on the mean of triplicated tests, we obtained a least-square linear fit curve and its equation is as follows,
| FI = 4.20 × C + 29.06 | (1) |
Therefore, we can estimate the loading concentration or amount of IgG by measuring the fluorescent intensity. We note that under ideal conditions, the fitted curve should be perfectly linear; however, at higher concentrations, the fluorescence intensity tends to saturate, so the curve eventually flattens. In fact, measurements should be made in the linear range, which can be extended by using more sensitive fluorescence detectors.
Quantification of serum IgG
To demonstrate the use of LAFLQ for IgG quantification, we collected three human sera (Table 1). Serum IgG levels are routinely measured in clinical practice to provide information on the humoral immune status, such as immunodeficiency, liver disease, hematological disorder, infection and neoplastic malignancy.43–45 Therefore, it is important to quantify fucosylated IgG. In clinical practice, IgG can be measured by enzyme-linked immunosorbent assay (ELISA), turbidimetry, radial immunodiffusion (RID), and serum electrophoresis.46,47 Characterization of serum IgG indicates that its heavy chain has core-fucosylated complex N-glycans at its N-glycosite.48,49 Our method, LAFLQ, can be used to measure serum IgG since it contains core fucose.| Patient | IgG in serum (μg μL−1) | Amount of IgG (μg) | Calculated fluorescence intensity | Measured fluorescence intensity | Difference (%) |
|---|---|---|---|---|---|
| A | 14.0 | 21.0 | 117.3 | 111.3 ± 6.7 | 5.13 |
| B | 13.5 | 20.0 | 114.1 | 118.3 ± 7.6 | 3.51 |
| C | 11.9 | 18.0 | 104.0 | 107.0 ± 4.7 | 2.88 |
Once the protein loading concentration or amount (C) is given, eqn (1) can be used to estimate the theoretical fluorescence intensity (FI) of serum IgG. In Table 1, serum IgG concentration was first determined by turbidimetry, where 1.5 μL of serum was taken and tested in three human sera. The amount of IgG protein was determined from the IgG concentration and serum volume. Therefore, the theoretical FI is obtained by the calculation of eqn (1). The LAFLQ measured the FI of serum IgG in these samples. Here, we used AAL lectin instead of a three-lectin mixture. AAL lectin was successfully used in analysis to detect IgG fucosylated N-glycans.50 As shown in Table 1, the difference between measurement and calculation was less than 5.13%, demonstrating the accuracy and usefulness of LAFLQ for IgG quantification.
Evaluating the affinity of different lectins for salivary proteins
To verify the binding properties of AAL, LCA and UEA-I lectin to fucosylated glycans on glycoproteins. We did this by using different lectins individually to bind fucosylated proteins in saliva samples. As shown in Fig. 5A, UEA-I lectin alone showed increased α1,2 fucosylation levels in the lung cancer group compared with the other two groups, while there were no significant changes in the healthy control and other disease groups. This is consistent with our previous finding that saliva samples from lung cancer patients showed significantly higher levels of branched fucosylated glycans compared with healthy controls. As shown in Fig. 5B, using AAL lectin alone showed significant reductions in overall levels of fucosylated glycans in the other disease groups compared with the lung cancer group and healthy controls, and a slight increase in the lung cancer compared with healthy controls. AAL lectin has affinity for different fucose linkages, but FI results showed slight difference from our previous study of fucosylated N-glycan profiles in lung cancer saliva. Our results show that AAL lectin alone does not fully bind all the different fucose linkages in saliva. When LCA lectin was used alone, there was a significant difference between the lung cancer group and the other two groups (Fig. 5C). It indicated that the expression level of core fucosylated glycans in the saliva of the lung cancer group was significantly increased. This suggests that using a single lectin does not completely enrich all fucose linkages in saliva. Previous studies have shown that glycan structures in saliva are hyperfucosylated and contain more than three fucoses, so we chose to use a mixture of three lectins to test saliva samples, in order to comprehensively analyze the changes of fucosylated glycans in saliva. In the control sample (non-glycated BSA), as expected, a very low fluorescence was observed (Fig. S2†). It indicated that the background error for non-glycosylated proteins in complex samples was small (p < 0.05). | ||
| Fig. 5 Quantitative analysis by LAFLQ using three different lectins bound separately to salivary proteins. (A) Quantitative analysis using UEA-I lectin, showed significant changes between LC and other groups. (B) Quantitative analysis using AAL lectin. The level of fucosylated glycans was significantly lower in the OD group than in the remaining two groups. (C) Quantitative analysis using LCA lectin. The level of core fucosylated chitosan in LC group was significantly higher than that in the other two groups, and showed statistically significant differences. | ||
Upregulation of salivary protein fucosylation in lung cancer
To investigate the abundance of fucosylation in salivary glycoprotein, we used LAFLQ to quantify salivary fucosylation in HC, OD and LC (Table 2). Saliva samples took into account age and sex at diagnosis and distribution. To assess whether fucosylation differs between healthy controls (HC), other diseases (OD), and lung cancer (LC), we pooled saliva from each class into 3 pooled samples. The fucosylation of salivary glycoproteins was quantified by LAFLQ in triplicate (Fig. 6A). The fold-change (FC) between LC and HC was 1.4 and between LC and OD was 1.8, p-value < 0.05. To investigate the dynamic range of fucosylation quantification, individual samples from each group were tested using LAFLQ (Fig. 6B). The overall fucosylation changes of individual salivary glycoproteins were consistent with pooled saliva, confirming that fucosylation levels were indeed higher in LC than in HC or OD. The quantification of fucosylation by LAFLQ was also consistent with our previous studies using MS quantification.12 According to tumor-node-metastasis (TNM) classification system, the saliva samples were divided into early-stage lung cancer group (stage I & II) and advanced lung cancer group (stage III & IV). Fig. 6D showed that the level of fucosylation in the advanced lung cancer group was significantly higher than that in the early lung cancer group. Additional samples will be collected to further validate that fucosylation is a hallmark of salivary glycoproteins specific to lung cancer, including patients with gastric, laryngeal and oral cancers.| HC | OD | LC | |
|---|---|---|---|
| Demographic | N = 14 | N = 20 | N = 29 |
| Age at diagnosis | 49 ± 17 | 58 ± 16 | 64 ± 10 |
| Age distribution | 25–66 | 26–78 | 45–82 |
| Male | 10 | 12 | 20 |
| Female | 4 | 8 | 9 |
 | ||
| Fig. 6 Expression of salivary protein fucosylation in lung adenocarcinoma is higher than in healthy controls and other diseases, as quantified by LAFLQ. Each saliva sample was placed in a 96-well well for fluorescence reading, the list of samples is given in Table 2. (A) Fluorescence intensity of pooled saliva samples, lung cancer (LC) was 1.4 times higher than healthy controls (HC) and 1.8 - more than other diseases (OD). (B) Fluorescence quantification of a single saliva sample with a fold change (FC) of 1.2 between LC and HC and 1.4 between LC and OD. *p-value < 0.05 and **p-value < 0.005. (C) Fucosylation expression increases with cancer stage. N-Glycans were characterized by MALDI-MS. H = hexose (green or yellow circles), N = HexNAc (blue squares), F = fucose (red triangles). | ||
Discussion
Although saliva is remote from the biofluids secreted by the lung and its respiratory organs, comparative studies of lung and saliva proteins have shown that almost all salivary proteins are present in the lung. We list all proteins identified from lung tissue and saliva and convert protein accession identity to gene name.51 Caragata et al. identified 2158 proteins from whole saliva that were also present in those identified from lung tissue (11043) (Table S1†) (Fig. 1).16,17 Searching GlyGen for potential glycosylation of each salivary protein revealed that most salivary proteins are indeed glycosylated (Table S1†).52 The salivary fucosylation was significantly upregulated in lung cancer patients, not only on core fucose (α1,6) but also on antennary fucoses (α1,2 and α1,3).12 These fucosylation changes can be determined by MAIDI or liquid chromatography (LC) – MS, but it is desirable to use non-MS approaches to quantify fucosylation, especially in clinical applications. To achieve this goal, we developed a novel lectin-affinity fluorescent detection method specifically targeting fucosylated glycoproteins. The LAFLQ is achieved through multiple steps including fluorescent labeling on glycoproteins, lectin affinity enrichment on fucosylated glycoproteins, and high-throughput fluorescence quantification on lectin-captured fucoylated glycoproteins.
The lectin-first and fluorescence-first methods suggest that glycoproteins should first be labeled with fluorophore prior to lectin affinity enrichment (Fig. 3). These results demonstrate that (a) labeling of glycoproteins on their lysine or N-terminus does not adversely affect lectin affinity, and (b) labeling of glycoproteins after enrichment of fucosylated glycoproteins can also lead to labeling of lectins. Because labeled lectins are immobilized on beads, and quantification is measured with fluorescently labeled molecules, results include fluorescence intensities from lectins and glycoproteins. An excess of lectin was used, so the background FI was much higher than that of glycoproteins. Therefore, lectin-first quantification is not feasible. In contrast, fluorescence-first scheme does not result in lectin labeling, so the fluorescence intensity is derived only from fluorescently-labeled glycoproteins. The LAFLQ is performed in a 96-well plate and can be processed by an automatic liquid handler, thus providing the capability to process large numbers of samples simultaneously.
The LAFLQ can be used to quantify fucosylated glycoproteins in human biofluids. We used a combination or one of AAL, LCA, UEA-I lectins, which can bind α1,6, α1,2, and α1,3 linked fucoses.32,53 Thus, this method can quantify glycoprotein with core or antenna fucoses. IgG is one of the most abundant fucosylated glycoproteins in serum, and its abundance correlates with humoral immune status. A fast and accurate method for quantification of serum IgG is ideal for clinical applications. Our data suggest that serum IgG can be accurately quantified by fluorescence measurements, so its concentration can be calculated by the equation. It should be noted that linkage-specific fucosylation can be enriched by different lectins. As shown in Fig. 7, salivary glycoproteins were first enriched by UEA-I/TJA-II/PTL-II/LAA for α1,2 fucose, then by LTA for α1,3 fucose, and LCA/PSA for α1,6 fucose. Therefore, LAFLQ can be extended to quantify linkage-specific fucosylation by fluorescence intensity.
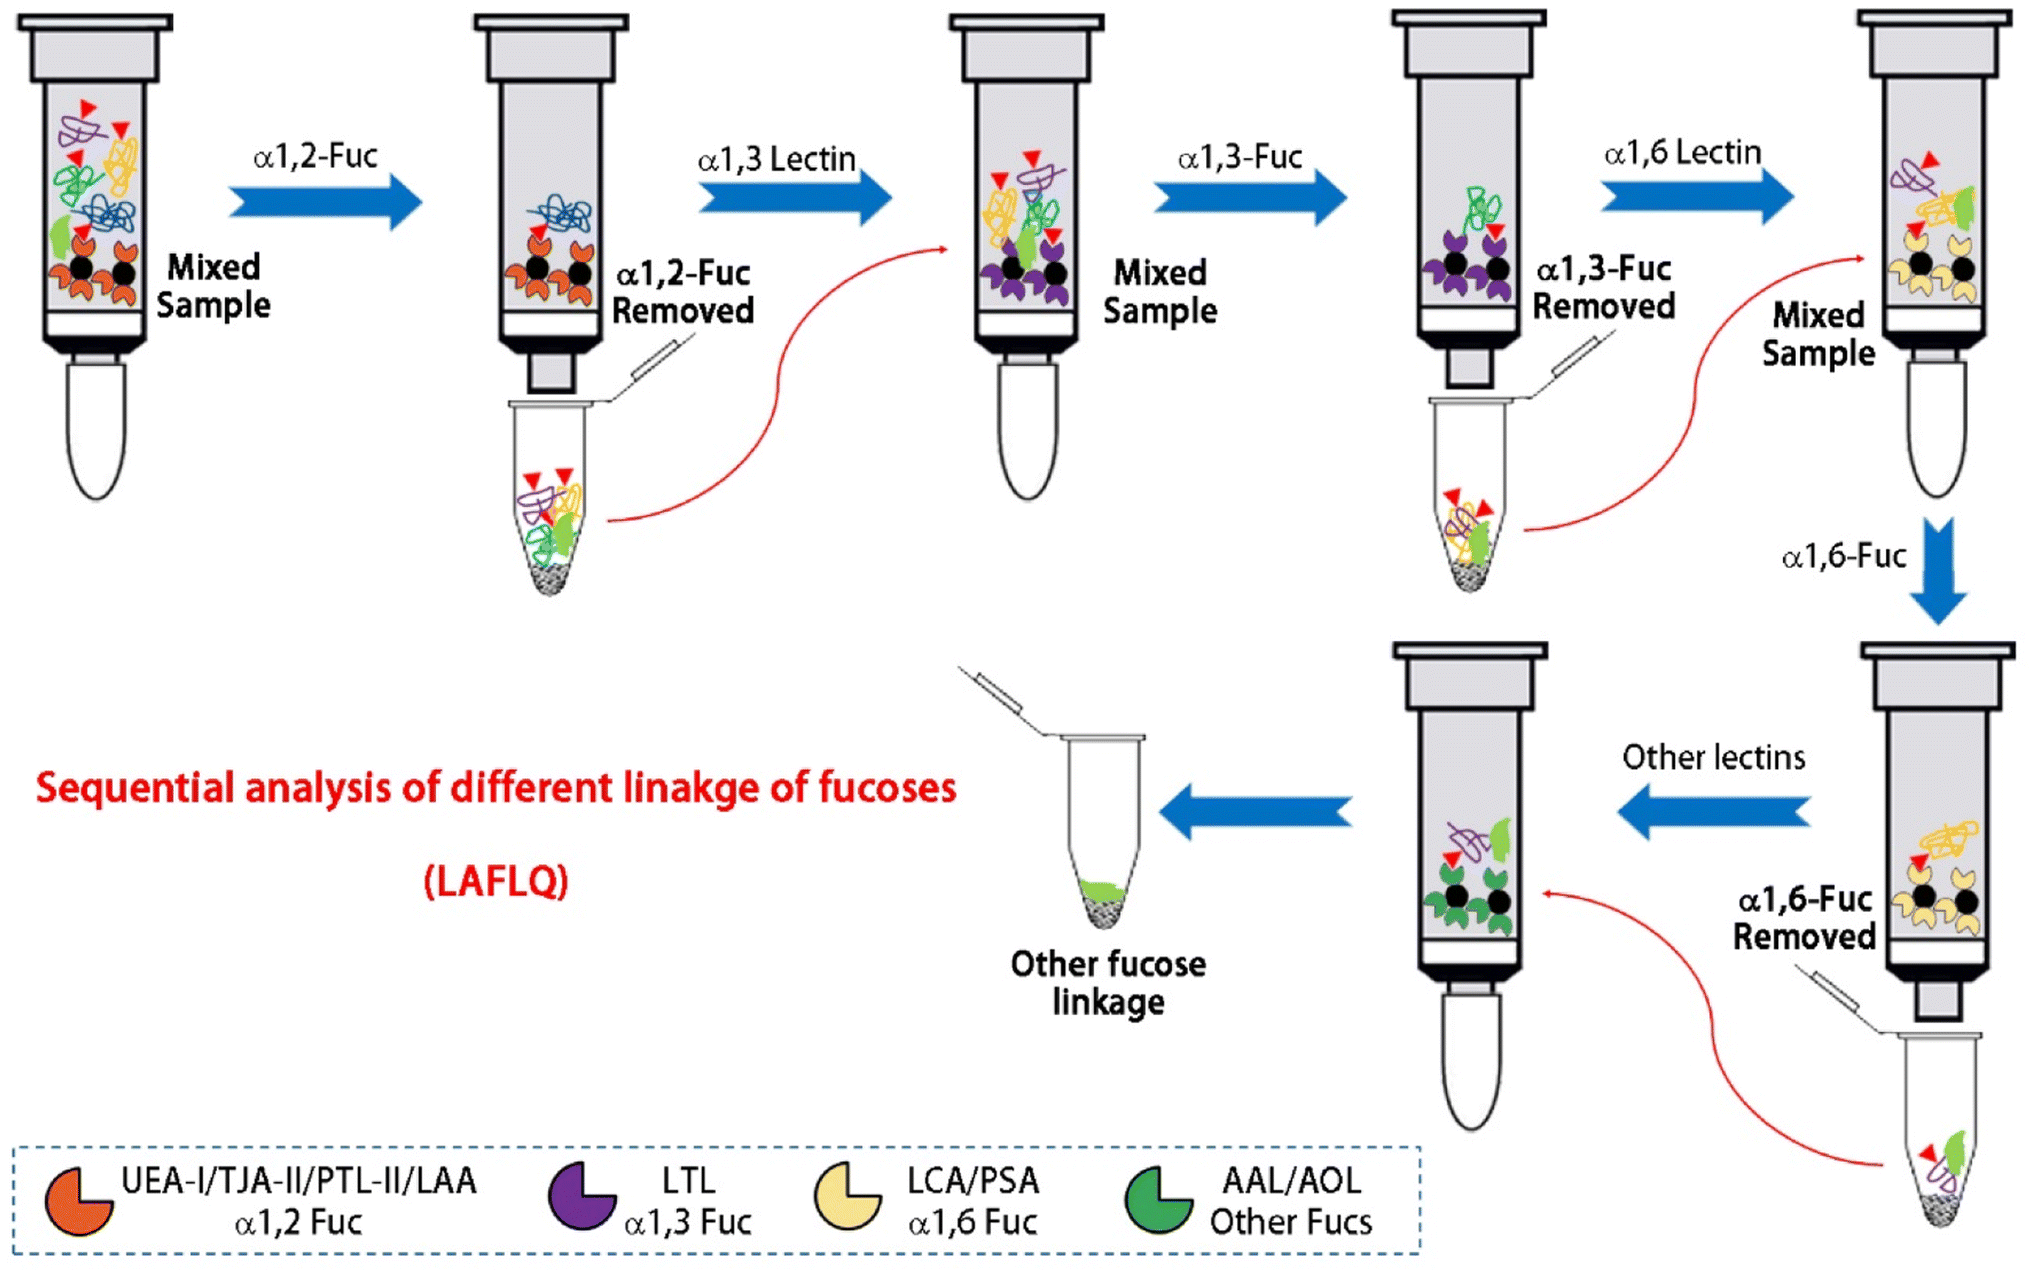 | ||
| Fig. 7 Sequential quantification of linkage-specific fucosylation of salivary glycoproteins using multiple lectins in series. Mixed sample can interact with different lectins and elute sequentially to separate α1,2-fucose by UEA-I, TJA-II, PTL-II or LAA from other linkages. The α1,3-fucose is enriched by LTL and the supernatant is further enriched by LCA or PSA to obtain α1,6-fucose. Other linkages are also obtained by AAL or AOL from non fucosylated glycoproteins or proteins. TJA-II = Trichosanthes japonica agglutinin II; PTL-II = Psophocarpus tetragonolobus II; LAA = Laburnum alpinum; LTL = Lotus tetragonolobus; PSA = Pisum sativum agglutinin; AOL = Asperigillus oryzae lectin. | ||
Quantification of LAFLQ in saliva of lung cancer patients shows potential clinical application in determining cancer staging. Our previous work has shown that salivary fucosylation increases with cancer stage, although more patient samples are needed to further confirm this observation. MALDI-MS analysis did show that fucosylated N-glycans gradually increased in later stages with hyperfucosylation of lung metastatic saliva (Fig. 6C). Our future work will yield an experimentally derived equation correlating fluorescence intensity with cancer stage, which we can use to predict lung cancer progression and assist clinical diagnosis.
Conclusions
Quantification of protein glycosylation in human biofluids helps identify underlying pathophysiological changes. Since abnormal changes in glycosylation reflect tumor initiation and progression, the discovery of cancer-specific glycosylation from clinical biofluids is critical. Our work has found that salivary fucosylation is closely associated with lung adenocarcinoma, and quantitative methods of salivary fucosylation are important for characterizing lung cancer. Fluorescent labels on lung cancer-specific fucosylated glycoproteins can quantify the abundance of salivary fucosylation by exploiting lectin affinity to enrich linkage-specific fucosylation. Since lung cancer salivary fucosylation is proportional to the tumor malignancy, the quantification of salivary fucosylation can reflect the stage of lung cancer. This method can also quantify serum IgG by its core fucose, as can other protein glycosylation, as long as appropriate lectins are used. We hope that this method has the potential to be applied to lung cancer diagnosis.Author contributions
Z. Y. G, J. J, S. Y. designed experiments and drafted manuscript; S. C, J. D, J. X. measured serum IgG and provided human sera; Z. W., X. Z. performed MALDI-MS; Z. Y. G., W. G., Y. X., M. S., Y. H., W. T., Z. Z., X. Y. collected saliva specimens; S. Y. finalized the manuscript. All authors reviewed the manuscript and the ESI.†Conflicts of interest
The authors declare no competing financial interest.Acknowledgements
This work was supported by the Soochow University Start-up Fund. We thank the Priority Academic Program Development of the Jiangsu Higher Education Institutes (PAPD), Jiangsu Science and Technology Plan Funding (BX2022023), and the Jiangsu Shuangchuang Boshi Funding (JSSCBS20210697).References
- A. Varki, R. D. Cummings, J. D. Esko, P. Stanley, G. W. Hart, M. Aebi, A. G. Darvill, T. Kinoshita, N. H. Packer and J. H. Prestegard, Essentials of Glycobiology, Cold Spring Harbor Laboratory Press, Cold Spring Harbor, New York, 4th edn, 2022 Search PubMed.
- R. A. Flynn, K. Pedram, S. A. Malaker, P. J. Batista, B. A. H. Smith, A. G. Johnson, B. M. George, K. Majzoub, P. W. Villalta, J. E. Carette and C. R. Bertozzi, Cell, 2021, 184, 3109–3124 CrossRef CAS PubMed.
- S. S. Pinho and C. A. Reis, Nat. Rev. Cancer, 2015, 15, 540–555 CrossRef CAS PubMed.
- N. E. Reticker-Flynn and S. N. Bhatia, Cancer Discovery, 2015, 5, 168–181 CrossRef CAS PubMed.
- L. R. Ruhaak, S. L. Taylor, C. Stroble, U. T. Nguyen, E. A. Parker, T. Song, C. B. Lebrilla, W. N. Rom, H. Pass and K. Kim, J. Proteome Res., 2015, 14, 4538–4549 CrossRef CAS PubMed.
- Y.-C. Liu, H.-Y. Yen, C.-Y. Chen, C.-H. Chen, P.-F. Cheng, Y.-H. Juan, C.-H. Chen, K.-H. Khoo, C.-J. Yu, P.-C. Yang, T.-L. Hsu and C.-H. Wong, Proc. Natl. Acad. Sci. U. S. A., 2011, 108, 11332–11337 CrossRef CAS PubMed.
- K. F. Medzihradszky, K. Kaasik and R. J. Chalkley, Mol. Cell. Proteomics, 2015, 14, 2103–2110 CrossRef CAS PubMed.
- C. A. Hayes, S. Nemes and N. G. Karlsson, Bioinformatics, 2012, 28, 1669–1676 CrossRef CAS PubMed.
- S. Sun, Y. Hu, M. Ao, P. Shah, J. Chen, W. Yang, X. Jia, Y. Tian, S. Thomas and H. Zhang, Clin. Proteomics, 2019, 16, 1–11 CrossRef CAS PubMed.
- M. Xu, A. Yang, J. Xia, J. Jiang, C.-F. Liu, Z. Ye, J. Ma and S. Yang, Transl. Res., 2022, 247, 1–19 CrossRef PubMed.
- Z. Gao, M. Xu, S. Yue, H. Shan, J. Xia, J. Jiang and S. Yang, Curr. Res. Pharmacol. Drug Discovery, 2021, 3, 1–13 Search PubMed.
- Z. Gao, Z. Wu, Y. Han, X. Zhang, P. Hao, M. Xu, S. Huang, S. Li, J. Xia, J. Jiang and S. Yang, ACS Omega, 2022, 7, 17894–17906 CrossRef CAS PubMed.
- M. Sondej, P. A. Denny, Y. Xie, P. Ramachandran, Y. Si, J. Takashima, W. Shi, D. T. Wong, J. A. Loo and P. C. Denny, Clin. Proteomics, 2009, 5, 52–68 CrossRef CAS PubMed.
- J. Zhang, Y. Zhong, P. Zhang, H. Du, J. Shu, X. Liu, H. Zhang, Y. Guo, Z. Jia, L. Niu, F. Yang and Z. Li, Glycobiology, 2019, 29, 242–259 CrossRef CAS PubMed.
- M. Uhlén, L. Fagerberg, B. M. Hallström, C. Lindskog, P. Oksvold, A. Mardinoglu, Å. Sivertsson, C. Kampf, E. Sjöstedt, A. Asplund, I. Olsson, K. Edlund, E. Lundberg, S. Navani, C. A. Szigyarto, J. Odeberg, D. Djureinovic, J. O. Takanen, S. Hober, T. Alm, P. H. Edqvist, H. Berling, H. Tegel, J. Mulder, J. Rockberg, P. Nilsson, J. M. Schwenk, M. Hamsten, K. von Feilitzen, M. Forsberg, L. Persson, F. Johansson, M. Zwahlen, G. von Heijne, J. Nielsen and F. Pontén, Science, 2015, 347, 1–9 CrossRef PubMed.
- J.-Y. Xu, C. Zhang, X. Wang, L. Zhai, Y. Ma, Y. Mao, K. Qian, C. Sun, Z. Liu, S. Jiang, M. Wang, L. Feng, L. Zhao, P. Liu, B. Wang, X. Zhao, H. Xie, X. Yang, L. Zhao, Y. Chang, J. Jia, X. Wang, Y. Zhang, Y. Wang, Y. Yang, Z. Wu, L. Yang, B. Liu, T. Zhao, S. Ren, A. Sun, Y. Zhao, W. Ying, F. Wang, G. Wang, Y. Zhang, S. Cheng, J. Qin, X. Qian, Y. Wang, J. Li, F. He, T. Xiao and M. Tan, Cell, 2020, 182, 245–261 CrossRef CAS PubMed.
- M. Caragata, A. K. Shah, B. L. Schulz, M. M. Hill and C. Punyadeera, Anal. Biochem., 2016, 497, 76–82 CrossRef CAS PubMed.
- S. Bandhakavi, M. D. Stone, G. Onsongo, S. K. Van Riper and T. J. Griffin, J. Proteome Res., 2009, 8, 5590–5600 CrossRef CAS PubMed.
- Y. Zhao, W. Jia, J. Wang, W. Ying, Y. Zhang and X. Qian, Anal. Chem., 2011, 83, 8802–8809 CrossRef CAS PubMed.
- C. Nwosu, H. K. Yau and S. Becht, Anal. Chem., 2015, 87, 5905–5913 CrossRef CAS PubMed.
- A. Kuno, N. Uchiyama, S. Koseki-Kuno, Y. Ebe, S. Takashima, M. Yamada and J. Hirabayashi, Nat. Methods, 2005, 2, 851–856 CrossRef CAS PubMed.
- A. Audfray, J. Claudinon, S. Abounit, N. Ruvoën-Clouet, G. Larson, D. F. Smith, M. Wimmerová, J. Le Pendu, W. Römer and A. Varrot, J. Biol. Chem., 2012, 287, 4335–4347 CrossRef CAS PubMed.
- K. W. Dehnert, B. J. Beahm, T. T. Huynh, J. M. Baskin, S. T. Laughlin, W. Wang, P. Wu, S. L. Amacher and C. R. Bertozzi, ACS Chem. Biol., 2011, 6, 547–552 CrossRef CAS PubMed.
- D. Bojar, L. Meche, G. Meng, W. Eng, D. F. Smith, R. D. Cummings and L. K. Mahal, ACS Chem. Biol., 2022, 17, 2993–3012 CrossRef CAS PubMed.
- J. A. Marrero, Z. Feng, Y. Wang, M. H. Nguyen, A. S. Befeler, L. R. Roberts, K. R. Reddy, D. Harnois, J. M. Llovet, D. Normolle, J. Dalhgren, D. Chia, A. S. Lok, P. D. Wagner, S. Srivastava and M. Schwartz, Gastroenterology, 2009, 137, 110–118 CrossRef CAS PubMed.
- C. Ohyama, M. Hosono, K. Nitta, M. Oh-eda, K. Yoshikawa, T. Habuchi, Y. Arai and M. Fukuda, Glycobiology, 2004, 14, 671–679 CrossRef CAS PubMed.
- T. Yoneyama, C. Ohyama, S. Hatakeyama, S. Narita, T. Habuchi, T. Koie, K. Mori, K. I. P. J. Hidari, M. Yamaguchi, T. Suzuki and Y. Tobisawa, Biochem. Biophys. Res. Commun., 2014, 448, 390–396 CrossRef CAS PubMed.
- A. F. Costa, D. Campos, C. A. Reis and C. Gomes, Trends Cancer, 2020, 6, 757–766 CrossRef CAS PubMed.
- A. Schietinger, M. Philip, B. A. Yoshida, P. Azadi, H. Liu, S. C. Meredith and H. Schreiber, Science, 2006, 314, 304–308 CrossRef CAS PubMed.
- B. Schmitz, J. Thiele, F. Otto, S. Theile-Ochel, T. Heedt, U. Zensen, S. E. Baldus, C. Wickenhauser and R. Fischer, Leukemia, 1996, 10, 1604–1614 CAS.
- N. Seta, S. Gayno, M. Jezequel-Cuer, M. L. Toueg, S. Erlinger and G. Durand, J. Hepatol., 1997, 26, 265–271 CrossRef CAS PubMed.
- J. Lee, I. Yeo, Y. Kim, D. Shin, J. Kim, Y. Kim, Y.-S. Lim and Y. Kim, J. Proteome Res., 2022, 21, 1548–1557 CrossRef CAS PubMed.
- R. Tian, X. Li, H. Zhang, L. Ma, H. Zhang and Z. Wang, ACS Omega, 2022, 7, 30405–30411 CrossRef CAS PubMed.
- S. Hu, Y. Xie, P. Ramachandran, R. R. Ogorzalek Loo, Y. Li, J. A. Loo and D. T. Wong, Proteomics, 2005, 5, 1714–1728 CrossRef CAS PubMed.
- K. Jessie, O. H. Hashim and Z. Rahim, Biotechnology, 2008, 7, 686–693 CrossRef CAS.
- S. Yang, Y. Li, P. Shah and H. Zhang, Anal. Chem., 2013, 85, 5555–5561 CrossRef CAS PubMed.
- S. Yang, Y. Hu, L. Sokoll and H. Zhang, Nat. Protoc., 2017, 12, 1229–1244 CrossRef CAS PubMed.
- S. Yang, E. Jankowska, M. Kosikova, H. Xie and J. Cipollo, Anal. Chem., 2017, 89, 9508–9517 CrossRef CAS PubMed.
- A. Ceroni, K. Maass, H. Geyer, R. Geyer, A. Dell and S. M. Haslam, J. Proteome Res., 2008, 7, 1650–1659 CrossRef CAS PubMed.
- S. Yang, A. Rubin, S. T. Eshghi and H. Zhang, Proteomics, 2016, 16, 241–256 CrossRef CAS PubMed.
- M. Wuhrer, J. C. Stam, F. E. van de Geijn, C. A. Koeleman, C. T. Verrips, R. J. Dolhain, C. H. Hokke and A. M. Deelder, Proteomics, 2007, 7, 4070–4081 CrossRef CAS PubMed.
- M. L. A. De Leoz, D. L. Duewer, A. Fung, L. Liu, H. K. Yau, O. Potter, G. O. Staples, K. Furuki, R. Frenkel and Y. Hu, Mol. Cell. Proteomics, 2020, 19, 11–30 CrossRef CAS PubMed.
- L. D. Notarangelo, A. Fischer, R. S. Geha, J.-L. Casanova, H. Chapel, M. E. Conley, C. Cunningham-Rundles, A. Etzioni, L. Hammartröm, S. Nonoyama, H. D. Ochs, J. Puck, C. Roifman, R. Seger and J. Wedgwood, J. Allergy Clin. Immunol., 2009, 124, 1161–1178 CrossRef CAS PubMed.
- F. R. Velazquez, D. O. Matson, M. L. Guerrero, J. Shults, J. J. Calva, A. L. Morrow, R. I. Glass, L. K. Pickering and G. M. Ruiz-Palacios, J. Infect. Dis., 2000, 182, 1602–1609 CrossRef CAS PubMed.
- R. Saldova, L. Royle, C. M. Radcliffe, U. M. Abd Hamid, R. Evans, J. N. Arnold, R. E. Banks, R. Hutson, D. J. Harvey, R. Antrobus, S. M. Petrescu, R. A. Dwek and P. M. Rudd, Glycobiology, 2007, 17, 1344–1356 CrossRef CAS PubMed.
- M. Sievert, G. Schuler, K. Büttner and A. Wehrend, J. Equine Vet. Sci., 2022, 114, 1–7 Search PubMed.
- A. Dunn, C. Duffy, A. Gordon, S. Morrison, A. Argűello, M. Welsh and B. Earley, J. Appl. Anim. Res., 2018, 46, 758–765 CrossRef CAS.
- M. Wuhrer, J. C. Stam, F. E. van de Geijn, C. A. M. Koeleman, C. T. Verrips, R. J. E. M. Dolhain, C. H. Hokke and A. M. Deelder, Proteomics, 2007, 7, 4070–4081 CrossRef CAS PubMed.
- A. Castilho, C. Gruber, A. Thader, C. Oostenbrink, M. Pechlaner, H. Steinkellner and F. Altmann, mAbs, 2015, 7, 863–870 CrossRef CAS PubMed.
- G. Lu and L. A. Holland, Anal. Chem., 2019, 91, 1375–1383 CrossRef CAS PubMed.
- F. Koopmans, P. van Nierop, M. Andres-Alonso, A. Byrnes, T. Cijsouw, M. P. Coba, L. N. Cornelisse, R. J. Farrell, H. L. Goldschmidt, D. P. Howrigan, N. K. Hussain, C. Imig, A. P. H. de Jong, H. Jung, M. Kohansalnodehi, B. Kramarz, N. Lipstein, R. C. Lovering, H. MacGillavry, V. Mariano, H. Mi, M. Ninov, D. Osumi-Sutherland, R. Pielot, K. H. Smalla, H. Tang, K. Tashman, R. F. G. Toonen, C. Verpelli, R. Reig-Viader, K. Watanabe, J. van Weering, T. Achsel, G. Ashrafi, N. Asi, T. C. Brown, P. De Camilli, M. Feuermann, R. E. Foulger, P. Gaudet, A. Joglekar, A. Kanellopoulos, R. Malenka, R. A. Nicoll, C. Pulido, J. de Juan-Sanz, M. Sheng, T. C. Südhof, H. U. Tilgner, C. Bagni, À. Bayés, T. Biederer, N. Brose, J. J. E. Chua, D. C. Dieterich, E. D. Gundelfinger, C. Hoogenraad, R. L. Huganir, R. Jahn, P. S. Kaeser, E. Kim, M. R. Kreutz, P. S. McPherson, B. M. Neale, V. O'Connor, D. Posthuma, T. A. Ryan, C. Sala, G. Feng, S. E. Hyman, P. D. Thomas, A. B. Smit and M. Verhage, Neuron, 2019, 103, 217–234 CrossRef CAS PubMed.
- W. S. York, R. Mazumder, R. Ranzinger, N. Edwards, R. Kahsay, K. F. Aoki-Kinoshita, M. P. Campbell, R. D. Cummings, T. Feizi, M. Martin, D. A. Natale, N. H. Packer, R. J. Woods, G. Agarwal, S. Arpinar, S. Bhat, J. Blake, L. J. G. Castro, B. Fochtman, J. Gildersleeve, R. Goldman, X. Holmes, V. Jain, S. Kulkarni, R. Mahadik, A. Mehta, R. Mousavi, S. Nakarakommula, R. Navelkar, N. Pattabiraman, M. J. Pierce, K. Ross, P. Vasudev, J. Vora, T. Williamson and W. Zhang, Glycobiology, 2019, 30, 72–73 CrossRef PubMed.
- K. Fukushima, T. Satoh, S. Baba and K. Yamashita, Glycobiology, 2009, 20, 452–460 CrossRef PubMed.
Footnote |
| † Electronic supplementary information (ESI) available. See DOI: https://doi.org/10.1039/d3ra00072a |
| This journal is © The Royal Society of Chemistry 2023 |