
 Open Access Article
 This Open Access Article is licensed under a Creative Commons Attribution-Non Commercial 3.0 Unported Licence
Removing unreacted amino groups in graphitic carbon nitride through residual heating to improve the photocatalytic performance†
Wen-Jun Zhang,
Feng-Jue Wang,
Han Liu,
Yue Wang and
Meng Chen *
*
Department of Materials Science, Fudan University, Shanghai 200433, China. E-mail: chenmeng@fudan.edu.cn
First published on 27th February 2023
Abstract
In most of the research about graphitic carbon nitride (g-C3N4), g-C3N4 is prepared through the calcination of nitrogen-rich precursors. However, such a preparation method is time-consuming, and the photocatalytic performance of pristine g-C3N4 is lackluster due to the unreacted amino groups on the surface of g-C3N4. Therefore, a modified preparation method, calcination through residual heating, was developed to achieve rapid preparation and thermal exfoliation of g-C3N4 simultaneously. Compared with pristine g-C3N4, the samples prepared by residual heating had fewer residual amino groups, a thinner 2D structure, and higher crystallinity, which led to a better photocatalytic performance. The photocatalytic degradation rate of the optimal sample for rhodamine B could reach 7.8 times higher than that of pristine g-C3N4.
Introduction
In modern society, although the rapid development of industry has greatly enriched the material life of mankind, the problems it has brought about, such as energy shortages and environmental pollution, have restricted social progress. Photocatalysis, one of the solutions to the above problems, has received considerable attention since the phenomenon of photocatalytic water splitting by TiO2 was found.1 However, traditional photocatalysts, such as TiO2, ZnO, and CdS, have some shortcomings, including large band gaps, limited sources of raw materials, and heavy metal pollution, which have limited their practical applications.2–4In recent decades, numerous efforts have been made to synthesize metal-free photocatalysts. At present, graphitic carbon nitride (g-C3N4) is one of the most popular metal-free photocatalysts. g-C3N4 is an n-type semiconductor consisting of only carbon and nitrogen elements, making its raw materials easy to obtain. Typically, pristine g-C3N4 can be prepared through the thermal polycondensation reaction of N-rich precursors, such as urea, dicyandiamide, and melamine.5–9 The band gap of g-C3N4 is ∼2.7 eV, and the band structure is suitable, therefore, it can be applied to degrade organic contaminants and split water under visible irradiation.10–13 Pristine g-C3N4, however, suffers from many drawbacks, including narrow optical absorption range, high recombination efficiency of charge carriers, low specific surface area, and so on, which make its photocatalytic performance unsatisfactory.14–18 Up to now, many strategies, including building heterojunctions,19,20 doping,21 and morphology controlling,22,23 have been developed to improve the photocatalytic performance of g-C3N4 materials.
In the process of thermal polycondensation, there are a large amount of non-condensed surface amino groups in g-C3N4 due to the solid-state kinetic hindrance. As a result, g-C3N4 used in most studies is essentially amorphous or semi-crystalline.24 These amino groups act as structural defects that can trap photogenerated charges, leading to low photocatalytic activity.25 To improve the crystallinity of g-C3N4, the amino groups need to be fully reacted in the thermal polycondensation. One of the common solutions to overcome the solid-state kinetic hindrance is reacting in liquid molten salt. For example, Xiang's group synthesized hollow spherical precursors via the self-assembly of melamine and cyanuric acid, and then annealed the precursors in KCl–LiCl molten salt to prepare highly crystalline g-C3N4 hollow spheres;26 Zhong's group reported a kind of Zn-doped crystalline g-C3N4 through calcining melamine in KCl–ZnCl2 molten salt.27 However, the molten salt method is faced with some disadvantages: (i) for different materials, it is important and difficult to find suitable molten salt (or a molten salt system); (ii) cleaning and collecting the product is time-consuming. Chen's group improved the crystallinity of g-C3N4 through the Ni-foam template method.28 In a typical process, Ni-foam was immersed in the dicyandiamide solution and then dried, leading to the recrystallization of dicyandiamide anchored on the Ni-foam. High-crystalline g-C3N4 nanosheets could be obtained by heating the Ni-foam at 550 °C and then removing it with hydrochloric acid. In the process of heating, Ni-foam could not only play as the template for g-C3N4 deposition but also the catalyst for the dehydrogenation of amino groups. But analogous to the molten salt method, the template method also required a long time to collect the products. Moreover, some attempts to improve the crystallinity of g-C3N4 through the high temperature–high pressure (HT–HP) route have been made according to the graphite-to-diamond phase transition.29,30 However, harsh reaction conditions limit the practical application of the HT–HP route.
The above investigations suggest us look for a simple and fast way to reduce the content of amino groups. Considering that the amino groups are the residue of incomplete thermal polycondensation, one of the most convenient methods to remove them is increasing the reaction temperature. It is well-known that the increase of the reaction temperature can improve the reaction kinetics, as well as make the chemical equilibrium move to the direction of product formation. In addition, high-temperature thermal treatment can exfoliate g-C3N4, which can help increase specific surface area and create active sites.31 However, prolonged calcination at high temperatures (≥550 °C) may lead to the decomposition of g-C3N4. Therefore, inspired by residual cooking, a modified calcination method—residual heating—has been developed. In the process of residual heating, an empty furnace is heated to a high temperature (≥650 °C) and then powered off, the waste heat in the furnace is used to calcine the precursor to obtain high-crystalline g-C3N4.
In this work, we have successfully prepared g-C3N4 with excellent photocatalytic performance through residual heating, and deeply studied the influence of the parameters in this method on the products. The effects of the chemical structure, morphology, optical property, and band structure of our samples on photocatalytic performance have also been systematically discussed according to a series of characterization results.
Experimental section
Materials
Urea, dicyandiamide, melamine, p-benzoquinone (BQ), sodium ethylenediamine tetraacetate (EDTA), and rhodamine B (RhB) were purchased from Sinopharm Chemical Reagent Co., Ltd. Ethanol (≥99.7%) was purchased from Shanghai Titan Scientific Co., Ltd. Isopropanol (IPA) were purchased from Shanghai Dahe Chemical Reagent Co., Ltd. All the chemicals were used without further purification. Deionized water was used in all experiments.Catalyst synthesis
The procedure of the residual heating was described as follows: an empty muffle furnace was heated to a certain initial temperature (800, 750, 700, and 650 °C) with the rate of 10 °C min−1. 5 g dicyandiamide in a covered crucible was quickly put into the furnace, and then the furnace was closed and powered off. After naturally cooling to room temperature, the sample was ground and collected. This sample was denoted as DCN-X (X was the value of the initial temperature). In addition, the samples prepared by urea and melamine were denoted as UCN-X and MCN-X, respectively.To investigate the effect of reaction time on the products, the preparation procedure of DCN-750 was slightly adjusted: the covered crucible with dicyandiamide was taken out of the muffle furnace after a T-minute calcination (T = 2, 4, 6, 8, 10, 20, 30, and 60 min) and quickly cooled to room temperature. After naturally cooling to room temperature, the sample was ground and collected. This sample was denoted as DCN-750-T.
Pristine g-C3N4 was synthesized via traditional calcination.5 Briefly, 5 g precursor (urea, dicyandiamide, or melamine) was put into a covered crucible and calcined at 550 °C in the air for 4 h, with a heating rate of 5 °C min−1. After naturally cooling to room temperature, the sample was ground and collected. This sample was denoted as pristine UCN, DCN, and MCN, respectively.
Characterization
The morphology and selected area electron diffraction (SAED) patterns of the as-prepared samples were observed by transmission electron microscope (TEM, FEI TECNAI G20) with an operating voltage of 200 kV; and the operating voltage of high-resolution TEM (HRTEM) was 150 kV. The crystal structure of our photocatalysts was determined by X-ray diffraction (XRD) operated on Bruker D8 ADVANCE spectrometer with a Cu Kα radiation source. NICOLET NEXUS 470 spectrometer was used to collect the Fourier transform infrared spectra (FTIR) of samples with the range of 4000–400 cm−1. The chemical states of the elements on as-prepared materials were obtained by using the X-ray photoelectron (XPS) spectroscopy carried out by a KRATOS AXIS ULTRA-DLD spectrometer and nuclear magnetic resonance (NMR) spectroscopy carried out by a Bruker 400WB AVANCE III spectrometer with a 4 mm zirconia rotor. The binding energy of the C 1s peak (284.8 eV) was employed as a standard to calibrate the binding energies of the other elements. The light absorption and bandgap energy of the photocatalysts were determined by UV-vis diffuse reflectance spectroscopy (DRS) on SHIMADZU-UV250 spectrometer with BaSO4 as a reflectance standard. The detail of the band structure was obtained by XPS valence band spectroscopy. The recombination efficiency of the photogenerated carriers was investigated by fluorescence spectroscopy (PL) on SHIMADZU RF-5301PC spectrometer. Electron paramagnetic resonance (EPR) spectroscopy was conducted on an A300 spectrometer (Bruker, Germany) at liquid-nitrogen temperature. Electrochemical measurements were performed using a standard three electrode system on an electrochemical working station (CHI 660E, China).Photocatalytic experiments
Photocatalytic degradation of RhB was used to test the photocatalytic performance of our samples under visible-light irradiation. The photocatalyst (50 mg) was added into RhB aqueous solution (50 mL, 10 mg L−1). The mixture was stirred for 1 h under the dark condition to achieve adsorption–desorption equilibrium. The visible light (λ < 420 nm) produced by a 200 W xenon lamp was used as the light source in our photocatalytic experiment. At certain time intervals, 4 mL of the mixture was centrifuged and then the supernatant was immediately measured by UV-vis spectrometer at 554 nm. The procedure of the recyclability experiment was described as follows: the catalyst was collected after every process of degradation, washed with water and ethanol, and then used in the next cycle.Results and discussion
Change of the furnace temperature and yield
The change of the furnace temperature over time during the preparation process of residual heating was recorded and fitted to obtain the curves of temperature change. The change of the furnace temperature over time of DCN-X was shown in Fig. 1(a), it could be seen that the cooling rate gradually slows down as time increases. Taking DCN-800 as an example, the furnace temperature quickly dropped to 550 °C when the time reached 60 min, and then to 200 °C when the time was 360 min. The temperature change curves of UCN-X and MCN-X, which were shown in Fig. S1(a and b),† were similar to those of DCN-X. The product derived from urea could only be obtained when the initial temperature was 650 °C because urea was easy to decompose when heated. To further understand the details of temperature change, the differential of the temperature change curve of DCN-800 was obtained in Fig. 1(b). It could be observed that the cooling rate gradually decreases from 6 °C min−1 to 0. To determine the reaction time of thermal polymerization, the differential of the temperature change curve of MCN-800 was also obtained in Fig. 1(b). The changes of the two differential curves became consistent after 150 min, indicating that the cooling after 150 min was only caused by the temperature difference between the furnace and the environment, namely the thermal polymerization of DCN-800 was terminated at 150 min (∼370 °C).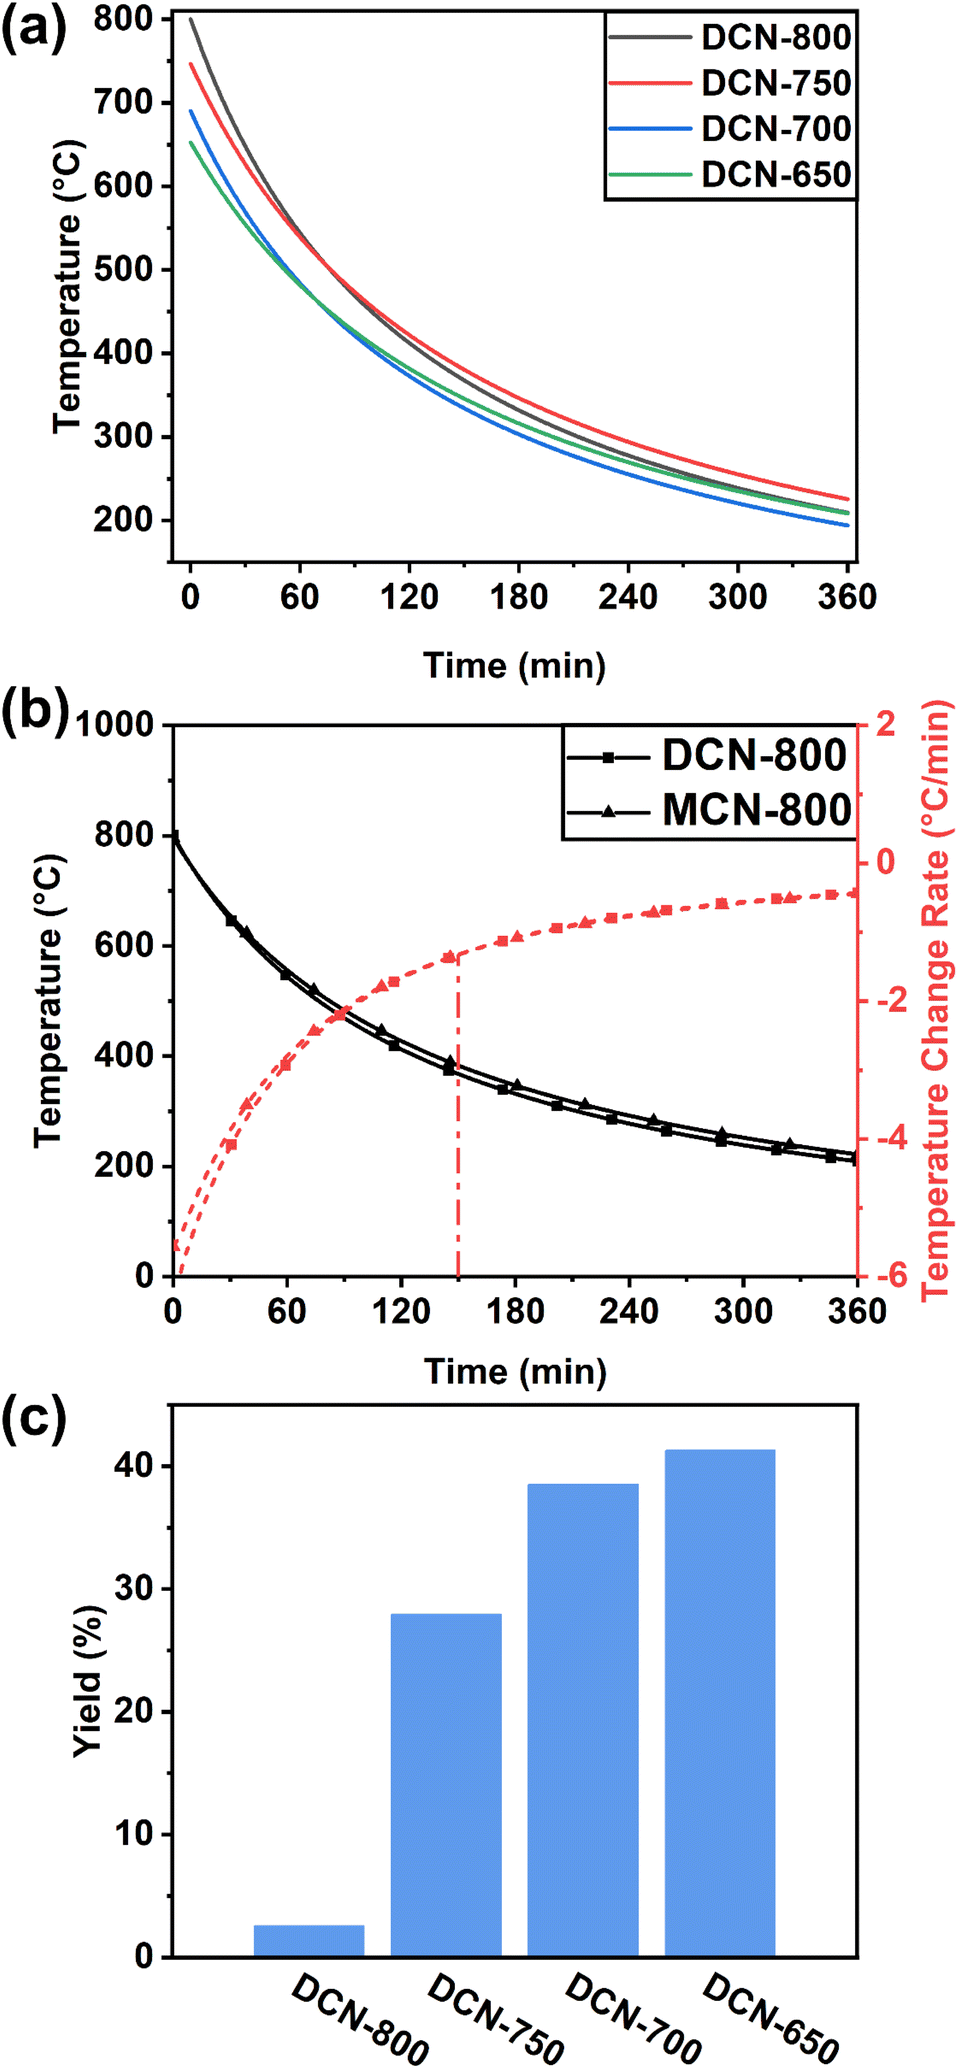 | ||
| Fig. 1 (a) Change of the furnace temperature during the preparation process of DCN-X; (b) curves of temperature change of DCN-800 and MCN-800, and their differential curves; (c) yields of DCN-X. | ||
As shown in Fig. 1(c), the yields of DCN-800, DCN-750, DCN-700, and DCN-650 were 3%, 28%, 39%, and 41%, respectively, while the yield of pristine DCN was 40%. The yields of UCN-X and MCN-X were shown in Fig. S1(c):† the yield of UCN-650 was only 1%, while the yield of pristine UCN was 5%; the yields of MCN-800, MCN-750, MCN-700, and MCN-650 were 3%, 8%, 15%, and 23%, respectively, while the yield of pristine DCN was 42%. The yields of the samples prepared through residual heating were generally lower than that through traditional calcination, which should be caused by the strong thermal decomposition of precursors under high temperatures in the early stage of residual heating.
Morphology
TEM was employed to observe the morphology of samples. As displayed in Fig. 2(b–e), a typical 2D layer structure was presented in DCN-X samples, and the thickness went decreasing with the increase of initial temperature. The thickness of pristine DCN (Fig. 2(a)) was smaller than that of DCN-650, while it was larger than that of DCN-700, DCN-750, and DCN-800. The change of thickness could be attributed to the thermal exfoliation. Jiang's group has reported that g-C3N4 could be exfoliated through thermal treatment, and the higher the temperature of thermal treatment applied, the thinner the g-C3N4 nanosheets could be obtained.31 Therefore, the thickness of the DCN samples decreased with the rising of the initial temperature in the residual heating. It was well-known that a thin 2D structure usually means a high specific surface area, and thus great photocatalytic performance. Therefore, compared with pristine DCN, the photocatalytic performance of DCN-700, DCN-750, and DCN-800 might be better. In addition, there were some differences between pristine DCN and DCN-X samples: pristine DCN was folded nanosheet with a large size; while the nanosheet of DCN-X samples was smaller, and there were many fragments on the nanosheet. These differences might be due to the inadequate time of thermal polymerization in residual heating.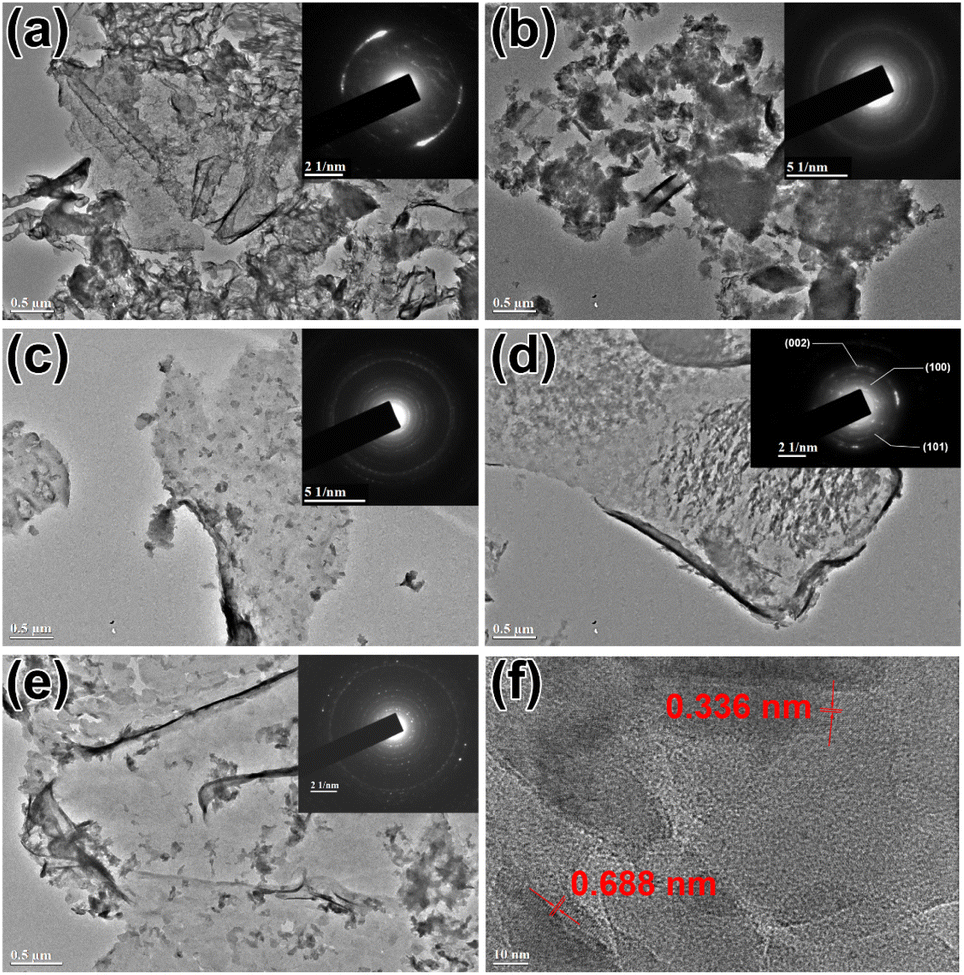 | ||
| Fig. 2 TEM images of (a) pristine DCN, (b) DCN-650, (c) DCN-700, (d) DCN-750, and (e) DCN-800, the insets were their SAED patterns; (f) HRTEM image of DCN-750. | ||
Further morphological analysis was performed via HRTEM image. As shown in Fig. 2(f), lattice fringes were found in the HRTEM image of DCN-750, which illustrated the high crystallinity of DCN-750. Two types of exposed facets could be determined in DCN-750: the facet with a lattice distance of 0.336 nm could be attributed to the (002) facet of g-C3N4,32 and the facet with a lattice distance of 0.688 nm indicated the exposure of the (100) facet of g-C3N4.33 It was noteworthy that (100) as an exposed facet was quite different from the results in most literature.26,34–36 A relevant study by Wang's group has proved that electrons were energetically favorable to transfer toward the (100) facet in photocatalytic reactions, so the exposure of the (100) facet was beneficial to the enhancement of the photocatalytic performance.37
SAED was used to further characterize the crystallinity of DCN-X samples, and the results were shown in the insets of Fig. 2(a–e). In line with our expectation, DCN-X samples exhibited high crystallinity: there was only an incomplete ring that represented the (002) facet in the SAED pattern of pristine DCN, while many diffraction rings accompanied by irregularly distributed spots could be observed in the SAED patterns of DCN-X samples. Taking the SAED pattern of DCN-750 in the inset of Fig. 2(f) as an example, some diffraction rings could be attributed to the (100), (101), and (002) facets of g-C3N4, respectively.
Crystal structure and chemical structure
The crystal structures of DCN-X samples were investigated through XRD. As displayed in Fig. 3(a), all samples show a typical XRD pattern of g-C3N4: the characteristic peak at 13.0° and 27.6° can be attributed to (100) and (002) facets of g-C3N4, respectively.38 The intensity of the characteristic peak assigned to (002) facet gradually decreases with the increase of initial temperature, which could be ascribed to the exfoliation caused by high temperature.31,39 Furthermore, compared with pristine DCN, the full width at half-maximum (FWHM) of the DCN-X samples' peak assigned to (002) facet markedly narrowed, suggesting the higher crystallinity of the product of residual heating.26 Notably, the position of this characteristic peak slightly right-shifted to 28.0°. This phenomenon, which also appeared in a kind of highly crystalline g-C3N4 synthesized by Zhong's group, could be attributed to the compressed interlayer distance caused by van der Waals interaction among (002) layers.27 The right-shift also happened in the XRD patterns of MCN-X samples (Fig. S2(b)†). The XRD results of UCN-X samples were slightly different. As shown in Fig. S2(a),† the characteristic peaks of g-C3N4 at 12.7° and 27.6° appeared in the XRD patterns of pristine UCN and UCN-650. Moreover, some small peaks, including 17.5° and 29.3° in pristine UCN, and 29.9° in the XRD pattern of UCN-650, could be observed due to the low XRD intensity of the samples.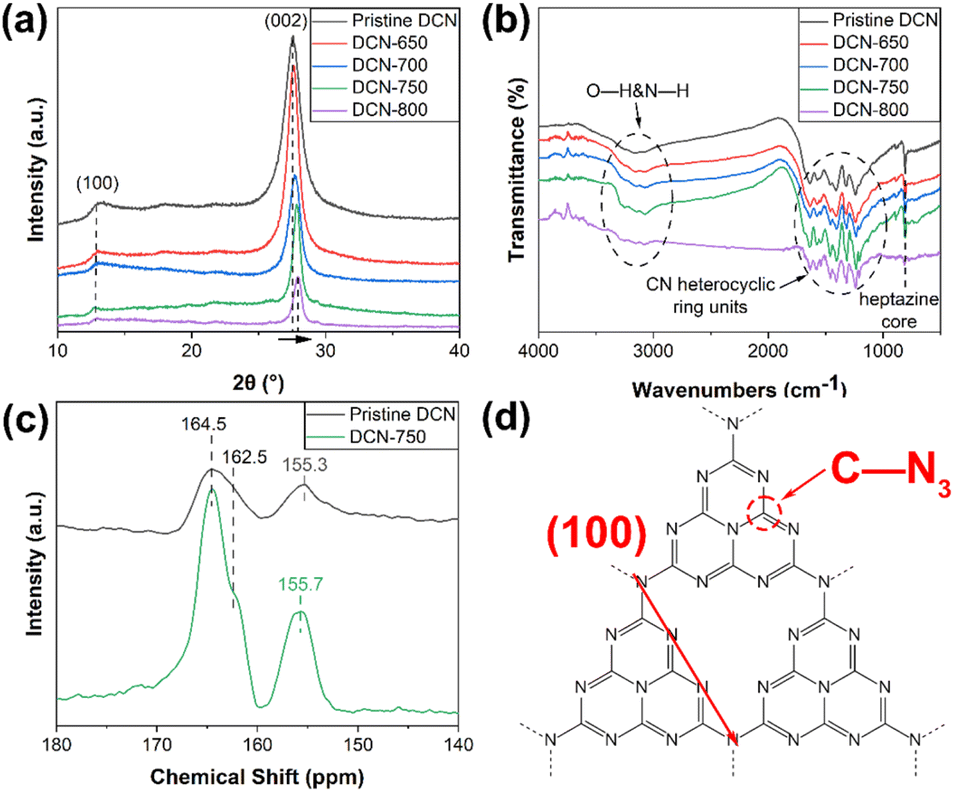 | ||
| Fig. 3 (a) XRD patterns and (b) FTIR spectra of DCN-X samples; (c) NMR spectra of pristine DCN and DCN-750; (d) structure of g-C3N4. | ||
The chemical structures of DCN-X samples were preliminarily determined by FTIR measurements. As shown in Fig. 3(b), DCN-X samples had the same FTIR spectra as pristine DCN. The peak at 808 cm−1 was ascribed to the vibrations of heptazine cores, the multiple peaks located between 1240 and 1650 cm−1 were attributed to the various vibration modes of CN heterocyclic ring units, the broad band at 2900–3300 cm−1 was related to the vibrational stretching modes of O–H and N–H.40,41 The FTIR spectra of UCN-X and MCN-X samples in Fig. S2(c and d)† also showed similar results, indicating that the chemical structure of g-C3N4 prepared through residual heating was the same as that of pristine g-C3N4.
To learn the structural difference between pristine and our samples, NMR spectra of pristine DCN and DCN-750 were measured in Fig. 3(c). In the 13C NMR spectrum of pristine DCN, three peaks located at 164.5 ppm, 162.5 ppm, and 155.3 ppm, which were belong to C–NH2, C–NH, and C–N3 bonds, respectively.42 In the 13C NMR spectrum of DCN-750, the chemical shift of the C–N3 was ∼0.4 ppm higher than that for pristine DCN. As seen in Fig. 3(d), the C atom C–N3 located in the heptazine rings, so the chemical shift meant that the heptazine rings in DCN-750 were intact. This should thank to the short calcination time during residual heating, which could not break too many heptazine rings. Owing to these heptazine rings, the exposed (100) facet of DCN-750 could be observed in the HRTEM image.
More detailed chemical structures of the samples were analyzed through XPS. The XPS full survey spectrum of DCN-750 was presented in Fig. 4(a): only C, N, and O elements existed in the as-prepared photocatalyst, which was consistent with our expectations. The high-resolution C 1s spectrum in Fig. 4(b) showed the peaks at 288.2 eV and 284.8 eV, which could be assigned to C![[double bond, length as m-dash]](https://www.rsc.org/images/entities/char_e001.gif) N and C–C in the CN heterocyclic structures of g-C3N4, respectively.40,43 The N 1s spectrum, as shown in Fig. 4(c), could be divided into three characteristic peaks at 400.5 eV, 399.1 eV, and 398.5 eV, which were attributed to amino functions carrying hydrogen (C–N–H), tertiary nitrogen groups (C–N3), and sp2-hybridized nitrogen in triazine rings (C–NC), respectively.44 In addition, a small peak at 404.7 eV was generated by the π-electron excitation.45 These results were consistent with the XPS spectra of pristine DCN (Fig. S3†), which revealed the existence of g-C3N4 microstructure in DCN-750. As for the O 1s spectrum in Fig. 4(d), it could be deconvoluted into two peaks at 533.0 eV and 531.9 eV, which could be assigned to C–N–O and the surface hydroxyl groups, respectively.46
N and C–C in the CN heterocyclic structures of g-C3N4, respectively.40,43 The N 1s spectrum, as shown in Fig. 4(c), could be divided into three characteristic peaks at 400.5 eV, 399.1 eV, and 398.5 eV, which were attributed to amino functions carrying hydrogen (C–N–H), tertiary nitrogen groups (C–N3), and sp2-hybridized nitrogen in triazine rings (C–NC), respectively.44 In addition, a small peak at 404.7 eV was generated by the π-electron excitation.45 These results were consistent with the XPS spectra of pristine DCN (Fig. S3†), which revealed the existence of g-C3N4 microstructure in DCN-750. As for the O 1s spectrum in Fig. 4(d), it could be deconvoluted into two peaks at 533.0 eV and 531.9 eV, which could be assigned to C–N–O and the surface hydroxyl groups, respectively.46
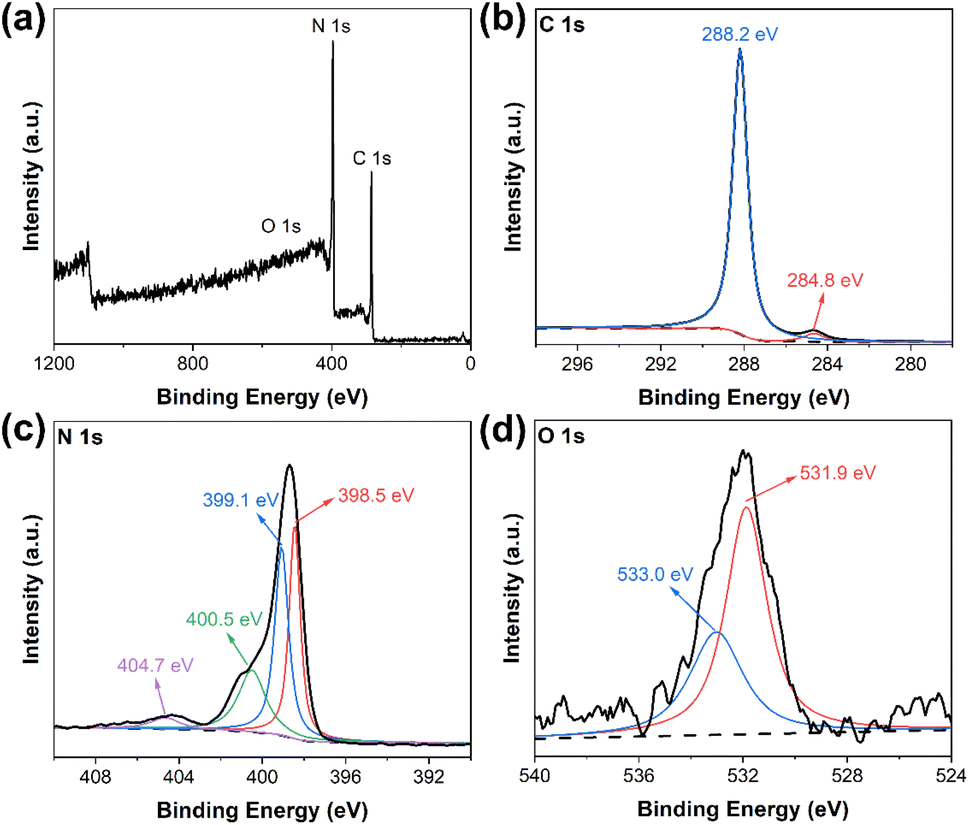 | ||
| Fig. 4 (a) XPS survey spectrum of DCN-750; high-resolution XPS spectra of (b) C 1s, (c) N 1s, and (d) O 1s of DCN-750. | ||
To investigate the influence of the initial temperature of residual heating on the amino groups in the products, high-resolution XPS spectra of N 1s of DCN-650, DCN-700, and DCN-800 were also deconvoluted in Fig. S4.† The specific intensity values of the peak for C–N–H to that for C–NC, which could be used to evince the completion of C–N conjugate framework,25 were listed in Table 1. It could be seen that the specific peak intensity declined when the initial temperature rose from 600 °C to 750 °C, indicating the increase of initial temperature could reduce the content of amino groups, and thus lead to more complete heptazine rings.25 There was a slight increase in the specific intensity when the initial temperature reached 800 °C, which might be due to the high-temperature-induced structural destruction in g-C3N4. Moreover, the contents of the amino groups in DCN-700, DCN-750, and DCN-800 were less than that in pristine DCN, which elucidated that the unreacted amino groups could be efficiently removed through residual heating. Furthermore, the mass ratios of C/N were also estimated in Table 1. The mass ratio of C/N increased from 0.55 to 0.59 with the rising of the initial temperature, which was close to the value of highly crystalline carbon nitride hollow spheres (C/Nmass = 0.6) prepared by Xiang's group.26 Such a result suggested less content of amino groups and a better-aligned crystalline structure of g-C3N4 in DCN-750. Overall, the XPS results strongly demonstrated the feasibility of residual heating in reducing the amino groups and increasing the crystallinity of g-C3N4.
| Samples | Peak intensity (C–N–H)/peak intensity (C–NC) |
C/N |
|---|---|---|
| Pristine DCN | 0.700 | 0.549 |
| DCN-650 | 0.989 | 0.555 |
| DCN-700 | 0.530 | 0.577 |
| DCN-750 | 0.417 | 0.589 |
| DCN-800 | 0.496 | 0.585 |
Optical property and band structure
The light absorption and bandgap energy of DCN-X samples were learned by DRS measurement. As shown in Fig. 5(a), the absorption edges of DCN-650, DCN-700, DCN-750, and DCN-800 were at 465 nm, 475 nm, 495 nm, and 490 nm, respectively, which were all located in the visible region. With the increase of initial temperature, the absorption edges of the samples had a tendency of red-shift, which could be ascribed to the tighter conjugated aromatic ring system and reinforced packing of the joint heptazine system.47 Moreover, the absorption edge of DCN-800 had a blue-shift, which could be attributed to the structural destruction in g-C3N4 caused by the overhigh initial temperature. Compared with pristine DCN, whose absorption edge was at 456 nm, the DCN samples had lager light absorption ranges, which was conducive to the utility of visible light.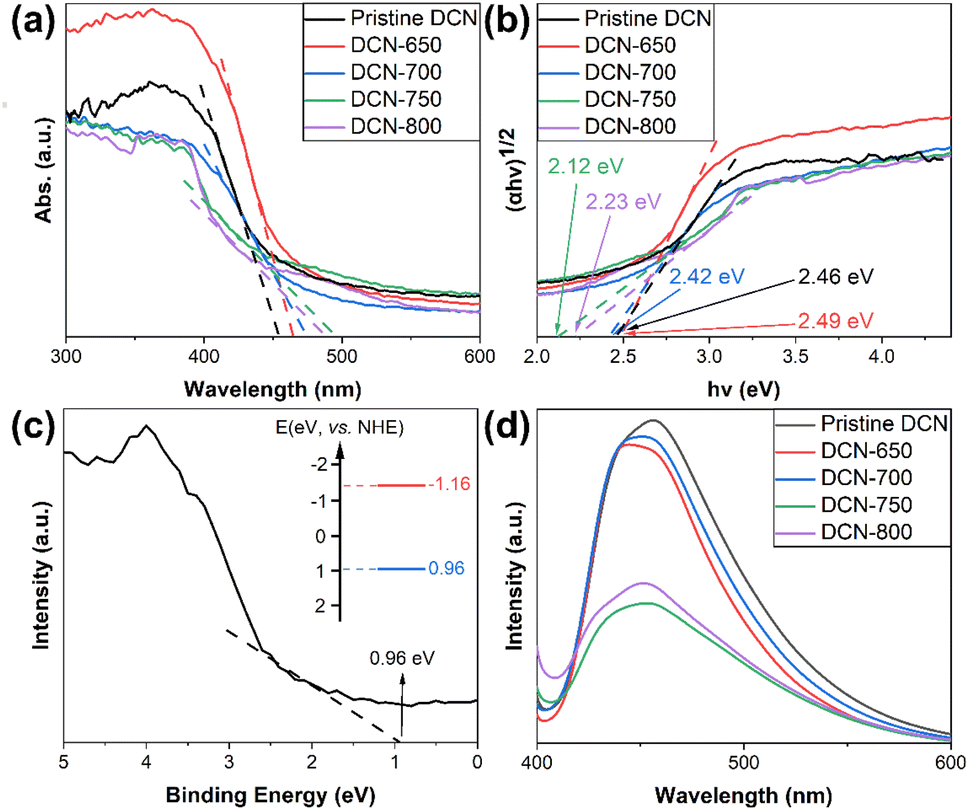 | ||
| Fig. 5 (a) DRS spectra and (b) Tauc plots of DCN-X samples; (c) XPS valence-band spectrum of DCN-750; (d) PL spectra of DCN-X samples. | ||
To determine the band gap (Eg), Kubelka–Munk model was used to obtain the Tauc plots of DCN-X samples:48
| (αhν)1/n = A(hν − Eg) |
XPS valence-band spectrum was carried out to evaluate the valence band maximum (VB) and conduction band minimum (CB) of DCN-750. As shown in Fig. 5(c), the binding energy of DCN-750 was 0.96 eV, which was obtained by linear extrapolation. As a result, the band structure of DCN-750 could be obtained, which was displayed in the inset of Fig. 5(c). The valence band maximum was EV = 0.96 eV (vs. NHE), and the conduction band minimum was EC = −1.16 eV (vs. NHE).
PL measurement was performed to clarify the recombination efficiency of photogenerated carriers in our samples. It was well-known that the intensity of PL peak could reflect the recombination efficiency of photogenerated carriers, which influenced the photocatalytic activity of semiconductors. The PL spectra of DCN-X samples were measured with the excitation wavelength at 382 nm at room temperature, as depicted in Fig. 5(d). The intensive fluorescence emission peaks of all samples appeared at 440–450 nm, suggesting the transition of photogenerated electrons from n to π*.52 In terms of the intensity of the PL peaks, the peak intensity of pristine DCN was the largest, and that of DCN-650 and DCN-700 were slightly smaller; the peak intensities of DCN-750 and DCN-800 decreased strongly with the increase of initial temperature. This demonstrated the increase of initial temperature could promote the migration of photogenerated electrons and thereby reduced the recombination efficiency, which suggested the improvement of photocatalytic performance.
Photocatalytic performance
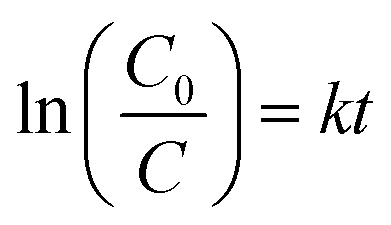
where C0 was the initial concentration of RhB solution, C was the concentration of RhB solution at irradiation time t (min), and k (min−1) was the apparent reaction rate constant of RhB degradation. The fitted lines of ln(C0/C) against time (t) of DCN-X samples were plotted in Fig. 6(b). The kinetic rate constants k of DCN-700, DCN-750, and DCN-800 were calculated as 0.02098 min−1, 0.06695 min−1, and 0.04054 min−1 according to the fitted lines, which were 1.6, 5.0, and 3.0 times higher than that of pristine DCN. This indicated that the photocatalytic performance of g-C3N4 derived from dicyandiamide could be effectively improved through residual heating when the initial temperature was 700–800 °C, and the optimal temperature was 750 °C.
 | ||
| Fig. 6 (a) Photocatalytic rates and (b) kinetics of DCN-X; (c) photocatalytic rates and (d) kinetics of UCN-X; (e) photocatalytic rates and (f) kinetics of MCN-X. | ||
Photocatalytic degradation abilities of UCN-X and MCN-X samples for RhB were also tested. As shown in Fig. 6(c), 98.0% of RhB could be degraded by pristine UCN in 10 min, while the time required was 30 min by DCN-650. The comparison of kinetic rate constants in Fig. 6(d) showed that the photocatalytic performance of UCN-650 was only 38% of that of pristine UCN. Therefore, the initial temperature of 650 °C was exorbitant for the residual heating of urea, which led to the poor photocatalytic activity of UCN-650. In addition, considering the intense thermal decomposition of urea, we thought that the amount of urea should be increased while rising the initial temperature to obtain UCN samples, such as UCN-700 and UCN-800. The photocatalytic performance of MCN-X samples was shown in Fig. 6(e), which was similar to that of DCN-X samples. Within 30 min, the degradation rates of pristine MCN, MCN-650, MCN-700, MCN-750, and MCN-800 for RhB were 36.4%, 16.5%, 22.2%, 88.6%, and 82.7%, respectively. So when the initial temperature was between 650 and 750 °C, the photocatalytic performance of the MCN samples improved with the increase of initial temperature. The photocatalytic performance, however, slightly decreased when the initial temperature reached 800 °C. Such a situation was similar to that of the DCN samples, suggesting the overhigh temperature of 800 °C might break the structure of MCN-800. These results demonstrated that the optimal initial temperature for the residual heating of melamine was 750 °C. Furthermore, the photocatalytic performance of MCN-650 and MCN-700 was worse than that of pristine MCN, while MCN-750 and MCN-800 exhibited better photocatalytic performance than pristine MCN. By calculating the kinetic rate constants (Fig. 6(f)), it could be known that the photocatalytic abilities of MCN-750 and MCN-800 were 3.5 and 2.8 times higher than that of pristine MCN, respectively, which suggested the universality of residual heating to enhance the photocatalytic performance of g-C3N4 materials.
Firstly, DCN-750-T samples were preliminarily characterized. The morphology of DCN-750-T samples could be observed in TEM images, which were shown in Fig. 7. It could be found that the thin 2D structure appeared since DCN-750-4 and went thinner with the increase of reaction time. Furthermore, the crystallinity became high after 6 min according to the SAED patterns in the insets of Fig. 7. As shown in Fig. 8(a), XRD was used to study the crystal structure of DCN-750-T samples. A typical XRD pattern of g-C3N4 appeared at 6 min, suggesting the formation of the graphitic structure was rapid. With the increase of reaction time, the characteristic peak of the (002) facet slightly right-shifted, which illustrated that the crystallinity of the samples went higher gradually. The results of FTIR (Fig. 8(b)) showed that the chemical structure of g-C3N4 has formed since 2 min. These characterization results indicated that the g-C3N4 with high crystallinity formed quickly within 6 min.
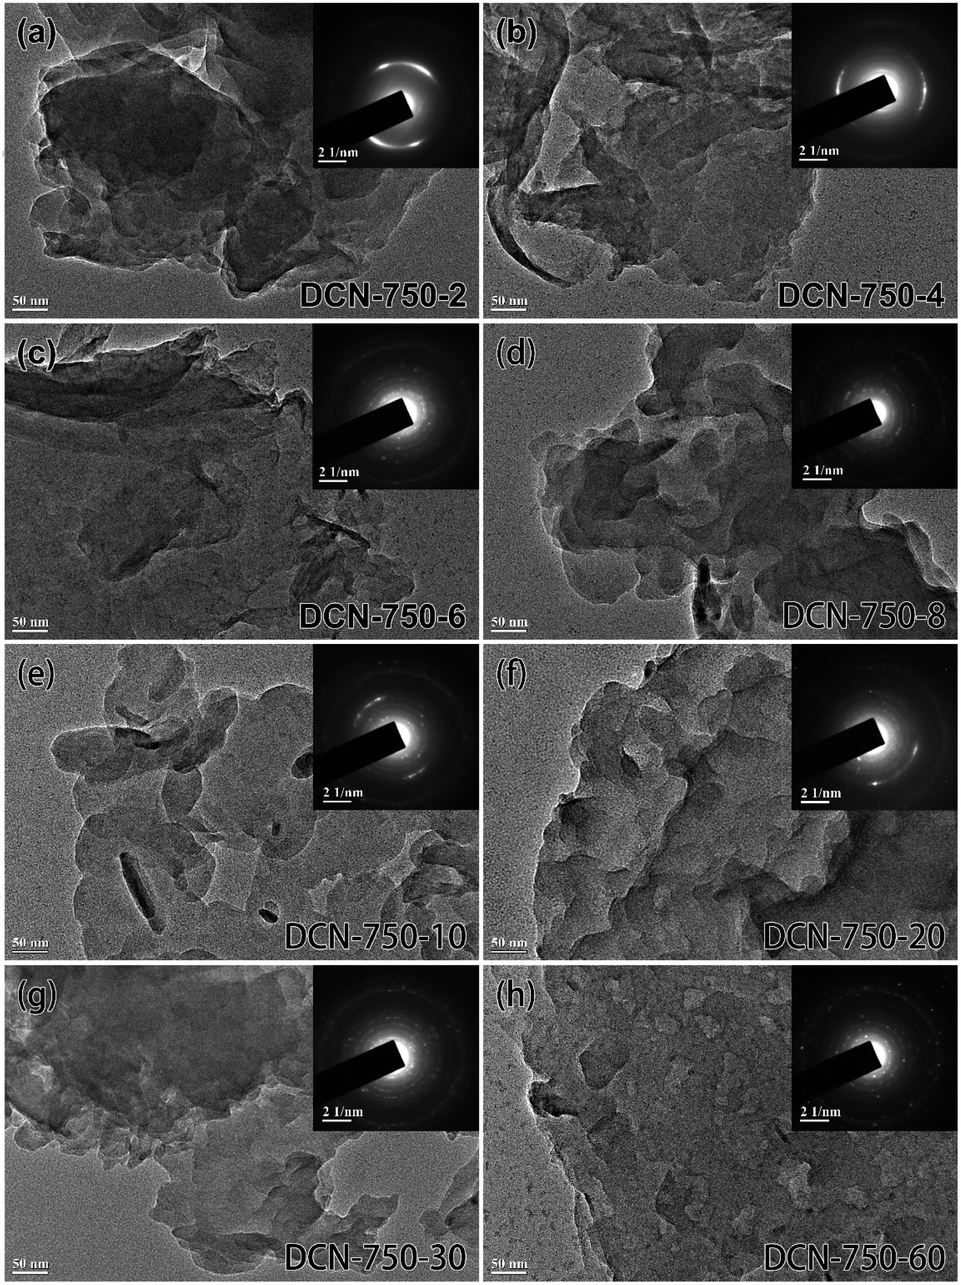 | ||
| Fig. 7 TEM images of DCN-750-T samples with different reaction times, the insets are their respective SAED patterns. | ||
 | ||
| Fig. 8 (a) XRD patterns, (b) FTIR spectra, (c) optimization of photocatalytic performance and yield, and (d) kinetics of DCN-750-T. | ||
As shown in Fig. 8(c), the photocatalytic performance of DCN-750-T samples for RhB was tested, and the yields were also calculated. The degradation rate of DCN-750-2 was only 22.2% within 30 min. When the reaction time became 10 min (DCN-750-10), the degradation rate within 30 min soared to 95.5%. With a further increase of reaction time, the degradation rate would remain stable. As for yield, it would decrease from 44% to 27% with the increase of reaction time, which could be due to the broken structure of g-C3N4 caused by the long-time calcination during the process of residual heating. The kinetic rate constants of DCN-750-T samples were estimated, which were depicted in Fig. 8(d). It could be found that DCN-750-20 had the maximal k value, which was 0.10476 min−1, and 7.8 times higher than that of pristine DCN. The yield of DCN-750-20 reached 30%, which was higher than that of DCN-750. Therefore, g-C3N4 with higher yield and better photocatalytic performance could be conveniently obtained by controlling the reaction time of residual heating. The XPS and NMR spectra of DCN-750-20 were displayed in Fig. S5,† which could demonstrate the chemical structure of DCN-750-20 was consistent with that of DCN-750.
In addition, a g-C3N4 sample was also prepared by calcining dicyandiamide under 750 °C for 20 min. The degradation rate of this sample for RhB within 30 min was 94.7% under 200 W visible light, which was similar to the photocatalytic ability of DCN-750-20. The yield of this sample, however, was only 20%, which was lower than that of DCN-750-20. This result reflected the advantage of residual heating in yield.
To comprehensively illustrate the feasibility of residual heating, we found the photocatalytic performance data of RhB degradation over other g-C3N4 materials from recent reports and made a comparison with our photocatalysts. Other g-C3N4 materials usually needed 300 W visible-light irradiation, and the degradation time was long (more than 40 min).50,53,54 As for DCN-750-20 and MCN-750 in our study, they could effectively degrade RhB within a shorter time under 200 W visible-light irradiation.
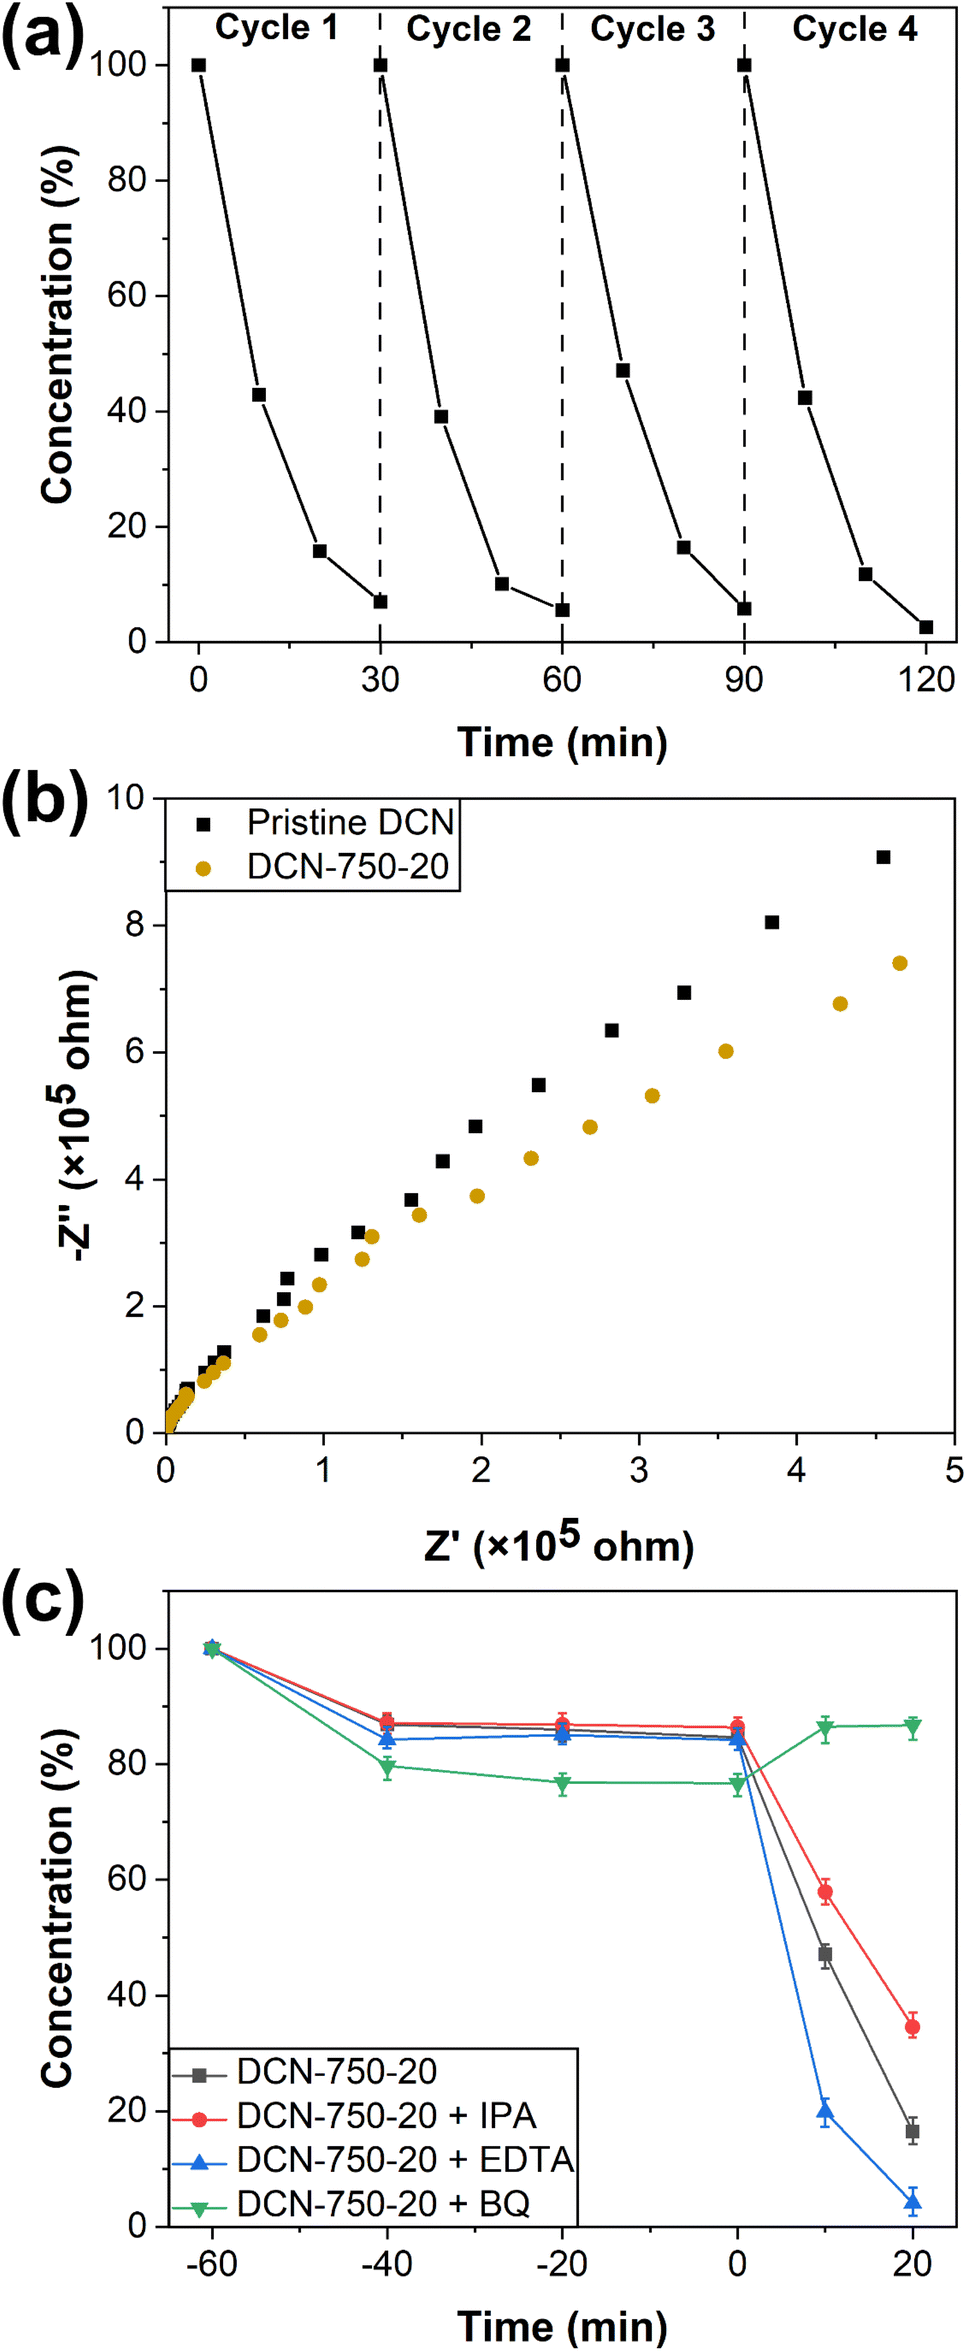 | ||
| Fig. 9 (a) Recyclability of DCN-750-20 for the photocatalytic degradation of RhB; (b) EIS of pristine DCN and DCN-750-20; (c) scavenger experiments of DCN-750-20 for RhB degradation. | ||
Mechanism of photocatalysis
To deeply understand the mechanism of photocatalysis, electrochemical impedance spectroscopy (EIS) and scavenger experiments were performed. The EIS spectra of pristine DCN and DCN-750-20 were exhibited in Fig. 9(b). EIS spectrum of DCN-750-20 owned a smaller arc radius than that of pristine DCN, demonstrating lower charge-migration resistance of DCN-750-20 and thus higher separation efficiency of photogenerated carriers in DCN-750-20.55 This result was also consistent with the PL spectra, indicating the excellent photocatalytic performance of the samples prepared through residual heating.Scavenger experiments were used to identify the active oxidation species during the process of RhB degradation. Oxidation species, such as holes (h+), hydroxyl radicals (·OH), and superoxide radicals (·O2−), can play a crucial role in the reaction of dye degradation. To investigate the photocatalytic mechanism of our samples, EDTA, BQ, and IPA were introduced into the photocatalytic experiment of DCN-750-20 for RhB degradation as scavengers for h+, ·O2− and ·OH, respectively.46,56 As shown in Fig. 9(c), the degradation efficiency decreased slightly with the addition of IPA, suggesting that ·OH might play a role in the photocatalytic degradation reaction. The addition of EDTA promoted the degradation efficiency, implying that e− could influence the degradation efficiency. Considering that e− was usually ineffective in oxidation reactions, the reason for this phenomenon might be that EDTA captures h+, and then improved the separation efficiency of photogenerated carriers.56 The photocatalyst became completely useless with the addition of BQ, indicating that photogenerated ·O2− was the reactive species during the photocatalytic degradation for RhB. The upward degradation curve of DCN-750-20 + BQ after 0 min could be attributed to the change of the adsorption–desorption equilibrium after irradiation.
Given the discussion above, the plausible mechanism of photocatalytic degradation for RhB over DCN-750-20 through multiple pathways could be speculated:57–59 on one hand, photo-generated carriers were activated in the photocatalyst under the light irradiation. The photo-generated electrons moved to the surface of the photocatalyst and reacted with the dissolved oxygen in the solution to create ·O2−; simultaneously, the photo-generated holes could react with H2O molecules to produce ·OH. Then, these oxidative radicals could attack a more liable oxidation azo group to break the dye molecules, leading to the degradation of RhB. The degradation mechanism induced by photocatalyst could be described as follows:
| DCN-750-20 + hν → DCN-750-20(h+) + DCN-750-20(e−) | (1) |
| DCN-750-20(e−) + O2 → DCN-750-20 + ·O2− | (2) |
| DCN-750-20(h+) + H2O → DCN-750-20 + ·OH | (3) |
| ·O2−/·OH + RhB → degradation products | (4) |
On the other hand, with the transfer of the photo-generated electrons from the excited dye molecules to the photocatalyst surface, the oxidized dye molecules might also undergo self-degradation. The excited dye molecules absorbed on the surface of the photocatalyst (RhB@DCN-750-20) could also react with hydroxyl ions to generate hydroxyl radical, which was helpful for the degradation of RhB. The degradation mechanism induced by dye could be described as follows:
| RhB@DCN-750-20 + hν → ·RhB+@DCN-750-20(e−) | (5) |
| ·RhB+@DCN-750-20(e−) + O2 → · + RhB@DCN-750-20(·O2−) | (6) |
| RhB@DCN-750-20(·O2−) + H2O → RhB@DCN-750-20(OH−) | (7) |
| · + RhB@DCN-750-20(OH−) → RhB@DCN-750-20(·OH) → DCN-750-20 + degradation products | (8) |
Conclusions
In summary, g-C3N4 with fewer amino groups was successfully prepared through residual heating. It had a unique exposed (100) facet, thin 2D layer structure, narrow bandgap, and suitable band structure, which led to more excellent photocatalytic performance than pristine g-C3N4. The photocatalytic performance of our samples could reach up to 7.8 times higher than that of pristine g-C3N4 by controlling the initial temperature and reaction time. Moreover, as shown in Table 2, compared with traditional calcination, residual heating showed many advantages, such as convenience and energy conservation. Accordingly, residual heating was a feasible and effective strategy to prepare g-C3N4, as well as a potential method of solid phase synthesis for other materials.| Preparation method | Traditional calcination | Residual heating |
|---|---|---|
| Sample | Pristine DCN | DCN-750-20 |
| Duration of heating | More than 350 min | 95 min |
| Electricity consumption | 5 kW h | 3.5 kW h |
| Yield | ∼40% | ∼30% |
| Degradation efficiency for RhB | 36.1% in 30 min | 95.8% in 30 min |
Conflicts of interest
There are no conflicts to declare.Acknowledgements
We gratefully acknowledge the National Key Research and Development Program of China (2017YFA0207301), and the National Natural Science Foundation of China (21890751, 21471036).Notes and references
- A. Fujishima and K. Honda, Nature, 1972, 238, 37–38 CrossRef CAS PubMed.
- S. Yang, Y. Chen, J. Zheng and Y. Cui, J. Environ. Sci., 2007, 19, 86–89 CrossRef CAS PubMed.
- J. Sun, S. Dong, Y. Wang and S. Sun, J. Hazard. Mater., 2009, 172, 1520–1526 CrossRef CAS PubMed.
- T. Senasu, T. Chankhanittha, K. Hemavibool and S. Nanan, Mater. Sci. Semicond. Process., 2021, 123, 105558 CrossRef CAS.
- X. Wang, K. Maeda, A. Thomas, K. Takanabe, G. Xin, J. M. Carlsson, K. Domen and M. Antonietti, Nat. Mater., 2009, 8, 76–80 CrossRef CAS PubMed.
- H. Yu, R. Shi, Y. Zhao, T. Bian, Y. Zhao, C. Zhou, G. I. N. Waterhouse, L. Wu, C.-H. Tung and T. Zhang, Adv. Mater., 2017, 29, 1605148 CrossRef PubMed.
- Q. Tang, Z. Sun, S. Deng, H. Wang and Z. Wu, J. Colloid Interface Sci., 2020, 564, 406–417 CrossRef CAS PubMed.
- X. Zhai, J. Liu, L. Hu, J. Bao and Y. Lan, Chemistry, 2018, 24, 15930–15936 CrossRef CAS PubMed.
- B. Zhang, X. Hu, E. Liu and J. Fan, Chin. J. Catal., 2021, 42, 1519–1529 CrossRef CAS.
- H. Wang, M. Li, H. Li, Q. Lu, Y. Zhang and S. Yao, Mater. Des., 2019, 162, 210–218 CrossRef CAS.
- S. Cao, J. Low, J. Yu and M. Jaroniec, Adv. Mater., 2015, 27, 2150–2176 CrossRef CAS PubMed.
- Y. Zhang, J. Liu, G. Wu and W. Chen, Nanoscale, 2012, 4, 5300–5303 RSC.
- F. Longobardo, G. Gentile, A. Criado, A. Actis, S. Colussi, V. Dal Santo, M. Chiesa, G. Filippini, P. Fornasiero, M. Prato and M. Melchionna, Mater. Chem. Front., 2021, 5, 7267–7275 RSC.
- W.-J. Ong, L.-L. Tan, Y. H. Ng, S.-T. Yong and S.-P. Chai, Chem. Rev., 2016, 116, 7159–7329 CrossRef CAS PubMed.
- J. Zhou, J. Xue, Q. Pan, X. Yang, Q. Shen, T. Ma, X. Liu and H. Jia, J. Photochem. Photobiol., A, 2019, 372, 147–155 CrossRef CAS.
- S. Zhang, C. Hu, H. Ji, L. Zhang and F. Li, Appl. Surf. Sci., 2019, 478, 304–312 CrossRef CAS.
- Q. Lu, J. Deng, Y. Hou, H. Wang, H. Li and Y. Zhang, Chem. Commun., 2015, 51, 12251–12253 RSC.
- J. Lu, Y. Shi, Z. Chen, X. Sun, H. Yuan, F. Guo and W. Shi, Chem. Eng. J., 2023, 453, 139834 CrossRef CAS.
- F. Guo, X. Huang, Z. Chen, L. Cao, X. Cheng, L. Chen and W. Shi, Sep. Purif. Technol., 2021, 265, 118477 CrossRef CAS.
- F. Guo, Z. Chen, X. Huang, L. Cao, X. Cheng, W. Shi and L. Chen, Sep. Purif. Technol., 2021, 275, 119223 CrossRef CAS.
- E. Liu, X. Lin, Y. Hong, L. Yang, B. Luo, W. Shi and J. Shi, Renewable Energy, 2021, 178, 757–765 CrossRef CAS.
- H. Yuan, W. Shi, J. Lu, J. Wang, Y. Shi, F. Guo and Z. Kang, Chem. Eng. J., 2023, 454, 140442 CrossRef CAS.
- X. Sun, Y. Shi, J. Lu, W. Shi and F. Guo, Appl. Surf. Sci., 2022, 606, 154841 CrossRef CAS.
- L. Lin, Z. Yu and X. Wang, Angew. Chem., Int. Ed., 2019, 58, 6164–6175 CrossRef CAS PubMed.
- Y. Cui, G. Zhang, Z. Lin and X. Wang, Appl. Catal., B, 2016, 181, 413–419 CrossRef CAS.
- Y. Li, D. Zhang, J. Fan and Q. Xiang, Chin. J. Catal., 2021, 42, 627–636 CrossRef CAS.
- Y. Wang, X. Zhou, W. Xu, Y. Sun, T. Wang, Y. Zhang, J. Dong, W. Hou, N. Wu, L. Wu, B. Zhou, Y. Wu, Y. Du and W. Zhong, Appl. Catal., A, 2019, 582, 117118 CrossRef CAS.
- W. Xing, W. Tu, Z. Han, Y. Hu, Q. Meng and G. Chen, ACS Energy Lett., 2018, 3, 514–519 CrossRef CAS.
- I. Alves, G. Demazeau, B. Tanguy and F. Weill, Solid State Commun., 1999, 109, 697–701 CrossRef CAS.
- Z. Zhang, K. Leinenweber, M. Bauer, L. A. J. Garvie, P. F. McMillan and G. H. Wolf, J. Am. Chem. Soc., 2001, 123, 7788–7796 CrossRef CAS PubMed.
- G. Lei, Y. Cao, W. Zhao, Z. Dai, L. Shen, Y. Xiao and L. Jiang, ACS Sustain. Chem. Eng., 2019, 7, 4941–4950 CrossRef CAS.
- H. Piao, G. Choi, X. Jin, S.-J. Hwang, Y. J. Song, S.-P. Cho and J.-H. Choy, Nano-Micro Lett., 2022, 14, 55 CrossRef CAS.
- B. Sun, H. Yu, Y. Yang, H. Li, C. Zhai, D. Qian and M. Chen, Phys. Chem. Chem. Phys., 2017, 19, 26072–26084 RSC.
- S. Yu, C. Chen, H. Zhang, J. Zhang and J. Liu, Sens. Actuators, B, 2021, 332, 129536 CrossRef CAS.
- Y. Ma, F. Liu, Y. Liu, X. Lan, Y. Zhu, J. Shi, W. Jiang, G. Wang and S. H. Park, Chem. Eng. J., 2021, 414, 128802 CrossRef CAS.
- V. Hasija, A. Sudhaik, P. Raizada, A. Hosseini-Bandegharaei and P. Singh, J. Environ. Chem. Eng., 2019, 7, 103272 CrossRef CAS.
- L. Lin, Z. Lin, J. Zhang, X. Cai, W. Lin, Z. Yu and X. Wang, Nat. Catal., 2020, 3, 649–655 CrossRef CAS.
- W. Luo, W. Huang, X. Feng, Y. Huang, X. Song, H. Lin, S. Wang and G. Mailhot, RSC Adv., 2020, 10, 21876–21886 RSC.
- P. Choudhary, A. Sen, A. Kumar, S. Dhingra, C. M. Nagaraja and V. Krishnan, Mater. Chem. Front., 2021, 5, 6265–6278 RSC.
- T. Uekert, H. Kasap and E. Reisner, J. Am. Chem. Soc., 2019, 141, 15201–15210 CrossRef CAS PubMed.
- A. Habibi-Yangjeh, S. Asadzadeh-Khaneghah and S. Ghosh, Adv. Powder Technol., 2020, 31, 2618–2628 CrossRef CAS.
- H. Li, Z. Liang, Q. Deng and W. Hou, J. Colloid Interface Sci., 2020, 564, 333–343 CrossRef CAS PubMed.
- S. Le, T. Jiang, Q. Zhao, X. Liu, Y. Li, B. Fang and M. Gong, RSC Adv., 2016, 6, 38811–38819 RSC.
- S. Guo, Z. Deng, M. Li, B. Jiang, C. Tian, Q. Pan and H. Fu, Angew. Chem., Int. Ed., 2016, 55, 1830–1834 CrossRef CAS PubMed.
- J. Zhou, H. Luo, R. Ding, X. Cao, X. Zhou, Q. Chen and F. Jiang, Colloids Surf., A, 2020, 585, 123853 CrossRef CAS.
- H. Lv, Y. Huang, R. T. Koodali, G. Liu, Y. Zeng, Q. Meng and M. Yuan, ACS Appl. Mater. Interfaces, 2020, 12, 12656–12667 CrossRef CAS.
- T. Ma, J. Ran, S. Dai, M. Jaroniec and S. Qiao, Angew. Chem., Int. Ed., 2015, 54, 4646–4650 CrossRef CAS PubMed.
- D. P. Ojha, H. P. Karki and H. J. Kim, J. Ind. Eng. Chem., 2018, 61, 87–96 CrossRef CAS.
- M. J. Lima, M. J. Sampaio, C. G. Silva, A. M. T. Silva and J. L. Faria, Catal. Today, 2019, 328, 293–299 CrossRef CAS.
- C. Liu, Y. Zhang, F. Dong, X. Du and H. Huang, J. Phys. Chem. C, 2016, 120, 10381–10389 CrossRef CAS.
- H. Fan, N. Wang, Y. Tian, S. Ai and J. Zhan, Carbon, 2016, 107, 747–753 CrossRef CAS.
- Y. Yuan, L. Zhang, J. Xing, M. I. B. Utama, X. Lu, K. Du, Y. Li, X. Hu, S. Wang, A. Genc, R. Dunin-Borkowski, J. Arbiol and Q. Xiong, Nanoscale, 2015, 7, 12343–12350 RSC.
- D. He, H. Yang, D. Jin, J. Qu, X. Yuan, Y. n. Zhang, M. Huo and W. J. G. M. Peijnenburg, Appl. Catal., B, 2021, 285, 119864 CrossRef CAS.
- H. Li, B. Sun, L. Sui, D. Qian and M. Chen, Phys. Chem. Chem. Phys., 2015, 17, 3309–3315 RSC.
- H. Yu, D. Wang, B. Zhao, Y. Lu, X. Wang, S. Zhu, W. Qin and M. Huo, Sep. Purif. Technol., 2020, 237, 116365 CrossRef CAS.
- Y. Yang, H. Jin, C. Zhang, H. Gan, F. Yi and H. Wang, J. Alloys Compd., 2020, 821, 153439 CrossRef CAS.
- K. Govindan, A. K. Suresh, T. Sakthivel, K. Murugesan, R. Mohan, V. Gunasekaran and A. Jang, Chemosphere, 2019, 237, 124479 CrossRef CAS PubMed.
- S. L. Prabavathi, K. Govindan, K. Saravanakumar, A. Jang and V. Muthuraj, J. Ind. Eng. Chem., 2019, 80, 558–567 CrossRef CAS.
- K. Govindan, H. T. Chandran, M. Raja, S. U. Maheswari and M. Rangarajan, J. Photochem. Photobiol., A, 2017, 341, 146–156 CrossRef CAS.
Footnote |
| † Electronic supplementary information (ESI) available. See DOI: https://doi.org/10.1039/d2ra08324h |
| This journal is © The Royal Society of Chemistry 2023 |