 Open Access Article
Synthesis of magnetic graphene-like carbon nitride-cobalt ferrite (g-C3N4/CoFe2O4) nanocomposite for sonocatalytic remediation of toxic organic dyes
Saeedeh Hassanzadeh,
Saeed Farhadi * and
Farzaneh Moradifard
Department of Chemistry, Lorestan University, Khorramabad 68151-44316, Iran. E-mail: farhadi.s@lu.ac.ir; Fax: +986633120618; Tel: +986633120611
First published on 6th April 2023
Abstract
A novel magnetic g-C3N4/CoFe2O4 nanocomposite was successfully synthesized by a simple hydrothermal method and applied as a new graphene-like carbon nitride-based sonocatalyst for sonodegradation of pollutant dyes. The as-prepared samples were characterized by using X-ray diffraction (XRD), Fourier transform infrared (FT-IR) spectroscopy, field-emission scanning electron microscopy (FE-SEM), energy-dispersive X-ray spectroscopy (EDX), transmission electron microscopy (TEM), vibrating sample magnetometry (VSM), X-ray photoelectron spectroscopy (XPS), UV-visible diffuse reflectance spectroscopy (DRS), BET surface area measurements and photoluminescence (PL) spectroscopy. The results indicate that the nanocomposite sample is composed of spherical CoFe2O4 nanoparticles adhered to g-C3N4 naosheets. The g-C3N4/CoFe2O4 nanocomposites were used as a new magnetically separable sonocatalyst in H2O2-assisted sonodegradation of methylene blue (MB), rhodamine B (RhB) and methyl orange (MO) dyes in aqueous media. The results showed complete degradation (ca. 100%) of dyes within short times (30–35 min). The sonocatalytic activity of graphitic carbon nitride (g-C3N4) was greatly enhanced with CoFe2O4 modification. Trapping experiments indicated that the g-C3N4/CoFe2O4 nanocomposites serves as a generator of hydroxyl radical (˙OH) via activation of H2O2 for degradation of dyes under ultrasound irradiation. Furthermore, the magnetic sonocatalyst can be separated from solution by an external magnet and reused several times without observable loss of activity. The possible mechanism of sonocatalytic activity was also proposed according to experimental results.
1. Introduction
Environmental pollution resulting from industrial wastewater containing various organic dyes is getting more and more serious with the rapid development of economy and society.1,2 Among various techniques, advanced oxidation processes (AOPs) such as ozonation, photolysis, Fenton process and photocatalytic oxidation have recently received a particular interest as they display a high efficacy in wastewater treatment.3–6 Among AOPs, the photo-catalytic degradation of organic pollutants in the presence of semiconductors has attracted considerable interest because it is a promising environmental and cost-effective AOP for the treatment of contaminated groundwater and wastewater.3–6 However, organic dye wastewaters are highly concentrated and typically non-transparent. Consequently, light penetration is limited to only several millimetres, thereby affecting the efficacy of semiconductor photocatalyst to achieve complete degradation of such wastewaters. To meet the fast-developing water treatment requirements, there is a great need to devise innovative technologies and materials for efficient removal of pollutants from non-transparent wastewater. As a potential alternative to conventional AOPs, sonolysis by using ultrasound irradiation is of great interest and importance because of environment-friendly and simply operating.7,8In recent years, ultrasound (US)-assisted degradation has attracted considerable attention for the elimination of various organic pollutants owing to its several advantages such as operational simplicity, safety and being environmentally benign.9–11 This technique is principally based on the phenomenon of acoustic cavitation including nucleation, growth, and violent collapse of micro-bubbles, leading to the emission of sonoluminescence (SL) and generation of ‘hot spot’ with extremely high temperature and pressure (∼5000 °C and ∼1000 atm). As a result, water is dissociated to generate hydroxyl radicals, which can oxidize organic pollutants into CO2 and H2O.12–15 Moreover, organic pollutant that is volatile or hydrophobic appears to diffuse inside the cavity interior and undergoes the pyrolytic reaction directly.16–20 However, to obtain a fast-degradation rate using ultrasound (US) alone typically requires a significant amount of electrical energy owing to the massive loss of input energy in thermal dissipation, which hinders the wide application of sonolysis for practical water treatment.21 To overcome this problem, development of semiconductor-based sonocatalysis is one of the most promising strategies. Similar with photocatalysis, the sonocatalytic degradation of some organic dyes in aqueous solution is also an excellent method. Nano-TiO2 powder is known to exhibit very high sonocatalytic activities in treating various organic dyes in wastewaters. In addition, heterogeneous sonocatalysis can overcome the aforementioned disadvantages of the photocatalytic technology because ultrasonic irradiation has strong penetration ability in all types of water media.22 Up till now, a variety of sonocatalysts have been reported to exhibit very high sonocatalytic activities in treating various organic dyes in wastewaters.23–25 It is well known that the sonocatalytic efficiency depends highly on the type of catalyst.26 Therefore, the development of novel efficient and green sonocatalysts is important to promote sonocatalysis-based applications and further understand the sonocatalysis mechanism.
Graphitic carbon nitride (g-C3N4) with a graphene-like structure as a metal-free and visible-light-responsive photocatalyst and its composites have drawn considerable attention because of its appealing electronic band structure, highly physicochemical stability, and earth-abundant merits.27 However, its photocatalytic performance is currently narrowed by the nonresponse in the long wavelength region, poor electrical transport, low density of reactive sites, and high recombination of photoexcited electron–hole pairs.28,29 Besides, pure g-C3N4 photocatalyst and its non-magnetic composites are difficult to be separated and recycled from wastewater and easily produces secondary pollution, which limits the practical application of g-C3N4.30–32 The Fe-based spinel metal ferrite systems with the general molecular structure MFe2O4 (M = Ni, Zn, Co, Ca, Mn, Mg, and Cu) have gained technological importance in photocatalysis due to their highly visible light utilization, low band gap, high-temperature stability, and extraordinary chemical stability.33 In recent years, the coupling between spinel metal ferrites MFe2O4 (M = Ni, Zn, Co, and Cu) and g-C3N4 has been widely studied in photocatalytic energy and environmental remediation fields due to their suitable band structure for effective separation of charge carriers.34–41 Moreover, the magnetic nature of the spinel ferrites helps to recover the catalyst after the photocatalytic reaction. However, up to now, the investigation of g-C3N4/MFe2O4 as advanced sonocatalyst has rarely been reported.24
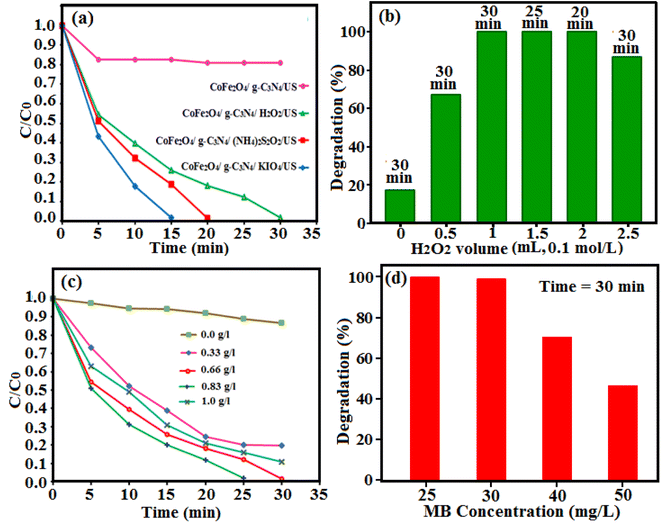
In the present study, a novel magnetically separable graphite-like carbon nitride (g-C3N4)-based sonocatalyst (g-C3N4/CoFe2O4) was prepared by a facile hydrothermal route. The composition, microstructure, magnetic and optical properties of the synthesized nanocomposite were fully characterized by various physical techniques. Its sonocatalytic activity was assessed by the H2O2-assisted degradation of organic dyes in water under ultrasound irradiation. The effects of various parameters (e.g. H2O2 quantity, the catalyst dosage, and initial dye concentration) on the sonodegradation process were investigated. The sonocatalytic activity of g-C3N4/CoFe2O4 nanocomposite was also compared with those of pure CoFe2O4 and g-C3N4 under similar conditions. In addition, a possible mechanism for activity of the nanocomposite under ultrasound irradiation was proposed.
2. Experimental
2.1. Materials
Thiourea (CH4N2S, 98%), iron(III) nitrate nonahydrate (Fe(NO3)3·9H2O, 99%), cobalt nitrate hexahydrate (Co(NO3)2·6H2O, 99%), hydrogen peroxide (H2O2, 30%), methylene blue (MB, C16H18ClN3S, 98%) and methyl orange (MO, C14H14N3NaO3S, 98%) and rhodamine B (RhB, C28H31N2O3Cl, 98%) were prepared from Merck chemical company and used as received without more purification. Deionized and doubly distilled water were used throughout this study.2.2. Characterization techniques
The phase formation in the composites was investigated via powder X-ray diffraction (XRD) technology on a Panalytical X'Pert Pro diffractometer (Netherlands) with Cu Kα (λ = 1.5406 Å) at 40 kV and 150 mA. Diffraction patterns in the 10–80° regions were recorded at a rate of 5°/min. The chemical composition and chemical bonding state of the specimen were defined by X-ray photoelectron spectroscopy (XPS, equipped with a standard monochromatic Al Kα source (hν) 1486.6 eV, ESCALAB 250Xi, Thermo Fisher Scientific, UK). Fourier Transform Infrared (FT-IR) spectra were recorded on a Shimadzu 160 spectrophotometer (Japan) from 500 to 4000 cm−1 using KBr pellets. The morphology and elemental analysis of the g-C3N4/CoFe2O4 nanocomposite were observed by on a field emission scanning electron microscopy (FESEM, Mira3 Tescan, Czech) equipped with a link energy-dispersive X-ray analyzer. Transmission electron microscopy (TEM) images were taken on EM10C electron microscope operating at 100 kV. The Brunauer–Emmett–Teller (BET) analysis was performed by a PHS-1020 PHSCHINA instrument to obtain the specific surface area and porosity of g-C3N4/CoFe2O4 nanocomposite. The UV-vis spectra of dye solutions were analyzed at room temperature using a Cary 100 UV visible spectrophotometer. The room-temperature magnetic properties were measured by a 7400-S vibrating sample magnetometer (VSM, Daneshpajoh Kashan Co, Iran) with a maximum magnetic field of 10 kOe. The UV-vis diffuse reflectance spectra (DRS) of sonocatalysts were obtained on a Sinico S4100 spectrophotometer using BaSO4 powder as a standard. The loading amount of CoFe2O4 in the composite adsorbent and the concentrations of Co and Fe metals in the filtrates and solutions after recovering photocatalyst were determined by inductively coupled plasma atomic emission spectrometer (PerkinElmer ICP-AES, USA).2.3. Preparation of the g-C3N4 nanosheets
In a typical synthesis, 10 g of thiourea powder was put into a porcelain crucible with a cover, and then heated to 550 °C at a heating rate of 15 °C min in a furnace for 2 h in air. The resulted yellow powder (g-C3N4) was collected and washed with 0.1 M HNO3 and distilled water, and it was dried to 60 °C in the oven for 12 h.2.4. Preparation of the magnetic g-C3N4/CoFe2O4 nanocomposite
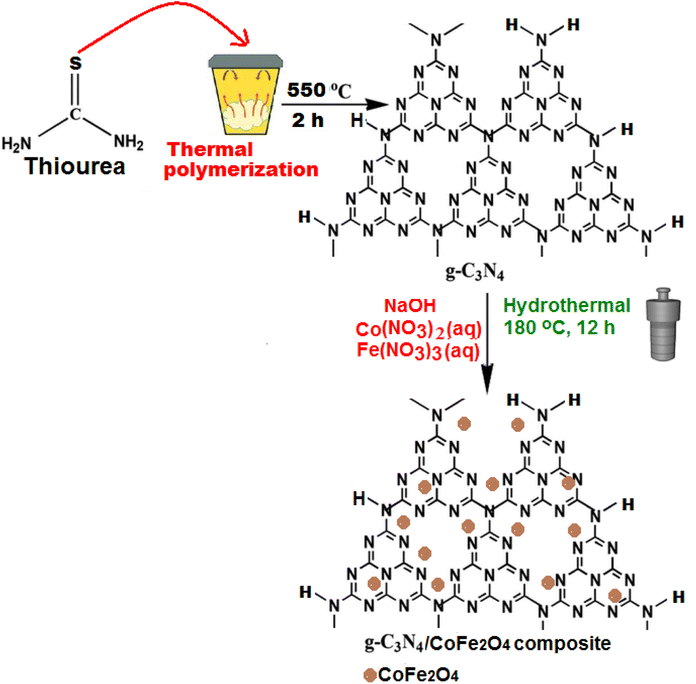
The g-C3N4/CoFe2O4 nanocomposite was synthesized via a hydrothermal route. 23 mg of the obtained g-C3N4 was dispersed into a 25 mL aqueous solution containing stoichiometric amounts of cobalt(II) and iron(III) nitrates (containing 17 mg of CoFe2O4) under sonication for 30 min. The pH value of the mixture was adjusted to 11 with a 6 mol L−1 NaOH aqueous solution. After 1 h of stirring, the resulting mixture was transferred and sealed into a 50 mL Teflon-lined stainless-steel autoclave and heated at 180 °C for 12 h. After naturally cooling down to room temperature, the resulting product was filtered and rinsed with distilled water and ethanol, followed by drying at 60 °C overnight. The loading amount of CoFe2O4 in the nanocomposite was estimated to be about 38 wt% by ICP-AES analysis. For comparison purposes, the pure CoFe2O4 nanoparticles were also synthesized under the same experimental conditions without adding the g-C3N4. The preparation process of the g-C3N4/CoFe2O4 nanocomposite was summarized in Scheme 1.2.5. Sonocatalytic degradation of organic dyes
The sonocatalytic performance of the as-prepared g-C3N4/CoFe2O4 nanocomposite was evaluated via the degradation of organic dyes in aqueous solutions at 25 ± 2 °C using an ultrasonic bath (Sonic 6MX, England) under an output power of 100 W and frequency of 37 kHz. In a typical experiment, 50 mL of an aqueous solution containing MB dye (30 mg L−1), 25 mg of the g-C3N4/CoFe2O4 nanocomposite powder and 0–2.5 mL of H2O2 (0.1 mol L−1) were added into a 100 mL Pyrex cylindrical vessel. The mixture was vigorously stirred for 30 min to establish the adsorption–desorption equilibrium. Then, it was exposed to ultrasonic irradiation. The sonocatalytic system was maintained at room temperature by a flow of cooling water during the reaction. At regular time intervals, 2 mL of samples of the reaction solution were separated, and the catalyst powder was immediately separated from the suspension with an external magnet, washed and dried at 80 °C for the next runs. Then, the residual MB concentration in solutions was determined using a UV-vis spectrophotometer at wavelength of 664 nm. The degradation efficiency (DE) was calculated as follow: DE (%) = [(C0 − Ct)/C0] × 100%, where C0 is the initial concentration of dye and Ct is the time-dependent concentration of dye upon irradiation. The effects of parameters including the H2O2 amount (0.1 mol L; 0, 0.5, 1, 1.5, 2 and 2.5 mL), sonocatalyst dosage (0, 0.33, 0.66, 0.83, 1 g L−1), initial dye concentration (25, 30, 35, 50 mg L−1) and initial solution pH (3, 7, 9) were also studied on the sonocatalytic efficiency of the g-C3N4/CoFe2O4 nanocomposite with 0.1 mol L−1 HCl and NaOH aqueous solutions. The sonodegradation of methyl orange (MO) and Rhodamine B (RhB) dyes were also conducted under the same conditions.3. Results and discussion
3.1. Characterization of the g-C3N4/CoFe2O4 sonocatalyst
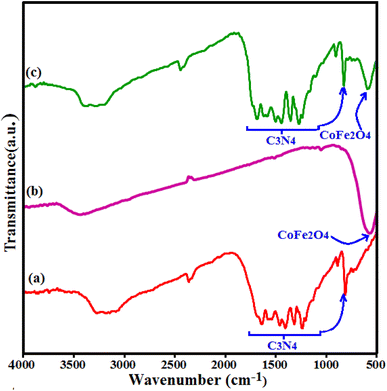
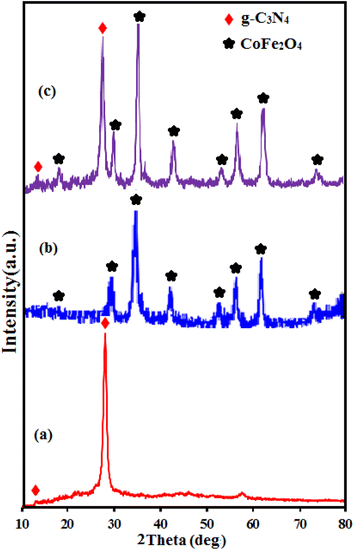
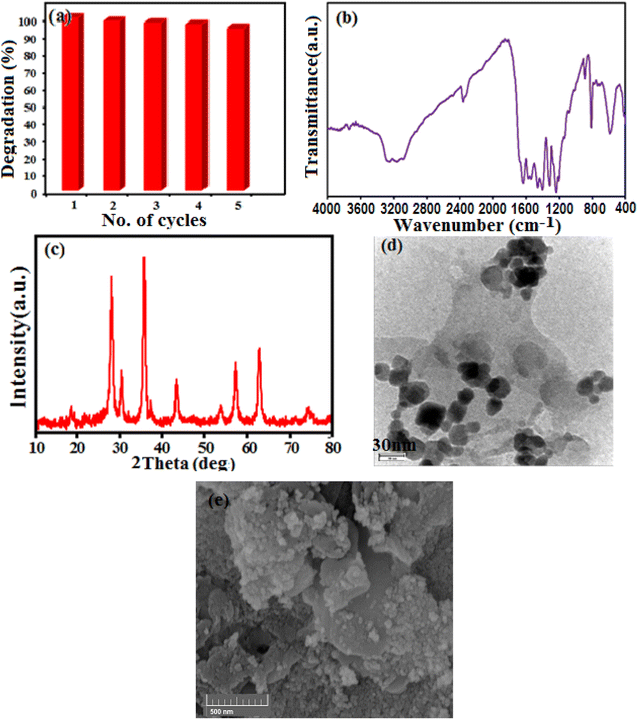
Fig. 1 shows the IR spectra of CoFe2O4, g-C3N4 and g-C3N4/CoFe2O4 composite. The FT-IR spectrum in Fig. 1(a) shows all the characteristic bands of pure g-C3N4 phase. The characteristic band at about 810 cm−1 is attributed to the characteristic breathing mode of s-triazine units.42,43 The other several bands ranging from 1100 to 1650 cm−1 can be attributed to the typical stretching mode of C–N heterocycles in g-C3N4.44,45 The broad bands at around 3000–3500 cm−1 correspond to the secondary and primary amines at the defect sites of the aromatic ring.46 In Fig. 1(b), the characteristic band at around 580 cm −1 corresponds to the stretching vibration of Fe–O bond of spinel-type CoFe2O4 nanoparticles.47 FT-IR spectrum of the g-C3N4/CoFe2O4 nanocomposite in Fig. 1(c) shows characteristic bands correspond to the C3N4 at 1100–1650 and 810 cm−1, besides the strong band of CoFe2O4 at about 580 cm−1. This finding demonstrates the coexistence of g-C3N4 and CoFe2O4 after the formation of g-C3N4/CoFe2O4 nanocomposite Fig. 2 shows the XRD patterns of the pristine C3N4, pure CoFe2O4 and g-C3N4/CoFe2O4 samples.The XRD pattern of C3N4 in Fig. 2(a) shows two characteristic peaks of g-C3N4 at 13.1° and 27.3°. The weak peak at 2θ = 13.1° is corresponds to the (100) diffraction peak, which relates to the interplanar structural packing with a period of 0.675 nm and the strong peak at 2θ = 27.3° can be indexed as the (002) diffraction peak and represents the interplanar graphitic stacking with a distance of the two near layers of 0.325 nm.48 All diffraction peaks appeared in Fig. 2(b) at 2θ angles of 30.3°, 35.5°, 37.1°, 43.2°, 53.6°, 57.3°, 62.8° and 72° can be indexed as the (111), (220), (311), (222), (400), (511), (440) and (441) planes of the cubic structure of CoFe2O4 (JCPDS no. 10-0454), respectively.37 The XRD pattern of the g-C3N4/CoFe2O4 composite in Fig. 2(c) exhibits the characteristic diffraction peaks of both g-C3N4 and CoFe2O4 phases, indicating the coexistence of g-C3N4 and CoFe2O4 phases without any impurity phase.49 The average particle size of CoFe2O4 in the nanocomposite by using the Debye–Scherrer equation was estimated to be 20 nm.
SEM images indicating the morphology of g-C3N4, CoFe2O4 and g-C3N4/CoFe2O4 nanocomposite samples are shown in Fig. 3. SEM image of pure g-C3N4 in Fig. 3(a) shows layered structure of g-C3N4 having large stacks, possibly consisting of hundreds of graphene-like nanosheets. It should also be noted that the surfaces of g-C3N4 sheets were quite flat and smooth. The SEM image of CoFe2O4 sample in Fig. 3(b) shows nearly uniform monodispersed sphere-like nanoparticles with an average diameter of about 20 nm. The SEM images of g-C3N4/CoFe2O4 in Fig. 3(c) and (d) clearly show C3N4 nanosheets were successfully decorated with CoFe2O4 nanoparticles. It can be clearly seen that the CoFe2O4 nanoparticles were well deposited on g-C3N4. Some wrinkles are found on the surface, which may be important for preventing aggregation of g-C3N4 and maintaining high surface area, which could be a great benefit to its adsorption ability. On the contrary with pure g-C3N4 sheets, the surface of g-C3N4 nanosheets in the nanocomposite was rough and the edges were highly crumpled.
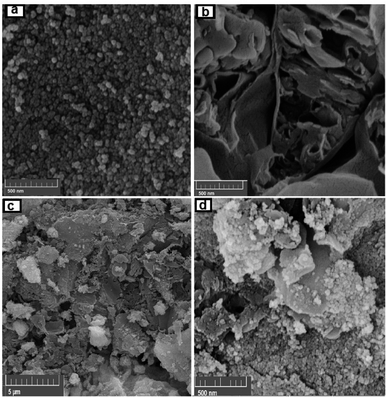 | ||
| Fig. 3 FE-SEM images of (a) CoFe2O4, (b) g-C3N4, and (c and d) the g-C3N4/CoFe2O4 hybrid nanocomposite. | ||
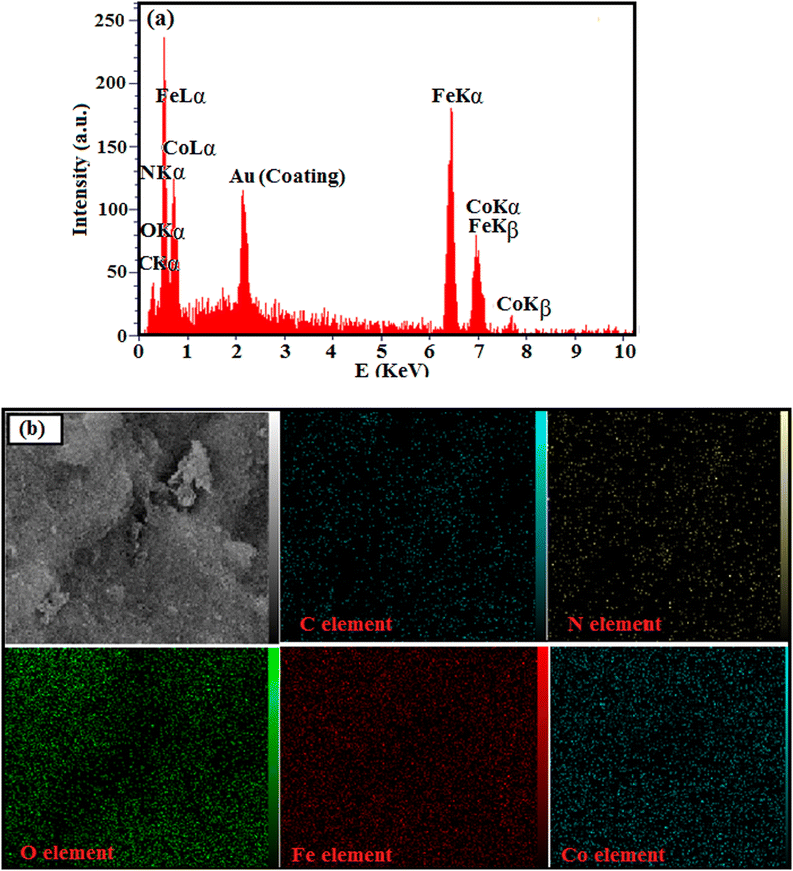
The chemical composition and homogeneity of g-C3N4/CoFe2O4 nanocomposite was further confirmed by EDX analysis and the results are shown in Fig. 4. The EDX spectrum of the nanocomposite in Fig. 4(a) shows the peaks of C, N, Co, Fe, and O elements at their corresponding keV values. The distribution of elements present in the nanocomposite was studied using SEM-EDX mapping analysis as shown in Fig. 4(b). The elemental mappings show all elements were uniformly distributed over the nanocomposite, confirming the homogeneity of the sample.
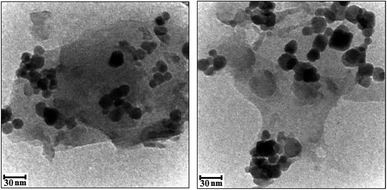
The morphologies and microstructures of the as-prepared g-C3N4/CoFe2O4 samples were further analyzed by TEM. As can be seen in Fig. 5, the almost transparent graphene-like g-C3N4 sheets are fully exfoliated and decorated with black color CoFe2O4 sphere-like nanoparticles with having the particle size in range of 15–30 nm in consistent with the average particle size calculated from Debye-Scherer formula. No obvious aggregation was seen in images. The g-C3N4 sheets could not only prevent agglomeration of the CoFe2O4 nanoparticles and enable a good dispersion of these spherical particles, but also substantially enhance the specific surface area of the composite.
XPS analysis was carried out to determine the surface composition and oxidation states of the as-prepared g-C3N4/CoFe2O4 nanocomposite. As shown in Fig. 6(a), C, N, Co, Fe and O elements can be readily indexed in the XPS survey spectrum of the nanocomposite. Among them, the intensity of the Co and Fe elements is relatively low, which indicates that only a small amount of CoFe2O4 nanoparticles are distributed on the surface of the composite sample. The high resolution XPS spectrum of Co 2p (Fig. 6(b)) reveals four peaks located at 782.3 eV, 787.7 eV (a satellite peak), 796.49 eV and 804.72 eV (a satellite peak), respectively, implying that Co element exists mainly in the chemical state of Co2+.50,51 The Fe 2p spectrum of CoFe2O4 is composed of two distinct peaks at 711.8 eV and 725.2 eV (Fig. 6(c)) and the two peaks ascribed to the Fe 2p3/2 and Fe 2p1/2, respectively, which is in good agreement with the reported value for Fe3+ compounds.52–54 Furthermore, two satellite peak of the Fe 2p can also be detected at the position of 719.1 and 733 eV. In Fig. 6(d), the XPS peaks of the O 1s were observed at 530.40 eV and 531.83 eV, which was ascribed to crystal lattice oxygen (Co–O and Fe–O) and surface OH/H2O groups, respectively.55 N 1s XPS spectrum in Fig. 6(e) can be deconvoluted into three main peaks at 399.4, 401.2, and 403.4 eV, which correspond to C–N–C, N−(C)3, and NH/NH2 groups of g-C3N4, respectively.56 In Fig. 6(f), the first C 1s peak at 288.5 eV was assigned to sp2-bonded carbon (N–C![[double bond, length as m-dash]](https://www.rsc.org/images/entities/char_e001.gif) N), and the second at 284.8 eV was attributed to graphitic carbon which was usually observed on carbon nitrides.56
N), and the second at 284.8 eV was attributed to graphitic carbon which was usually observed on carbon nitrides.56
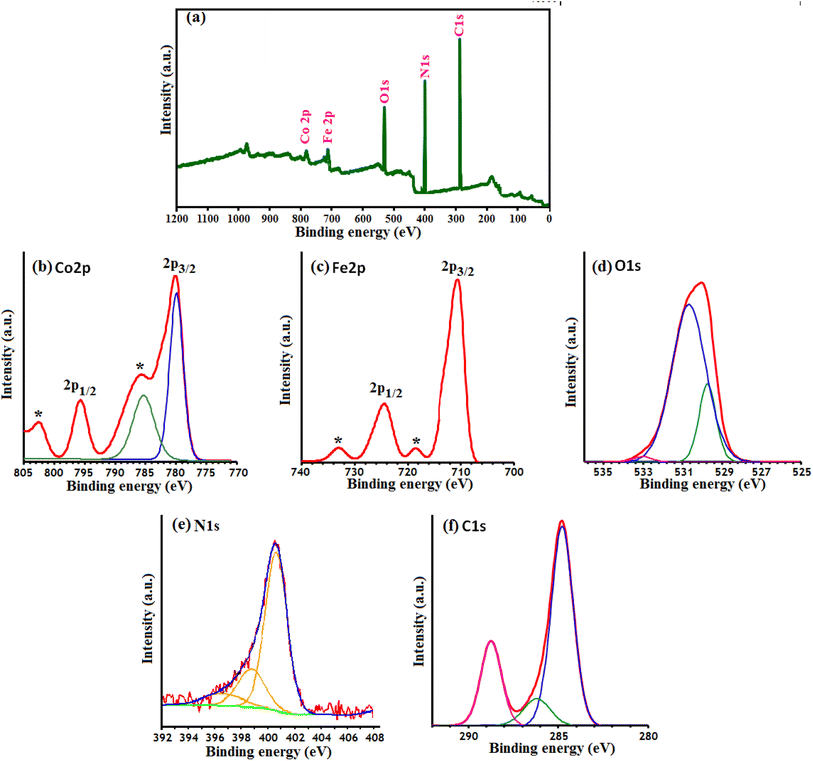 | ||
| Fig. 6 XPS of the g-C3N4/CoFe2O4 nanocomposite: (a) survey spectrum, (b) Co 2p spectrum, (c) Fe 2p spectrum, (d) O 1S spectrum, (e) N 1S spectrum and (f) C 1S spectrum. | ||
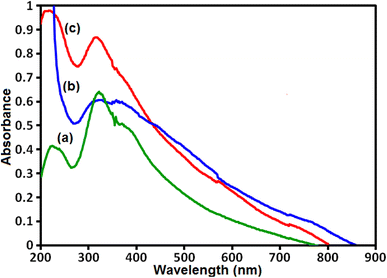
The UV-vis diffuse reflectance spectra (UV-vis DRS) was used to investigate the optical absorption properties of samples and results are shown in Fig. 7. The UV-vis spectrum of pure g-C3N4 sample in Fig. 7(a) shows a strong absorption band from the UV to the visible light region with a maximum absorption at about 450 nm. The UV-vis spectrum of CoFe2O4 sample in Fig. 7(b) exhibits a broad absorption band in the visible range. As can be seen in Fig. 7(c), the UV-vis spectrum of g-C3N4/CoFe2O4 nanocomposite indicates an enhancement in absorption intensity in the visible region together with a red shift, compared to that of the pure g-C3N4, and this was attributed to CoFe2O4 nanoparticles assembled on the surface of g-C3N4 nanosheets that acts as a sensitizer to extend the optical response. The absorption bands are used for the calculation of band gaps (Eg) of these samples according to the Tauc's equation:57 (αhν)2 = B(hν − Eg), where α, ν, and B are absorption coefficient, light frequency and proportionality constant, respectively. The Eg of g-C3N4, CoFe2O4 and g-C3N4/CoFe2O4 nanocomposite were estimated with extrapolation of the plots of (αhv)2 against hv to the energy axis. The Eg values of g-C3N4, CoFe2O4 and g-C3N4/CoFe2O4 samples were calculated to be 2.7, 1.3 and 2.5 eV, respectively. These results suggest that the g-C3N4/CoFe2O4 composite can absorb visible-light photons more efficient than pure g-C3N4. Obviously, the visible light absorption intensity of g-C3N4/CoFe2O4 heterojunction is better than that of g-C3N4, which possibly results good visible-light utilization.
The magnetization curves of the CoFe2O4 and g-C3N4/CoFe2O4 samples under an applied magnetic field of ±10 kOe at room temperature are shown in Fig. 8. The magnetic hysteresis loops of the samples indicate ferromagnetic behaviors, due to the presence of CoFe2O4 nanoparticles. The saturation magnetization (Ms) of pure CoFe2O4 is 62.8 emu g−1 (Fig. 8(a)). The Ms of g-C3N4/CoFe2O4 nanocomposite is about 28.4 emu g−1 (Fig. 8(b)). The Ms of the magnetic nanocomposite decreased considerably, compared with that of pure CoFe2O4, which can be attributed to the existence of non-magnetic g-C3N4 component. As can be seen in the inset of Fig. 8, the g-C3N4/CoFe2O4 nanocomposite could be easily separated from the water with a common magnet and quickly collected on the side of the glass vial, which indicates that this nanocomposite might be magnetically recycled from wastewater by an external magnetic field.
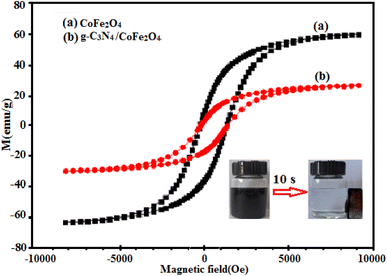 | ||
| Fig. 8 Room-temperature magnetization curves of (a) CoFe2O4 and (b) g-C3N4/CoFe2O4 nanocomposite (inset: the magnetic separation of g-C3N4/CoFe2O4 nanocomposite by a magnet). | ||
The g-C3N4/CoFe2O4 nanocomposite sample was subjected to determine the surface area, pore volume and corresponding pore-size distribution curve. As shown in Fig. 9(a) and (b), the N2 adsorption–desorption isotherms display a typical type-IV curve with an H3-type hysteresis loop at a high relative pressure, which is associated with capillary condensation in mesopores (2 to 50 nm).58 The data about the surface areas, pore volumes and average pore sizes of g-C3N4 nanosheets and g-C3N4/CoFe2O4 composite samples were summarized in Table 1. BET surface area and pore volume of g-C3N4/CoFe2O4 are found to be 93.66 m2 g−1 and 0.415 cm3 g−1, higher than those of g-C3N4 nanosheets (47.74 m2 g−1 and 0.258 cm3 g−1) which are benefit to the diffusion of electrolyte ions and the exposure of active sites. The pore size distribution of g-C3N4/CoFe2O4 composite in the inset of Fig. 9(b) presents a broad peak in the range from 5 to 20 nm. The high surface area and pore volume likely contribute to the high sonocatalytic activity. In summary, the high specific surface area provides more active sites, which may lead to the enhancement of sonocatalytic performance.
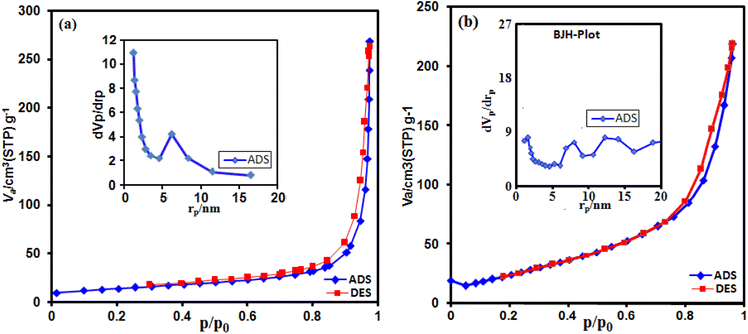 | ||
| Fig. 9 N2 adsorption–desorption isotherms of (a) C3N4 and (b) g-C3N4/CoFe2O4 nanocomposite. The insets are the pore size distribution curves. | ||
| Sample | SBET (m2 g−1) | SLan (m2 g−1) | Vtotal (cm3/g) | Dp (nm) |
|---|---|---|---|---|
| a SBET: BET surface area.b SLan: Langmuir surface area.c Vtotal: Total pore volume.d Dp: Average pore diameter estimated using the Barrett–Joyner–Halenda (BJH) method from the adsorption branch of the N2 isotherms. | ||||
| C3N4 | 47.74 | 126.37 | 0.258 | 1.26 |
| g-C3N4/CoFe2O4 | 93.66 | 143.39 | 0.415 | 12.60 |
3.2. Sonocatalytic degradation of dyes
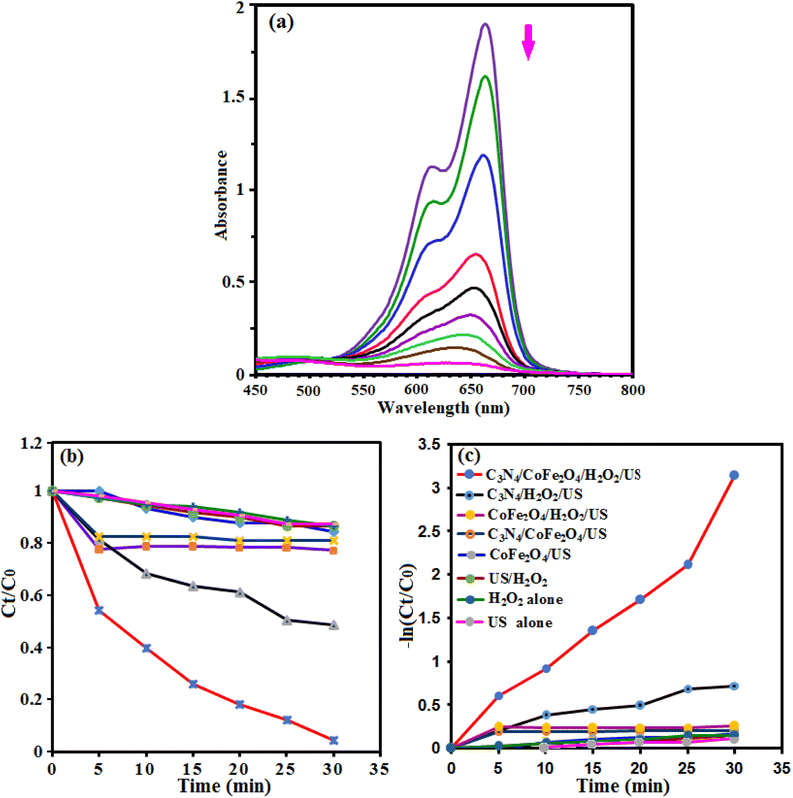
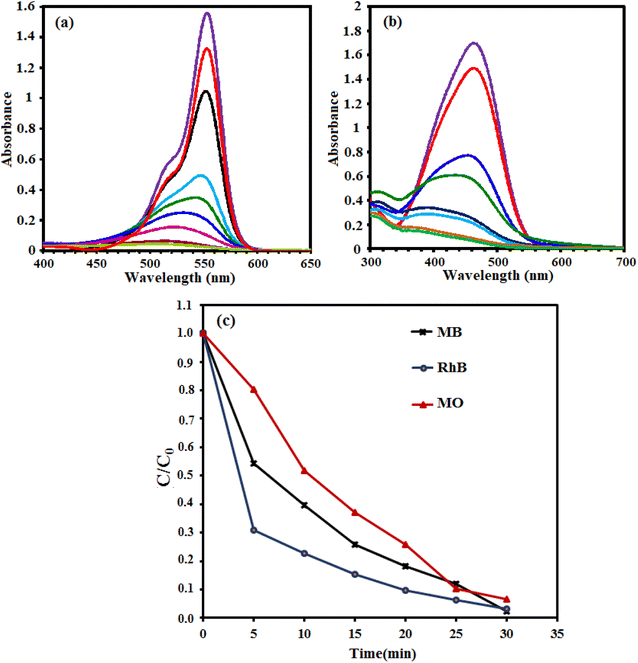
The sonocatalytic activity of g-C3N4/CoFe2O4 nanocomposite was investigated in degradation of some organic dye in aqueous solution under ultrasonic irradiation. The process was investigated by monitoring the characteristic absorption band of MB at about 665 nm. Initially, a suspension of g-C3N4/CoFe2O4 (0.66 g L−1) in 50 mL of aqueous solution MB (25 mg L−1) was exposed to ultrasonic (US) irradiation in the presence of H2O2 (0.1 mol L−1). Fig. 10(a) shows the UV-vis absorbance spectra of MB aqueous solution in the presence of g-C3N4/CoFe2O4/H2O2/US system. It can be seen that the intensity of the absorption band at 665 nm decreases with the irradiation time and completely disappeared within 30 min. These findings confirmed the efficacy of the g-C3N4/CoFe2O4/H2O2/US system for successful degradation of MB dye. Fig. 10(b) shows the MB degradation (C/C0) with the irradiation time over various catalysts which obviously reveals that the sonocatalytic activity of the g-C3N4/CoFe2O4/H2O2 is the highest among all samples under US. About 100% MB was degraded after 30 min over the g-C3N4/CoFe2O4 sample. The kinetic rate constants of the samples were obtained by plotting −ln![[thin space (1/6-em)]](https://www.rsc.org/images/entities/char_2009.gif) Ct/C0 with time (in min) and the results are shown in Fig. 10(c). The sonocatalytic degradation of MB over the catalysts matches the pseudo-first-order kinetics equation (−dC/dt = kC). The rate constant, k, in different systems increased in the order of US alone (0.0046 min−1) < H2O2 alone (0.0047 min−1) < US/H2O2 (0.0052 min−1) < CoFe2O4/US (0.0049 min−1) < g-C3N4/CoFe2O4/US (0.0052 min−1) < CoFe2O4/H2O2/US (0.0061 min−1) < g-C3N4/H2O2/US (0.023 min−1) < g-C3N4/CoFe2O4/H2O2/US (0.094 min−1). The kinetic rate constant over g-C3N4/CoFe2O4 is 0.094 min−1, which is 4 and15.4 times more than those of g-C3N4 (0.023 min−1) and CoFe2O4 (0.0061 min−1), respectively. Based on the comparison of different values of k, it can be shown that the combination of g-C3N4/CoFe2O4 nanocomposite with ultrasonic irradiation and H2O2 has higher oxidation potential of MB degradation than the others, due to the synergistic effect between g-C3N4 and CoFe2O4 nanoparticles and the additional generation of reactive oxidizing species. The nanocomposite is an effective sonocatalyst for the degradation of MB and its efficiency degradation was 100% in the period of 30 min of irradiation.
Ct/C0 with time (in min) and the results are shown in Fig. 10(c). The sonocatalytic degradation of MB over the catalysts matches the pseudo-first-order kinetics equation (−dC/dt = kC). The rate constant, k, in different systems increased in the order of US alone (0.0046 min−1) < H2O2 alone (0.0047 min−1) < US/H2O2 (0.0052 min−1) < CoFe2O4/US (0.0049 min−1) < g-C3N4/CoFe2O4/US (0.0052 min−1) < CoFe2O4/H2O2/US (0.0061 min−1) < g-C3N4/H2O2/US (0.023 min−1) < g-C3N4/CoFe2O4/H2O2/US (0.094 min−1). The kinetic rate constant over g-C3N4/CoFe2O4 is 0.094 min−1, which is 4 and15.4 times more than those of g-C3N4 (0.023 min−1) and CoFe2O4 (0.0061 min−1), respectively. Based on the comparison of different values of k, it can be shown that the combination of g-C3N4/CoFe2O4 nanocomposite with ultrasonic irradiation and H2O2 has higher oxidation potential of MB degradation than the others, due to the synergistic effect between g-C3N4 and CoFe2O4 nanoparticles and the additional generation of reactive oxidizing species. The nanocomposite is an effective sonocatalyst for the degradation of MB and its efficiency degradation was 100% in the period of 30 min of irradiation.
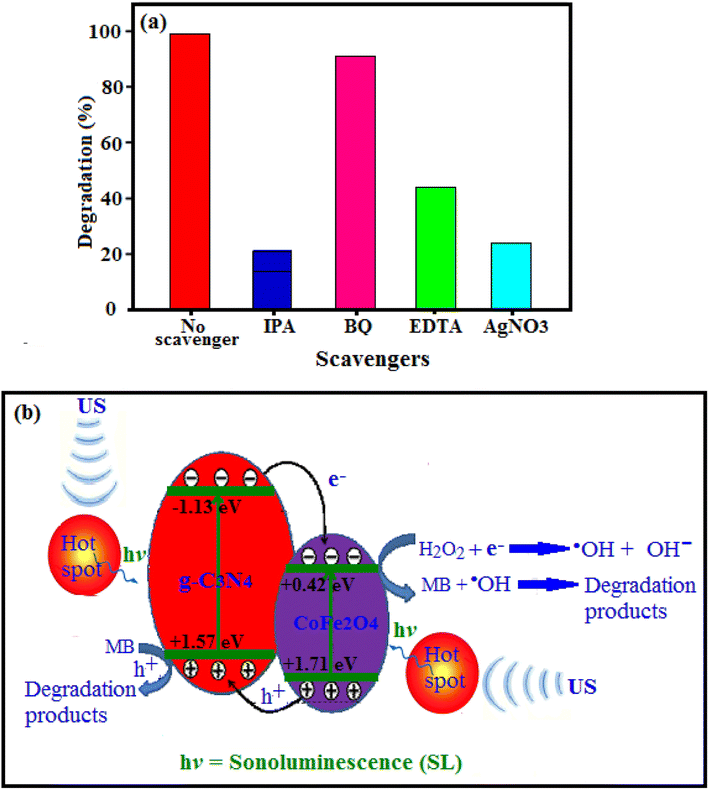
The enhanced sonocatalytic activity can be ascribed to the formation of heterojunction between CoFe2O4 and C3N4. Based on the experimental results, possible mechanism of the MB sonodegradation over C3N4/CoFe2O4 nanocomposite under US irradiation was proposed. To show matching of energy levels of the CoFe2O4 and C3N4, their valence band (VB) and conduction band (CB) edge potentials were calculated by the Mulliken electronegativity theory using the following equations(eqn (1) and (2)):69
| ECB = χ − Ee − 0.5Eg, | (1) |
| EVB = ECB + Eg | (2) |
On the basis of the above results and previous reports,71–74 we propose the mechanisms of light absorption, charge transfer, and the reaction pathways for generating active radicals by g-C3N4/CoFe2O4 nanocomposites and the degradation of dyes as follows: As illustrated in Fig. 13(b), the ultrasonic cavitation effect produced the sonoluminescence which it could create lights with a wide wavelength range. The g-C3N4/CoFe2O4 nanocomposite can be excited by the produced lights with suitable wavelength and so this nanocomposite acting as a sonocatalyst to accomplish degradation (eqn (3)). In addition, the ‘‘hot spot” manufactured by ultrasonic cavitation effect in aqueous solution can possessed higher temperature than 1000 °C. Therefore, magnetic g-C3N4/CoFe2O4 nanocomposite can be excited by these hot spots. Also, high temperature could effectively decompose H2O2 molecules on the surface of the sonocatalyst to generate hydroxyl radicals (˙OH). Since the CB of the g-C3N4 (−1.13 eV) is lower than CB of CoFe2O4 (+0.42 eV), so the excited-state electrons in the CB of g-C3N4 can be easily transfer into CB of CoFe2O4 (eqn (4)). However, The CB position of CoFe2O4 is much higher than the redox potential of O2/˙O2− (−0.33 eV). So, the O2 adsorbed on the surface of g-C3N4/CoFe2O4 won't be reduced. Therefore, it is necessary to introduce an electron acceptor in this system. As a kind of electron acceptor, H2O2 is environment friendly and it could be activated to general high reactive radical ˙OH by accepting an electron (eqn (5)). Then, the electron in CB of CoFe2O4 can activate H2O2 to generate hydroxyl radical (˙OH), which is a strong oxidizing agent to degrade MB (eqn (6)). In the other hand, due to VB position of CoFe2O4 (+1.71 eV) is more than of g-C3N4 (+1.57 eV), the produced sonogenerated holes (h+) at the VB of CoFe2O4 will inject to that of g-C3N4. These sonogenerated holes in the VB of g-C3N4 can oxidize organic dyes adsorbed onto the surface of the catalyst directly (eqn (7)). The reactions are summerized as follows (eqn (3)–(7)):
| g-C3N4/CoFe2O4 + US → g-C3N4(h+, e−) + CoFe2O4(h+, e−) | (3) |
| g-C3N4(h+, e−) + CoFe2O4(h+, e−) → g-C3N4(h+) + CoFe2O4(e−) | (4) |
| CoFe2O4(e−) + H2O2 → ˙OH + OH−, | (5) |
| MB + ˙OH → CO2 + H2O +… | (6) |
| g-C3N4(h+) + MB → g-C3N4 + MB˙+ → CO2 + H2O + … | (7) |
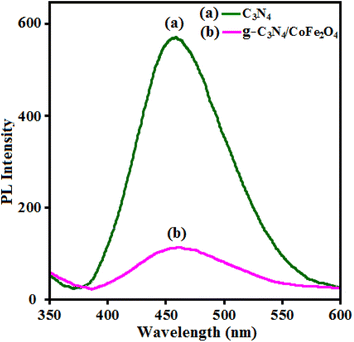
To justify the proposed path for the g-C3N4/CoFe2O4 nanocomposites towards sonocatalytic degradation, a photoluminescence (PL) study is an effective and informative technique that can give a better understanding of the electron flow and charge separation mechanism of the sonocatalyst. The higher fluorescence intensity means more recombination of electron–hole pairs and lower catalytic activity and a weak peak indicates better electron–hole pair separation.75 Fig. 14 shows the room-temperature PL spectra of the pristine g-C3N4 and the g-C3N4/CoFe2O4 hybrid material excited at 350 nm. Fig. 14(a) shows the PL spectrum the pristine g-C3N4 nanosheets with high intensity at about 460 nm, indicating high electron–hole recombination.76,77 For g-C3N4/CoFe2O4 hybrid material in Fig. 14(b), the position of the emission peak in the PL spectrum was similar to that of the pure g-C3N4, but the emission intensity significantly decreased. This demonstrated that the recombination of photo-generated charge carriers was greatly inhibited by the introduction of CoFe2O4, which showed the photogenerated electron–hole pairs in g-C3N4/CoFe2O4 hybrid material had higher separation efficiency than those in the pure g-C3N4.78 This led to better utilization of electron and hole pairs induced by light irradiation. The PL result is in accordance with the sonocatalytic activity of the catalyst.
4. Conclusion
In summary, the g-C3N4/CoFe2O4 nanocomposite was synthesized by a simple hydrothermal method. The FT-IR, XRD and EDX analyses confirmed the successful synthesis of the g-C3N4/CoFe2O4 nanocomposite. The TEM and SEM photographs of the nanocomposite revealed that the spherical of CoFe2O4 nanoparticles were anchored on the surface of the g-C3N4 naosheets. Also, the nanocomposite was used to degrade organic dyes including MB, MO and RhB. Efficient sonocatalyst degradation was 100% for the removal of dyes. Due to magnetic properties of the g-C3N4/CoFe2O4 nanocomposite, it could be easily separated from the aqueous solutions with a magnet. This study established a low-cost, green and easy heterogeneous catalyst for the degradation of organic dyes and other pollutants in wastewater.Conflicts of interest
There are no conflicts of interest to declare.Acknowledgements
The authors gratefully acknowledge the Lorestan University and Iran Nanotechnology Initiative Council (INIC) for their financial support.References
- M. Saranya, R. Ramachandran, E. J. J. Samuel, S. K. Jeong and A. N. Grace, Powder Technol., 2015, 279, 209–220 CrossRef CAS.
- K. Ji, J. Deng, H. Zang, J. Han, H. Arandiyan and H. Dai, Appl. Catal., B, 2015, 165, 285–295 CrossRef CAS.
- Y. Xia, Z. He, Y. Lu, B. Tang, S. Sun, J. Su and X. Li, RSC Adv., 2018, 8, 5441–5450 RSC.
- M. Bartolomeu, M. G. P. M. S. Neves, M. A. F. Faustino and A. Almeida, Photochem. Photobiol. Sci., 2018, 17, 1573–1598 CrossRef CAS PubMed.
- D. Kanakaraju, B. D. Glass and M. Oelgemöller, J. Environ. Manage., 2018, 219, 189–207 CrossRef CAS.
- R. Andreozzi, V. Caprio, A. Insola and R. Marotta, Catal. Today, 1999, 53, 51–59 CrossRef CAS.
- N. N. Mahamuni and Y. G. Adewuyi, Ultrason. Sonochem., 2010, 17, 990–1003 CrossRef CAS PubMed.
- M. Kurian, Cleaner Eng. Technol., 2021, 2, 100090 CrossRef.
- I. Hua and M. R. Hoffmann, Environ. Sci. Technol., 1996, 30, 864–871 CrossRef CAS.
- P. Chowdhury and T. Viraraghavan, Sci. Total Environ., 2009, 407, 2474–2492 CrossRef CAS PubMed.
- H. Ferkous, O. Hamdaoui and S. Merouani, Ultrason. Sonochem., 2015, 26, 40–47 CrossRef CAS PubMed.
- R. Balachandran, Z. Patterson, P. Deymier, S. A. Snyder and M. Keswani, Chemosphere, 2016, 147, 52–59 CrossRef CAS PubMed.
- E. A. Serna-Galvis, J. Silva-Agredo, A. L. Giraldo-Aguirre and R. A. Torres-Palma, Sci. Total Environ., 2015, 524–525, 354–360 CrossRef CAS.
- S. Goskonda, W. James Catallo and T. Junk, Waste Manag., 2002, 22, 351–356 CrossRef CAS PubMed.
- T. Sivasankar and V. S. Moholkar, Ultrason. Sonochem., 2009, 16, 769–781 CrossRef CAS.
- K. S. Suslick, S. J. Doktycz and E. B. Flint, Ultrasonics, 1990, 28, 280–290 CrossRef CAS PubMed.
- K. Yasui, T. Tuziuti, J. Lee, T. Kozuka, A. Towata and Y. Iida, J. Chem. Phys., 2008, 128, 184705 CrossRef.
- K. S. Suslick, Y. Didenko, M. M. Fang, T. Hyeon, K. J. Kolbeck, W. B. McNamara, M. M. Mdleleni and M. Wong, Philos. Trans. R. Soc., A, 1999, 357, 335–353 CrossRef CAS.
- J. Lifka, B. Ondruschka and J. Hofmann, Eng. Life Sci., 2003, 3, 253–262 CrossRef CAS.
- C. Petrier, Y. Jiang and M. F. Lamy, Environ. Sci. Technol., 1998, 32, 1316–1318 CrossRef CAS.
- N. N. Mahamuni and Y. G. Adewuyi, Ultrason. Sonochem., 2010, 17, 990–1003 CrossRef CAS PubMed.
- Y. L. Pang, A. Z. Abdullah and S. Bhatia, Desalination, 2011, 277, 1–14 CrossRef CAS.
- P. Qiua, B. Parka, J. Choia, B. Thokchomb, A. B. Panditc and J. Khima, Ultrason. Sonochem., 2018, 45, 29–49 CrossRef.
- Z. Eren, J. Environ. Manage., 2012, 104, 127–141 CrossRef CAS PubMed.
- Z. Eren and N. H. Ince, J. Hazard. Mater., 2010, 177, 1019–1024 CrossRef CAS PubMed.
- U. S. Jonnalagadda, X. Su and J. J. Kwan, Ultrason. Sonochem., 2021, 73, 105530 CrossRef CAS PubMed.
- S. Cao, J. Low, J. Yu and M. Jaroniec, Adv. Mater., 2015, 27, 2150–2176 CrossRef CAS PubMed.
- L. H. Amorin, V. Y. Suzuki, N. H. de Paula, J. L. Duarte, M. A. T. da Silva, C. A. Taft and F. de Almeida La Porta, New J. Chem., 2019, 43, 13647–13653 RSC.
- W. J. Ong, L. L. Tan, Y. H. Ng, S. T. Yong and S.-P. Chai, Chem. Rev., 2016, 116, 7159–7329 CrossRef CAS PubMed.
- K. Xu, H. Xu, G. Feng and J. Feng, New J. Chem., 2017, 41, 14602–14609 RSC.
- M. Ismael and Y. Wu, New J. Chem., 2019, 43, 13783–13793 RSC.
- S. Bhowmik, S. J. Phukan, N. K. Sah, M. Roy, S. Garai and P. K. Iyer, ACS Appl. Nano Mater., 2021, 4, 12845–12890 CrossRef CAS.
- R. Suresh, S. Rajendran, P. S. Kumar, D. V. N. Vo and L. Cornejo-Ponce, Chemosphere, 2021, 274, 129734 CrossRef CAS PubMed.
- B. Palanivel, S. devi Mudisoodum perumal, T. Maiyalagan, V. Jayarman, C. Ayyappan and A. Mani, Appl. Surf. Sci., 2019, 498, 143807 CrossRef CAS.
- B. Palanivel, C. Ayyappan, V. Jayarman, S. Chidambaram, R. Maheswaran and A. Mani, Mater. Sci. Semicond. Process., 2019, 100, 87–97 CrossRef CAS.
- R. Cheng, X. Fan, M. Wang, M. Li, J. Tian and L. Zhang, RSC Adv., 2016, 6, 18990–18995 RSC.
- S. Huang, Y. Xu and H. Li, Colloids Surf., A, 2015, 478, 71–80 CrossRef CAS.
- H. Ji, X. Jing and H. Li, RSC Adv., 2015, 5, 57960–57967 RSC.
- S. Zhang, J. Li and X. Wang, ACS Appl. Mater. Interfaces, 2013, 5, 12735–12743 CrossRef CAS PubMed.
- Y. Yao, F. Lu and S. Wang, J. Hazard. Mater., 2015, 297, 224–233 CrossRef CAS PubMed.
- Y. Liu, Y. Song, Y. You, X. Fu, J. Wen and X. Zheng, J. Saudi Chem. Soc., 2017, 22, 439–448 CrossRef.
- J. Liu, T. Zhang, Z. Wang, G. Dawson and W. Chen, J. Mater. Chem., 2011, 21, 14398–14401 RSC.
- G. Li, N. Yang, W. Wang and W. Zhang, J. Phys. Chem. C, 2009, 113, 14829–14833 CrossRef CAS.
- X. Li, J. Zhang, L. Shen, Y. Ma, W. Lei, Q. Cui and G. Zou, Appl. Phys. A: Mater. Sci. Process., 2009, 94, 387–392 CrossRef CAS.
- M. Kim, S. Hwang and J.-S. Yu, J. Mater. Chem., 2007, 17, 1656–1659 RSC.
- H. Yan and H. Yang, J. Alloys Compd., 2011, 509, L26–L29 CrossRef CAS.
- J. Deng, Y. Shao, N. Gao, C. Tan, S. Zhou and X. Hu, J. Hazard. Mater., 2013, 262, 836–844 CrossRef CAS PubMed.
- J. Xu, Y. Wang and Y. Zhu, Langmuir, 2013, 29, 10566–10572 CrossRef CAS PubMed.
- F. Dong, Y. Sun, L. Wu, M. Fu and Z. Wu, Catal. Sci. Technol., 2012, 2, 1332–1335 RSC.
- L. Jing, Y. Xu, S. Huang, M. Xie, M. He, H. Xu, H. Li and Q. Zhang, Appl. Catal., B, 2016, 199, 11–22 CrossRef CAS.
- T. Aghavnian, J. B. Moussy, D. Stanescu, R. Belkhou, N. Jedrecy, H. Magnan, P. Ohresser, M. A. Arrio, P. Sainctavit and A. Barbier, J. Electron Spectrosc. Relat. Phenom., 2015, 202, 16–21 CrossRef CAS.
- G. Song, F. Xin and X. Yin, J. Colloid Interface Sci., 2015, 442, 60–66 CrossRef CAS PubMed.
- P. S. Yoo, D. Amaranatha Reddy, Y. Jia, S. E. Bae, S. Huh and C. Liu, J. Colloid Interface Sci., 2017, 486, 136–143 CrossRef CAS PubMed.
- Y. Xu, Q. Liu, C. Liu, Y. Zhai, M. Xie, L. Huang, H. Xu, H. Li and J. Jing, J. Colloid Interface Sci., 2017, 512, 555–566 CrossRef PubMed.
- A. A. Rodriguez-Rodriguez, S. Martinez-Montemayor, C. C. Leyva-Porras, F. E. Longoria-Rodriguez, E. Martinez-Guerra and M. Sanchez-Dominguez, J. Nanomater., 2017, 2017, 1–15 Search PubMed.
- S. Min and G. Lu, J. Phys. Chem. C, 2012, 116, 19644–19652 CrossRef CAS.
- A. Ren, C. B. Liu, Y. Z. Hong, W. D. Shi, S. Lin and P. Li, Chem. Eng. J., 2014, 258, 301–308 CrossRef CAS.
- L. Li, S. Xiang, S. Cao, J. Zhang, G. Ouyang, L. Chen and C. Y. Su, Nat. Commun., 2013, 4, 1774 CrossRef PubMed.
- A. Khataee, A. Karimi, S. Arefi-Oskoui, R. D. C. Soltani, Y. Hanifehpour, B. Soltani and S. W. Joo, Ultrason. Sonochem., 2015, 22, 371–381 CrossRef CAS PubMed.
- J. Jiang, J. Zou, L. Zhu, L. Huang, H. Jiang and Y. Zhang, J. Nanosci. Nanotechnol., 2011, 11, 4793–4799 CrossRef CAS PubMed.
- M. Xia, M. Long, Y. Yang, C. Chen, W. Cai and B. Zhou, Appl. Catal., B, 2011, 110, 118–125 CrossRef CAS.
- F. X. Wang, Y. L. Chen, R. S. Zhu and J. M. Sun, Dalton Trans., 2017, 47, 11306–11317 RSC.
- S. Valizadeh, M. H. Rasoulifard and M. S. Seyed Dorraji, Appl. Surf. Sci., 2014, 319, 358–366 CrossRef CAS.
- N. Ertugay and F. N. Acar, Appl. Surf. Sci., 2014, 318, 121–126 CrossRef CAS.
- A. Khataee, S. Saadi, B. Vahid, S. W. Joo and B. K. Min, Ultrason. Sonochem., 2016, 29, 27–38 CrossRef CAS PubMed.
- H. Zhang, C. Wei, Y. Huang and J. Wang, Ultrason. Sonochem., 2016, 30, 61–69 CrossRef CAS PubMed.
- M. C. Yin, Z. S. Li, J. H. Kou and Z. G. Zou, Environ. Sci. Technol., 2009, 43, 8361–8366 CrossRef CAS PubMed.
- F. Wang, H. Yang and Y. C. Zhang, Mater. Sci. Semicond. Process., 2018, 73, 58–66 CrossRef CAS.
- C. Yu, H. He, W. Zhou, Z. Liu and L. Wei, Sep. Purif. Technol., 2019, 217, 137–146 CrossRef CAS.
- H. He, Z. Luo and C. Yu, J. Alloys Compd., 2020, 816, 152652 CrossRef CAS.
- P. Qiu, W. Li, K. Kang, B. Park and W. Luo, J. Mater. Chem. A, 2014, 2, 16452–16458 RSC.
- L. Nirumand, S. Farhadi, A. Zabardasti and A. Khataee, Ultrason. Sonochem., 2018, 42, 647–658 CrossRef CAS PubMed.
- H. He, J. Li, C. Yu and Z. Luo, Sustainable Mater. Technol., 2019, 22, e00127 CrossRef CAS.
- H. He, L. Zeng, X. Peng, Z. Liu, D. Wang, B. Yang, Z. Li, L. Lei, S. Wang and Y. Hou, Chem. Eng. J., 2023, 451, 138628 CrossRef CAS.
- J. Hu, C. Chen, H. Yang, F. Yang, J. Qu, X. Yang, W. Sun, L. Dai and C. M. Li, Appl. Catal., B, 2022, 317, 121723 CrossRef CAS.
- T. Yang, Y. Shao, J. Hu, J. Qu, X. Yang, F. Yang and C. M. Li, Chem. Eng. J., 2022, 448, 137613 CrossRef CAS.
- S. Vadivel, D. Maruthamani, A. Habibi-Yangjeh, B. Paul, S. Sankar-Dhar and K. Selvam, J. Colloid Interface Sci., 2016, 480, 126–136 CrossRef CAS PubMed.
- X. Li, J. Hu, T. Yang, X. Yang, J. Qu and C. M. Li, Nano Energy, 2022, 92, 106714 CrossRef CAS.
| This journal is © The Royal Society of Chemistry 2023 |

