 Open Access Article
Co-deposition of Co–Ni alloy catalysts from an ethylene glycol system for the hydrogen evolution reaction
Xinkuai He,
Zhousi Hu,
Qingtian Zou,
Jingjing Yang,
Ruqing Guo and
Luye Wu *
*
School of Packaging and Materials Engineering, Hunan University of Technology, Zhuzhou 412007, PR China. E-mail: lyxk999@163.com; Fax: +86 731 22182168; Tel: +86 731 22182088
First published on 16th March 2023
Abstract
The preparation of active, stable and low-cost non-noble electrocatalysts for the hydrogen evolution reaction (HER) using the electrochemical water splitting process is crucial for the promotion of sustainable energy. In this study, Co–Ni alloys with various Co contents are prepared using a galvanostatic method and the co-deposition behavior of Co2+ and Ni2+ in ethylene glycol (EG) is reported. These results indicate that the presence of additional Ni2+ species can accelerate the Co–Ni co-deposition process and Co2+ species in the system can inhibit the reduction of Ni2+. Moreover, the two effects are improved with an increase in Ni2+ or Co2+ species concentration in the EG system, respectively. Chronoamperometry records show that the Co–Ni electro-crystallization mechanism is one of 3D instantaneous nucleation and growth. Moreover, the Co–Ni alloy with 59.46 wt% Co exhibits high electrocatalytic activity for HER with an overpotential of 133 mV at 10 mA cm−2 in 1 M KOH due to a high value of electrochemical active surface area (ECSA) (955.0 cm2). Therefore, the Co–Ni alloy electrocatalyst obtained from the EG system could be a promising candidate for practical hydrogen production.
1. Introduction
Normally, the electrodeposition technique has been employed as a surface treatment method with high preparation efficiency under ambient conditions. The technique can also be expediently scaled up on a large surface area matrix to achieve large-scale production. In addition, it can also be easily applied to various matrices to prepare various functional materials, particularly suitable for the preparation of non-noble metal transition metal-based catalytic materials.1 The electrodeposited Co–Ni alloy is a typical non-noble metal transition material and has inevitably been studied extensively due to its good corrosion resistance and wear resistance, high mechanical strength, moderate thermal conductivity and excellent electrocatalytic and magnetic properties and thus it has been widely applied in various industrial fields, such as advanced energy storage materials, electroactive materials, electronic materials and corrosion prevention. For instance, Co–Ni alloy coatings were prepared by K. R. Marikkannu et al.2 from an acetate electrolyte containing any one of the additives saccharin, dextrin, 1,4-butyne diol, coumarin, 1,3-naphthalene sulfonic acid, formaldehyde, glycine and crotonaldehyde, and they found that the microhardness and corrosion resistance of the obtained Co–Ni coatings could be improved by adding these additives. Coincidentally, A. C. Lokhande et al.3 found that Co–Ni alloy coatings obtained from sulfate bath electrodeposition at room temperature with saccharin (10 g L−1) as an additive exhibited superior microhardness and corrosion resistance. Meanwhile, as well as adding various additives to the electroplating solution to improve the performance of the Co–Ni alloy coatings, some scholars and researchers have also tried to improve the performance of these Co–Ni alloy coatings by applying external auxiliary factors in the electroplating process. For example, Co–Ni and Co–Ni/SiC coatings were electrodeposited by Xiaoyun Hu et al.4,5 under the introduction of a supergravity field, and it was found that the two prepared coatings showed better degrees of smoothness and microhardness compared with the corresponding coatings electrodeposited under a standard gravity field, especially under the condition of a supergravity field, and the corrosion resistance of the obtained Co–Ni/SiC coatings with various Co contents was greatly improved. Cansen Liu et al.6 found that the Co–Ni alloy coating obtained by supercritical carbon dioxide assisted electrodeposition exhibited better properties, such as wear resistance, surface appearance and surface roughness, and a smaller grain size than that of the Co–Ni alloy obtained by conventional electrodeposition. Even if both additives and external auxiliary factors can improve the performance of these coatings, the prepared materials are inevitably doped with impurities and their cost and complexity for the electrodeposition process can also be increased.3,6 It should be noted that all the above obtained Ni–Co alloys were electrodeposited from aqueous solution systems (as shown in Table 1) and these electrodeposition processes were normally anomalous co-deposition mechanisms due to the fact that the adsorption of Co(OH)ads+ is preferential to that of Ni(OH)ads+ on a cathode electrode, and Co(OH)ads+ as an intermediate species plays an important role in metallic cobalt deposition, while these intermediate species can obstruct the access of Ni(OH)ads+ to the cathode electrode surface.7–9 That is to say, the reduction of Ni2+ with a relatively positive initial reduction potential may be inhibited, while the reduction of Co2+ with a relatively negative initial reduction potential may be promoted during electrodeposition in aqueous systems, and then the molar ratio of Co/Ni in the prepared Co–Ni coatings is greater than that of Co2+/Ni2+ in the electrolyte. In this case, there is a higher Co content in the obtained Co–Ni coatings. It should be noted that another comprehensive steady-state model for Co–Ni alloy co-deposition in an acidic aqueous solution containing sulfate was proposed by Jorge Vazquez-Arenas et al.10 They found that the anomalous behavior could be attributed to the much faster charge-transfer of Co2+ reduction than that of Ni2+ reduction instead of the preferential adsorption of Co(I)ads over that of Ni(I)ads on a cathode surface. Thus, for different systems or baths, the abnormal co-deposition model of the Co–Ni alloy may be different. Although these Co–Ni alloys with different surface morphologies and various Co contents could be prepared from aqueous systems containing Co2+ and Ni2+ (as seen in Table 1), these electrodeposition processes were usually accompanied by an intensive hydrogen evolution reaction (HER), resulting in a profound effect on the current efficiency and quality of the Co–Ni alloy coatings.3,5,6,8–23 Importantly, a few holes6,9,11,19,21 and/or microcracks3,5,16 (as seen in Table 1) could be found on the Co–Ni alloys electrodeposited from aqueous systems, resulting in a profound effect on the catalytic stability for the HER.| Alloy coating | Employed electrolyte | Co content | Surface morphology | η10a (mV) | b (mV dec−1) | Cdl (mF cm−2) | Reference |
|---|---|---|---|---|---|---|---|
| a Overpotential (η10) was recorded at j = 10 mA cm−2. | |||||||
| Co–Ni | EG | 22.6–82.8 wt% | Spherical structure/fibrous structure | −139 | 117.5–187.6 | 0.6–41.3 | This work |
| Co–Ni | ChCl-urea | 2.34–19.68 wt% | Needle like structure | — | — | 0.0103–0.0905 (3.5% NaCl) | 26 |
| Co–Ni | ChCl-EG | 4/18/40 wt% | Pine-leaf-like/spherical structure | — | — | 28 | |
| Co–Ni | ChCl-EG | 2.94–11.56 wt% | Spherical structure | — | — | 0.0222–0.0503 (3.5% NaCl) | 27 |
| Co–Ni | [EMIM]HSO4 (ionic liquid) and EG | 10.48–42.83 wt% | Spherical “nodules” | −139 | 82.5–119 | — | 24 |
| Co–Ni | Aqueous solution | 15.63–46.39 wt% | Colony-like structures or hemispherical structures | — | — | — | 5 |
| Co–Ni | Aqueous solution | 10.87–38.3 wt% | Nanocone structure | −107 | 120 | 17.5–50.5 | 8 |
| Co–Ni | Aqueous solution | 7–27 at% | Spherulites structure with some microcracks | — | — | — | 3 |
| Co–Ni | Aqueous solution | 12.6–90.3 wt% | Cellular-like network or spherical grains | — | — | — | 9 |
| Co–Ni | Aqueous solution | 73.66/76.55 wt% | Wheat-like structure | — | — | — | 6 |
| Co–Ni | Aqueous solution | 58.47 wt% | Nanocone structure | — | — | — | 22 |
| Co–Ni | Aqueous solution | 29–75 wt% | Nanocones and/or lamellar structure | −180 | 127–308.9 | — | 20 |
| Co–Ni | Aqueous solution | 3.88–50.38 wt% | Granule structure | −181 | 108 | 0.0256 | 11 |
| Co–Ni | Aqueous solution | 83/79% | Acicular or nodular morphology | — | — | — | 18 |
| Co–Ni | Aqueous solution | 50–84 wt% | Acicular or nodular grain shapes | — | — | — | 17 |
| Co–Ni | Aqueous solution | 29.8–61 wt% | Cauliflower-like/coral-like/spongy-like | — | — | — | 21 |
| Co–Ni | Aqueous solution | 42 at% | Spherical particles | −162 | 60 | — | 41 |
| Co–Ni-Fe | Aqueous solution | 8.05 wt% | Nanocone structure | −91 | 86 | 44 | 12 |
| NiCoP/rGO | — | — | Nanosheet | −206 | — | — | 48 |
The ionic liquid (IL) system has become a vital type of electrolyte for success in an aqueous solution system because it represents an important development in the field of environmental protection and shows enormous potential in the synthesis of functional materials.24–28 More importantly, ILs can provide a wide electrochemical window, low volatility and high electrical conductivity for electrolysis without the presence of HER. Thus, compared with traditional aqueous systems, these plating techniques from ILs can improve the current efficiency and quality of the electrodeposited coatings, and eliminate the necessity to employ additional additive agents.2,3,12 For instance, Co–Ni alloy coatings with various Co contents (4, 18 and 40 wt%) were successfully prepared by Y. H. You et al.28 from choline chloride IL/ethylene glycol containing nickel and cobalt chlorides at room temperature, and the electrodeposition mechanism, microstructure, and corrosion resistance of the obtained films were also investigated in detail. They found that the electrodeposition process showed an absence of an anomalous co-deposition mechanism, while anomalous co-deposition for the Co–Ni alloy could frequently be observed in the aqueous systems.7,10 In addition, they found that their corrosion resistance could be improved with an increase in Co content. Subsequently, Co–Ni alloys were also successfully electrodeposited by Wenruo Li et al.26,27 from choline chloride IL-urea and choline chloride IL-ethylene glycol systems, respectively. They found that the reduction process of the Co–Ni alloy in the choline chloride IL-urea system was irreversible under diffusion control and its electro-crystallization process was three-dimensional instantaneous nucleation growth. However, these systems containing choline chloride are normally highly hygroscopic and their drying indicates a crucial process for minimizing water intake in these systems. In addition, large amounts of chloride ions can bring about an aggressive environment for deposits and substrates. A simple method to obtain stable systems is to remove choline chloride using only ethylene glycol as solvent. For instance, G. Panzeri et al.29 investigated the electrodeposition of cobalt films and nanowires from ethylene glycol solutions containing metal chloride precursor salts and found that the cobalt reduction process occurred with high cathodic efficiency (CE ∼ 85%), indicating the limited presence of secondary reactions. G. Panzeri et al.30 investigated ethylene glycol as a solvent for the electrodeposition of iron from both bivalent and trivalent iron chloride solutions, and nanostructured iron films with high purity were successfully electrodeposited. Therefore, ethylene glycol can be used as a simple and practical organic solvent for Co–Ni alloy electrodeposition. It should be noted that the electrodeposited Co–Ni alloys normally exhibit excellent electrocatalytic activity and stability for the HER. Thus, in recent years, they have been employed as catalysts for hydrogen production. For instance, when Co–Ni alloy coatings with different Co contents were successfully prepared by Sung Hoon Hong et al.19 from acidic sulfate aqueous solutions, it was found that the Co–Ni coating with 51 wt% Co showed the highest catalytic performance for the HER. Similarly, nanostructured Co–Ni alloys with various Co contents (varying from 0% to 75 wt%) were fabricated by Ya Li et al.20 They found that the morphologies of Co–Ni alloys were changed from nanocones to a lamellar structure with the change in Co content and the Ni-60% Co alloy coating exhibited optimal electrocatalytic activity for the HER with a small overpotential of 180 mV at 10 mA cm−2. In addition, F. Ganci et al.31 prepared nanostructured Co–Ni alloy electrodes by pulsed potential electrodeposition and found that the nanostructured Co–Ni electrode with 94.73 at% Co exhibited the best HER electrocatalytic performance.
In our previous work, a nanocrystalline Co coating with a fibrous surface morphology was successfully electrodeposited from an [EMIM]HSO4-EG mixture system, and it exhibited excellent catalytic activity and stability with an overpotential of 199 mV for the HER at a geometrical current density of 10 mA cm−2 in 1 M KOH solution.32 Subsequently, in order to further improve the catalytic performance and stability of the electrode material toward hydrogen evolution, Co–Ni alloy was electrodeposited in the [EMIM]HSO4-EG system,24 and exhibited better catalytic activity and stability with an overpotential of 139 mV for the HER at a geometrical current density of 10 mA cm−2 in 1 M KOH solution. In addition, the co-deposition behavior of Co2+ and Ni2+ in the [EMIM]HSO4-EG system and the anomalous co-deposition phenomenon due to the inhibition of Ni2+ reduction by Co2+ were investigated. However, the [EMIM]HSO4-EG mixture as an electrolyte can increase the plating cost due to the additional [EMIM]HSO4 IL, which is not conducive to industrial mass production. Therefore, in this study, a pure EG system was used as solvent to electrodeposit Co–Ni alloy by a galvanostatic electrodeposition method, expecting that it could present better catalytic activity for the HER. Hence, the co-deposition behavior of Co2+ and Ni2+ in the EG system and its electro-crystallization mechanism were observed by cyclic voltammetry (CV) and chronoamperometry (CA) techniques, respectively, and Co–Ni alloy coatings with different Co contents were prepared from the system. The surface morphology, composition, microstructure and elemental valence states of the Co–Ni alloy coatings were also characterized using SEM, EDS, XRD and XPS techniques. Moreover, the catalytic property for the obtained Co–Ni coatings was also recorded by linear sweep voltammetry (LSV) and electrochemical impedance spectra (EIS) techniques in a 1 M KOH system.
2. Experimental
2.1. Chemicals
EG (≥99.5%), anhydrous NiCl2 (99.9%) and CoCl2 (99.7%) were bought from Shanghai Aladdin Bio-Chem Technology Co, Ltd. All other chemicals and reagents employed in this work were commercially available and of analytical reagent grade. It should be noted that EG was dried under vacuum for 15 h at 333 K and the anhydrous CoCl2 and NiCl2 were also dried under vacuum for 6 h at 393 K before use. The concentration of NiCl2 was 0.2 M in the EG system. In order to prepare the Co–Ni coatings with various Co contents, the CoCl2 concentration in the EG solution was varied from 0.1 to 0.7 M.2.2. Plating and electrochemical experiments
All the electrochemical experiments were performed using a conventional three-electrode configuration with the help of an electrochemical workstation (CHI 660B) and the EG solution system was not agitated. The working electrode was a GC electrode (0.07 cm2), the counter electrode was platinum foil (3 cm2) and the reference electrode was a saturated calomel electrode (SCE). Before use, the GC electrode was preprocessed based on previous literature.26,27 Nevertheless, in the electrodeposition experiments, a DC power supply and galvanostatic method were used to prepare Co–Ni alloy coatings and a copper sheet (99.9 wt%) with an exposed area of 0.5 cm2 (0.5 × 1.0 cm) was used as the plating substrate (cathode) and platinum foil (3 cm2) as the anode. The distance between the cathode and anode in the plating bath was 2 cm, and before use the plating substrate was also preprocessed based on previous literature.6,8,17 In addition, these deposited Co–Ni coatings were cleaned successively in acetone and deionized water to remove the residues after plating and then dried under vacuum before measurement. All experiments were performed in a glove box and electrochemical experiments were carried out in an argon atmosphere containing less than 2 ppm moisture and oxygen.2.3. Characterization of Co–Ni coatings
A scanning electron microscope (SEM, HITACHI S-3000 N) and an energy dispersive spectroscope (EDS) were employed to observe the surface morphology and composition of the obtained Co–Ni alloy coatings. In addition, an X-ray diffractometer (XRD, Siemens D-5000) was employed to explore the crystal structures of the prepared Co–Ni alloy coatings; its testing parameter were: Cu target Kα (λ = 0.1541 nm) radiation, continuous scan, scanning range 2θ = 30–100°, scanning speed 2° min−1. X-ray photoelectron spectroscopy (XPS, Thermo Scientific K-Alpha) was employed to confirm the chemical composition and elemental valence states.2.4. Electrocatalytic measurements
The electrocatalytic property for HER on the Co–Ni alloy coatings in 1 M KOH aqueous solution was recorded at 298 K using LSV, EIS and Tafel techniques, employing the above-mentioned electrochemical workstation and three-electrode configuration. The main variations were that a copper sheet coated with Co–Ni (0.5 cm2) was employed as the working electrode and a graphite rod as the counter electrode. It is worth noting that EIS was recorded using an overpotential of −0.1 V with an amplitude of 5 mV at frequencies of 100 kHz to 100 mHz. The CV technique with 1000 cycles at a scanning rate of 50 mV s−1, as well as a chronoamperometry technique, was performed at 298 K to evaluate the catalytic stability for the Co–Ni coating. It should be noted that the potentials in this work were converted into a reversible hydrogen electrode (RHE) potential based on the method described in the literature.33,343. Results and discussion
3.1. Cyclic voltammetry study
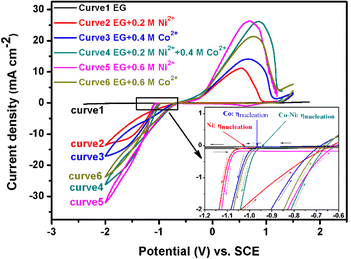
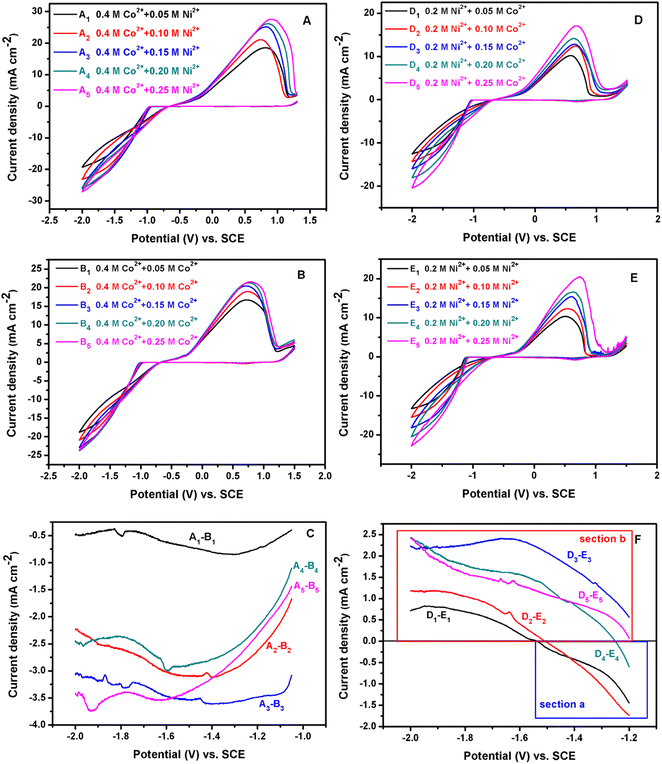
Fig. 1 presents the typical cyclic voltammograms of the EG system containing 0.2 M Ni2+ or/and 0.4 M Co2+ recorded at 298 K using a scan rate (v) of 50 mV s−1. It can be inferred from curve 1 in Fig. 1 that the EG system exhibits prominent electrochemical stability due to the fact that no apparent reduction or oxidation peaks are found in the range from +1.800 to −2.400 V. However, these CV curves (curves 2, 3 and 4 in Fig. 1) are changed in the presence of 0.2 M Ni2+ or/and 0.4 M Co2+ in the EG solution. For curve 2, the cathodic current density increases from −1.022 V (the so-called nucleation overpotential, ηnucleation) to −1.611 V (clearly presented in the inset in Fig. 1), and then a well-defined cathodic shoulder can be found between −1.611 and −1.891 V. During the reversal scanning, a current density loop (crossover), implying the presence of a nucleation and crystal growth process, can be found at −1.159 V, and the anodic current density peak is observed at 0.557 V, which is ascribed to the anodic stripping of the electrodeposited metal Ni onto the GC electrode. These results are basically in accordance with the electrochemical behavior for Ni2+ reduction in some ILs.26For curves 3 and 4, the cathodic current density increases sharply from −0.971 and −0.942 V to −1.641 and −1.609 V, respectively, and then two mild cathodic shoulders can be found (curve 3: between about −1.641 and −1.999 V; curve 4: between about −1.609 and −1.999 V). During the reversal scanning, two obvious current density loops can be found at −1.195 (curve 3) and −1.245 V (curve 4), and the two corresponding anodic current density peaks are recorded at 0.679 (curve 3) and 0.857 V (curve 4). The two cathodic shoulders are due to the electrochemical reduction of Co2+ to Co and the co-deposition of Ni2+ and Co2+, respectively, while the two anodic density peaks can be attributed to the corresponding stripping of Co and Co–Ni alloy. Interestingly, it can be observed that the nucleation overpotential (ηnucleation) for Ni2+ reduction to Ni (−1.022 V) is more negative than that of Co2+ reduction to Co (−0.971 V), implying that it is easier to prepare a cobalt-rich Co–Ni alloy, which is different from the result found in other literature.24 Meanwhile, the co-deposition nucleation overpotential for Co–Ni alloy (−0.942 V) in the system is more positive than that of pure nickel or pure cobalt, indicating that Co–Ni alloy co-deposition process is easier than that of metal Ni or Co.35 More interestingly, the cathode current density for curve 4 (0.2 M Ni2+ and 0.4 M Co2+) is smaller than that of curve 5 (0.6 M Ni2+) and bigger than that of curve 6 (0.6 M Co2+) at the same potential during the cathodic scanning. These results indicate that the presence of additional Ni2+ species can accelerate the Co–Ni co-deposition process, and Co2+ species in the system can inhibit the reduction of Ni2+. Moreover, the two effects should be improved with an increase in Ni2+ or Co2+ species concentration in the EG system, respectively. In order to verify this, another two CV tests using a scan rate (v) of 50 mV s−1 on GC at 298 K were performed in an EG-0.4 M Co2+ system with an increase in Ni2+ concentration from 0.05 to 0.25 M (Fig. 2A) and in the EG-0.2 M Ni2+ system with an increase in Co2+ concentration from 0.05 to 0.25 M (Fig. 2D), as exhibited in Fig. 2. In addition, in order to obtain valuable information about the cathode current density change, CV measurements using a scan rate (v) of 50 mV s−1 on GC at 298 K in EG with various Co2+ or Ni2+ concentrations were also carried out and are exhibited in Fig. 2B and E. It is found that the nucleation overpotential for the co-deposition of Ni2+ and Co2+ fluctuates slightly from −0.952 to −0.927 V with an increase in Ni2+ concentration (Fig. 2A) and its average value is about −0.939 V, while the nucleation overpotentials for Co2+ reduction in EG with various Co2+ concentrations are about −0.963 ± 0.010 V. The result indicates that their nucleation overpotentials shift more positively in the presence of additional Ni2+ species, implying that the co-deposition process of Ni2+ and Co2+ is easier than the Co2+ reduction process. That is to say, the additional Ni2+ species in EG can promote the nucleation/growth process. Moreover, all the cathode current densities for the EG-0.4 M Co2+ system with an increase in Ni2+ concentration from 0.05 to 0.25 M are larger than those in EG with the corresponding equal Co2+ concentration (Fig. 2C). This result indicates that the additional Ni2+ species in EG can promote Co2+ reduction. At the same time, the nucleation overpotentials for the co-deposition of Ni2+ and Co2+ fluctuate slightly more from −0.997 to −1.016 V with an increase in Co2+ concentration (Fig. 2D) and their average value is about −1.006 V, while the nucleation overpotential for Ni2+ reduction in EG with various Ni2+ is about −1.066 ± 0.015 V. This result indicates that the Co–Ni alloy nucleation/growth process is also easier than that of metal Ni. However, the cathode current densities for the EG-0.2 M Ni2+ system with an increase in Co2+ concentration from 0.05 to 0.25 M are larger than those in EG with the corresponding equal Ni2+ concentration at a relatively low overpotential (section a in Fig. 2F), and smaller at a relatively high overpotential (section b in Fig. 2F).
Moreover, the switch overpotential is positively shifted with an increase in Co2+ concentration from 0.05 to 0.15 M, and is then slightly negatively shifted with a further increase in Co2+ concentration. In addition, the difference value for the cathode current density between the EG-0.2 M Ni2+ system containing additional various Co2+ concentrations and the EG system containing only various corresponding equal Ni2+ concentrations increases with an increase in Co2+ concentration from 0.05 to 0.15 M, and then decreases slightly with a further increase in Co2+ concentration. All these results imply that the additional Co2+ species in the EG system can inhibit the co-deposition process of Ni2+ and Co2+ at a relatively high overpotential and the inhibition effect can be encouraged as the Co2+ species increases. The inhibition behavior can be attributed to the much faster charge-transfer of Co2+ reduction than that of Ni2+ reduction on a GC surface at a relatively high overpotential.10 However, at a relatively low overpotential, the charge-transfer for Co2+ reduction may be not faster than that of Ni2+ reduction, while the above acceleration effect for Ni2+ species in EG plays a dominant role in the Co–Ni alloy co-deposition. Thus, the cathode current density for the EG-0.2 M Ni2+ system containing various Co2+ species is larger than that in EG with the corresponding equal Ni2+ concentration at a relatively low overpotential. It should be noted that inhibition behavior for Ni2+ reduction was also observed in an ([EMIM]HSO4) IL and EG system,24 implying that the result is reliable.
3.2. Chronoamperometry study
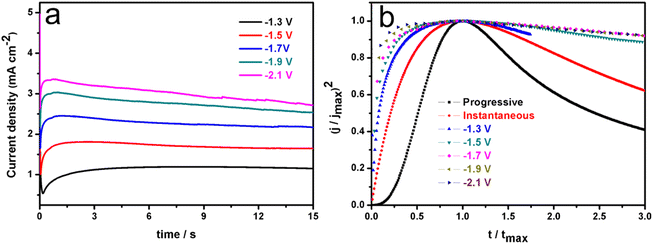
Representative current–time transient curves for an EG solution containing 0.2 M Ni2+ and 0.4 M Co2+ are exhibited in Fig. 3a.From this figure, it is clear that all of these curves look like universal current density transients recorded for the ordinary 3D nucleation and growth of a new phase.26,27,36–38 In the initial stage, due to the existence of active sites on the non-ideal cathode surface, Co–Ni bimetallic clusters grow radially, employing these active sites as growth centers. It should be noted that all these Co–Ni clusters are in steady-states and small, growing under diffusion control. During this growth process, the current density gradually rises to a maximum value due to the fact that there is no overlap among these cluster diffusion layers. After a period of time, these diffusion domains around Co–Ni nuclei overlap and ultimately the growth of the Co–Ni deposits is controlled by planar diffusion to the entire cathode surface, and then nuclear growth slows down. Therefore, all these current densities at the various applied potentials can decrease and tend to level off.27 In order to further clarify the mechanism of the Co–Ni alloy nucleation and growth process, non-dimensional (j/jmax)2 vs. (t/tmax) curves deduced from the Sharifker–Hills model38,39 was employed based on eqn (1) and (2) from current–time transient curves and exhibited in Fig. 3b.
Instantaneous nucleation:
 | (1) |
Progressive nucleation:
 | (2) |
3.3. Characterization of Co–Ni alloy coatings
Fig. 4a shows a typical EDS analysis of these deposits obtained at 30 mA cm−2 for 10 min from an EG system containing 0.4 M Co2+ and 0.2 M Ni2+ at 323 K.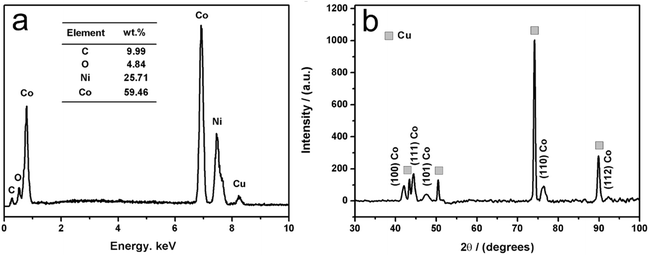 | ||
| Fig. 4 EDS analysis (a) and XRD pattern (b) of Co–Ni alloy coating obtained at 30 mA cm−2 for 10 min from an EG system containing 0.4 M CoCl2 and 0.2 M NiCl2 at 323 K. | ||
It is found that these deposits mainly consist of Co (about 59.46 wt%) and Ni (about 25.71 wt%) with a small residual amount of C and O species, implying that these deposits are the cobalt-enriched Co–Ni alloy. It is worth noting that the C can be attributed to the participation of EG molecules in the co-deposition reaction since these EG molecules can be absorbed on the cathode,37 while the small O content in these deposits can be attributed to oxidation in air when these deposits were brought out from the EG system. Fig. 4b shows a typical XRD pattern of these deposits obtained at 30 mA cm−2 for 10 min from an EG system containing 0.4 M Co2+ and 0.2 M Ni2+ at 323 K. As shown in Fig. 4b, it becomes clear that four intense copper peaks are found in the spectra, indicating that the thickness of these Co–Ni deposits is so small that the substrate copper is recorded. Meanwhile, the hexagonal close packed (hcp) phase of Co corresponds to (111), (100), (101), (110) and (112) peaks according to PDF#97-004-4990. It is worth noting that none of the diffraction peaks associated with metallic Ni is observed. This may be because the nickel atoms formed a hexagonal close packed (hcp) phase Co (Ni) solid solution by entering the Co crystal lattices.
In addition, X-ray photoelectron spectroscopy (XPS) was employed to investigate the elemental composition and chemical valence states of Co–Ni alloy, metallic Co and metallic Ni in Fig. 5. For the Co 2p region of metallic Co (Fig. 5a), the spectrum could be divided into three peaks, located at Co 2p3/2 with binding energy values of 780.55, 781.79 and 785.04 eV, which correspond to Co2+ and Co3+ species and a shake-up satellite peak, respectively.40,41 On the Co 2p1/2 profile, the signal can also be split into three peaks, corresponding to Co2+, Co3+ and shake-up satellite peaks, with the three binding energy (BE) values of 796.62, 798.15 and 802.41 eV, respectively. For the Ni 2p region of metallic Ni (Fig. 5b), the Ni 2p spectrum peaks with 855.95 and 873.47 eV correspond to the Ni 2p3/2 and Ni 2p1/2 profiles, which display the Ni2+ spin–orbit characteristics.42,43 Moreover, two shake-up satellite peaks can be observed at about 6 eV more than the peaks for Ni2+. Compared with the Co 2p peaks of the metallic Co sample, the Co–Ni alloy sample is shifted prominently to higher binding energy (Fig. 5c). Conversely, the Ni 2p peaks are shifted slightly to lower binding energy (Fig. 5d). The XPS results show that there are strong electron interactions between the Co and Ni atoms in the Co–Ni alloy, leading to a transfer of electrons from Co to Ni, thus reducing the electron density around Co. The lower electron density of Co means more empty d orbitals, which is thought to favor the adsorption of hydrogen and thus improve the electrocatalytic performance for the HER.44,45 In addition, the negative shift in the Ni XPS spectra indicates that the electron density could be increased, which will improve the ability for electron-donation and may be conducive to the HER. The above analysis shows that the Co–Ni alloy can display a more favorable electronic structure for the HER compared to metallic Co or Ni. It should be noted that the weight ratio of Co to Ni calculated from the XPS measurement is 61![[thin space (1/6-em)]](https://www.rsc.org/images/entities/char_2009.gif) :
:![[thin space (1/6-em)]](https://www.rsc.org/images/entities/char_2009.gif) 39 (Co
39 (Co![[thin space (1/6-em)]](https://www.rsc.org/images/entities/char_2009.gif) :
:![[thin space (1/6-em)]](https://www.rsc.org/images/entities/char_2009.gif) Ni), which is similar to the result from EDS.
Ni), which is similar to the result from EDS.
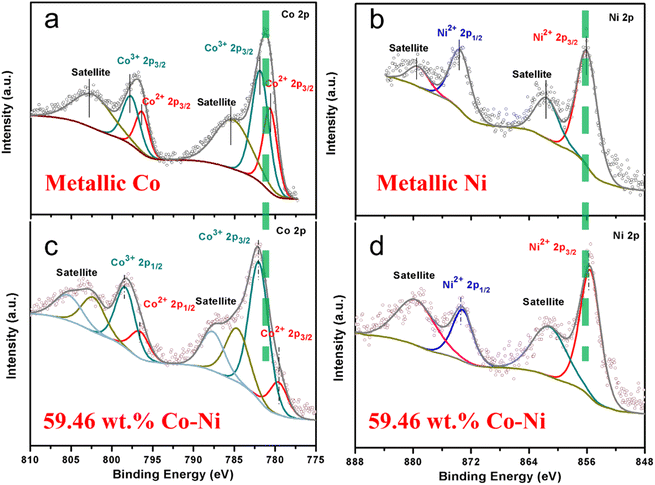 | ||
| Fig. 5 Co 2p (a, c) and Ni 2p (b, d) XPS spectra of metallic Co (a), metallic Ni (b) and Co–Ni alloy (c, d). | ||
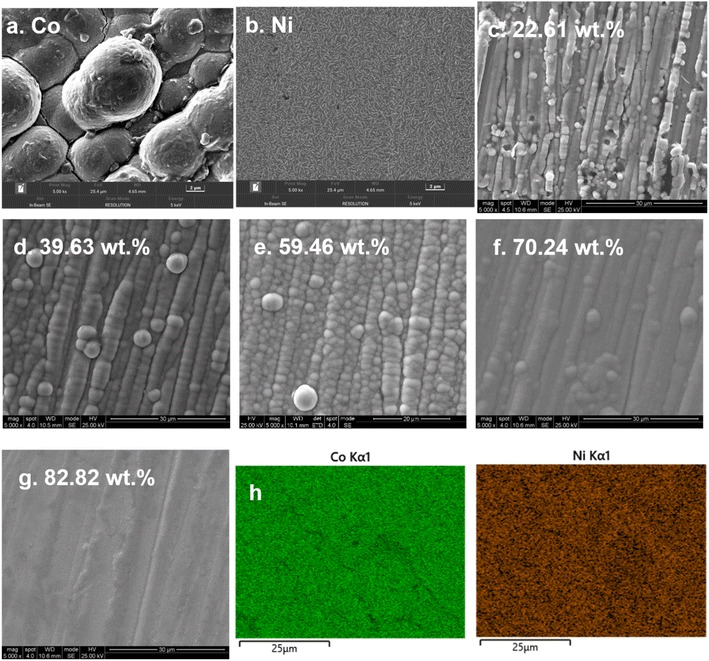
Fig. 6 presents the surface morphology of metallic Co, metallic Ni and these Co–Ni coatings with various Co contents. The plating solution composition is exhibited in Table 2. As shown in Fig. 6a, metallic Co displays a relatively dense structure with spherical “nodules”, and these spherical nodules can align compactly to form many wirelike crystal bundles distributed throughout these coatings, and there are also visible cracks on the coating surface. Fig. 6b shows the surface of the metallic Ni coating covered with a rice-like crystal structure. In addition, the Co–Ni alloy coatings prepared by electrodeposition still exhibit a spherical “nodule” structure that is similar to metallic Co, with a significant reduction in particle size, which can be attributed to the Ni atoms in the Co crystal lattices to form a solid solution during the electrodeposition process. Compared with the metallic Co coating, the cracks on the surface of Co–Ni alloy coatings are significantly reduced, which means that the addition of Ni atoms can reduce the internal stress of the coating. As shown in Fig. 6c–g, the size of the spherical “nodules” for the prepared Co–Ni coatings can be clearly affected by the Co content. When the Co content in the Co–Ni coatings is relatively low, the average size of these spherical “nodules” (crystal particles) is larger (Fig. 6c and d). Conversely, when the Co content in the Co–Ni coatings is relatively high, the average size of the crystal particles is smaller (Fig. 6e–g). This can be attributed to the Co2+ species in the EG system being able to inhibit the reduction of Ni2+, and the inhibition effect can be improved with an increase in Co2+ species concentration. Normally, the inhibition effect can improve cathodic polarization and then decrease the crystal particles. Thus, the result is also accordance with the CV measurements. It should be noted that the Co–Ni alloy containing 59.46 wt% Co (Fig. 6e) should present a larger ECSA than the other Co–Ni alloys, which is mainly attributed to the fact that more spherical crystals displaying optimal particles size grow on its surface and the arrangement among the spherical crystals will be tighter, which means that a larger surface area can be presented on a limited projection plane, thus allowing for a larger ECSA in the HER process. The conjecture shown by the SEM images was also confirmed in the EIS measurement (Fig. 9). Fig. 6h presents the EDS elemental mapping of Co and Ni for Co–Ni alloy coating with 59.46 wt% Co. It is clear that a Co–Ni alloy coating exhibits a homogeneous distribution of all elements in the coating, which indicates the formation of a solid solution structure.
| Bath composition (mol L−1) | Element content of the prepared coatings (wt%) | ||||
|---|---|---|---|---|---|
| CoCl2 | NiCl2 | Co | Ni | C | O |
| 0.4 | — | 90.72 | — | 5.54 | 3.74 |
| — | 0.2 | — | 91.43 | 5.32 | 3.25 |
| 0.10 | 0.2 | 22.61 | 66.22 | 7.96 | 3.21 |
| 0.25 | 0.2 | 39.63 | 46.83 | 8.91 | 4.63 |
| 0.40 | 0.2 | 59.46 | 25.71 | 9.99 | 4.84 |
| 0.55 | 0.2 | 70.24 | 15.73 | 9.02 | 5.01 |
| 0.70 | 0.2 | 80.82 | 6.49 | 8.32 | 4.37 |
3.4. Electrocatalytic properties of Co–Ni coatings for HER
In order to obtain valuable information about the electrocatalytic performance of the electrodeposited metallic Co, metallic Ni and Co–Ni alloy coatings for the HER, steady-state polarization curves were recorded using the LSV method in 1 M KOH solution and are shown in Fig. 7.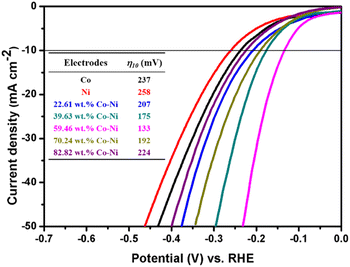 | ||
| Fig. 7 The steady-state polarization curves of metallic Co, metallic Ni and Co–Ni alloy coatings with various Co contents prepared from the EG system in 1 M KOH solution at 298 K. | ||
As shown in Fig. 7, it is found that all these Co–Ni alloy coatings obtained from the EG system exhibit superior HER electrocatalytic properties compared to metallic Co (η10 = 237) or Ni (η10 = 258). Moreover, the overpotential value for catalytic current density reaching 10 mA cm−2 (η10) decreases with an increase in Co content from 22.61 to 59.46 wt% in these coatings, while its value increases remarkably when the Co content is over 59.46 wt%. The change tendency is in line with reported Co–Ni alloy coating electrocatalysts for the HER.20 Normally, the excellent HER electrocatalytic activity can be attributed to the significant synergism in the electrocatalysis because metals of the left half of the transition series with empty or less filled d-orbitals (such as Co, Ni or Mo), are alloyed with metals of the right half of the transition series with internally paired d-orbitals (such as Co or Ni) that are not available for bonding in the pure metal and that can proceed with definite charge transfer.46 Importantly, for alkaline H2 evolution, Co atoms in the electrodeposited Co–Ni coatings can act as reaction sites employed for the O–H bond cleavage of H2O, while these sites for Ni atoms in the Co–Ni coatings can act as H2-evolving centers. Thus, the significant HER electrocatalytic activity can be attributed to the cooperative action of the Co and Ni dual atom sites. In addition, the bonding energy between a Co–Ni alloy coating with 59.46 wt% Co and hydrogen can achieve a relative balance between the rates of adsorption and desorption reactions. Consequently, a Co–Ni alloy coating with 59.46 wt% Co exhibits a relatively high electrocatalytic property. Moreover, the value of the overpotential (133 mV) for the Co–Ni alloy coating obtained from the EG system is smaller than that of other mainly fabricated nanostructured Co–Ni alloys11,20,47 and partial Co–Ni alloy composite coatings48 (Table 1). Meanwhile, in order to obtain valuable information about their HER kinetics, their Tafel curves were extracted from the steady-state polarization curves curves49–52 (Fig. 7) and are shown in Fig. 8.
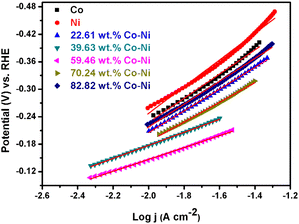 | ||
| Fig. 8 Tafel plots of metallic Co, metallic Ni and Co–Ni alloy coatings with various Co contents prepared from the EG system in 1 M KOH solution at 298 K. | ||
In addition, the exchange current densities (j0) corresponding to these Tafel plots were also calculated using j0 = 10(−a/b),53–55 and are exhibited in Table 3.
| Electrode | a (V) | b (mV dec−1) | j0 (mA cm−2) |
|---|---|---|---|
| Co | 0.7762 | 254.3 | 0.88 |
| Ni | 0.8399 | 261.1 | 0.61 |
| 22.61 wt% Co–Ni | 0.7015 | 237.8 | 1.12 |
| 39.63 wt% Co–Ni | 0.4331 | 142.7 | 0.92 |
| 59.46 wt% Co–Ni | 0.3768 | 129.7 | 1.24 |
| 70.24 wt% Co–Ni | 0.6356 | 214.7 | 1.09 |
| 82.82 wt% Co–Ni | 0.7566 | 248.9 | 0.91 |
As shown in Table 3, it is found that all these Co–Ni alloy coatings exhibit a lower Tafel slope and a greater exchange current density than metallic Co or metallic Ni coatings, meaning that the Co–Ni alloy coatings can present more beneficial catalytic kinetics for the HER. In addition, all the Tafel slopes of Co–Ni alloy coating catalysts are in the range of 129.7 to 248.9 mV dec−1, implying that the HER is controlled by a Volmer adsorption process.11,56–63 The Tafel slope for the Co–Ni alloy with 59.46 wt% Co is also lower than those of other Co–Ni alloys with different Co contents, implying that the Co–Ni alloy with 59.46 wt% Co is more favorable for HER catalytic kinetics. Additionally, the exchange current density (j0) of the HER on the Co–Ni alloy coating with 59.46 wt% Co is the highest (Table 3), indicating that it can display outstanding catalytic activity. This result may be attributed to the fact that Co–Ni alloys with 59.46 wt% Co present an electronic structure that is more favorable to the adsorption of hydrogen atoms in the HER process.
Normally, the interface properties and kinetics of the HER on an electrocatalyst surface can be easily analyzed by the EIS technique; thus, the EIS measurements for metallic Co, metallic Ni and Co–Ni alloy coatings with various Co contents employed as catalysts for HER were carried out in 1 M KOH solution and are shown in Fig. 9.
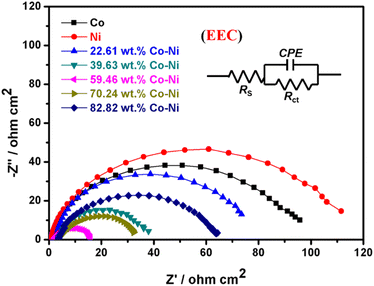 | ||
| Fig. 9 EIS curves and electrical equivalent circuit (EEC) of metallic Co, metallic Ni and Co–Ni alloy coatings with various Co contents prepared from the EG system in 1 M KOH solution at 298 K. | ||
In addition, the EIS data was fitted by Zview software based on the electrical equivalent circuit (EEC) (inset in Fig. 9) and the parameters are listed in Table 4, where Rs is solution resistance; CPE (constant phase element) is related to the double-layer capacity of the electrodes; and Rct is the electrochemical charge transfer resistance. As shown in Table 4, these Co–Ni alloy coatings exhibit better conductivity (lower charge transfer resistance) than metallic Co or Ni, which also means that Co–Ni alloy coatings present an electronic structure that is more conducive to the HER. In addition, the conductivity and HER catalytic activity for these Co–Ni alloy coatings are also remarkably related to Co content. The semicircle diameter decreases as Co content changes from 22.61 to 59.46 wt%, implying that both the conductivity and the HER catalytic activity are increased. In contrast, the semicircle diameter can increase when the Co content is over 59.46 wt%, implying that their conductivity and HER catalytic activity are decreased. Therefore, the Co–Ni alloy catalyst with 59.46 wt% Co exhibits the smallest charge transfer resistance during the hydrogen evolution process, which means that the electron transfer speed is faster on the surface of the Co–Ni alloy catalyst, thereby exhibiting better catalytic activity for the HER. Generally, ECSA is an important factor associated with the electrocatalytic performance for the HER, and the specific capacitance (Cdl) can be employed to calculate the ECSA value using the Cdl value for a flat standard with 1 cm2 of real surface area.64 In addition, the Cdl value for a flat surface is normally deemed to be in the range of 20–60 μF cm−2, and it is always assumed to be 40 (μF cm−2).65,66 Therefore, in this work, the ECSA values of these Co–Ni coatings were obtained using 40 μF cm−2 based on the method described in the literature,65 and are shown in Table 4. It is found that the Co–Ni alloy with 59.46 wt% Co content expectedly exhibits the largest ECSA value (955.0 cm2), also implying better catalytic performance for the HER.
| Electrode | Rs (Ω cm2) | Rct (Ω cm2) | Cdl (mF cm−2) | AECSA (cm2) |
|---|---|---|---|---|
| Co | 2.65 | 93.47 | 6.6 | 165 |
| Ni | 2.41 | 110.61 | 4.8 | 120 |
| 22.61 wt% Co–Ni | 2.54 | 75.74 | 5.2 | 130.0 |
| 39.63 wt% Co–Ni | 3.31 | 36.04 | 28.1 | 702.5 |
| 59.46 wt% Co–Ni | 2.02 | 15.22 | 38.2 | 955.0 |
| 70.24 wt% Co–Ni | 3.33 | 32.54 | 3.7 | 92.5 |
| 82.82 wt% Co–Ni | 3.32 | 61.35 | 0.6 | 15.0 |
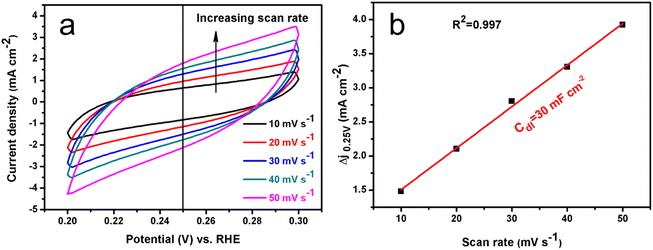
Normally, the electrochemical capacitance (Cdl) could also be obtained using the CV method in a potential range where there are no faradaic processes with different scan rates.66 Thus, the potential was recorded between 0.20 and 0.30 V vs. RHE at different rates from 10 to 50 mV s−1 in 1 M KOH. The typical CV curves for the Co–Ni alloy with 59.46 wt% Co that exhibited the best HER catalytic property can be seen in Fig. 10a.
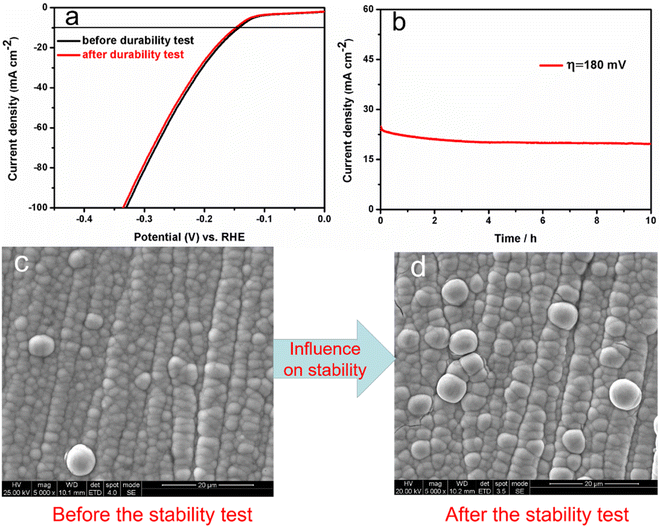
The measured capacitive current density is plotted as a function of scan rate and is shown in Fig. 10b. The calculated Cdl for the Co–Ni alloy with 59.46 wt% Co is about 30.0 mF cm−2. The value is of a similar magnitude to the above EIS measurements (38.2 mF cm−2). Catalytic stability is another primary property of an electrocatalysts for the HER; thus, it was measured using CV and chronoamperometry techniques. Fig. 11a shows these typical polarization plots of Co–Ni alloy with 59.46 wt% Co before and after performing 1000 CV scans.
It is clear that the two curves exhibit only a slight change in HER overpotential after 1000 cycles, which can be attributed to the high electrocatalytic stability of the Co–Ni alloy coated electrode. To confirm the electrocatalytic stability, the chronoamperometry curve of the Co–Ni alloy coating electrode with 59.46 wt% Co was recorded in 1 M KOH solution by applying an overpotential η = 180 mV, and is shown in Fig. 11b. It can be seen from Fig. 11b that during 10 h of testing, the current density initially decreased and was then maintained at about 20 mA cm−2 after the fourth hour. Fig. 11c and d, respectively, show SEM images taken before and after the stability test. It is evident that the surface morphology has not changed during the stability test due to the electrolysis of water, indicating that the alloy has outstanding hydrogen precipitation stability capabilities.
4. Conclusions
(1) The nucleation overpotential for Ni2+ reduction to Ni is more negative than that of Co2+ reduction to Co, and the Co–Ni alloy co-deposition process is easier than that of metal Ni or Co, implying that the co-deposition process of Co–Ni alloy in the EG system is typical non-abnormal co-deposition.(2) Ni2+ species in the EG system can accelerate the Co–Ni co-deposition process, and Co2+ species in the system can inhibit the reduction of Ni2+ at a relatively high overpotential, and then their effect can be improved with an increase in Ni2+ or Co2+ species concentration.
(3) The Co–Ni electro-crystallization mechanism in the EG system is a 3D instantaneous nucleation and growth of a new phase under diffusion control.
(4) Co–Ni alloy coatings with various Co contents can be obtained from the EG system containing various Co2+ concentrations and the surface morphology for the prepared Co–Ni alloy coatings can be affected by the Co content. Thus, the EG system is a promising candidate for commercial application in Co–Ni alloy plating because it can balance the disadvantages of low deposition efficiency in aqueous systems due to the HER during the deposition process and the high cost of ionic liquids, compared to conventional aqueous solution and ionic liquid systems.
(5) The electrocatalytic activity of the obtained Co–Ni alloy coatings can be improved with an increase in Co content from 22.61 to 59.46 wt%, and the prepared Co–Ni coating with 59.46 wt% Co exhibits a high electrocatalytic activity for the HER with an overpotential of 133 mV at 10 mA cm−2 in 1 M KOH solution due to a high ECSA value (955.0 cm2).
Author contributions
Xinkuai He: conceptualization, methodology, writing – original draft, review & editing. Zhousi Hu: investigation, data curation, writing – original draft. Qingtian Zou: investigation, data curation, writing – original draft. Jingjing Yang: investigation, data curation, writing – original draft. Ruqing Guo: data curation, visualization. Luye Wu: writing – original draft, funding acquisition, validation.Conflicts of interest
The authors declare that they have no known competing financial interests or personal relationships that could have appeared to influence the work reported in this paper.Acknowledgements
The authors acknowledge the financial supports of the National Natural Science Foundation of China (No. 21476067) and the Project Sponsored by the Scientific Research Foundation for the Returned Overseas Chinese Scholars, State Education Ministry.References
- R. Li, Y. Li, P. Yang, D. Wang, H. Xu, B. Wang, F. Meng, J. Zhang and M. An, J. Energy Chem., 2021, 57, 547–566 CrossRef CAS.
- K. R. Marikkannu, G. P. Kalaignan and T. Vasudevan, J. Alloys Compd., 2007, 438, 332–336 CrossRef CAS.
- A. C. Lokhande and J. S. Bagi, Surf. Coat. Technol., 2014, 258, 225–231 CrossRef CAS.
- X. Hu and N. Qu, Thin Solid Films, 2020, 700, 137923–137931 CrossRef CAS.
- X. Hu and N. Qu, Thin Solid Films, 2019, 679, 110–119 CrossRef CAS.
- C. Liu, F. Su and J. Liang, Surf. Coat. Technol., 2016, 292, 37–43 CrossRef CAS.
- C. K. Chung, W. T. Chang and M. W. Liao, Thin Solid Films, 2011, 519, 2075–2078 CrossRef CAS.
- G. B. Darband, M. Aliofkhazraei, A. S. Rouhaghdam and M. A. Kiani, Appl. Surf. Sci., 2019, 465, 846–862 CrossRef CAS.
- J. Vazquez-Arenas, T. Treeratanaphitak and M. Pritzker, Electrochim. Acta, 2012, 62, 63–72 CrossRef CAS.
- J. Vazquez-Arenas and M. Pritzker, Electrochim. Acta, 2012, 66, 139–150 CrossRef CAS.
- W. A. Badawy, H. Nady and M. Negem, Int. J. Hydrogen Energy, 2014, 39, 10824–10832 CrossRef CAS.
- G. Barati Darband, M. Aliofkhazraei and A. S. Rouhaghdam, J. Colloid Interface Sci., 2019, 547, 407–420 CrossRef CAS PubMed.
- P. Cojocaru, L. Magagnin, E. Gómez and E. Vallés, J. Alloys Compd., 2010, 503, 454–459 CrossRef CAS.
- A. Dolati, M. Sababi, E. Nouri and M. Ghorbani, Mater. Chem. Phys., 2007, 102, 118–124 CrossRef CAS.
- D. M. Dryden, T. Sun, R. McCormick, R. Hickey, R. Vidu and P. Stroeve, Electrochim. Acta, 2016, 220, 595–600 CrossRef CAS.
- M. Elrouby, M. Sadek, H. S. Mohran and H. M. Abd El-Lateef, J. Mater. Res. Technol., 2020, 9, 13706–13717 CrossRef CAS.
- O. Ergeneman, K. M. Sivaraman, S. Pané, E. Pellicer, A. Teleki, A. M. Hirt, M. D. Baró and B. J. Nelson, Electrochim. Acta, 2011, 56, 1399–1408 CrossRef CAS.
- E. Gómez, S. Pané and E. Vallés, Electrochim. Acta, 2005, 51, 146–153 CrossRef.
- S. H. Hong, S. H. Ahn, I. Choi, S. G. Pyo, H.-J. Kim, J. H. Jang and S.-K. Kim, Appl. Surf. Sci., 2014, 307, 146–152 CrossRef CAS.
- Y. Li, X. Zhang, A. Hu and M. Li, Int. J. Hydrogen Energy, 2018, 43, 22012–22020 CrossRef CAS.
- V. M. MaksimoviĆ, V. B. Kusigerski, M. M. StoiljkoviĆ, J. R. MaletaŠKiĆ and N. D. NikoliĆ, Trans. Nonferrous Met. Soc. China, 2020, 30, 1046–1057 CrossRef.
- S. Premlatha and G. N. K. Ramesh Bapu, J. Electroanal. Chem., 2018, 822, 33–42 CrossRef CAS.
- N. Wang, T. Hang, S. Shanmugam and M. Li, CrystEngComm, 2014, 16, 6937–6943 RSC.
- X. He, Z. Sun, Q. Zou, J. Yang and L. Wu, J. Electrochem. Soc., 2019, 166, D908–D915 CrossRef CAS.
- X. He, Q. Zhu, B. Hou, C. Li, Y. Jiang, C. Zhang and L. Wu, Surf. Coat. Technol., 2015, 262, 148–153 CrossRef CAS.
- W. Li, J. Hao, W. Liu and S. Mu, J. Alloys Compd., 2021, 853, 157158 CrossRef CAS.
- W. Li, J. Hao, S. Mu and W. Liu, Appl. Surf. Sci., 2020, 507, 144889 CrossRef CAS.
- Y. H. You, C. D. Gu, X. L. Wang and J. P. Tu, Surf. Coat. Technol., 2012, 206, 3632–3638 CrossRef CAS.
- G. Panzeri, A. Accogli, E. Gibertini, S. Varotto, C. Rinaldi, L. Nobili and L. Magagnin, Electrochem. Commun., 2019, 103, 31–36 CrossRef CAS.
- G. Panzeri, A. Accogli, E. Gibertini, C. Rinaldi, L. Nobili and L. Magagnin, Electrochim. Acta, 2018, 271, 576–581 CrossRef CAS.
- F. Ganci, V. Cusumano, P. Livreri, P. Aiello, C. Sunseri and R. Inguanta, Int. J. Hydrogen Energy, 2021, 46, 10082–10092 CrossRef CAS.
- X. He, Z. Sun, Q. Zou, L. Wu and J. Jiang, J. Electrochem. Soc., 2019, 166, D57–D64 CrossRef CAS.
- M. Wei, L. Yang, L. Wang, T. Liu, C. Liu, Y. Tang and S. Luo, Chem. Phys. Lett., 2017, 681, 90–94 CrossRef CAS.
- W. Dai, L. Lin, Y. Li, F. Li and L. Chen, Int. J. Hydrogen Energy, 2019, 44, 28746–28756 CrossRef CAS.
- B. Yue, G. Zhu, Y. Wang, J. Song, Z. Chang, N. Guo and M. Xu, J. Electroanal. Chem., 2021, 891, 115274–115285 CrossRef CAS.
- M. Allam, M. Benaicha and A. Dakhouche, Int. J. Hydrogen Energy, 2018, 43, 3394–3405 CrossRef CAS.
- O. Díaz-Morales, J. Mostany, C. Borrás and B. R. Scharifker, J. Solid State Electrochem., 2012, 17, 345–351 CrossRef.
- B. Scharifker and G. Hills, Electrochim. Acta, 1983, 28, 879 CrossRef CAS.
- X. He, J. Yang, Q. Zou, Z. Hu and L. Wu, J. Electrochem. Soc., 2022, 169, 022502–022512 CrossRef.
- Y. Li, H. Zhang, M. Jiang, Y. Kuang, X. Sun and X. Duan, Nano Res., 2016, 9, 2251–2259 CrossRef CAS.
- Y. P. Zhu, Y. P. Liu, T. Z. Ren and Z. Y. Yuan, Adv. Funct. Mater., 2015, 25, 7337–7347 CrossRef CAS.
- J. Masa, I. Sinev, H. Mistry, E. Ventosa, M. de la Mata, J. Arbiol, M. Muhler, B. Roldan Cuenya and W. Schuhmann, Adv. Energy Mater., 2017, 7, 1–8 Search PubMed.
- N. Xu, G. Cao, Z. Chen, Q. Kang, H. Dai and P. Wang, J. Mater. Chem. A, 2017, 5, 12379–12384 RSC.
- Y. M. Tian, J. Yu, H. S. Zhang, C. Wang, M. L. Zhang, Z. W. Lin and J. Wang, Electrochim. Acta, 2019, 300, 217–224 CrossRef CAS.
- Y. Yang, K. Zhang, H. Lin, X. Li, H. C. Chan, L. Yang and Q. Gao, ACS Catal., 2017, 7, 2357–2366 CrossRef CAS.
- M. M. Jaksićc, Zeitschrift für Physikalische Chemie, 2011, 1, 621 CrossRef.
- T. Sun, J. Cao, J. Dong, H. Du, H. Zhang, J. Chen and L. Xu, Int. J. Hydrogen Energy, 2017, 42, 6637–6645 CrossRef CAS.
- J. Li, M. Yan, X. Zhou, Z.-Q. Huang, Z. Xia, C.-R. Chang, Y. Ma and Y. Qu, Adv. Funct. Mater., 2016, 26, 6785–6796 CrossRef CAS.
- L. B. Wu, F. H. Zhang, S. W. Song, M. H. Ning, Q. Zhu, J. Q. Zhou, G. H. Gao, Z. Y. Chen, Q. C. Zhou, X. X. Xing, T. Tong, Y. Yao, J. M. Bao, L. Yu, S. Chen and Z. F. Ren, Adv. Mater., 2022, 34, 2201774–2201785 CrossRef CAS PubMed.
- J. Wan, W. J. Yang, J. Q. Liu, K. L. Sun, L. Liu and F. Fu, Chin. J. Catal., 2022, 3, 485–498 CrossRef.
- M. Ning, L. Wu, F. Zhang, D. Wang, S. Song, T. Tong, J. Bao, S. Chen, L. Yu and Z. Ren, Mater. Today Phys., 2021, 19, 100419 CrossRef CAS.
- L. Yu, J. Y. Xiao, C. Q. Huang, J. Q. Zhou, M. Qiu, Y. Yu, Z. F. Ren, C. W. Chu and J. C. Yu, Proc. Natl. Acad. Sci. U. S. A., 2022, 119, e2202382119 CrossRef CAS PubMed.
- H. Ren, W. Xu, S. Zhu, Z. Cui, X. Yang and A. Inoue, Electrochim. Acta, 2016, 190, 221–228 CrossRef CAS.
- Z. Zhang, Y. Wu and D. Zhang, Int. J. Hydrogen Energy, 2022, 47, 1425–1434 CrossRef CAS.
- G. Barati Darband, M. Aliofkhazraei, S. Hyun and S. Shanmugam, ACS Appl. Mater. Interfaces, 2020, 12, 53719–53730 CrossRef CAS PubMed.
- F. Almomani and R. R. Bhosale, Int. J. Hydrogen Energy, 2021, 46, 11369–11377 CrossRef CAS.
- C. Lupi, A. Dell'Era and M. Pasquali, Int. J. Hydrogen Energy, 2017, 42, 28766–28776 CrossRef CAS.
- L. Wu, Y. He, T. Lei, B. Nan, N. Xu, J. Zou, B. Huang and C. T. Liu, Energy, 2014, 67, 19–26 CrossRef CAS.
- Y. Zhang, P. Li, X. Yang, W. Fa and S. Ge, J. Alloys Compd., 2018, 732, 248–256 CrossRef CAS.
- D. Kutyła, A. Salcı, A. Kwiecińska, K. Kołczyk-Siedlecka, R. Kowalik, P. Żabiński and R. Solmaz, Int. J. Hydrogen Energy, 2020, 45, 34805–34817 CrossRef.
- P. R. Lima, A. Mirapalheta, M. Henrique dos Santos Andrade, E. O. Vilar, C. L. d. P. e Silva Zanta and J. Tonholo, Energy, 2010, 35, 2174–2178 CrossRef CAS.
- X. Chia and M. Pumera, ACS Appl. Mater. Interfaces, 2018, 10, 4937–4945 CrossRef CAS PubMed.
- Z. Chen, D. Cummins, B. N. Reinecke, E. Clark, M. K. Sunkara and T. F. Jaramillo, Nano Lett., 2011, 11, 4168–4175 CrossRef CAS PubMed.
- J. Kibsgaard and T. F. Jaramillo, Angew. Chem., Int. Ed. Engl., 2014, 53, 14433–14437 CrossRef CAS PubMed.
- Y. Wu and H. He, Int. J. Hydrogen Energy, 2018, 43, 1989–1997 CrossRef CAS.
- J. D. Benck, Z. Chen, L. Y. Kuritzky, A. J. Forman and T. F. Jaramillo, ACS Catal., 2012, 2, 1916–1923 CrossRef CAS.
| This journal is © The Royal Society of Chemistry 2023 |

