 Open Access Article
Sustainable dispersive liquid–liquid microextraction method utilizing a natural deep eutectic solvent for determination of chloramphenicol in honey: assessment of the environmental impact of the developed method
Heba Shaaban
Department of Pharmaceutical Chemistry, College of Clinical Pharmacy, Imam Abdulrahman Bin Faisal University, King Faisal Road, P.O. Box 1982, Dammam 31441, Eastern Province, Saudi Arabia. E-mail: hsmohammed@iau.edu.sa; Tel: +966 546262270
First published on 9th February 2023
Abstract
The greening of pharmaceutical analysis is gaining interest, and different approaches have been proposed, such as minimizing the consumption of hazardous reagents, replacing toxic solvents with safer alternatives, and reducing waste generation. In this work, a natural deep eutectic solvent (NADES) was synthesized and utilized as a green alternative in dispersive liquid–liquid microextraction (DLLME) for the determination of chloramphenicol in honey. Different deep eutectic solvents composed of monoterpenoids and acids were tested. The NADES system composed of menthol and acetic acid at a molar ratio of 1![[thin space (1/6-em)]](https://www.rsc.org/images/entities/char_2009.gif) :
:![[thin space (1/6-em)]](https://www.rsc.org/images/entities/char_2009.gif) 1 was found to be the most appropriate in terms of extraction recovery. Different DLLME parameters including vortex time, centrifugation time, sample volume, and deep eutectic solvent volume were optimized. A determination coefficient of 0.9997 was achieved. Satisfactory recovery ranged from 98.8 to 101.5 with % RSD ≤4.5. The chromatographic performance of the presented method compared with other previously documented methods for determination of chloramphenicol in honey was highlighted. Additionally, the ecological impact of the developed method was assessed employing three tools: the Analytical Eco-scale, the Green Analytical Procedure Index, and the Analytical GREEnness metric. The presented method can be regarded as a green substitute for the traditional methods used for the determination of chloramphenicol in honey.
1 was found to be the most appropriate in terms of extraction recovery. Different DLLME parameters including vortex time, centrifugation time, sample volume, and deep eutectic solvent volume were optimized. A determination coefficient of 0.9997 was achieved. Satisfactory recovery ranged from 98.8 to 101.5 with % RSD ≤4.5. The chromatographic performance of the presented method compared with other previously documented methods for determination of chloramphenicol in honey was highlighted. Additionally, the ecological impact of the developed method was assessed employing three tools: the Analytical Eco-scale, the Green Analytical Procedure Index, and the Analytical GREEnness metric. The presented method can be regarded as a green substitute for the traditional methods used for the determination of chloramphenicol in honey.
1. Introduction
There has been great interest in the greening of pharmaceutical analysis over the last few decades. The implementation of green analytical chemistry (GAC) principles necessitates the proper design of the analytical procedures aimed at minimizing the harmful impact on human health and the environment.1 Different approaches have been introduced to achieve this goal, including minimizing solvent consumption and waste generation, using eco-friendly solvents and reagents, and miniaturization of sample preparation and separation techniques.2 Traditional analytical methods developed for pharmaceutical analysis consume large amounts of harmful organic solvents with subsequent waste generation.3 More benign technologies have been developed with the aim of reducing the consumption of the harmful organic solvents consumed worldwide during pharmaceutical analysis without sacrificing chromatographic performance.4 Replacing toxic solvents with safer ones for the greening of pharmaceutical analysis is well documented in the literature.5–7Sample preparation is an inevitable step in various analytical applications aimed at removing the interfering substances, pre-concentrating, and/or derivatizing the investigated analytes. Nevertheless, sample preparation can be regarded as the most harmful procedure in the analytical process because of the use of large volumes of polluting solvents during the extraction process, hence generating large volumes of waste.1 Miniaturization is one of the GAC principles aiming at minimizing the consumption of organic solvents.8 Dispersive liquid–liquid microextraction (DLLME) is a miniaturized sample preparation technique that has been employed in a wide range of analytical chemistry applications.9,10 It provides various advantages over other sample preparation techniques in terms of simplicity, cost, ease of operation, and rapidity. However, the proper selection of dispersing solvents and extracting solvents (μL scale) is highly challenging.10 Classical DLLME methods utilize toxic halogenated organic solvents such as chloroform, carbon tetrachloride, and chlorobenzene that may have adverse effects on human health and the environment.9 Replacing toxic solvents with more benign alternatives is one of the GAC principles that should be implemented in the method development. Therefore, more eco-friendly natural deep eutectic solvents (NADESs) have been recently introduced as a sustainable alternative in DLLME.10 Generally, NADES is composed of two or more components (hydrogen bond donors and hydrogen bond acceptors) mixed at a certain ratio to form a homogenous mixture that has an eutectic point at a temperature lower than that of the individual substances. These solvents are biodegradable, less harmful, readily available, and easy to prepare.11 Monoterpenes (e.g., thymol and menthol) are considered satisfactory choices for preparing hydrophobic NADESs because of their low water solubility.12
Chloramphenicol is a broad-spectrum antibacterial agent that widely used in veterinary medicine.13 Because of its severe adverse effects on human health, its use in food-producing animals is prohibited in many countries such as the US, Canada, and Australia.14 The European Union (EU) regulates the use of chloramphenicol in honey and prohibits its use for treatment of honeybees. Because chloramphenicol should be absent in honey, no maximum residue limits (MRLs) have been set for chloramphenicol.15 Alternatively, in 2009, the EU established the minimum required performance limit (MRPL) of 0.3 ppb for chloramphenicol in honey.15
To ensure consumer safety, continual monitoring of chloramphenicol levels in food products is of paramount importance. Due to the strict regulations set by different governments, sensitive, reliable, and fast methodologies for trace analysis of chloramphenicol in food products are highly needed. Various extraction methods have been developed for the determination of chloramphenicol in honey, including liquid–liquid extraction,16–19 solid phase extraction,20,21 Quick Easy Cheap Effective Rugged Safe (QuEChERs),22 and classical DLLME.23,24
The literature currently indicates that no green DLLME methods utilizing natural deep eutectic solvents have been developed for the determination of chloramphenicol in honey. Therefore, this study aims to develop and optimize a green DLLME method utilizing a NADES as a sustainable alternative to the halogenated solvents commonly used in classical DLLME methods. To the best of our knowledge, this is the first study employing a menthol-based DES-DLLME method for the determination of chloramphenicol in honey. Additionally, the ecological impact of the proposed method was investigated, and the greenness level of the method was evaluated using the Analytical Eco-Scale (AES),25 the Green Analytical Procedure Index (GAPI),26 and the Analytical GREEnness Metric (AGREE).27
2. Experimental
2.1. Chemicals and reagents
A chloramphenicol standard with 98% purity was purchased from Sigma-Aldrich (Steinheim, Germany). Ethanol of analytical grade was purchased from Merck (Darmstadt, Germany). Thymol, menthol, acetic acid, formic acid, octanoic acid, and decanoic acid were purchased from Sigma-Aldrich (Steinheim, Germany). The ultrapure water used in this study was obtained by using a Pure Lab Ultra water system (ELGA, High Wycombe, UK). A chloramphenicol stock solution (1000 mg L−1) was prepared in ethanol and stored at 4 °C. The working solutions were freshly prepared by serial dilutions from the stock solution and stored at −20 °C.2.2. Honey samples
Honey samples were purchased from large markets located in the Eastern province of Saudi Arabia. A total of 25 samples was collected between May and June, 2022. A control honey sample verified to be non-contaminated with chloramphenicol was used as a blank. Before the extraction, 1.0 g of honey samples was weighed into a 15 mL centrifuge tube and diluted with 5.0 mL of water, and then vortexed to obtain a homogenized solution. The samples were filtered using a 0.45 μm pore-size cellulose membrane filter to remove any suspended particles. For spiked samples, an appropriate volume of chloramphenicol standard was added, and the solution was stirred and then left to equilibrate for one hour.2.3. Synthesis of NADES
For selecting an appropriate NADES, eight different NADESs containing thymol or menthol as monoterpenes and acetic acid, formic acid, octanoic acid, or decanoic acid were investigated. The components of each NADES at a molar ratio of 1![[thin space (1/6-em)]](https://www.rsc.org/images/entities/char_2009.gif) :
:![[thin space (1/6-em)]](https://www.rsc.org/images/entities/char_2009.gif) 1 were added to a conical flask and heated with continuous stirring at 70 °C for 20 min until a homogeneous clear solution was synthesized. The formed NADES was allowed to cool at ambient temperature and was then stored in a desiccator for the subsequent DLLME procedures.
1 were added to a conical flask and heated with continuous stirring at 70 °C for 20 min until a homogeneous clear solution was synthesized. The formed NADES was allowed to cool at ambient temperature and was then stored in a desiccator for the subsequent DLLME procedures.
2.4. NADES-DLLME procedures
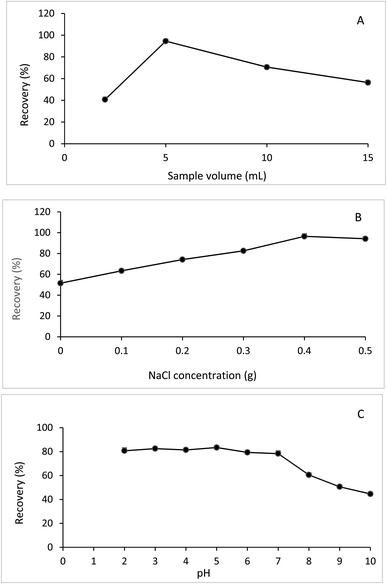
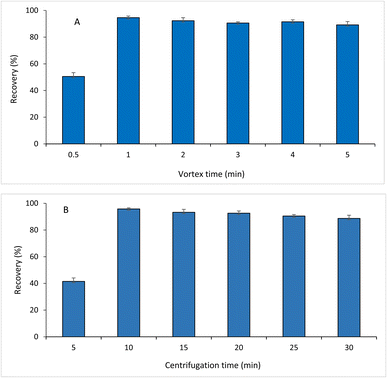
Five milliliters of a sample solution was added to a 15 mL polypropylene centrifuge tube. Then, 0.4 g of NaCl was added to the tube, and the solution was vortexed until the salt was completely dissolved. Then, the NADES volume of 100 μL was transferred to the mixture and vortexed for 1 min, followed by centrifugation for 10 min at 3500 rpm to separate the NADES system containing the analyte from the aqueous phase. Afterwards, the lower layer (aqueous phase) was removed from the tube using a micro-syringe, and the upper layer was diluted to 0.5 mL with ethanol. Finally, the mixture was purified by nano-filters (0.2 μm) from Restek (USA) and then injected into a ultra-high performance liquid chromatography-ultraviolet (UHPLC-UV) system for analysis.2.5. Instrumentation
The chromatographic analysis was carried out using an UltiMate 3000 XRS UHPLC (Thermo Scientific Dionex, Germany). The system was operated with a dual gradient pump, an autosampler, and a temperature-controlled column compartment. For detection, a diode array detector was used, and the wavelength was set at 278 nm. The chromatographic analysis was performed on an Acquity BEH C18 (2.1 mm × 30 mm × 1.7 μm) column (Waters, USA) with a guard pre-column (Waters, USA). The temperature was set at 40 °C, and the flow rate was 0.5 mL min−1. A mobile phase composed of water: ethanol (80![[thin space (1/6-em)]](https://www.rsc.org/images/entities/char_2009.gif) :
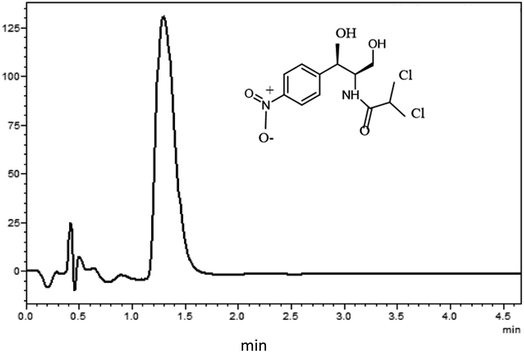
:![[thin space (1/6-em)]](https://www.rsc.org/images/entities/char_2009.gif) 20, v/v) was employed. The mobile phase was sonicated using a sonicator bath (Branson 5510 Ultrasonic Cleaner). The injection volume was 2 μL. The infrared spectra were recorded using a Nicolet 50 FT-IR spectrometer (Thermo Scientific, USA). A 300 MHz Bruker nuclear magnetic resonance (NMR) spectrometer (Bruker, Switzerland) was utilized for recording the proton nuclear magnetic resonance (1H NMR) spectra of the prepared NADES. Deuterated dimethyl sulfoxide (d6-DMSO) was used for sample dilution. For data processing and system control, Labsolution v5.93 software from Shimadzu (Kyoto, Japan) was used. A typical UHPLC-UV chromatogram of chloramphenicol is presented in Fig. 1.
20, v/v) was employed. The mobile phase was sonicated using a sonicator bath (Branson 5510 Ultrasonic Cleaner). The injection volume was 2 μL. The infrared spectra were recorded using a Nicolet 50 FT-IR spectrometer (Thermo Scientific, USA). A 300 MHz Bruker nuclear magnetic resonance (NMR) spectrometer (Bruker, Switzerland) was utilized for recording the proton nuclear magnetic resonance (1H NMR) spectra of the prepared NADES. Deuterated dimethyl sulfoxide (d6-DMSO) was used for sample dilution. For data processing and system control, Labsolution v5.93 software from Shimadzu (Kyoto, Japan) was used. A typical UHPLC-UV chromatogram of chloramphenicol is presented in Fig. 1.
3. Results and discussion
3.1. Characterization of the synthesized NADES
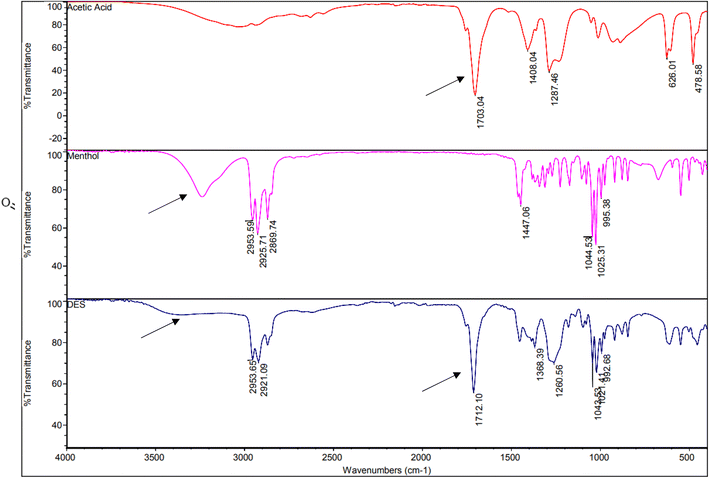
For selecting the most appropriate NADES for extracting chloramphenicol, eight NADESs were investigated, as mentioned earlier. The types of intermolecular interactions between menthol and acetic acid when a deep eutectic solvent is formed are hydrogen bonding and dipole–dipole interactions. Hydrogen bonding (formed between the carboxyl group of acetic acid and the hydroxyl group of menthol) creates a strong attractive force between the two molecules, which assists in lowering the melting point of the mixture. Dipole–dipole interactions occur between menthol and acetic acid molecules and create a weak attractive force between the two molecules. This also contributes to the lower melting point of the DES. Additionally, van der Waals forces between the non-polar menthol and the polar acetic acid molecules may also play a role in the formation of the DES.To ensure that the NADES was successfully formed, NMR and FTIR were utilized for the NADES characterization. For demonstrating the hydrogen-bond interactions between the individual components of the selected NADES, the FT-IR spectra of menthol, acetic acid, and the formed menthol-acetic acid NADES were determined, and the results are presented in Fig. 2. As illustrated, the O–H stretching band of menthol at 3231 cm−1 became barely identifiable in the formed NADES, and also the acetic acid C![[double bond, length as m-dash]](https://www.rsc.org/images/entities/char_e001.gif) O stretching band at 1703 cm−1 was slightly shifted to 1712 cm−1, indicating the formation of a hydrogen bond in the prepared NADES.28
O stretching band at 1703 cm−1 was slightly shifted to 1712 cm−1, indicating the formation of a hydrogen bond in the prepared NADES.28
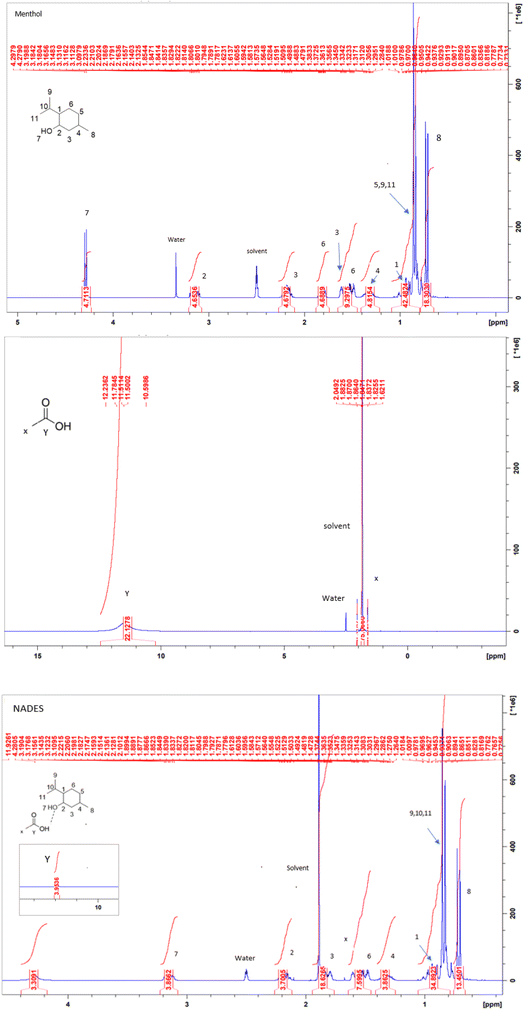
The 1HNMR spectra of the formed NADES and its components (menthol and acetic acid) are illustrated in Fig. 3. The persistence of the distinguished peaks of acetic acid and menthol in the 1HNMR spectrum of the formed NADES and the absence of any new additional peaks indicated that no other new compounds were formed. For providing a high extraction efficiency, the developed NADES-DLLME method was optimized. The one-factor-at-a-time approach was used to investigate different extraction parameters including NADES type, NADES molar ratio, NADES volume, sample volume, salt concentration, pH, vortex time, and centrifugation time.
3.2. Optimization of the developed NADES-DLLME method
![[thin space (1/6-em)]](https://www.rsc.org/images/entities/char_2009.gif) :
:![[thin space (1/6-em)]](https://www.rsc.org/images/entities/char_2009.gif) 1. The procedures previously described for the preparation of NADES were followed. The investigated NADESs yielded clear transparent homogenous liquids without crystallization at ambient temperature. The extraction efficiency of each prepared NADES was tested to enrich chloramphenicol.
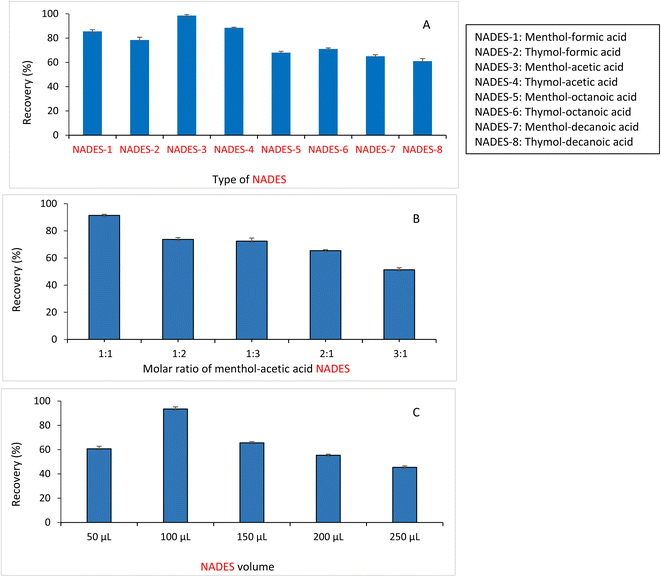
1. The procedures previously described for the preparation of NADES were followed. The investigated NADESs yielded clear transparent homogenous liquids without crystallization at ambient temperature. The extraction efficiency of each prepared NADES was tested to enrich chloramphenicol.Hydrogen bonding is likely to occur between chloramphenicol and menthol-acetic acid NADES. Chloramphenicol contains different functional groups that allow for hydrogen bonding, including an alcohol group (–OH) that contains a hydroxyl group that can participate in hydrogen bonding. Also, chloramphenicol contains an amide group (NHCO) that contains a lone pair of electrons and an ether group (–O–) that can participate in hydrogen bonding. It was found that the highest extraction recovery of chloramphenicol was achieved by NADES-3 (menthol and acetic acid) (98.5%), followed by NADES-4 (thymol and acetic acid) (88.4%). NADES-1 (menthol-formic acid) was ranked third in terms of extraction efficiency (85.5%).
Other NADESs (NADES-2, NADES 5-8) exhibited much lower extraction efficiencies, ranging from 78–61%. Based on these results, NADES-3 (menthol-acetic acid) was selected as an extraction solvent for the subsequent procedures. The effect of NADES type on the extraction recovery of chloramphenicol is illustrated in Fig. 4A. Also, for determining the optimized molar ratio of the selected NADES, different molar ratios of menthol and acetic acid (1![[thin space (1/6-em)]](https://www.rsc.org/images/entities/char_2009.gif) :
:![[thin space (1/6-em)]](https://www.rsc.org/images/entities/char_2009.gif) 1, 1
1, 1![[thin space (1/6-em)]](https://www.rsc.org/images/entities/char_2009.gif) :
:![[thin space (1/6-em)]](https://www.rsc.org/images/entities/char_2009.gif) 2, 1
2, 1![[thin space (1/6-em)]](https://www.rsc.org/images/entities/char_2009.gif) :
:![[thin space (1/6-em)]](https://www.rsc.org/images/entities/char_2009.gif) 3, 2
3, 2![[thin space (1/6-em)]](https://www.rsc.org/images/entities/char_2009.gif) :
:![[thin space (1/6-em)]](https://www.rsc.org/images/entities/char_2009.gif) 1, and 3
1, and 3![[thin space (1/6-em)]](https://www.rsc.org/images/entities/char_2009.gif) :
:![[thin space (1/6-em)]](https://www.rsc.org/images/entities/char_2009.gif) 1) were examined. The molar ratio of 1
1) were examined. The molar ratio of 1![[thin space (1/6-em)]](https://www.rsc.org/images/entities/char_2009.gif) :
:![[thin space (1/6-em)]](https://www.rsc.org/images/entities/char_2009.gif) 1 provided the best extraction recovery, as illustrated in Fig. 4B, and thus, it was used for DLLME procedures.
1 provided the best extraction recovery, as illustrated in Fig. 4B, and thus, it was used for DLLME procedures.
3.3. Method validation
After the optimization of the extraction parameters, the analytical performance of the developed method was evaluated in terms of linearity, precision, accuracy, limit of detection, and limit of quantification. To investigate the method linearity, matrix-matched calibration curves were constructed using a blank sample solution spiked with the standard solution of chloramphenicol at seven concentration levels. The absence of interfering components near the retention time of chloramphenicol indicated the method specificity, as shown in Fig. 1. The calibration curves were linear in the range of 1–100 μg kg−1 with a determination coefficient (r2) of 0.9997, which reflected the high linearity of the developed method.The limit of detection (LOD) based on the signal-to-noise ratio of 3 was 0.20 μg kg−1, and the limit of quantification (LOQ) based on the signal-to-noise ratio of 10 was 0.60 μg kg−1. The accuracy and precision of the developed method were evaluated at three different concentration levels (5, 10, and 50 μg kg−1). Satisfactory percentage recoveries ranged from 98.8% to 101.5% (Table 2). The intra-day precision was determined by performing six replicated experiments on the same day, and the inter-day precision was evaluated by analyzing nine replicates over three consecutive days. Satisfactory method precision in terms of % relative standard deviation (RSD) was achieved (% RSD ≤ 3.9 for the inter-day precision and ≤4.5 for the intra-day). The method validation results are presented in Table 1.
| Analytical parameters | Values | |
|---|---|---|
| Linearity range | 1–100 μg kg−1 | |
| Determination coefficient (r2) | 0.9997 | |
| Limit of detection (LOD) | 0.20 μg kg−1 | |
| Limit of quantitation (LOQ) | 0.60 μg kg−1 | |
| Intra-day precision | % R | % RSD |
| 5 μg kg−1 | 99.1 | 2.7 |
| 10 μg kg−1 | 99.6 | 1.6 |
| 50 μg kg−1 | 101.5 | 0.9 |
| Inter-day precision | % R | % RSD |
| 5 μg kg−1 | 100.2 | 4.5 |
| 10 μg kg−1 | 98.8 | 4.2 |
| 50 μg kg−1 | 99.3 | 3.7 |
3.4. Analysis of honey samples
To evaluate the appropriateness of the presented method, 25 honey samples (14 local samples and 11 imported samples) of different botanical origin available in the Saudi market were investigated. The samples were analyzed under the optimized conditions as previously described. Chloramphenicol was found in 8% of the analyzed honey samples (2 out of 25) at concentrations of 0.63 μg kg−1 and 0.72 μg kg−1.It should be noted that the two samples contaminated with chloramphenicol were imported. The occurrence of chloramphenicol in imported honey samples at concentrations higher than those in the local samples is in agreement with values obtained in other studies.24 The results of this study highlight the importance of monitoring the antibiotic levels in imported food products including honey to ensure product quality and consumer safety.
3.5. Compliance with the principles of green analytical chemistry (GAC) and evaluation of the greenness profile of the developed method
In this study, the principles of GAC were taken into consideration when the method was designed. In this context, a proper analytical column was selected for chromatographic separation. A short, narrow bore sub-2 μm column was employed to achieve fast separation and narrow peaks.29 The solvents used in the mobile phase also have a great impact on the greenness level of the developed methods, and therefore, solvents from renewable sources (ethanol and water) were selected in the proposed study. Ethanol is the most environmentally favourable solvent as per the Environment, Health, and Safety method and the Life-Cycle Assessment method.30 Under optimized conditions, chloramphenicol was efficiently eluted in 1.3 min, and the volume of ethanol consumed was 0.13 mL per run. These conditions would ensure complete separation of the chloramphenicol peak from other peaks (e.g., the NADES and other interfering components) when the method was applied for the analysis of real honey samples. Regarding the sample preparation, a micro-scale extraction method (DLLME) utilizing a natural benign solvent (menthol) was selected to ensure the high level of the method greenness.For evaluating the ecological impact of the proposed method, three assessment tools were applied. First, the Analytical Eco-Scale (AES) was applied to provide an overview regarding the amounts of solvents used and their hazards, occupational hazard, energy consumed, and waste generated.25 Briefly, penalty points given for each criterion were summed and then subtracted from 100. The resulting score was used to assess the greenness level of the analytical method (e.g., excellent: score ≥75, acceptable: score ≥50, and not adequately green: score ≤50). In this study, the total penalty points assigned for the proposed method after being subtracted from 100 was 85, which indicated that the developed method was excellent in terms of greenness and environmental impact.
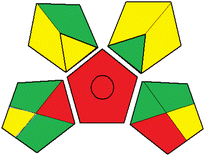
Table 2 illustrates the detailed calculations of the assigned penalty points using the AES tool. Combining two or more greenness assessment tools can significantly provide a full picture of the eco-friendliness of the developed methods.31 Therefore, the Green Analytical Procedure Index (GAPI)26 was utilized as a complementary tool for evaluating the environmental impact of the proposed method. The GAPI is illustrated as pictograms with different colours (green, yellow, and red) depending on the level of the method's greenness. A detailed description of the GAPI tool is presented in Table 3. As depicted, the GAPI pictogram contained six green parts and only three red parts, which indicates that the proposed method is green with a low hazardous impact on human health and the environment. Additionally, the proposed method can be applied for qualitative and quantitative analysis as well.
| Items | Penalty points (PPs) | ||
|---|---|---|---|
| 1. Reagents | |||
| 1.1. Ethanol | Amount | <10 mL | 1 |
| Hazard type | Single word: danger | 2 | |
| Hazard amount | 2 Pictograms | 2 | |
| Total PPs = 4 | |||
| 1.2. Menthol | Amount | <10 mL | 1 |
| Hazard type | Single word: warning | 1 | |
| Hazard amount | 1 Pictogram | 1 | |
| Total PPs = 1 | |||
| 1.3. Acetic acid | Amount | <10 mL | 1 |
| Hazard type | Single word: danger | 2 | |
| Hazard amount | 2 Pictogram | 2 | |
| Total PPs = 4 | |||
| 1.4. NaCl | Amount | 0.4 g | 0 |
| Hazard type | 0 | 0 | |
| Hazard amount | 0 | 0 | |
| Total PPs = 0 | |||
![[thin space (1/6-em)]](https://www.rsc.org/images/entities/char_2009.gif) |
|||
| 2. Instruments | |||
| 2.1. Energy (kW h per sample) | LC-UV | ≤ 0.1 | 0 |
| 2.2. Occupational hazard | No hermetic sealing release of gas or vapor into air | 0 | |
| Total PPs = 0 | |||
![[thin space (1/6-em)]](https://www.rsc.org/images/entities/char_2009.gif) |
|||
| 3. Waste | |||
| 3.1. Waste amount | 1–10 mL | 3 | |
| 3.2. Waste treatment | No treatment | 3 | |
| Total PPs = 6 | |||
| Total penalty points | 15 | ||
| Eco-scale score | 100 − 15 = 85 | ||
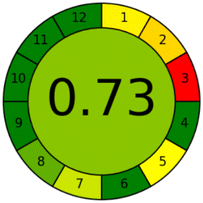
The third tool applied is Analytical GREEnness Metric (AGREE). This tool is based on the twelve GAC principles and is illustrated as a pictogram with a final score expressed on a scale from 0 to 1, according to the greenness level of the method.27 The high final score of the AGREE metric used for the proposed method (0.73) (Table 3) confirmed that the proposed method is environmentally friendly with a minimal environmental impact. Overall, in this study, the use of hazardous organic solvents or reagents was avoided and the generation of waste was minimized. Hence, the developed method was classified as a green method with low environmental impact. The combination of the three mentioned assessment tools allowed for a comprehensive overview of the greenness level of the developed method for all the analytical procedures, including sample preparation and chromatographic analysis.
3.6. Comparison to other reported methods
An overview of liquid chromatographic methods reported for the determination of chloramphenicol in honey is illustrated in Table 4, and includes extraction procedures, separation techniques, solvents used, sample volume, mobile phase composition, run time, linearity range, determination coefficients, recovery, LODs, and precision. It was observed that all reported methods used hazardous solvents that were toxic, halogenated, or not biodegradable. One of the most relevant characteristics of the developed method is the usage of green alternatives such as water and ethanol, which reflects the high level of the method greenness compared to conventional methods.| Extraction technique | Extraction solvents | Separation technique | Mobile phase | Sample volume | Run time (min) | Linear range | r2 | LOD | Recovery (%) | % RSD | Ref. |
|---|---|---|---|---|---|---|---|---|---|---|---|
| a SPE: solid phase extraction, DLLME: dispersive liquid–liquid microextraction, LLE: liquid–liquid extraction, NADES: deep eutectic solvent, LOD: limit of detection. | |||||||||||
| SPE | Dichloromethane, acetone, methanol, diethyl ether | LC-MS/MS | Methanol![[thin space (1/6-em)]](https://www.rsc.org/images/entities/char_2009.gif) : :![[thin space (1/6-em)]](https://www.rsc.org/images/entities/char_2009.gif) ammonium acetate (60 ammonium acetate (60![[thin space (1/6-em)]](https://www.rsc.org/images/entities/char_2009.gif) : :![[thin space (1/6-em)]](https://www.rsc.org/images/entities/char_2009.gif) 40, v/v) 40, v/v) |
10 mL | 6.3 | 0.6–10 μg L−1 | 0.9996 | 0.07 μg kg−1 | 98.7–102.0 | 0.2–6.2 | 20 |
| DLLME | 1,1,2,2-Tetrachloromethane, acetonitrile | LC-UV | Methanol![[thin space (1/6-em)]](https://www.rsc.org/images/entities/char_2009.gif) : :![[thin space (1/6-em)]](https://www.rsc.org/images/entities/char_2009.gif) water (55 water (55![[thin space (1/6-em)]](https://www.rsc.org/images/entities/char_2009.gif) : :![[thin space (1/6-em)]](https://www.rsc.org/images/entities/char_2009.gif) 45, v/v) 45, v/v) |
5 mL | 5.8 | 3–2000 μg kg−1 | 0.9996 | 0.60 μg kg−1 | 89.5–91.7 | <5.1 | 23 |
| QuEChERs | Acetonitrile, anhydrous MgSO4 | LC-MS | Methanol![[thin space (1/6-em)]](https://www.rsc.org/images/entities/char_2009.gif) : :![[thin space (1/6-em)]](https://www.rsc.org/images/entities/char_2009.gif) 0.2% ammonium acetate (45 0.2% ammonium acetate (45![[thin space (1/6-em)]](https://www.rsc.org/images/entities/char_2009.gif) : :![[thin space (1/6-em)]](https://www.rsc.org/images/entities/char_2009.gif) 55, v/v) 55, v/v) |
5 mL | 8.0 | 0.1–100 μg kg−1 | 0.9995 | 0.002 μg kg−1 | 78.0–93.0 | 3.7–3.9 | 22 |
| LLE | Acetonitrile, chloroform, methanol | LC-MS/MS | Methanol![[thin space (1/6-em)]](https://www.rsc.org/images/entities/char_2009.gif) : :![[thin space (1/6-em)]](https://www.rsc.org/images/entities/char_2009.gif) 0.15% formic acid 0.15% formic acid |
10 mL | 2.0 | 0.2–5.0 μg kg−1 | 0.9994 | 0.02 μg kg−1 | — | <4.3 | 16 |
| LLE | Ethyl acetate, acetonitrile, methanol | LC-MS/MS | Methanol![[thin space (1/6-em)]](https://www.rsc.org/images/entities/char_2009.gif) : :![[thin space (1/6-em)]](https://www.rsc.org/images/entities/char_2009.gif) 0.1% ammonia solution 0.1% ammonia solution |
1 g | 10.7 | 0.1–1.0 μg kg−1 | 0.9910 | 0.04 μg kg−1 | — | <8.6 | 17 |
| Magnetic SPE | Acetonitrile, methanol | LC-UV | Methanol![[thin space (1/6-em)]](https://www.rsc.org/images/entities/char_2009.gif) : :![[thin space (1/6-em)]](https://www.rsc.org/images/entities/char_2009.gif) water (50 water (50![[thin space (1/6-em)]](https://www.rsc.org/images/entities/char_2009.gif) : :![[thin space (1/6-em)]](https://www.rsc.org/images/entities/char_2009.gif) 50, v/v) 50, v/v) |
10 mL | 5.0 | 7–1000 μg L−1 | 0.9994 | 0.24 μg L−1 | 80.5–104.8 | <8.9 | 21 |
| LLE | Acetonitrile | LC-MS/MS | Methanol![[thin space (1/6-em)]](https://www.rsc.org/images/entities/char_2009.gif) : :![[thin space (1/6-em)]](https://www.rsc.org/images/entities/char_2009.gif) water water |
5 mL | 3.5 | 0.01–0.6 μg kg−1 | 0.9990 | 0.003 μg kg−1 | 92.0–105.1 | 1.19–9.2 | 18 |
| LLE | 1-Butyl-3-methylimidazoline tetrafluoroborate, sodium citrate | LC-UV | Methanol![[thin space (1/6-em)]](https://www.rsc.org/images/entities/char_2009.gif) : :![[thin space (1/6-em)]](https://www.rsc.org/images/entities/char_2009.gif) water (45 water (45![[thin space (1/6-em)]](https://www.rsc.org/images/entities/char_2009.gif) : :![[thin space (1/6-em)]](https://www.rsc.org/images/entities/char_2009.gif) 55, v/v) 55, v/v) |
5 mL | 5.2 | 2–1000 μg L−1 | 0.9998 | 0.30 μg L−1 | 90.4–102.7 | ≤5.1 | 19 |
| DLLME | Acetonitrile, chloroform, methanol | LC-MS/MS | Methanol![[thin space (1/6-em)]](https://www.rsc.org/images/entities/char_2009.gif) : :![[thin space (1/6-em)]](https://www.rsc.org/images/entities/char_2009.gif) water water |
5 mL | 3.0 | 0.04–1.6 μg kg−1 | 0.9980 | 0.012 μg kg−1 | 54.0–60.0 | <5.0 | 24 |
| NADES-DLLME | Menthol, acetic acid | LC-UV | Ethanol![[thin space (1/6-em)]](https://www.rsc.org/images/entities/char_2009.gif) : :![[thin space (1/6-em)]](https://www.rsc.org/images/entities/char_2009.gif) water (20 water (20![[thin space (1/6-em)]](https://www.rsc.org/images/entities/char_2009.gif) : :![[thin space (1/6-em)]](https://www.rsc.org/images/entities/char_2009.gif) 80, v/v) 80, v/v) |
5 mL | 1.6 | 1–100 μg kg−1 | 0.9997 | 0.20 μg kg−1 | 98.8–101.5 | 0.9–4.5 | This study |
Apparently, completion of the analysis in a short time has a significant impact on organic solvent consumption. The comparison revealed that the run time achieved by the presented method was the shortest in comparison to other reported methods (Table 4). Also, the analytical performance of the presented method is very comparable to the reported methods in terms of determination coefficients, accuracy, and precision (Table 4). It should be noted that there are lower LODs for some of the reported methods, and this is attributed to the use of MS/MS for detection. However, compared to reported LC-UV methods, more optimal chromatographic performance was observed with the proposed method. To conclude, compared with other documented methods, the presented method is more eco-friendly, utilizes benign alternatives, is faster, cost-effective, more affordable, and does not require expensive or sophisticated detectors.
4. Conclusion
In this study, an eco-friendly DLLME method utilizing a menthol-based NADES was developed and optimized for determination of chloramphenicol residues in honey. Different NADESs composed of monoterpenes and acids were investigated, and the most efficient system (menthol and acetic acid) was selected. The proposed method exhibited satisfactory linearity with a determination coefficient of 0.9997. Satisfactory recovery ranging from 98.8% to 101.5% was achieved. The ecological impact of the developed method was evaluated using ESA, GAPI, and AGREE assessment tools. The proposed DLLME method is fast, cost-effective, and sustainable. It can be applied for the quality control analysis of chloramphenicol in honey without harmful effects on human health or the environment.Author contributions
Heba Shaaban: conceptualization, validation, formal analysis, writing – original draft and editing, funding acquisition, project administration, visualization, supervision, writing – review and editing.Conflicts of interest
The authors declare that they have no known competing financial interests or personal relationships that could have appeared to influence the work reported in this paper.Acknowledgements
This study was funded by the Deanship of Scientific Research, Imam Abdulrahman Bin Faisal University, Saudi Arabia (Grant No. 2016-218-Pharm).References
- J. Płotka-Wasylka, H. M. Mohamed, A. Kurowska-Susdorf, R. Dewani, M. Y. Fares and V. Andruch, Green analytical chemistry as an integral part of sustainable education development, Curr. Opin. Green Sustainable Chem., 2021, 31, 100508, DOI:10.1016/j.cogsc.2021.100508.
- Á. I. López-Lorente, F. Pena-Pereira, S. Pedersen-Bjergaard, V. G. Zuin, S. A. Ozkan and E. Psillakis, The ten principles of green sample preparation, TrAC, Trends Anal. Chem., 2022, 148, 116530, DOI:10.1016/j.trac.2022.116530.
- S. Armenta, F. A. Esteve-Turrillas, S. Garrigues and M. de la Guardia, Alternative green solvents in sample preparation, Green Anal. Chem., 2022, 1, 100007, DOI:10.1016/j.greeac.2022.100007.
- H. Shaaban, Eco-Friendly Bio-Analytical Techniques for Pharmaceutical Analysis, J. Clin. Bioanal. Chem., 2017, 1, 3–4 Search PubMed . https://www.alliedacademies.org/articles/green-ecofriendly-bioanalytical-techniques-for-pharmaceutical-analysis.pdf.
- A. Ivanković, A. Dronjić, A. M. Bevanda and S. Talić, Review of 12 principles of green chemistry in practice, Int. J. Sustainable Green Energy, 2017, 6, 39–48 CrossRef . http://www.sciencepublishinggroup.com/j/ijsge.
- A. B. Eldin, O. A. Ismaiel, W. E. Hassan and A. A. Shalaby, Green analytical chemistry: Opportunities for pharmaceutical quality control, J. Anal. Chem., 2016, 71, 861–871, DOI:10.1134/S1061934816090094.
- H. Shaaban, A. Mostafa, A. M. Alqarni, R. Alsultan, Z. Aljarrash, W. Al-Zawad, S. Al-Kahlah and M. Amir, Dispersive liquid-liquid microextraction utilizing menthol-based deep eutectic solvent for simultaneous determination of sulfonamides residues in powdered milk-based infant formulas, J. Food Compos. Anal., 2023, 117, 105137, DOI:10.1016/j.jfca.2023.105137.
- M. Tobiszewski, A. Mechlińska and J. Namieśnik, Green analytical chemistry—theory and practice, Chem. Soc. Rev., 2010, 39, 2869–2878, 10.1039/B926439F.
- A. Mostafa and H. Shaaban, Development and validation of a dispersive liquid–liquid microextraction method for the determination of phthalate esters in perfumes using gas chromatography-mass spectrometry, RSC Adv., 2018, 8, 26897–26905, 10.1039/C8RA03488E.
- H. Yan and H. Wang, Recent development and applications of dispersive liquid–liquid microextraction, J. Chromatogr. A, 2013, 1295, 1–15, DOI:10.1016/j.chroma.2013.04.053.
- A. Mostafa, H. Shaaban, A. M Alqarni, M. Alghamdi, S. Alsultan, J. S. Al-Saeed and R. Ahmad, Vortex-assisted dispersive liquid–liquid microextraction using thymol based natural deep eutectic solvent for trace analysis of sulfonamides in water samples: Assessment of the greenness profile using AGREE metric, GAPI and analytical eco-scale, Microchem. J., 2022, 183, 107976, DOI:10.1016/j.microc.2022.107976.
- M. A. Martins, E. A. Crespo, P. V. Pontes, L. P. Silva, M. Bülow, G. J. Maximo and J. A. Coutinho, Tunable hydrophobic eutectic solvents based on terpenes and monocarboxylic acids, ACS Sustainable Chem. Eng., 2018, 6, 8836–8846, DOI:10.1021/acssuschemeng.8b01203.
- K. K. Singhal, M. D. Mukim, C. K. Dubey and J. C. Nagar, An Updated Review on Pharmacology and Toxicities Related to Chloramphenicol, Asian J. Pharm. Res. Dev., 2020, 8, 104–109, DOI:10.22270/ajprd.v8i4.671.
- A. Kumar, J. P. S. Gill, J. S. Bedi, P. K. Chhuneja and A. Kumar, Determination of antibiotic residues in Indian honeys and assessment of potential risks to consumers, J. Apic. Res., 2020, 59, 25–34, DOI:10.1080/00218839.2019.1677000.
- S. Johnson, N. Jadon, H. B. Mathur and H. C. Agarwal, Antibiotic residues in honey, 2010, Report September, http://cdn.cseindia.org/attachments/0.77984800_1499508807_Antiboitics_Honey.pdf Search PubMed.
- H. T. Rønning, K. Einarsen and T. N. Asp, Determination of chloramphenicol residues in meat, seafood, egg, honey, milk, plasma and urine with liquid chromatography–tandem mass spectrometry, and the validation of the method based on 2002/657/EC, J. Chromatogr. A, 2006, 1118, 226–233, DOI:10.1016/j.chroma.2006.03.099.
- C. Douny, J. Widart, E. De Pauw, G. Maghuin-Rogister and M. L. Scippo, Determination of chloramphenicol in honey, shrimp, and poultry meat with liquid chromatography–mass spectrometry: validation of the method according to Commission Decision 2002/657/EC, Food Anal. Methods, 2013, 6, 1458–1465, DOI:10.1007/s12161-013-9596-6.
- S. Rizzo, M. Russo, M. Labra, L. Campone and L. Rastrelli, Determination of chloramphenicol in honey using salting-out assisted liquid-liquid extraction coupled with liquid chromatography-tandem mass spectrometry and validation according to 2002/657 European Commission Decision, Molecules, 2020, 25, 3481, DOI:10.3390/molecules25153481.
- J. Han, Y. Wang, C. L. Yu, Y. S. Yan and X. Q. Xie, Extraction and determination of chloramphenicol in feed water, milk, and honey samples using an ionic liquid/sodium citrate aqueous two-phase system coupled with high-performance liquid chromatography, Anal. Bioanal. Chem., 2011, 399, 1295–1304, DOI:10.1007/s00216-010-4376-2.
- A. F. Forti, G. Campana, A. Simonella, M. Multari and G. Scortichini, Determination of chloramphenicol in honey by liquid chromatography–tandem mass spectrometry, Anal. Chim. Acta, 2005, 529, 257–263, DOI:10.1016/j.aca.2004.10.059.
- C. Tu, Y. Guo, Y. Dai, W. Wei, W. Wang, L. Wu and A. Wang, Determination of chloramphenicol in honey and milk by HPLC coupled with aptamer-functionalized Fe3O4/graphene oxide magnetic solid-phase extraction, J. Food Sci., 2019, 84, 3624–3633, DOI:10.1111/1750-3841.14955.
- C. Pan, H. Zhang, S. Chen, Y. Xu and S. Jiang, Determination of chloramphenicol residues in honey by monolithic column liquid chromatography-mass spectrometry after use of quechers clean-up, Acta Pharm., 2006, 17, 320 CAS.
- H. Chen, J. Ying, H. Chen, J. Huang and L. Liao, LC determination of chloramphenicol in honey using dispersive liquid–liquid microextraction, Chromatographia, 2008, 68, 629–634, DOI:10.1365/s10337-008-0753-9.
- L. Campone, R. Celano, A. L. Piccinelli, I. Pagano, N. Cicero, R. Di Sanzo and L. Rastrelli, Ultrasound assisted dispersive liquid-liquid microextraction for fast and accurate analysis of chloramphenicol in honey, Int. Food Res. J., 2019, 115, 572–579, DOI:10.1016/j.foodres.2018.09.006.
- A. Gałuszka, Z. M. Migaszewski, P. Konieczka and J. Namieśnik, Analytical Eco-Scale for assessing the greenness of analytical procedures, TrAC, Trends Anal. Chem., 2012, 37, 61–72, DOI:10.1016/j.trac.2012.03.013.
- J. Płotka-Wasylka, A new tool for the evaluation of the analytical procedure: Green Analytical Procedure Index, Talanta, 2018, 181, 204–209, DOI:10.1016/j.talanta.2018.01.013.
- F. Pena-Pereira, W. Wojnowski and M. Tobiszewski, AGREE—Analytical GREEnness metric approach and software, Anal. Chem., 2020, 92, 10076–10082, DOI:10.1021/acs.analchem.0c01887.
- B. D. Ribeiro, C. Florindo, L. C. Iff, M. A. Coelho and I. M. Marrucho, Menthol-based eutectic mixtures: hydrophobic low viscosity solvents, ACS Sustainable Chem. Eng., 2015, 3, 2469–2477, DOI:10.1021/acssuschemeng.5b00532.
- S. Fekete, I. Kohler, S. Rudaz and D. Guillarme, Importance of instrumentation for fast liquid chromatography in pharmaceutical analysis, J. Pharm. Biomed. Anal., 2014, 87, 105–119, DOI:10.1016/j.jpba.2013.03.012.
- C. Capello, U. Fischer and K. Hungerbühler, What is a green solvent? A comprehensive framework for the environmental assessment of solvents, Green Chem., 2007, 9, 927–934, 10.1039/B617536H.
- H. Shaaban, The ecological impact of liquid chromatographic methods reported for bioanalysis of COVID-19 drug, hydroxychloroquine: Insights on greenness assessment, Microchem. J., 2022, 108145, DOI:10.1016/j.microc.2022.108145.
| This journal is © The Royal Society of Chemistry 2023 |

